
Abstract
Developing data-driven local solutions to address rising health care costs requires valid and reliable local data. Traditionally, local public health agencies have relied on birth, death, and specific disease registry data to guide health care planning, but these data sets provide neither health information across the lifespan nor information on local health care utilization patterns and costs. Insurance claims data collected by local hospitals for administrative purposes can be used to create valuable population health data sets. The Camden Coalition of Healthcare Providers partnered with the 3 health systems providing emergency and inpatient care within Camden, New Jersey, to create a local population all-payer hospital claims data set. The combined claims data provide unique insights into the health status, health care utilization patterns, and hospital costs on the population level. The cross-systems data set allows for a better understanding of the impact of high utilizers on a community-level health care system. This article presents an introduction to the methods used to develop Camden's hospital claims data set, as well as results showing the population health insights obtained from this unique data set. (Population Health Management 2013;16:S-20–S-25)
Birth outcome surveillance data, such as prevalence of preterm births, have been available through birth certificate registry data sets. These data sets are compiled from birth certificate forms that states require hospitals to complete and send to state health departments. State health departments process the data, creating local population data sets for city and county health departments. Death certificate data are compiled via a similar procedure. 1,2 Birth and death data sets allow for local surveillance information about what conditions residents are born with and die from, but do not provide information about the health of a population between birth and death.
Disease reporting systems are another potential source of public health data. States and/or local public health departments mandate that doctors and hospitals report certain diagnoses, which are monitored at the population level by health departments. 3 Although these systems provide valuable information, they lack data on chronic health conditions, health care utilization, and health care costs.
This surveillance gap can be filled with hospital administrative claims data. Hospital administrative claims data are electronic data records typically generated at the time of hospital discharge or provision of other hospital service such as emergency room care. Claims data typically contain the following data elements: patient information, date of service, provider specialty, place of service, medical procedure code, multiple International Classification of Diseases, Ninth Revision diagnosis codes, and charges and receipts associated with the claim. Claims data are organized such that each patient has 1 claim, with multiple charges, for each hospital stay. Each charge details a particular service provided during the stay. These multiple charges can be aggregated per patient per stay to derive total hospitalization charges and receipts, length of stay, and diagnosis codes relevant to hospitalization. Although claims data once were viewed as lacking the necessary validity and reliability for research, their use is now supported by the National Institutes of Health 4 and the Agency for Healthcare Research and Quality. 5
Traditionally, hospital claims data have been used to study a specific research question but not to monitor the health of a population. A systematic review of health care studies published in 5 health care journals between 2000 and 2005 found 168 studies that utilized claims data. 6 Of these studies, 27% used claims data to establish estimates of the cost of various health care items, 50% used claims data to determine whether specific treatments or procedures had been provided to patients, 15% employed claims data to determine their validity for measuring various conditions, and 8% used claims data solely to select a sample. However, these traditional uses of claims data do not attempt to quantify the health of the population and, therefore, rely only on access to the data from 1 particular hospital or health care system.
When claims data are used to help provide surveillance of health care utilization patterns, simply pooling all hospital claims data for analysis is not sufficient. Because individuals receive inpatient and emergency care from multiple hospitals, it is necessary to link claims data from different hospitals at an individual level. Linking patient data across health systems requires that hospitals provide unique patient information (ie, name, date of birth, social security number) to be used to in a probabilistic matching process. 7,8
Backed by legislation mandating cost analysis and comparisons, several states have initiated all-payer claims databases (APCDs). 9 As of 2011, 11 states had initiated all-payer claims databases with several more considering further legislation. The legislation in most states guarantees participation by all payers and providers. 10 State-level APCDs are aggregates of all payers and providers in a single state and it is often impossible to disaggregate these numbers to an individual health provider area or market. Although state-level claims databases provide a multitude of insights into health care delivery, its cost and provision, they do so at the aggregate level. Local hospital claims databases provide a better understanding of the interaction between payers and providers and how specific program interventions affect the health care landscape in a particular area or community.
When the Camden Coalition of Healthcare Providers (Coalition) set out to better understand high-cost patients in Camden, New Jersey in 2002, it was faced with a lack of local data needed to quantify the problem. To move forward, the Coalition faced a choice: design programs based on anecdotal evidence or work to develop a local data infrastructure to help understand its local health care environments. The Coalition chose to build an innovative data collection system using hospital claims data provided by the 3 different hospital systems located in the City of Camden. This article discusses how the Coalition built a longitudinal, all-payer, community-based claims data system and provides examples of analytic results derived from the data set.
Methods
The first step in creating the Camden claims data set was defining the population as all residents of Camden, New Jersey. Claims data from the 3 hospital systems providing services within the City of Camden were identified as the hospital claims data sets that, when combined, would come close to capturing the Camden population health care utilization. Although Camden residents could receive hospital care at facilities outside of the City, it was determined that the majority of hospital visits for Camden residents occur at these 3 hospitals.
After identifying which hospitals to include, a plan for creation of the all-payer database was presented to each hospital. The plan included the data reporting and security protocols and the vision for this system to serve as a longitudinal resource. After the hospitals agreed, formal agreements were signed with each. Two potential routes were available: Data Use Agreements, which enable the data to be used for quality assurance and process improvement purposes, and Institutional Review Board (IRB) applications, which allow the data to be used for research purposes also. Understanding the potential for the data to be used for population health research, the Coalition opted to submit IRB studies at each of the 3 hospitals, identifying staff at each hospital to serve as principal investigators.
The biggest risk to database studies is disclosure of Protected Health Information, making it essential that the data are stored in a secure environment. Although complex data infrastructures can be prohibitively expensive for smaller organizations, the Coalition developed a simple, affordable approach that has been audited by one hospital's information technology department and deemed sufficient. All raw data are transferred through secure, encrypted e-mails and uploaded onto 2 encrypted hard drives that mirror one another. The hard drives are stored in a fireproof safe, bolted to a wall behind 3 locked doors. The data contained on the hard drives are analyzed only on a secure computer that is not routinely connected to the Internet.
Once IRB approval was obtained from each hospital, the Coalition began receiving annual detailed reports of episode-level claims from each institution for patients seen in each hospital who had an address within 1 of Camden's 4 zip codes. This geographic filtering process ensured that the database represented Camden residents and not all patients receiving care in Camden hospital facilities. Information collected included name, address, date of birth, patient demographics, admit and discharge dates, diagnosis codes, insurance status, and charges and receipts for every visit by a Camden resident or homeless person. To date, the Coalition has received data covering the period from January 2002 through December 2011. The names and formats of the data fields were not the same for all hospitals and sometimes changed from year to year.
The data were extensively processed using Visual Basic coding to remove inconsistencies. Automating the cleanup and standardization processes ensures a consistent standardization process when handling additional years of data. The full patient names provided in different formats by each hospital were parsed into their components: first, middle, last, and suffix (eg, Jr.). “Generic” names, like “male newborn” and “John Doe” were removed to avoid falsely matching them with one another.
The addresses were matched to an online database of Camden addresses using ArcGIS mapping software (Esri, Redlands, CA). The unmatched addresses in multiple formats were parsed to obtain the house number, street name, type (eg, St., Ave.), and “prefix” (North, South, East, West). A local cross-reference dictionary was created manually from the data to enable correction of spelling errors. For example, 4 streets in Camden had over 50 unique spellings each, often beyond the capabilities of ArcGIS to identify correctly. The “cleaned addresses” were then matched where possible as already described. Specific buildings often were referred to by their names (with multiple variations) and a master table of all rehabilitation and nursing homes, high-rises, and apartment complexes enabled expansion beyond the geocoding capabilities of ArcGIS. Once correctly geocoded, each record was assigned latitude and longitude coordinates and matched to all relevant Census geographies (eg, block, block group, tract).
All of the available identifiers (ie, patient name components, birth date, address, hospital identifications [IDs]) were uploaded into probabilistic matching software (ie, LinkageWiz version 5.1, Payneham, Australia) to make the best estimate of which records represented the same people, even without benefit of an exact match. The threshold for a match was set high so as to not falsely match different individuals as being the same person. After experimenting with modified weighting schemes, the default weights were used for variables with 1 exception: positive and negative weights were chosen for matching/not matching on hospital IDs because there were IDs from 3 hospitals. A process was created to identify twins with similar first names who may have been misidentified by LinkageWiz as a single person.
After an individual's records were linked across data sets, the process of flagging individuals as “high utilizers” began. Instead of using charges or receipts to define high utilizers, the decision was made to rely on the number of emergency department (ED) and inpatient visits made by an individual over the prior 12-month period. This step eliminated potential variability related to differences in treatments and payers. Rather than assigning an artificial cutoff, the nuances of the local population were allowed to set the threshold for what constituted high utilization. The Coalition defined high utilization as “any individual with total emergency or inpatient visits greater than 1.5 standard deviations above the mean.” This definition resulted in any individual with 3 or more inpatient visits, or 6 or more ED visits, being flagged in the database as a high utilizer.
The patient-linked, longitudinal nature of the data set allows for multiple ways to explore health issues and utilization patterns in the community. Aggregate data for the most recent year provides a snapshot of the current health status of the community (eg, the number of ED visits in 2011). Year by year aggregate data shows community health trends (eg, the number of ED visits each year from 2002 to 2011). Patient-level data for a particular year permits an assessment of per patient utilization patterns across the population (eg, the number of high utilizer patients in 2011), and patient-level data presented longitudinally facilitates greater understanding of patient-level trends (eg, how many high utilizers during one year are high utilizers the next year). The following analytic results are typical of those made possible by having a longitudinal, community-wide, all-payer claims data set.
Results
More than half of all Camden residents received hospital-based services in 2011. Of the $108 million in receipts associated with this hospital-based care, $79 million (73%) was spent on inpatient care and $29 million (27%) was spent on ED care. Total receipts averaged $1400 per resident or $2480 per patient (Table 1).
ED, emergency department.
Figure 1 depicts the distribution of payers for hospital services. The majority of payments (58.1%) came from Medicare and Medicaid. The hospitals were not reimbursed for more than a quarter of all visits (Charity Care).
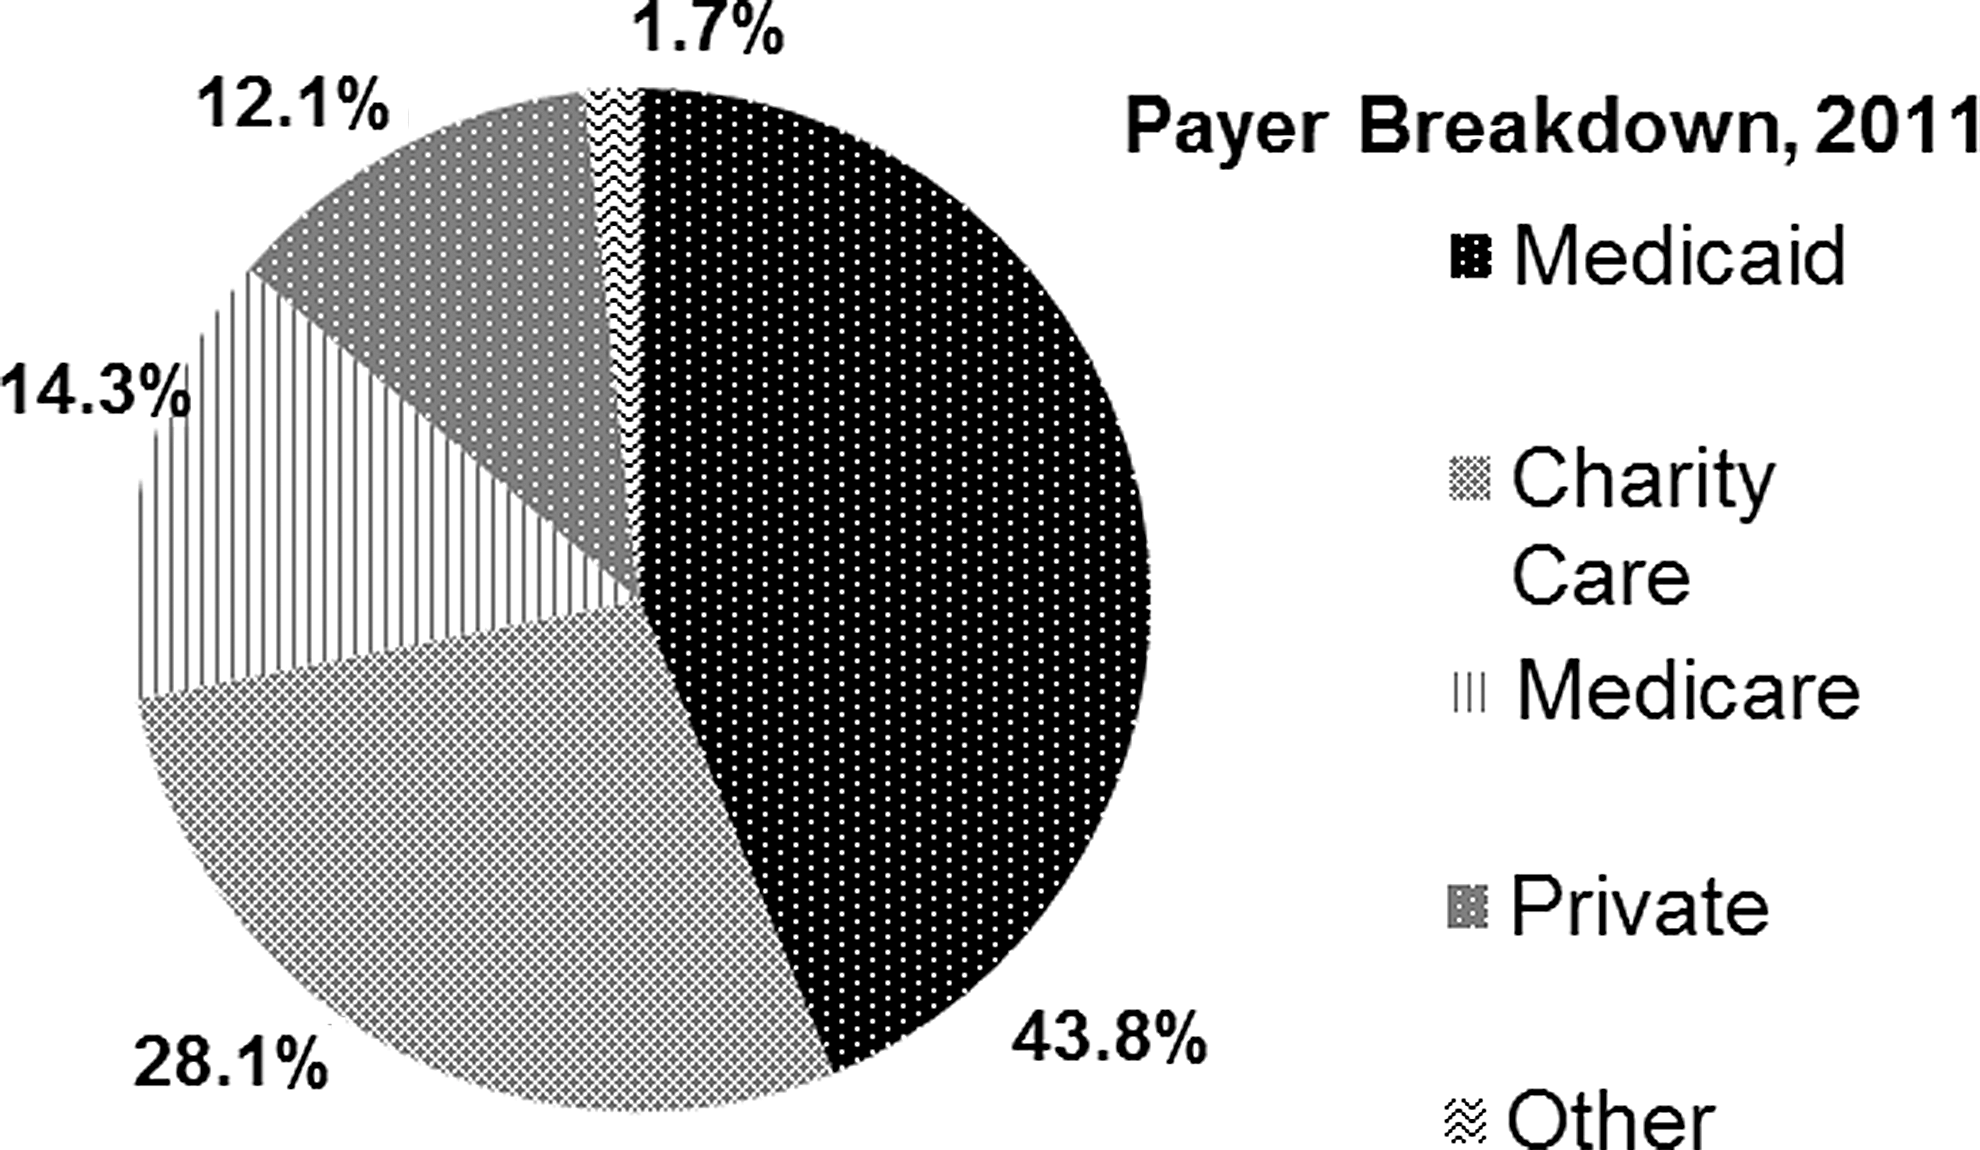
Payers for all emergency and inpatient visits, Camden residents 2011.
Among those with the top 10 most frequent ED visit diagnoses, 8998 patients accrued $22.7 million in charges for conditions that typically are treated and managed more effectively in a primary care setting (ie, upper respiratory infections, urinary tract infection, asthma) (Table 2).
Among those with the top 10 most frequent inpatient diagnosis, 591 patients accrued $37.0 million in charges for asthma and diabetes (Table 3). If properly managed in an outpatient setting, these conditions typically should not result in hospitalization.
From 2002 to 2011, the number of ED visits increased at a faster rate than the number of patients using the ED (Fig. 2). The number of visits per year per patient has risen from 1.8 to 2.2.
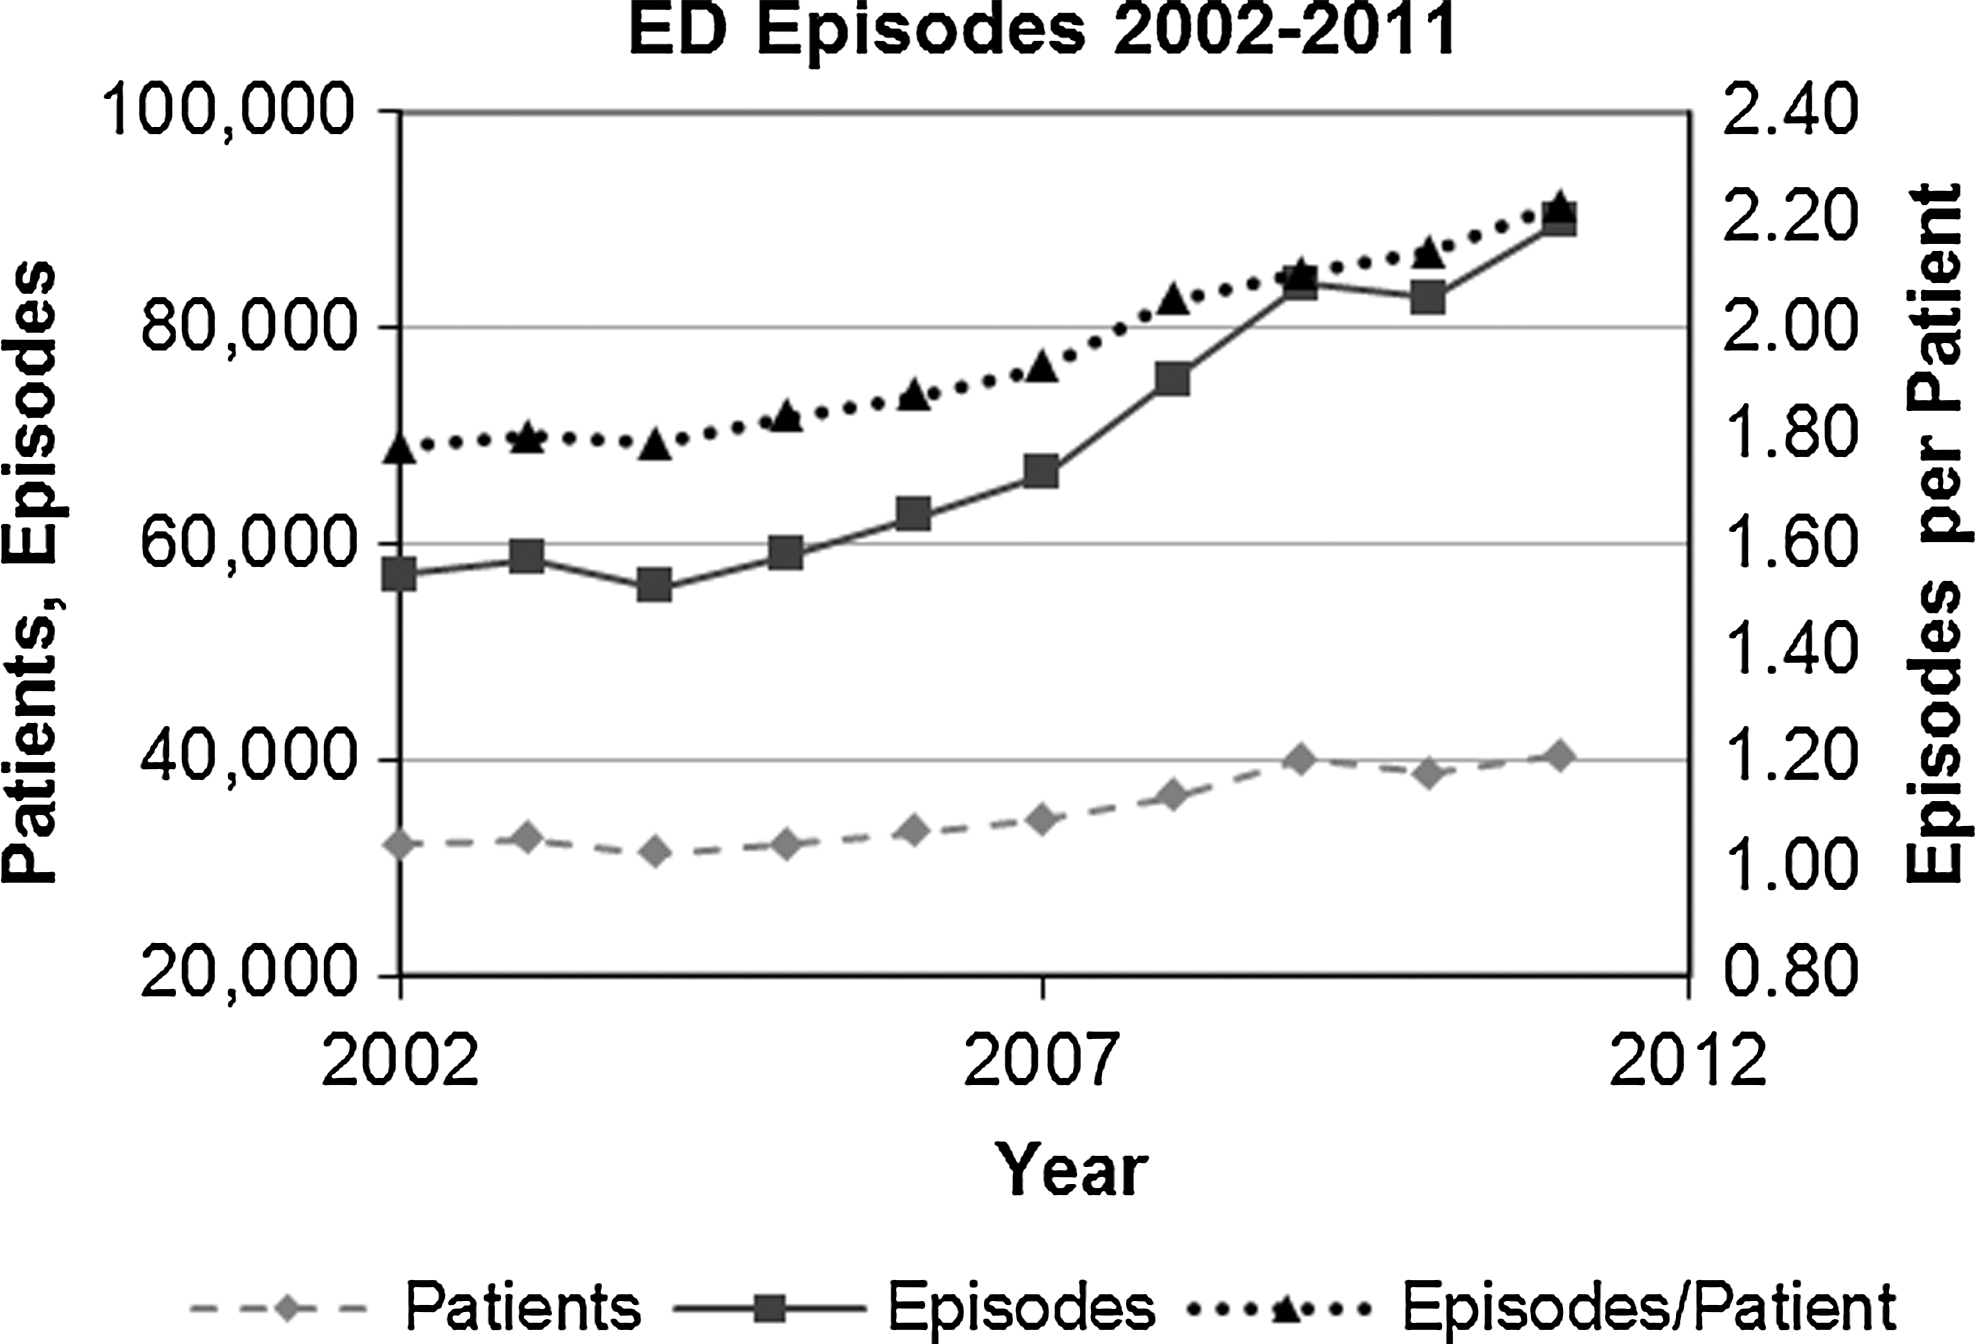
Emergency department (ED) visits for Camden residents, 2002–2011.
The number of admissions in 2011 is about the same as in 2002, although there seems to be a steady decline after peaking in 2007 (Fig. 3).
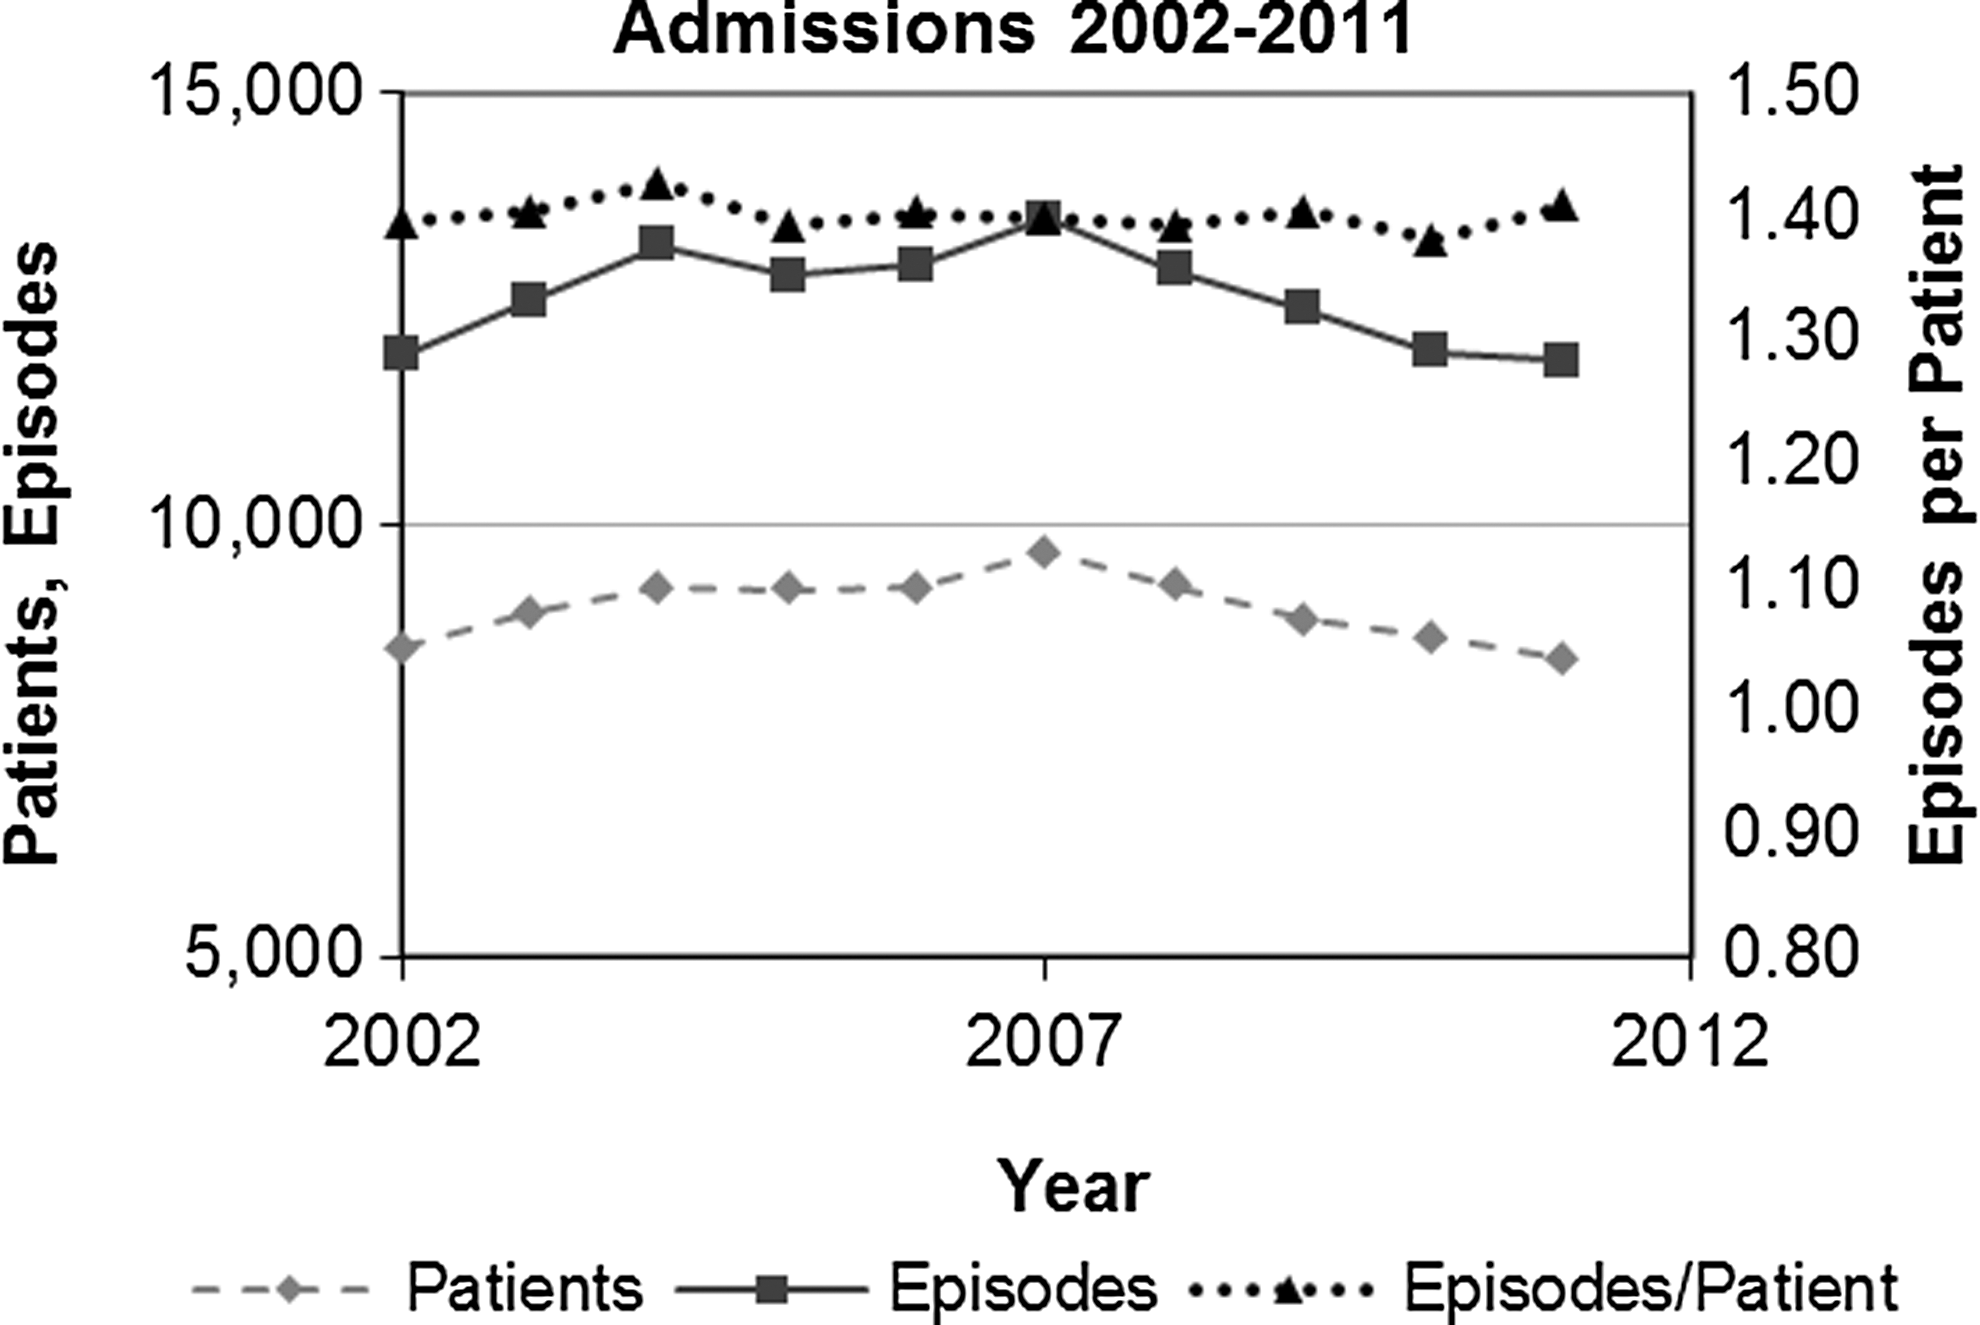
Inpatient visits for Camden residents, 2002–2011.
Overall, females tend to visit the hospital at slightly higher rates than males. Although females account for 51% of the city's population according to 2010 Census data, they accounted for 53.7% of patients in 2011 (data not shown). Additionally, females are more likely than males to be high utilizers (58.8% of high utilizers in 2011). This could be because of labor and delivery-related events, which account for a substantial number of hospital admissions.
By geocoding records at the address level, building “hot spots” emerge in the data. The buildings in Table 4 are the 8 highest health care utilization buildings in the city. The list includes rehab and nursing homes, high-rise apartments, senior housing, and apartment complexes located throughout the city. Additionally, records with “homeless” or “homeless shelter” listed as the address represent a substantial part of hospital usage. Taken together, individuals residing in these 8 hot spots and the homeless population represented $12.5 million in receipts in 2011 (11.5% of total receipts).
Homeless individuals are much more likely to fall under charity care and therefore have deflated receipts. To counteract this tendency, the average collection rates for ED and inpatient care were applied against the total charges for all homeless patients.
ED, emergency department.
Costs are highly concentrated within a small subset of all patients. The most expensive (by charges) 1% of patients account for 29% of all charges. The top 20% of patients account for 84% of all charges (Fig. 4).
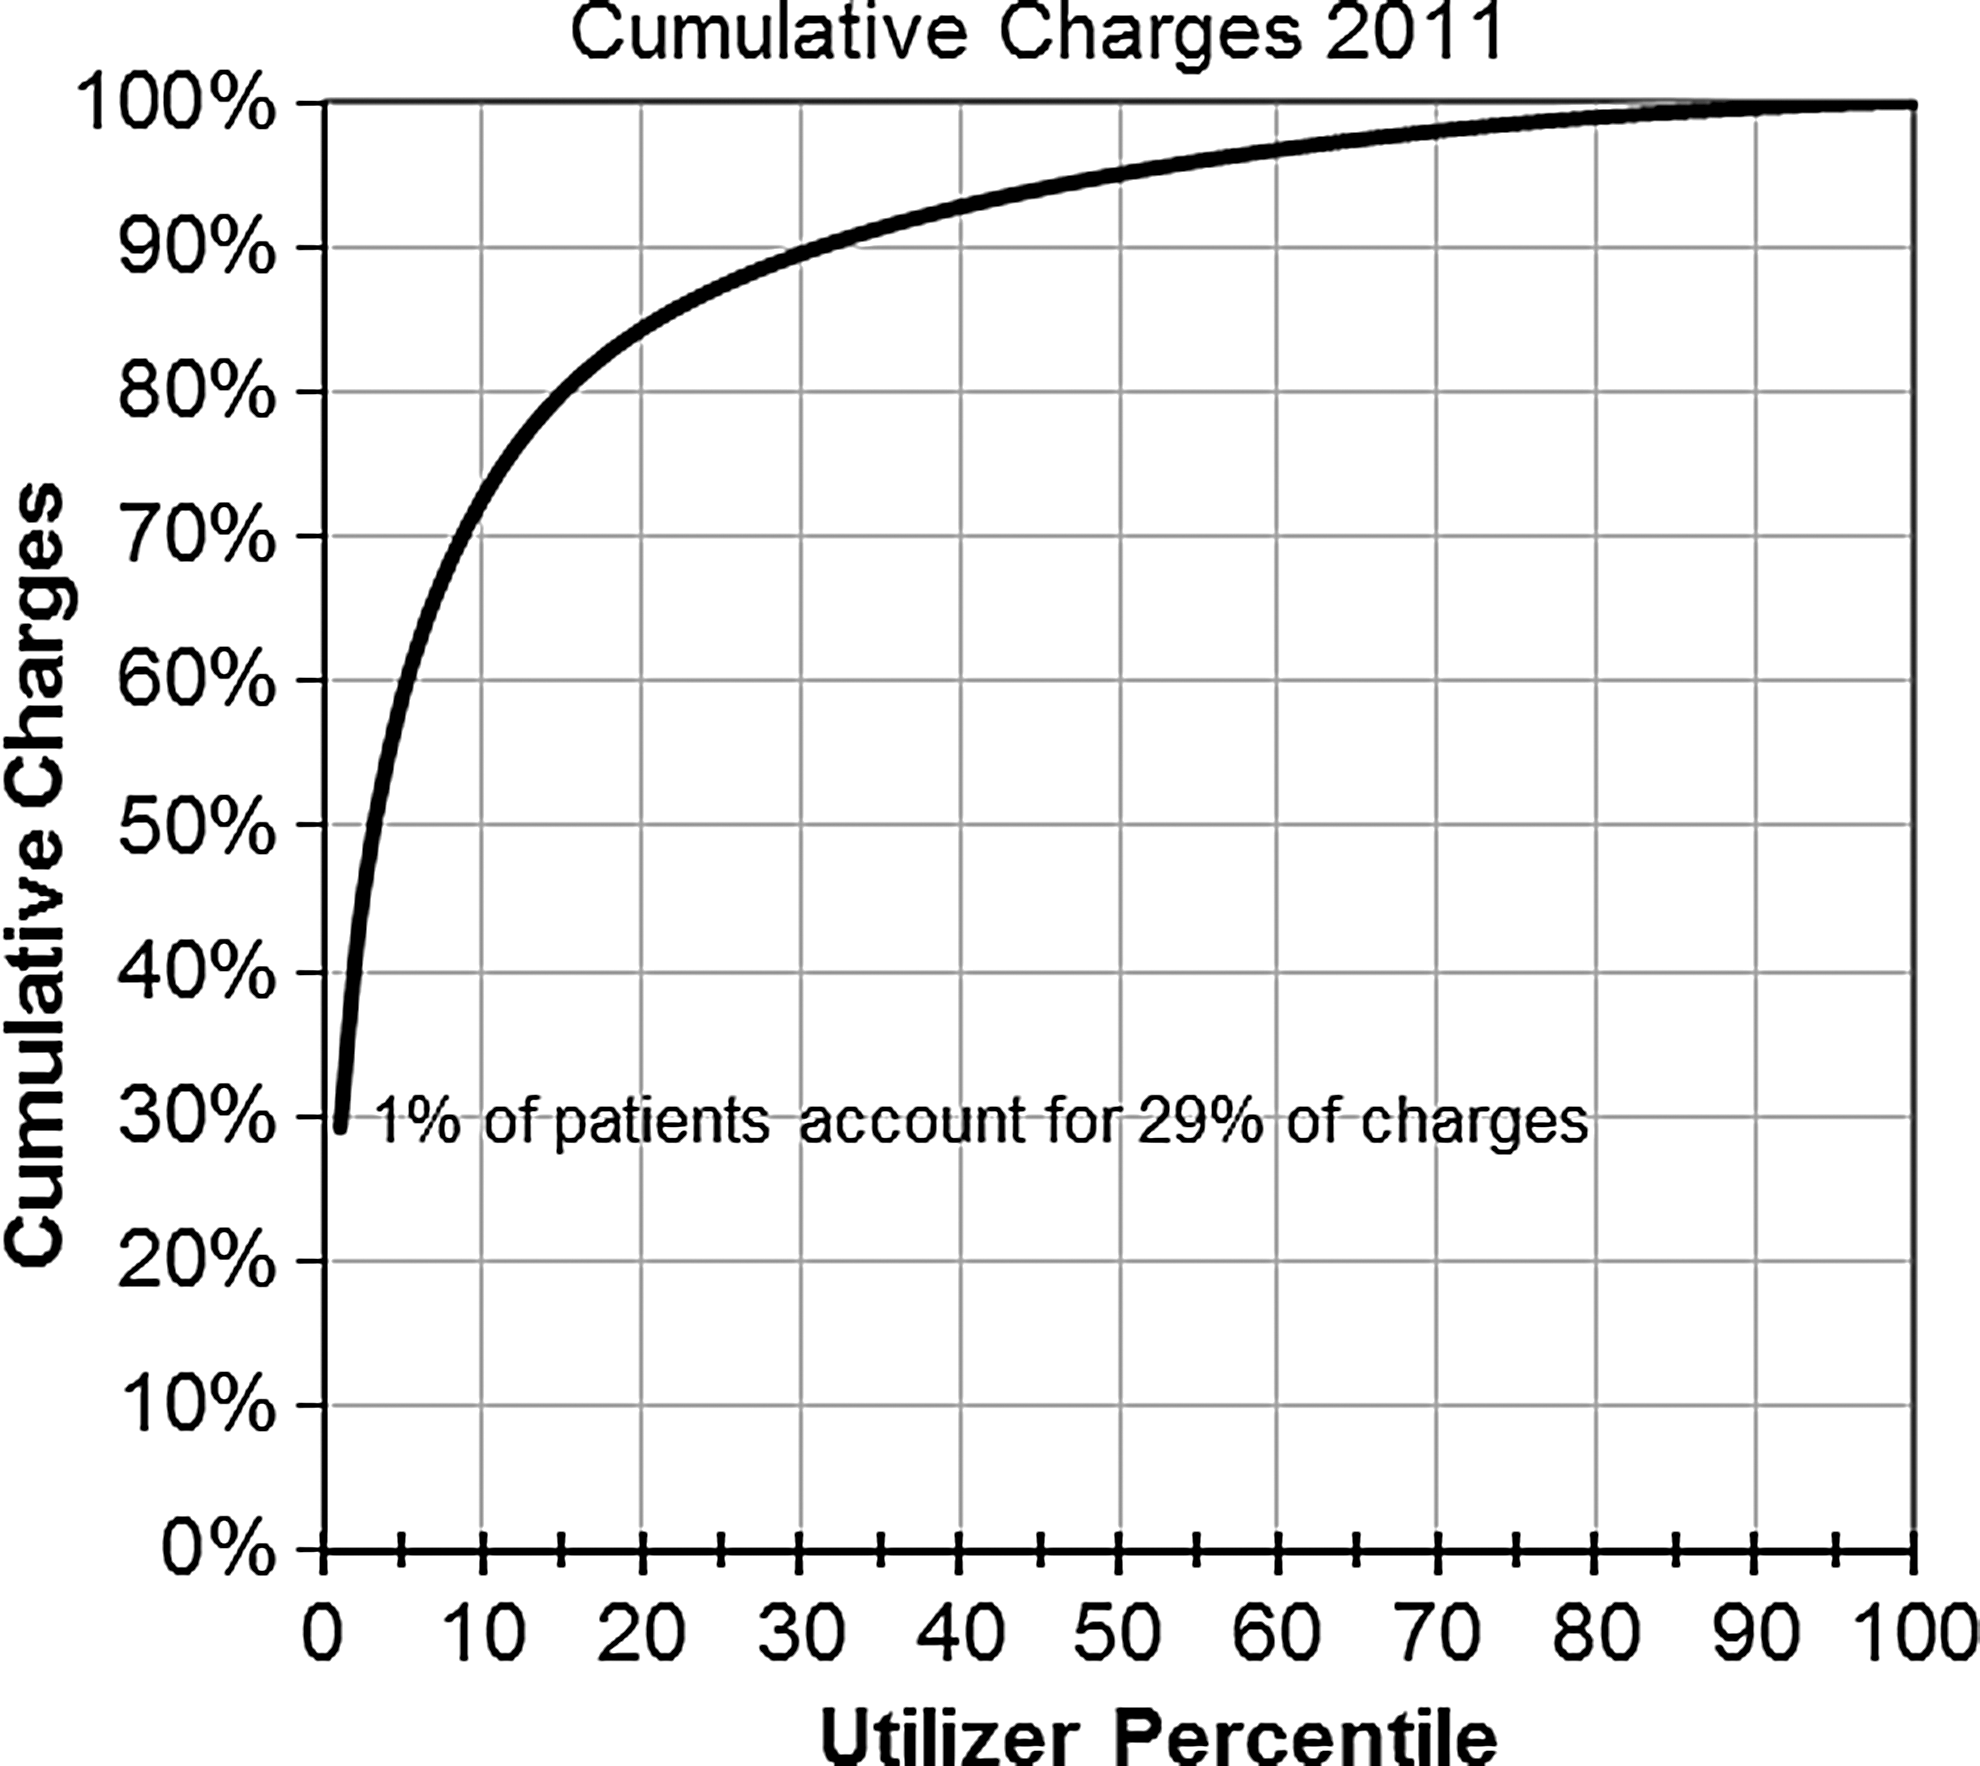
Cumulative charges, 2011.
In 2011, 22.7% of all patients visited more than 1 hospital (19.4% visited 2 hospitals, and 3.3% visited 3 hospitals). Within the high utilizer subgroup, 75.8% of all patients visited 2 or more hospitals, including 26.3% who visited all 3 within a single year (data not shown).
The ability to identify high utilizers is substantially improved by collecting and merging the data for all 3 hospitals. Access to only 1 hospital's data would allow identification of between 563 and 773 high utilizers. Combining the 3 data sets without linking the data would result in 1987 individuals meeting the high utilizer threshold. Because individuals' visits are scattered across institutions, linking individuals' records across institutions leads to an additional 961 individuals meeting the high utilizer threshold (Table 5).
Conclusion
In order to solve problems with our health care system and improve the health of populations, we must first define the problem by assessing its size, scope, and contributing factors. Public health surveillance data have traditionally provided the necessary quantitative information to define and develop solutions to these health problems. These data have been available at the city level, allowing for local understanding and local interventions. The growing public health problems of high health care costs and growth of chronic disease prevalence call for public health surveillance systems that can define these problems. Such a system need not be developed from scratch; claims data are being collected by hospitals already and, when imported into a defined data processing and analytic framework, can be used to feed such a system. This process has already been carried out at the federal and state level and claims data sets at these levels are available for analysis. Because the state and federal data cannot be segmented by smaller geographic areas, cities have been left out of this process.
In partnership with Camden's 3 hospital systems, the Coalition developed a local all-payer hospital claims data set. This required developing partnerships, drafting legal agreements, cleaning disparate data sets, and linking and analyzing data—all of which take valuable time and resources.
The Camden efforts show that it is possible to create such a system and maintain it over time. The results provide unique insights into hospital utilization patterns, costs of hospital-based care, and a definition of the problem of high utilizer patients. For the Coalition, access to these data and presenting the resulting analyses to key stakeholders has been a crucial first step in establishing policies and implementing programs that address the health needs of the community.
Such data systems could be replicated to benefit communities across the country. To facilitate the initiation of these systems, 2 barriers must be addressed: 1. Reluctance of hospitals to participate and share their data. Ways in which hospitals can be mandated or incentivized to participate should be explored. 2. Lack of data processing and analytic capacity in many community organizations or public health departments. Training and tools can help lower the barrier to entry for many of these communities.
Footnotes
Author Disclosure Statement
Drs. Gross, Brenner, and Post and Mr. Truchil, and Ms. Riley declared no conflicts of interest with respect to the research, authorship, and/or publication of this article.