
Abstract
Escalating health care expenditures highlight the need to identify modifiable predictors of short-term utilization and cost. Thus, the predictive value of individual well-being scores was explored with respect to 1-year health care expenditures and hospital utilization among 2245 employees and members of a health plan who completed the Well-Being Assessment (WBA). The relationship between well-being scores and hospital admissions, emergency room (ER) visits, and medical and prescription expenditures 12-months post WBA was evaluated using multivariate statistical models controlling for participant characteristics and prior cost and utilization. An inverse relationship existed between well-being scores and all measured outcomes (P≤0.01). For every point increase in well-being on a 100-point scale, respondents were 2.2% less likely to have an admission, 1.7% less likely to have an ER visit, and 1.0% less likely to incur any health care costs. Among those who did incur cost, each point increase in well-being was associated with 1% less cost, and individuals with low well-being scores (≤50) had 2.7 times the median annual expenditure of individuals with high well-being (>75) ($5172 and $1885, respectively). Also, well-being proved lowest among respondents who incurred more than $20,000, and was highest among those who incurred ≤$5000, with median scores of 71.1 and 80.3, respectively. These results indicate that individual well-being is a strong predictor of important near-term health care outcomes. Thus, well-being improvement efforts represent a promising approach to decrease future health care utilization and expenditures. (Population Health Management 2012;15:325–330)
Introduction
Specific assessment tools, such as health risk assessments, have been used to identify factors (ie, unhealthy behaviors) that may contribute to the proliferation of chronic disease and escalating health care utilization and expenditures. Although known to incur significant health care costs, 3 –5 individuals with chronic disease(s) also have been shown to have poorer well-being. 7 –10 However, less is known about whether well-being may be a holistic measure that also can serve as a predictor of health care expenditure across entire populations. Support for this idea is provided by research that has demonstrated that several outcomes related to the utilization and financial burden of health care correlate with specific measures that likely contribute to an individual's overall well-being. For example, independent studies have found that utilization is elevated in those who perceive their health as poor 11,12 ; obese patients and those with type 2 diabetes generally have poorer psychological well-being. 7,13 –15
Contemporary definitions of well-being can be differentiated into 2 broad categories: (1) objective measures of income, life expectancy, GDP, and poverty rates; and (2) subjective measures of a person's perception of his or her life. 16 Subjective well-being can be divided further into 2 areas: evaluative and experienced well-being. 17,18 Evaluative well-being assesses emotions associated with past events, whereas experienced well-being assesses emotions associated with events that are currently occurring. 17,18
Traditionally, well-being research, including those studies cited, has focused on a specific aspect of well-being as opposed to a measure of well-being that integrates all well-being concepts. For example, multiple studies have quantified well-being in a given population and evaluated how well-being correlates with a defined outcome using the Quality of Well-Being (QWB) scale, which takes into account mobility, physical and social activity, mental health, and symptom status. In these studies, the QWB scale has been shown to be directly related to the severity of chronic obstructive pulmonary disease, arthritis, AIDS, and cystic fibrosis as measured by different methods. 9,10,19,20 However, this mode of measurement only includes questions pertaining to objective well-being and does not include subjective components of well-being.
Another study conducted in Sweden by Al-Windi et al stratified patients based on their physical, social, and mental well-being, using a combination of the Götenborg Quality of Life Instrument 21 and a “Complaint Score” that evaluates the patient's perception of well-being. 22 Patients with low perceived health scores, a variable in their well-being score, had a greater number of appointments with a physician and higher costs for health care, and the authors hypothesized that health care utilization, in particular outpatient care, is related to the patient's perception of well-being. 22 However, the Al Windi et al study only analyzed health care utilization in the year prior to the questionnaire, and therefore no conclusions can be drawn regarding the predictive value of well-being scores on future outcomes.
In the present study, a global measure of well-being was evaluated in relation to short-term health care utilization and expenditures to determine whether this measure of well-being also may serve as a bona fide indicator of these health care measures. Overall well-being was measured using the Well-Being Assessment (WBA) that encompasses evaluative and experienced well-being as well as life evaluation 16,23 to provide a comprehensive and quantifiable measure of individual well-being. The results described herein show the relationships between well-being and health care utilization and expenditures and demonstrate that well-being may serve as a predictor of these outcomes.
Methods
Well-Being Assessment and Individual Well-Being Score
The WBA was administered telephonically by Gallup and was an extension of the Gallup-Healthways Well-Being Index (WBI), 16 a survey developed to assess the longitudinal well-being of populations at the community level.
Using WBI items and domains, an Individual Well-Being Score (IWBS) was developed so that well-being, the specific focus of this study, could be calculated at the individual level, thus making it suitable for statistical testing purposes. The IWBS was calculated using 40 questions from the following 6 domains of well-being that are included in the WBI and WBA: physical health, emotional health, healthy behaviors, work environment, basic access, and life evaluation. The questions used in the calculation of the IWBS were derived from reports by Diener (subjective well-being), Kahneman (evaluative vs. experienced well-being), and Cantril (life evaluation). 17,18,23 Each domain was weighted equally in the calculation of the IWBS, as they are in the WBI, and scores, ranged from zero to 100 for each respondent (J. Prochaska, K. Evers, P. Castle, et al, unpublished data, 2011).
Study cohort and outcomes
A sample of employees and general membership from a large commercial health plan was selected at random to complete the WBA telephonically between July 28 and August 17, 2008. The survey response rate, which was defined as the product of the contact, cooperation, and completion rates, was 29%. The 2245 respondents comprised the cohort, which was 64.7% female and had a median age of 48.9 years. This study was not submitted to an institutional review board (IRB) because only existing, de-identified data were used for this analysis in alignment with IRB exclusion criteria outlined in the Code of Federal Regulations. 24
The primary health care outcomes assessed in this study were hospital utilization and health care expenditure. Hospital utilization outcomes included hospital admissions and emergency room (ER) visits; expenditure variables included prescription costs (identified by claims with National Drug Codes), medical costs (all other claims), and total costs (prescription and medical). Median costs, rather than mean costs, are reported as descriptive data in the figures in order to provide more accurate representations of central tendency for these highly skewed data. The outcomes were assessed in the 12 months prior to the administration of the WBA (August 11, 2007–August 10, 2008), as well as in the 12 months following the administration of the WBA (August 11, 2008–August 10, 2009), in order to evaluate the ability of the individual well-being scores to predict health care utilization and costs in the year following the administration of the WBA, while controlling for those observed in the year prior to its administration.
Statistical methods
The Pearson chi-square test was used to test for associations between 2 categorical variables. The Wilcoxon rank sum test was used to test for shifts in the location of distributions between 2 groups, while the Kruskal-Wallis test was used to test for shifts between 3 or more independent groups. Multiple logistic regression was used to determine whether the individual WBA score was predictive of utilization in the 12 months following the administration of the WBA, after controlling for covariates including utilization in the previous year, age, sex, and type of respondent (employee of the health plan or general membership). A 2-stage economic model was used to assess whether well-being score was predictive of log cost in the following year; the first stage modeled the probability of incurring any cost vs. none in the post period, and the second stage modeled the probability of log total cost in the post period among those who incurred any cost. Both stages of the model adjusted for cost in the previous year, age, sex, and type of respondent. Retransformation of the log scale estimates was accomplished using exponentiation in order to obtain an estimate of the median cost. All statistical analyses were conducted using SAS Release 9.2 (SAS Institute Inc, Cary, NC).
Results
Well-being and utilization
Individual well-being scores were studied to determine whether they were predictive of health care utilization in the year following the administration of the WBA. Specifically, the hypothesized inverse relationship between well-being scores and utilization was tested. Multiple logistic regression analysis found that respondents with higher well-being scores had fewer hospital admissions and ER visits than those with lower well-being scores (both P<0.001). Furthermore, for every point increase in well-being score, respondents were 2.2% less likely to have at least 1 hospital admission in the year following the administration of the WBA, even after controlling for prior admission status, age, sex, and type of respondent (P<0.001). A similar analysis showed that for every point increase in well-being score, respondents were also 1.7% less likely to have at least 1 ER visit in the following year, even after adjusting for ER visits in the previous year, age, sex, and type of respondent (P<0.001). For illustrative purposes, the percentage of respondents with 1 or more hospital admission or ER visit is shown by well-being score group in Figure 1.
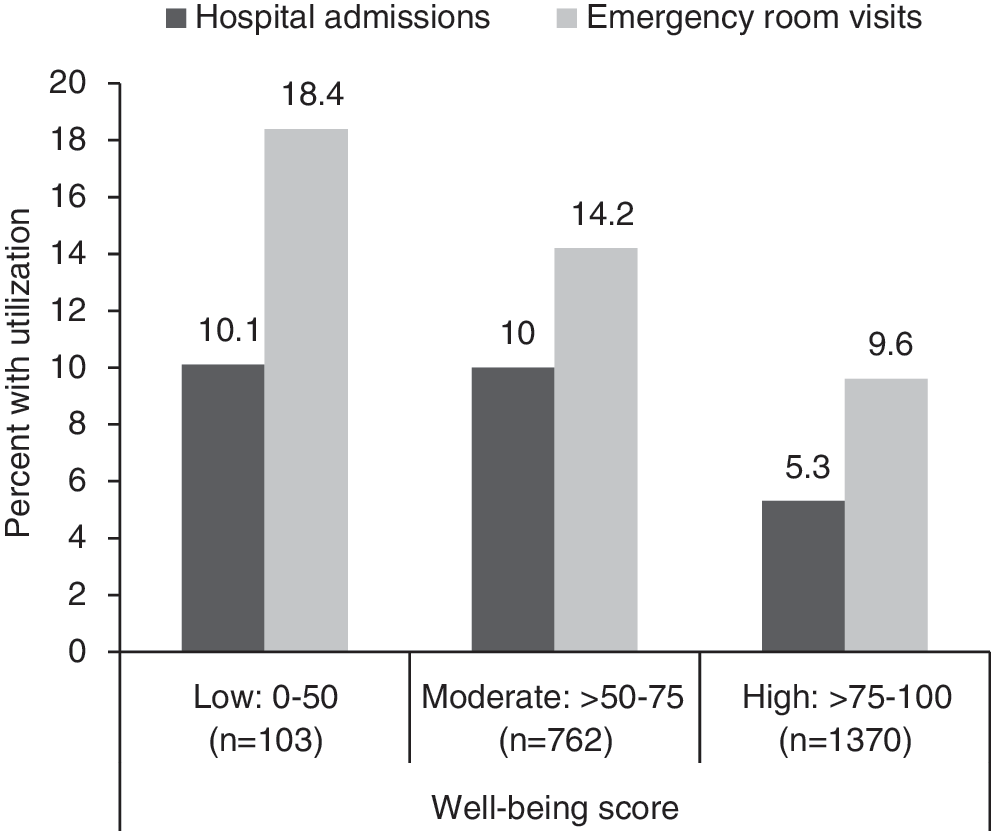
Percentage of respondents with hospital utilization (1 or more admissions or emergency room visits) 12 months following Well-Being Assessment administration by well-being score.
Well-being scores also were studied to determine how scores varied among respondents with differing utilization patterns in the year prior to and the year following the administration of the WBA. Respondents were categorized into the following 4 groups, where “N” indicates no utilization and “Y” indicates utilization: (1) no utilization in the year prior to or the year following the WBA (NN); (2) no utilization in the prior year but utilization in the following year (NY); (3) utilization in the prior year but no utilization in the following year (YN); and (4) utilization in both the prior and following years (YY). Sample sizes and median well-being scores for each of these groups are shown in Table 1, and results of the Kruskal-Wallis test indicated that the distributions of well-being scores differ significantly among these groups with respect to both hospital admissions (P<0.001) and ER visits (P<0.001).
ER, emergency room; WBA, Well-Being Assessment.
Differences in the distributions of well-being scores between groups with specific pre-post utilization patterns were examined. These pairwise comparisons revealed a significant difference between those without utilization in either time period (NN) and those with utilization in either time period (NY, YN) (hospital admissions, P<0.001; ER visits, P<0.001). Significant differences were also observed between those with utilization in either time period (NY, YN) versus those with utilization in both time periods (YY) (hospital admissions, P<0.001; ER visits, P=0.004). Given these results, statistical testing was not necessary between NN and YY.
Utilization also was explored to determine whether patterns of utilization differ among respondents with low (0–50), moderate (>50–75), and high (>75–100) well-being scores (Table 2). The cut points used to categorize well-being scores were selected prior to statistical testing in order to maintain the integrity of the analysis. Initially, 4 equidistant intervals of well-being scores were chosen; however, because of the skewed nature of the data, the 2 lowest intervals were pooled for analysis. Results indicate that respondents with lower well-being scores were more likely than those with higher scores to have hospitalizations (P<0.001) and ER visits (P<0.001) in 1 or both time periods.
ER, emergency room; WBA, Well-Being Assessment.
Data are expressed as row percentages of respondents with utilization and total 100 within each utilization pattern.
Well-being and cost
Based on the relationship between well-being scores and utilization demonstrated in Figure 1 and Tables 1 and 2, well-being scores were studied to determine their ability to predict cost in the year following the administration of the WBA after controlling for cost in the previous period, age, sex, and type of respondent. An inverse relationship was observed between well-being score and likelihood of incurring any expenditures (Fig. 2). The first stage of 3 separate 2-stage economic models showed that respondents with higher well-being scores were less likely to incur any health care cost (P=0.009), any medical cost (P=0.01), or any pharmacy cost (P=0.001) than those with lower well-being scores. This analysis also demonstrated the incremental relationship between well-being and cost; for every point increase in well-being score, respondents were 1% less likely to incur any health care cost, and the same result was found for medical and pharmacy costs separately.
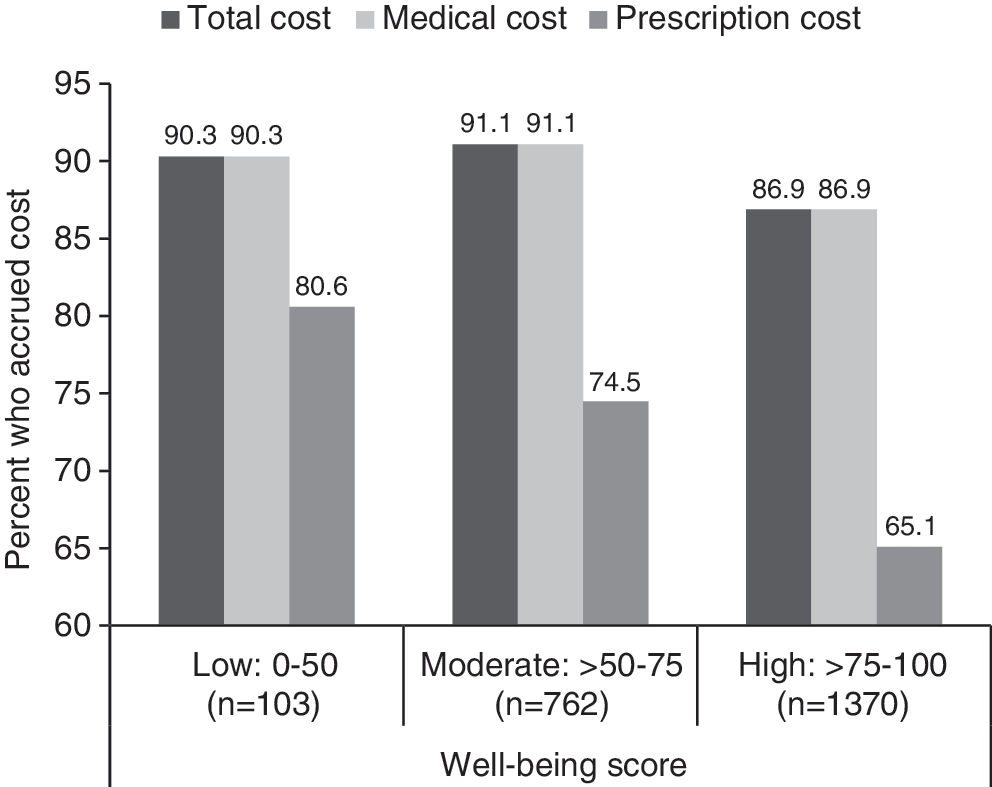
Percentage of respondents with any total, medical, or pharmacy cost 12 months following Well-Being Assessment administration by well-being score.
Among respondents who did incur some health care cost, the second stage of 3 separate 2-stage models showed that those with higher well-being scores were found to have lower total cost (P<0.001), medical cost (P<0.001), and pharmacy cost (P=0.003) than those with lower well-being scores. Specifically, individuals who did accrue costs were found to incur 1% less cost (total, medical, and pharmacy) for every point increase in well-being score. The general relationship between well-being score and health care cost for those who incurred costs is depicted in Figure 3.
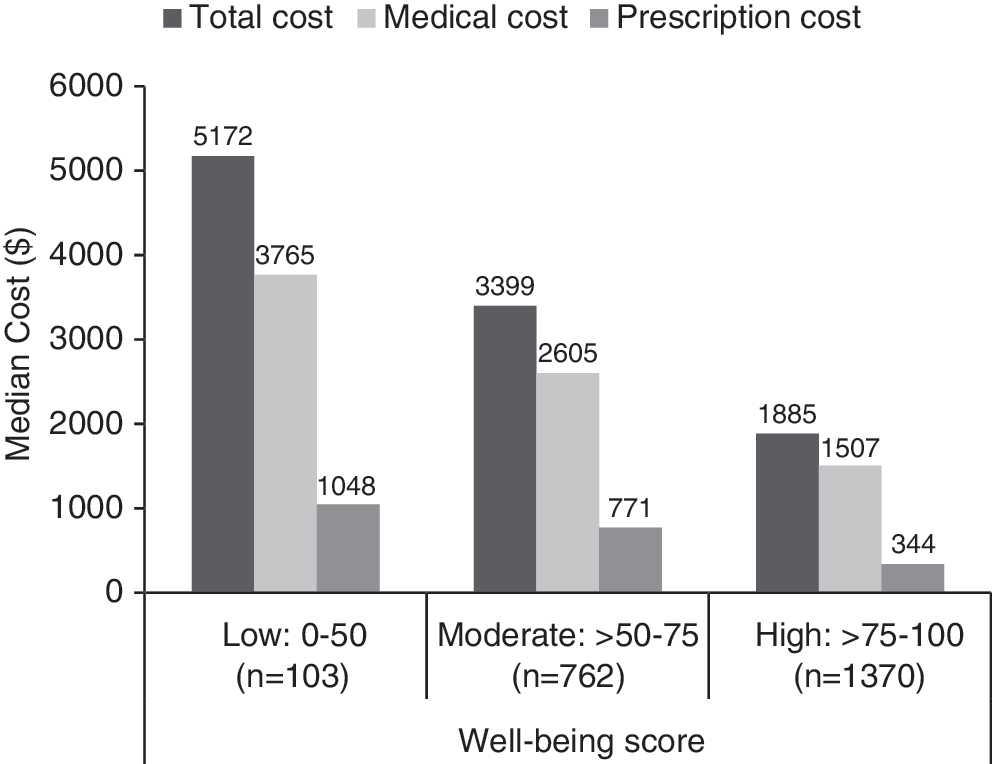
Median total, medical, and pharmacy cost 12 months following Well-Being Assessment administration by well-being score among those who had any cost by type.
Finally, tests were conducted to determine whether differences in well-being scores existed between groups of respondents with varying degrees of total health care cost in the year following the WBA. Kruskal-Wallis test results showed that respondents with higher total cost were found to have significantly lower well-being than those with lower total cost (P<0.001). Median well-being scores by cost group and results of pairwise comparisons cost groups are shown in Figure 4.
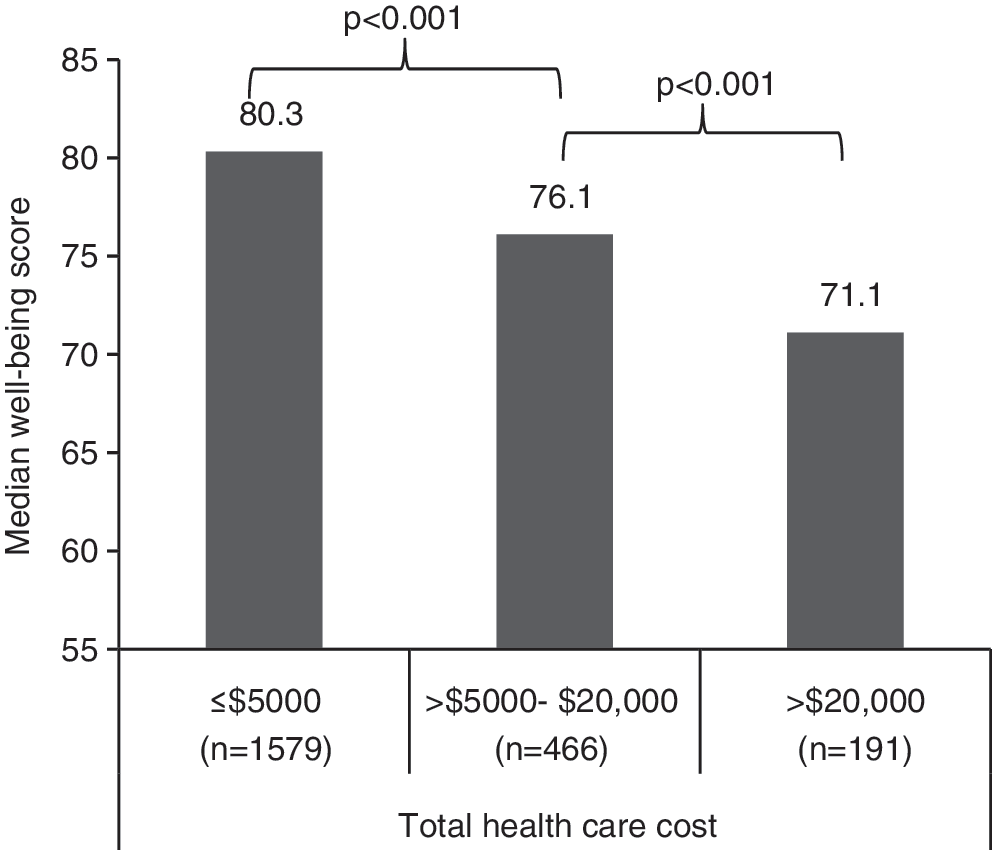
Median well-being score by total cost group.
Discussion
The present study evaluated the relationship between well-being and health care costs and utilization and determined whether well-being is a valuable measure in predicting the future cost and utilization of a population. The well-being scores assigned in this study were compiled using individual responses to the WBA and were derived from the validated Gallup-Healthways WBI approach to assessing community well-being. To our knowledge, this study is the first of its kind to show that a comprehensive measure of well-being is predictive of future health care utilization and expenditures.
In order for well-being scores to be more informative as an outcome metric for health and wellness programs, we must understand the connection between health care costs, the utilization that drives these costs, and well-being scores. This study takes the first step toward identifying the degree to which well-being scores can predict future hospital admissions, ER visits, and medical and prescription costs. The first major finding of this study is that an individual's well-being score is indeed a significant predictor of utilization in the following year. For each point increase in well-being score, respondents were 2% less likely to have a hospital admission and 1.6% less likely to have an ER visit in the following year. This is a particularly strong finding, given that the analysis adjusted for utilization in the time period prior to administration of the WBA, a variable known to be highly correlated with future utilization, as well as other covariates that potentially could be related to differences in utilization. This approach allowed for evaluation of the well-being score as a predictor of outcomes above and beyond the influence of these confounding variables. Next, the relationship between well-being and cost was examined, and the results indicate that lower well-being scores translate to higher total cost, including both medical and prescription costs, after adjusting for other covariates. Furthermore, respondents with extremely high total health care costs (>$20,000) in the year following the WBA were found to have significantly lower well-being scores than those who incurred lower costs.
One particularly interesting result was that the relationship between well-being and health care utilization and costs was independent of age, given that we were able to control for this variable. Though it is documented that health care costs increase with age and the elderly have the highest utilization, 25 a recent study by Stone et al demonstrates that well-being actually increases later in life. 26 This finding was consistent with observations previously made by Blanchflower and Oswald, 27 who originally defined a U-shaped relationship for well-being over time. An analysis of community WBI data extended this research and found that the drivers of overall well-being improvement later in life were healthy behaviors, emotional health, basic access, and work environment, which more than offset the negative impact of poorer physical health and life evaluation in the senior years. 28 Further investigation is necessary to fully understand how the well-being of elderly patients relates to the use of health care resources and how this relationship may vary in different age brackets.
Although the data affirmed our hypothesis that well-being scores are predictive of future health care utilization and expenditures for this population of health plan employees and members, future work should evaluate whether the strength of this relationship is similar in other populations. Also, subsequent studies using data collected during more than 1 WBA assessment period are necessary to better understand the relationship between well-being and these outcomes. A longitudinal study of WBA data collected over multiple years could make it possible to understand how changes in well-being relate to utilization and cost changes over time. Furthermore, future studies that test whether raising one's well-being score decreases utilization and improves overall health should be instrumental to further national health promotion initiatives. 4,29 If this relationship holds true, programs that are informed by WBA survey data and take a more holistic approach to health promotion may prove vital to improving well-being scores, thereby decreasing negative health care outcomes.
Certain limitations should be considered when evaluating the results from this study. First, the study group was intended as a random sample; however, this did not eliminate the potential for selection bias. Advanced statistical techniques were used to bring as much rigor to this study as possible, but further study in different populations will be needed to verify these findings. Additionally, we were limited by having WBA data from only 1 assessment and would like to evaluate data collected in a cohort at multiple and longer time points to confirm well-being scores as a predictor of health care costs and to determine over what time frame this relationship holds.
In addition to the aforementioned topics for future study, WBA data provide a wealth of opportunity to understand the relationship between well-being and health outcomes in greater depth. Although we chose to focus on overall well-being in this study, we intend to focus future research efforts on better understanding how specific elements of well-being are related to outcomes of interest. Also, admissions and ER visits were chosen as the outcomes of interest for this study because these forms of utilization often are the result of avoidable acute events and are primary drivers of health care costs. 2 Future work should evaluate well-being in relation to positive forms of utilization (eg, adherence to standards of care) that might avoid disease onset or progression, and thereby reduce long-term costs.
Conclusions
The results presented in this study demonstrate a strong link between well-being scores, as determined by responses to a WBA, and future health care outcomes. Individuals with lower well-being scores were found to be significantly more likely to have hospital admissions and ER visits, whereas respondents with higher well-being scores demonstrated lower utilization in the 12 months following administration of the WBA. Furthermore, well-being scores demonstrated strong relationships with future costs over and above prior health care expenditure and other relevant covariates. Based on the results of our statistical analyses, we propose that well-being is a viable predictor of future utilization and health care expenditures, and may prove to be a valuable tool to identify individuals or groups that could benefit from programs aimed at improving well-being and to evaluate the effectiveness of such initiatives.
Footnotes
Acknowledgment
The authors thank Kristina W. Thiel, PhD, who provided medical writing services on behalf of Healthways, Inc.
Author Disclosure Statement
Ms. Harrison and Drs. Pope, Coberley, and Rula conducted this study as employees of Healthways, Inc., a provider of population health management services and sponsor of this research. They also were involved in the development of the well-being scoring methodology used in this study.