
Abstract
The incidence and prevalence of diabetes (primarily type 2 diabetes) has risen sharply since 1990. It is projected to increase another 64% between 2010 and 2025, affecting 53.1 million people and resulting in medical and societal costs of a half trillion dollars a year. We know how to prevent many cases of diabetes and how to treat it effectively. Early appropriate treatment makes a significant difference in preventing major complications and reducing premature death, but it does not cure the disease. Early detection of prediabetes, in conjunction with lifestyle changes, can reduce the number of people with diabetes. A dramatic reduction in diabetes prevalence over time will require significant lifestyle changes on the part of society as a whole. The purpose of this study is to increase public awareness of the severity of regional diabetes trends by providing detailed forecasts for all states and several metropolitan areas for 2010, 2015, and 2025. A model was created to utilize the latest national diabetes and population data and projections, and to transform these into state and metropolitan area forecasts for the whole population and major subgroups. These forecasts were then summarized in easy-to-understand briefing papers for each state and selected metro areas, which are provided online for easy public access. This research is important because little data exist that project the future prevalence and potential costs of diabetes at the state and metro area level. With this data, key stakeholders can make informed decisions concerning diabetes, its impact on their communities, and resource allocation. (Population Health Management 2012;15:194–200)
Introduction
A key force for change is awareness of what really is occurring at the state and local levels and the unique impact of diabetes on minorities and seniors. Yet, at the present time there are little accessible data about the incidence and prevalence of diabetes and its anticipated progression over the next 15 years in states or select metropolitan areas. The purpose of the Institute for Alternative Futures' (IAF) Diabetes 2025 effort is to create a simple model that gives reasonable projections of the diabetes burden for population subgroups at both the state and metro levels, and to make this important information easily accessible on the Internet for leaders and citizens alike. Associated short briefing papers present detailed diabetes risk, morbidity, mortality, and cost data for particular population groups for each of the 50 states and several of the largest metropolitan areas, and suggest actions that can be taken to reduce the risks for individuals and communities.
Methods
The key challenge is finding a practical methodology and currently available data sources that could be used to provide reasonable projections of diabetes metrics at the state and metropolitan levels over the next 15 years (2010, 2015, and 2025). Diabetes trends are constantly changing because of the dramatic increase in obesity; population growth, ethnic shifts, and aging; and improvements in diagnosis, therapies, and management of chronic diseases. The model must make realistic adjustments for these trends over time. Very few states and metropolitan areas have the resources to do their own in-depth modeling, which would require comprehensive regional demographics, ethnic group surveys, and sophisticated modeling. We have developed this IAF Diabetes 2025 Model to interpolate national forecasts for these demographic groups in states and metropolitan areas.
The basic model
The Centers for Disease Control and Prevention (CDC) and Research Triangle Institute developed a robust Dynamic Markov Model for projecting the prevalence of diagnosed diabetes from 2000 to 2050 that was published by Boyle in 2001. 3 Because of the rapid acceleration of diabetes in the early 21st century, prevalence rate assumptions that drive the CDC model had to be revised upward 3 times, resulting in the 2003 article by Honeycutt, 4 the 2006 article by Narayan, 5 and, most recently, the 2010 study by Boyle. 6 This latest publication by Boyle uses an updated model based on recent diabetes trends and census data, and factors in an increasing diabetes incidence, declining future mortality rates for those with diabetes, the impact of undiagnosed diabetes on the total prevalence, and the growing numbers of Hispanic and foreign-born populations in the United States who have a higher risk for diabetes. The IAF methodology utilizes Boyle's 2010 middle-ground scenario of low incidence and low mortality that projected a diabetes prevalence of 25% for the nation by 2050.
Modeling prediabetes and diabetes in states
Narayan's 2006 article had diagnosed diabetes trend line projections for the US population overall, non-Hispanic whites, non-Hispanic blacks, Hispanics, and “other races,” extending to 2050. In contrast, Boyle's study provided a forecast of diagnosed diabetes to 2050 for only the US population as a whole. Therefore, for the Diabetes 2025 model Narayan's minority trends lines were adjusted to reflect the proportionate growth each year consistent with Boyle's latest overall population projections. Figure 1 shows the adjusted diagnosed diabetes projected trend lines between 2010 and 2050 by race and ethnicity. It should be noted that Native Americans and Asian Americans were included in the “other races” trend line in the Narayan 2006 article. Because Native Americans and Asian Americans are at opposite ends of the diabetes prevalence spectrum, however, more realistic estimates were needed. For that purpose, the Diabetes 2025 Model uses the diabetes prevalence rates for non-Hispanic whites as a surrogate for Asian Americans and the prevalence rates for non-Hispanic blacks as a surrogate for Native Americans. With these updated trend lines, the sum of the prevalence of diagnosed diabetes for all 5 subgroups nationally essentially equaled Boyle's total population national projections for each time period, giving confidence that the Diabetes 2025 bottom-up model is realistic.
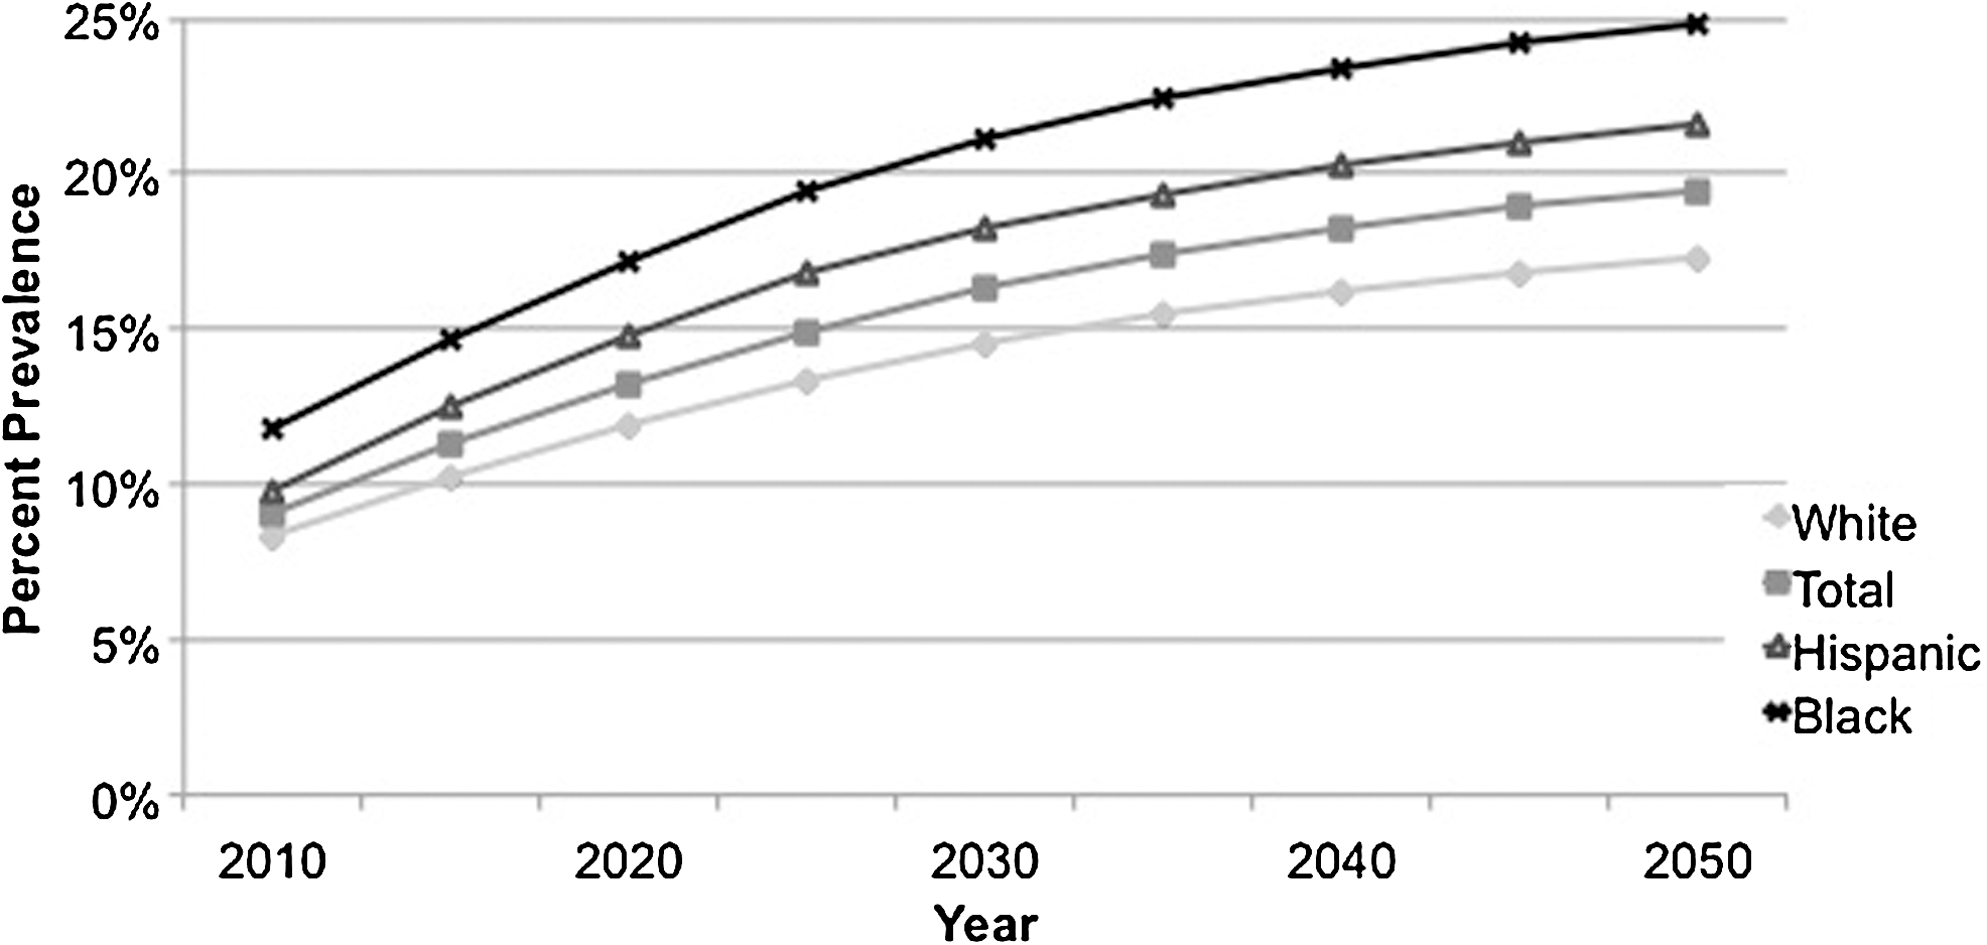
Projected prevalence trend lines of diagnosed diabetes as a percentage of the adult population by race and ethnicity in the United States for 2010–2050 used in the Diabetes 2025 Model.
Another set of assumptions in the Diabetes 2025 Model deals with state prevalence rates. Boyle's total population prevalence trend line is for the nation as a whole, whereas each state has a different starting prevalence rate based on its unique demographics, societal culture, risk factors, and access to quality health care. Therefore, the latest (2008) state prevalence of diagnosed diabetes 7 is compared to the national prevalence with the difference added to (or subtracted from, if the state is lower) the national prevalence rate for the year of interest (2010, 2015, or 2025). All subgroups are adjusted by the same amount for each period, as there is no way to quantify how the diabetes prevalence rates of demographic subgroups in relation to the prevalence rates of the state as a whole might deviate from those of the whole state population over time.
At the time of the development of the Diabetes 2025 Model, the most current US Census Bureau forecasts were used. US Census Bureau data based on the 2000 census using the 2005 interim state projections provides state population projections in 5-year intervals between 2000 and 2030. 8,9 The latest Census Bureau race and Hispanic origin estimates for each state are for 2008. 10 The Census Bureau also projected race and Hispanic origin population by state from 1995 to 2025, 11 but this 1996 report was based on the 1990 census and not updated after the 2000 census. (New projections based on the 2010 census are not yet available.) Therefore, 2008 state ethnic group data are used as a baseline and extrapolated to 2015 and 2025 based on each subgroup's population growth projected from the 1996 report.
Metropolitan statistical area population data come from Census Bureau 2000–2008 population estimates projected to 2025.
12
Race and Hispanic origin statistics for metro areas for 2008 are developed by
Multiplying a subgroup's population for the year of interest by the subgroup's diabetes prevalence rate for that year gives the number with diagnosed diabetes. Adding all groups (non-Hispanic whites, non-Hispanic blacks, Hispanics, Asian Americans, and Native Americans) results in the total number with diagnosed diabetes for the state or metro area.
The national prevalence of undiagnosed diabetes every 5 years from 2010 to 2050 also is presented in Table 1 of Boyle's 2010 article. It declines from 37% of total diabetes in 2010 to 27% in 2025. Total diabetes is the sum of diagnosed and undiagnosed diabetes.
Total diabetes prevalence for the entire population; **All costs adjusted to 2010 dollars.
The CDC National Diabetes Fact Sheet 2011 estimated that 79 million Americans had prediabetes in 2010. 14 We assume that the prevalence of prediabetes will parallel population growth, thus going forward the prevalence is determined on a national level and applied to state or metro population for the year of interest.
As seniors age 65 years and older are a separate category, the Diabetes 2025 Model applies estimates from the CDC National Diabetes Fact Sheet 2011, that 50% of the age 65 and older population has prediabetes and 26.9% has diabetes (19.64% diagnosed and 7.26% undiagnosed).
Major complications and diabetes contributed deaths
The CDC National Center for Health Statistics tracks the percentage of adults with diabetes who report complications of visual impairment, 15 end-stage renal failure, 16 and lower extremity amputations. 17 Trend data on these complications are projected out to 2015 and 2025, with the assumption that there will be modest reductions in the rate of complications over the next 14 years based on the magnitude of recent declines in the rate of these complications. The incidence rates for whites are used for Asian Americans and the incidence rates for blacks are used for Native Americans, as data for those 2 groups are not available.
Based on the latest available CDC data in 2005, there were 233,619 deaths nationally 18 in which diabetes contributed to the death, based on death certificate data. This is used as the baseline number of deaths. According to the CDC National Vital Statistics Report of 2007 data, compared to the diabetes death rate for non-Hispanic whites, the Hispanic diabetes death rate was 1.5 times higher, the Native American rate was 1.8 times higher, the African American rate was 2.1 times higher; the Asian American rate was 0.8 of the non-Hispanic white diabetes death rate. 19 These estimates are used as the baseline for determining ethnic and Hispanic mortality trends to 2025. CDC National Vital Statistics Reports provide total deaths in the US resulting from diabetes mellitus based on death certificate data. 19,20 Dividing the annual number of national diabetes deaths by the annual national prevalence of diagnosed diabetes for the same year 21 gives the per capita risk of death for those with diagnosed diabetes that year. Comparing the past 5 years of available data (2002–2007) shows a 28% drop in annual deaths during that period. The Diabetes 2025 Model assumes a further modest decline of 25% between 2007 and 2025 for all population subgroups. It is felt that the dramatic increase in obesity and frequent early onset of diabetes will result in many persons living for decades with their disease and developing complications that could prevent a greater decline in deaths by 2025.
Economic toll of diabetes
A 2007 American Diabetes Association Study estimated the total cost of diagnosed diabetes to be $174 billion, of which $116 billion was for direct medical expenditures and $58 billion was for indirect societal costs. 22 This is used to determine the costs of diabetes in 2000 and converted into 2010 dollars. Three studies published in 2009 have estimated the per capita direct medical and indirect societal costs of diagnosed diabetes, 23 direct medical and indirect societal costs of undiagnosed diabetes, 24 and the direct medical cost of prediabetes. 25 All these costs are converted to 2010 dollars and multiplied by the number of diagnosed, undiagnosed, and prediabetes for 2010, 2015, and 2025 to determine total costs.
Results
The Diabetes 2025 Model estimates that the total number of Americans living with diabetes will increase by 64% between 2010 and 2025 to 53.1 million, and the resulting annual medical and societal costs will increase 72% to $514 billion. Table 1 presents all the 2025 projections for the total United States, including separate statistics for African Americans, Hispanic Americans, Asian Americans, Native Americans, and seniors age 65 and older.
Similarly, the model provides forecasts for every state and several large metropolitan areas. All of these results and accompanying briefing publications are available at
Total diabetes prevalence for the entire population; **All costs adjusted to 2010 dollars. Costs in 2000 include only diagnosed diabetes; other years also include undiagnosed and prediabetes costs.
Total diabetes prevalence for the entire population; **All costs adjusted to 2010 dollars.
The Diabetes 2025 Model assumes that the prevalence rate of visual impairment and incidence rates of renal failure, amputations, and deaths will fall modestly, consistent with declines over the past 10 years. The impact of these declines would be 18,990 fewer cases of renal failure, 40,550 fewer amputations, and 116,420 fewer diabetes-related deaths in 2025 than if the 2010 rates remained unchanged. More dramatic improvement in health care could achieve even greater reductions.
Figure 2 illustrates the dramatic increase in the prevalence of total diabetes in the United States between 2010 and 2025 for each state based on the Diabetes 2025 methodology, and shows the persistent uneven distribution of this burden in certain geographic regions.
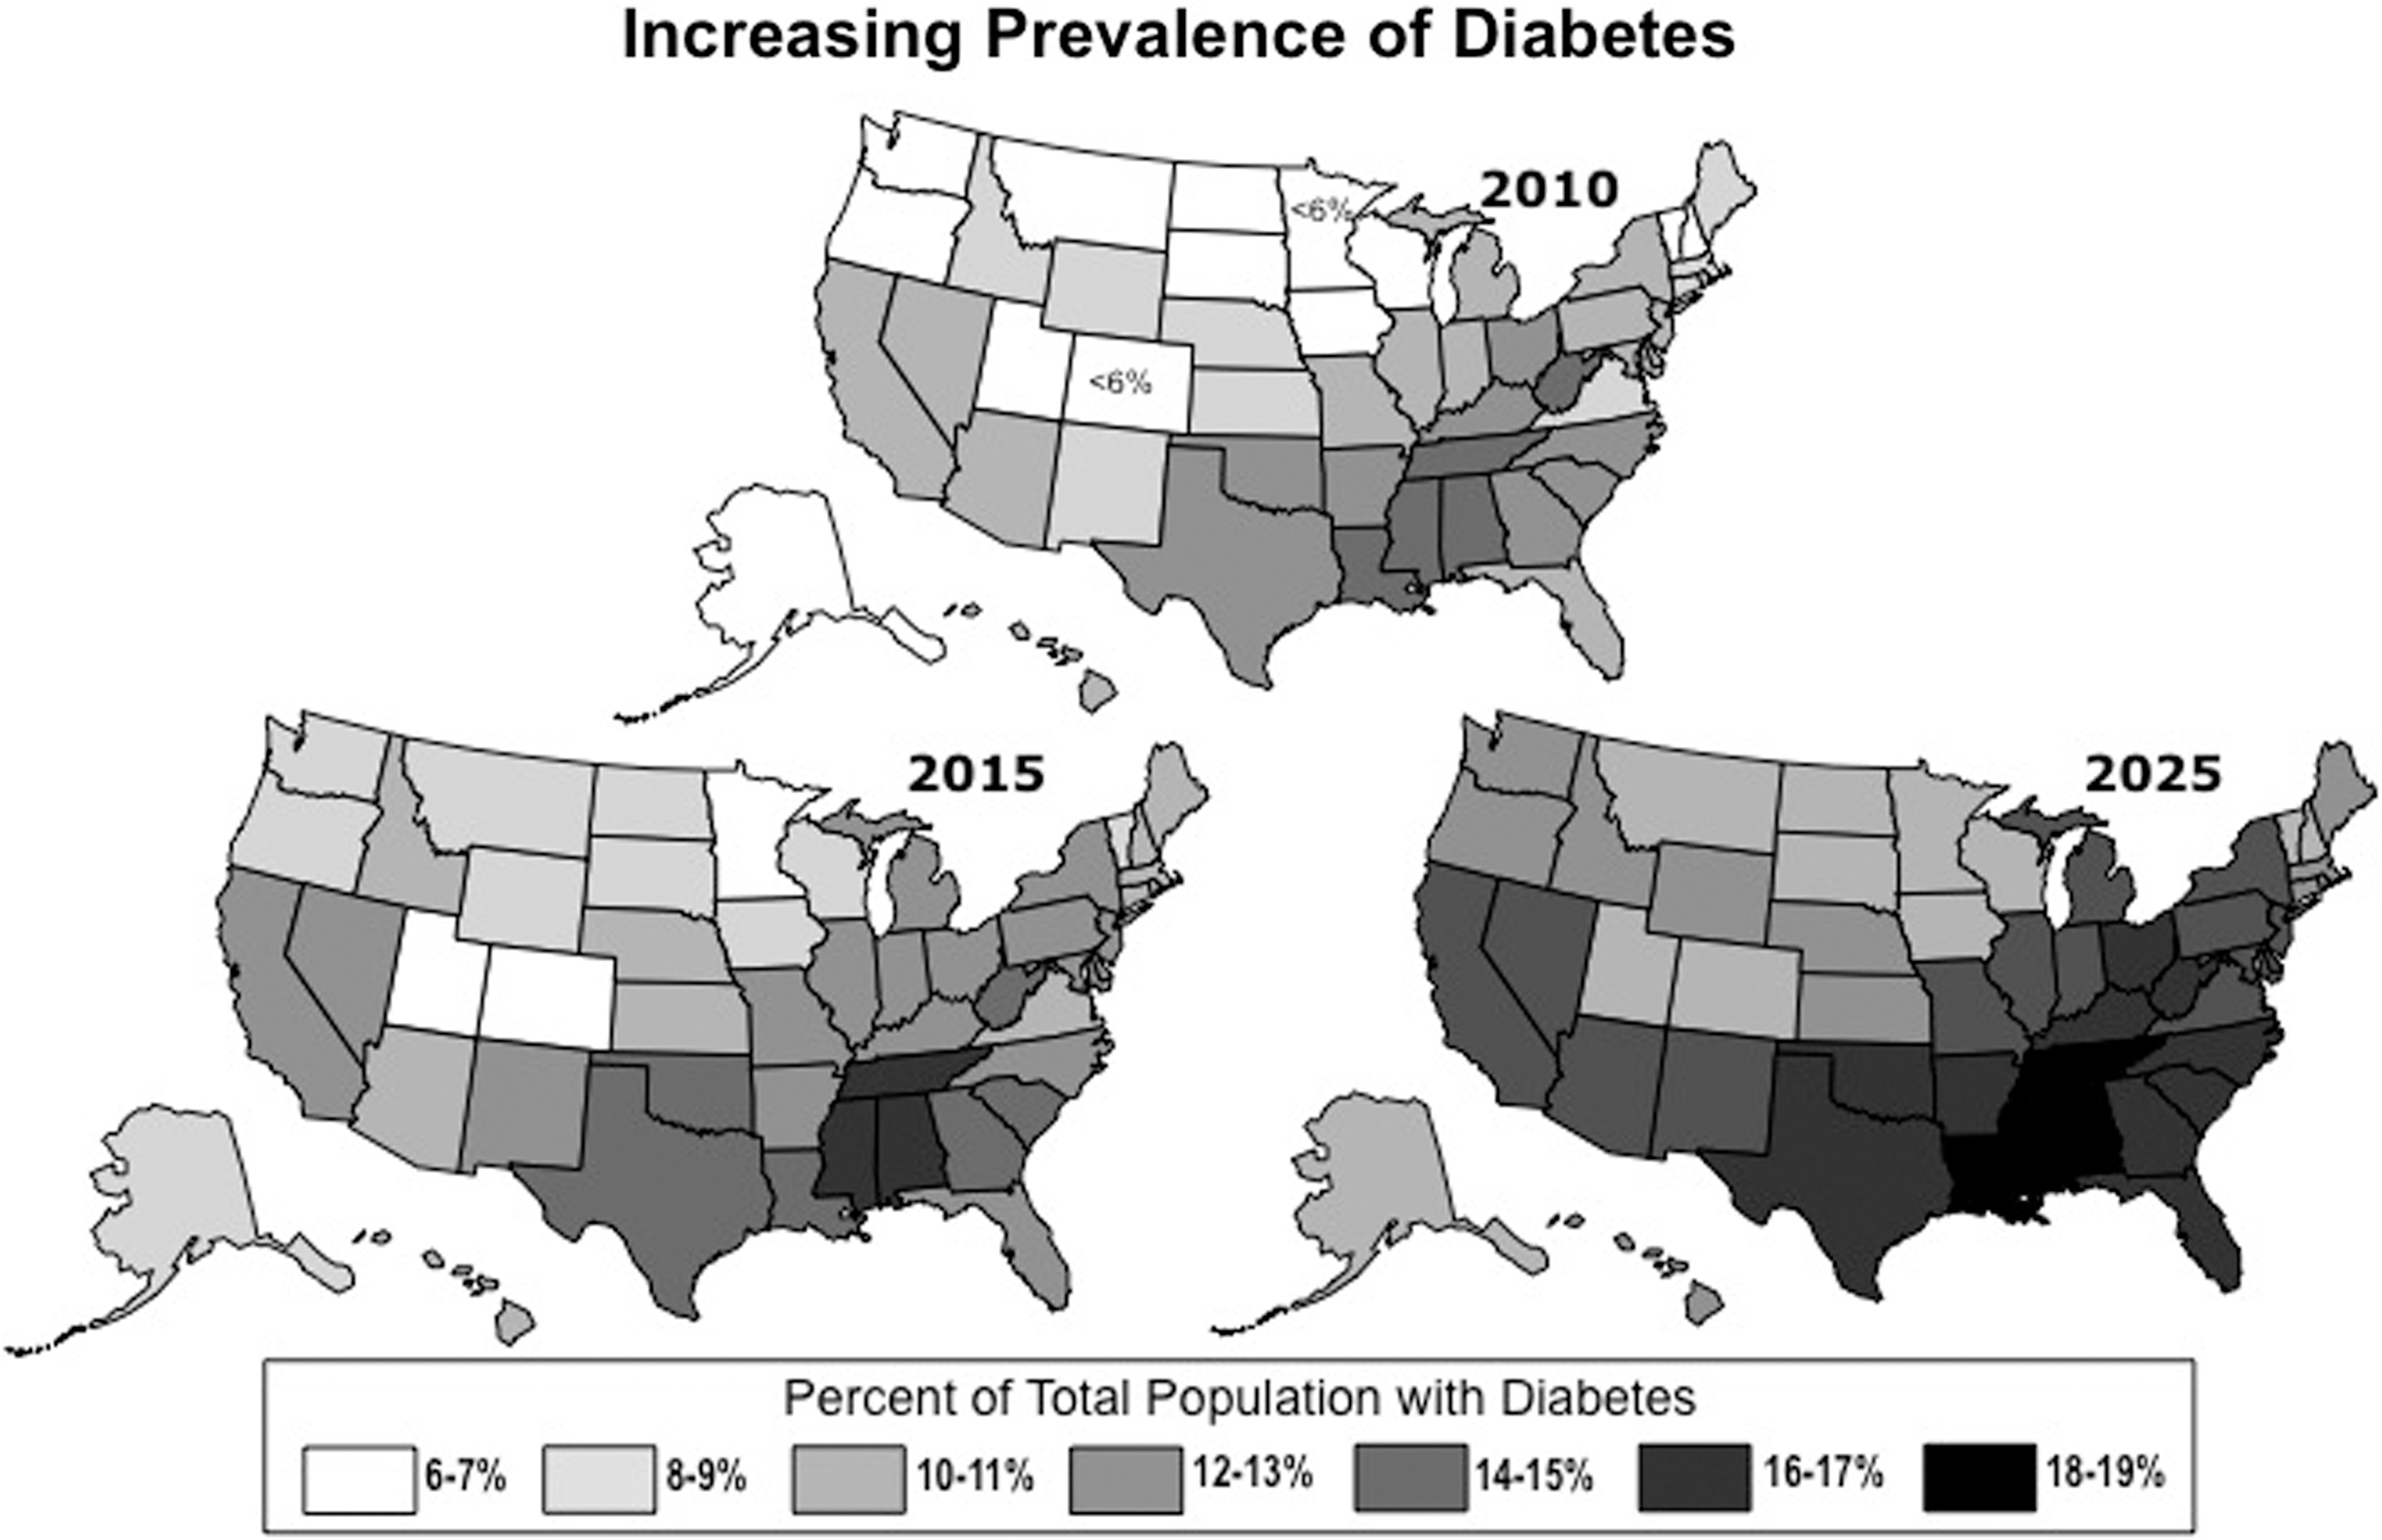
Prevalence of total diabetes as a percent of total population for each state for 2010, 2015, and 2025 based on the Diabetes 2025 Model.
Insights
The Diabetes 2025 Model can be used to explore what actions would be necessary to dramatically improve the huge projected diabetes burden in 2025. For instance, the Diabetes Prevention Program showed that changes in physical activity and diet leading to a loss of 5%–10% of body weight prevented the progression of prediabetes to diabetes 58% of the time. 26 If our health care system were able to persuade 50% of Americans with prediabetes every year to seriously change their lifestyles for the rest of their lives, the result could be about 4.7 million fewer cases of diabetes in 2025 with a cumulative savings of about $300 billion. Yet even if this happened, there would still be 48.4 million Americans living with diabetes. These sobering numbers suggest that it would take dramatic lifestyle changes on the part of all of society to prevent prediabetes in the first place in order to produce a dramatic decline by 2025. More realistically, it shows that we will continue to have a huge burden of diabetes to contend with for the foreseeable future.
On the other hand, if 50% of patients with diabetes received continuous, effective management and maintained good compliance over the next 15 years, it could prevent 305,000 new cases of renal failure, saving over $54 billion in dialysis costs, and prevent 369,000 lower extremity amputations, saving at least $15 billion in surgical and prosthetics costs. The reality is that we know how to effectively manage diabetes, but there are significant barriers to success within our current fragmented health care system.
Beneficial applications for states and metropolitan areas
These readily available diabetes estimates and 15-year projections for every state and several metropolitan areas are an important resource for state and local governments, businesses, and health leaders; they enable understanding of the magnitude of diabetes and its impact on citizens. Awareness can be a catalyst for building local coalitions of concerned stakeholders to develop specific strategies to address the greatest diabetes challenges in their community. Medicaid demographic data can be utilized with the Diabetes 2025 Model to determine the diabetes burden on Medicaid beneficiaries and thereby estimate future health care manpower needs and projected cost growth for planning and budgeting. The detailed forecasts are useful to make a rational and compelling case when competing for scarce funding. Helping employers become aware of the significant risk of diabetes for their employees encourages action to develop tailored company wellness programs to help keep workers healthy. Specific data showing the special challenges for particular minority groups is valuable for community leaders and health professionals to develop targeted programs to address those in greatest need. Lastly, the online briefing studies provide useful information for citizens concerned about diabetes in their families and communities. A key force for change is awareness.
Limitations
This methodology for forecasting the future prevalence and impact of diabetes has several limitations. If obesity continues to increase, there will a greater risk of diabetes than forecast in the Diabetes 2025 Model. Alternatively, improvements in diagnosis and management of diabetes, particularly with universal access to effective care, could lower the prevalence of diabetes and reduce the number of complications even more than the Diabetes 2025 Model forecasts. Overall, non-Hispanic white, non-Hispanic black, and Hispanic trend lines for the prevalence of diagnosed diabetes from the Narayan study were based on the prevalence experience of 1984–2004 and may not reflect the path of future minority trajectories. Also, there was not enough data for separate trend lines for Asian Americans and Native Americans, and our decision to use non-Hispanic whites and non-Hispanic blacks as surrogates, respectively, probably overestimates the former and underestimates the latter. Adjusting national prevalence rates to states, each of which has a different starting rate in 2008, and assuming this adjustment will remain constant for every minority group is necessary because of limited information, but likely will lead to errors over time. Population estimates to 2025 will continue to be adjusted following the 2010 Census, including state minority projections. Until then, state minority projections by the Census Bureau are based on the 1990 Census. The reported incidence of visual impairment and prevalence of prediabetes, undiagnosed diabetes, end-stage renal failure, and lower extremity amputations likewise are difficult to project 15 years into the future.
As noted, there is the potential for great gains in prevention, diagnosis, and treatment on one hand, but frustrating resistance to change on the part of the health care system and society on the other. The contribution of diabetes to death is significantly underreported because diabetes often is not listed as a contributing or a primary cause on the death certificate. A recent article by Roglic suggested that the actual mortality rate for diabetes might be 3 times higher. 27 Better reporting could dramatically increase the number of diabetes deaths. On the other hand, the number of deaths in proportion to those with diagnosed diabetes has declined 28% between 2002 and 2007, according to National Vital Statistics Reports. The Diabetes 2025 Model's assumption of a further 25% reduction between 2007 and 2025 could be either too much or too little, depending upon how lifestyles change over the coming years.
The basis for the forecasts in the Diabetes 2025 Model is the 2010 Boyle CDC study that projected US rates of diagnosed and undiagnosed diabetes from 2010 to 2050. The recently released CDC National Diabetes Data Sheet 2011 estimates that, in 2010, undiagnosed diabetes represented 27% of total diabetes, which is significantly less than Boyle's 37% (therefore also lowering the total number with diabetes). Cowie's 2009 study reported 39.8% of those with diabetes were undiagnosed, which lends support to Boyle's projections. 28 For the Diabetes 2025 Model, we felt it was best to utilize the Boyle numbers for all 3 time periods (2010, 2015, and 2025) for consistency of the data, rather than to utilize the Fact Sheet estimates for 2010. These differences highlight limitations in trying to derive precise forecasts for diabetes in a complex and constantly changing nation and diabetes-reporting environment.
Despite these limitations, our methodology fills a major gap by providing useful state and metropolitan diabetes 2010 estimates and 2015 and 2025 projections. In the years ahead, the Diabetes 2025 Model and its forecasts will need to be updated as more recent estimates and forecasts become available. Within the next year, 2010 census data likely will be released with updated minority projections to at least 2030 that probably will be quite different from previous estimates. Likewise, diabetes data will continually change with new surveys. This model can be updated easily to give more accurate future projections any time there is a significant change in the data.
Conclusions
Diabetes is a serious health issue in America, with every indication of a dramatic increase in prevalence, complications, and financial burden on society over the next 15 years. Reversing this “epidemic” will require major lifestyle changes and remaking our health care delivery system into one focused on proactive prevention and continuous access to coordinated, evidence-based management of chronic diseases. An informed and assertive public drives major change to a great extent from the bottom up. That is why it is so important for citizens and policy makers to have information about the severity of the diabetes burden and its projected course over the next 10–15 years if things remain the same. The purpose of this project was the creation of a simple, realistic model to forecast the burden of diabetes on states and metropolitan areas, and to make the results easily available online with briefing papers to explain the impact on the population, including minority groups and seniors. This model also is one that can be used to estimate the benefit of changes in lifestyle and specific interventions in reducing the burden of diabetes. Our hope is that easy access to these comprehensive briefing papers will help promote the changes needed in health care and society to avert the serious epidemic of diabetes in America.
Footnotes
Acknowledgments
The authors thank Yasemin Arikan for her extensive work on this project, particularly managing the preparation of the 380 state and metropolitan area data sheets and briefing papers, which appear online.
Author Disclosure Statement
Dr. Rowley is Senior Fellow and Dr. Bezold is Chairman and Senior Futurist at the Institute for Alternative Futures (IAF), an independent nonprofit futures institute. IAF has received grants in the past from many health care organizations and pharmaceutical industry clients, including Novo Nordisk, for health futures work. Dr. Rowley gives presentations on the future of diabetes and obesity, some of which are funded by Novo Nordisk.
Funding for this study was provided by a grant from Novo Nordisk, Inc. The funder did not participate in the research, methodology design, calculation of diabetes metrics, or preparation of the manuscript. Novo Nordisk did provide comments on a draft of this manuscript before submission.