
Abstract
Racial and income disparities persist in diabetes management in America. One third of African and Hispanic Americans with diabetes receive the recommended diabetes services (hemoglobin A1c [A1c] testing, retinal and foot examinations) shown to reduce diabetes complications and mortality, compared to half of whites with diabetes. National data for Asian Americans are limited, but studies suggest that those with language and cultural barriers have difficulty accessing health services.
A diabetic registry has been shown to improve process and clinical outcomes in a population with diabetes. This study examined whether a community center that serves primarily low-income Asian American immigrants in Santa Clara County, California, could improve diabetes care and outcomes by implementing a diabetic registry.
The registry was built using the Access 2007 software program. A total of 580 patients with diabetes were identified by reviewing charts, the appointment database, and reimbursement records from Medicaid, Medicare, and private insurance companies. Utilizing the registry, medical assistants contacted patients for follow-up appointments, and medical providers checked and tracked the patients' A1c results.
Among the 431 patients who returned for treatment, the mean A1c was reduced from 7.27% to 6.97% over 8 months (P<0.001). Although 10.8% of the patients changed from controlled to uncontrolled diabetes post intervention, 32.6% of patients with uncontrolled diabetes converted to controlled diabetes (P<0.001). The diabetes control rate improved from 47% to 59% at the end of the study. This study demonstrated that a diabetic registry is an effective tool to manage an underserved population with diabetes, thereby reducing disparities in diabetes management. (Population Health Management 2012;15:220–229)
Introduction
In spite of the high prevalence rates, diabetes is undermanaged, especially in low-income ethnic groups. Studies have shown that diabetic morbidity and mortality are reduced by screening services with follow-up treatment. 5 Launched in 2000, the Healthy People 2010 Initiative had a main diabetic objective of increasing the proportion of patients with diabetes who receive these screening services: hemoglobin A1c (A1c) blood test, dilated eye examination, and feet examination. 6 Nine years into the initiative, only one third of African and Hispanic Americans with diabetes who are 40 years of age and older received all 3 services as compared with half of whites. 7 Data for Asian Americans were unavailable. However, several studies suggested that Asian Americans with language or cultural barriers have difficulty accessing health services. 8,9
Local problems
In Santa Clara County, California, diabetes rates have increased from 5% of the population in 2000 to 8% in 2009. 10 Demographic and social changes in the county present challenges for diabetes management. Situated in the southern part of the San Francisco Bay Area, Santa Clara County, once known as the “Valley of Heart's Delight” for its orchards, has since been transformed into the world-renowned Silicon Valley. Microsoft, Hewlett-Packard, Intel, Apple, and many other high-tech corporations in Silicon Valley have attracted people worldwide for various job opportunities, turning Santa Clara into a center of diversity in the region with 1.8 million residents: 38% are white, 31% Asian, 26% Hispanic, 2% African American, and 3% other races/ethnicities. 10 This is in contrast to the state of California's 36.9 million residents whose diversity is 41.5% white, 12.3% Asian, 37% Hispanic, 5.8% African American, and 3.4% other races/ethnicities. 11
The demographic changes in the valley bring new challenges for health care. Many immigrants, faced with language and cultural barriers, have limited access to health services. Moreover, with the dot-com collapse shortly after the turn of the millennium, followed by an economic downturn and housing market crash, many people in Santa Clara are in financial hardship, having lost their employment and with it, their health insurance. Approximately 2 in 10 adults ages 18–64 are without health insurance. 10 For the uninsured and underinsured people of Santa Clara County, community centers have become the primary source for health care.
Organization
Asian Americans for Community Involvement (AACI) is a 38-year-old community-based organization that provides culturally and linguistically accessible services to Asians in Santa Clara County. 12 Some of their services include treatment for gambling and substance abuse, services for victims of domestic violence, after-school youth programs, and English and citizenship classes. 12 In 2000, AACI established a primary care center to provide medical services to needy individuals regardless of their insurance status or ability to pay. In 2010, the AACI Health Center served 3548 patients; 82% were low income (below the federal poverty level) and 85% were non-English or limited English speaking. 12 To recognize the cultural and linguistic needs of patients, most of the clinic physicians and staff are Asian and speak Asian languages, including Chinese (Mandarin and Cantonese), Vietnamese, Japanese, and Burmese.
The rising diabetes rates in Santa Clara County created a need for culturally appropriate and cost-effective management of this chronic condition. Following a review of the published literature, the medical director and quality improvement (QI) committee of AACI Health Center found that implementation and use of a disease registry could be an effective tool to manage diabetes.
Literature review on disease registry
A disease registry is a database that contains information about patients with a specific diagnosis, condition, or procedure. 13 In its simplest form, a disease registry consists of a collection of paper cards used by a single provider. 13 Frequently, a disease registry is built in an electronic database that may vary from simple spreadsheets accessed by a small group of medical providers to sophisticated designs communicated online across multiple institutions. 14
A disease registry enables users to identify a patient population, track the disease process, and coordinate care for that population. 13,14 For example, the Department of Veterans Affairs built a national HIV registry that enabled them to identify more than 40,000 HIV-infected patients and to track the care of these veterans. 15,16 Another example is Kaiser Permanente's use of computerized care registries to manage members with chronic diseases from asthma to coronary heart disease and congestive heart failure; utilization of these care registries resulted in a reduction of hospital admissions for these chronic conditions. 14
People with diabetes require routine physical exams and laboratory tests to monitor their condition. Using a diabetic registry can assist health care professionals to coordinate the care needed for individual patients. 13,14 With the advent of electronic medical record (EMR) systems, many diabetic registries have built-in evidence-based guidelines and point-of-care reminders that automatically prompt clinicians as to what kind of service is needed for which patients at what time. 5,14 Although these electronic features are ideal for coordinating care for patients with diabetes, they are not always available in smaller clinics that have not implemented EMR systems.
The literature indicates that simpler registries such as electronic spreadsheets also offer benefits to patients.
17
Baty et al implemented a diabetic registry in 4 community health centers that served minority and indigent populations. The medical management specialist regularly printed out the updated data from the registry and communicated the findings to the health centers in the study. After reviewing the printouts, the clinicians were able to proactively identify patients in need of services
Based on the evidence reviewed, a disease registry appeared to be an effective tool to manage a patient population. The AACI Health Center was ready to translate this evidence into practice; it launched a registry to identify patients with diabetes and to reach out to them in an effort to improve their diabetes control.
This study was undertaken with the hypothesis that utilizing a diabetic registry could help the AACI Health Center improve their diabetes patients' outcome measures including appointment adherence and A1c results. This study examined the appointment return rate and A1c results of diabetes patients before and after implementation of the registry. Additionally, clinic staff and providers were evaluated for fidelity in reaching out to patients, and patients were surveyed to ascertain perceived barriers to appointments and treatment.
Methods
As partial fulfillment of the requirements for the Doctor of Nursing Practice degree, this study was conducted in partnership with Duke University. The study was approved by Duke University's Institutional Review Board and conducted at the AACI Health Center in San Jose, California. The diabetes project was initiated in October 2009 and data collection to evaluate this project occurred between July 1, 2010 and February 28, 2011.
Study design
This evaluative study measured (1) the process outcomes of the clinic staff in reaching out to patients, and (2) the clinical outcomes of patients with diabetes including their overall appointment return rate and pre and post A1c results. The study ended with a description of patient barriers to diabetes treatment.
Study population
The available population of AACI staff and patients was used. The AACI medical staff consisted of 5 physicians, a nursing supervisor, 4 medical assistants, and 3 administrative assistants.
Patients who were older than 18 years of age, diagnosed with type 1 or type 2 diabetes, and seen at the AACI Health Center between July 1, 2009 and June 30, 2010 were included in the study. Patients without a baseline A1c or who were being treated for gestational diabetes were excluded. A total of 580 patients met the inclusion and exclusion criteria. The majority were Asians (81.6%) with a small percentage of whites (7.4%), Hispanic Americans (4.8%), African Americans (2.2%), and Middle Eastern Americans (4.0%). They ranged from 20 to 87 years old with a mean age of 62.5 years. Table 1 displays their demographics.
This patient population was used in its entirety without sampling because the diabetic registry was a population management project. Individual groups by sex, age, or ethnicity were too small to produce valid samples. Because identifying this patient population was part of the intervention, it is described in more detail in the following section.
Description of the innovation
Initiating a diabetic registry and using it to track patients with diabetes was new to the clinic. Therefore, implementing the diabetic registry project was viewed as an innovation by the clinic staff. This innovation involved the QI staff, medical providers, and medical assistants. It encompassed 3 parts: building and maintaining the registry, using it as a tool to reach out to patients, and tracking their glycemic status. Each part is described in the following sections and displayed in Figure 1.
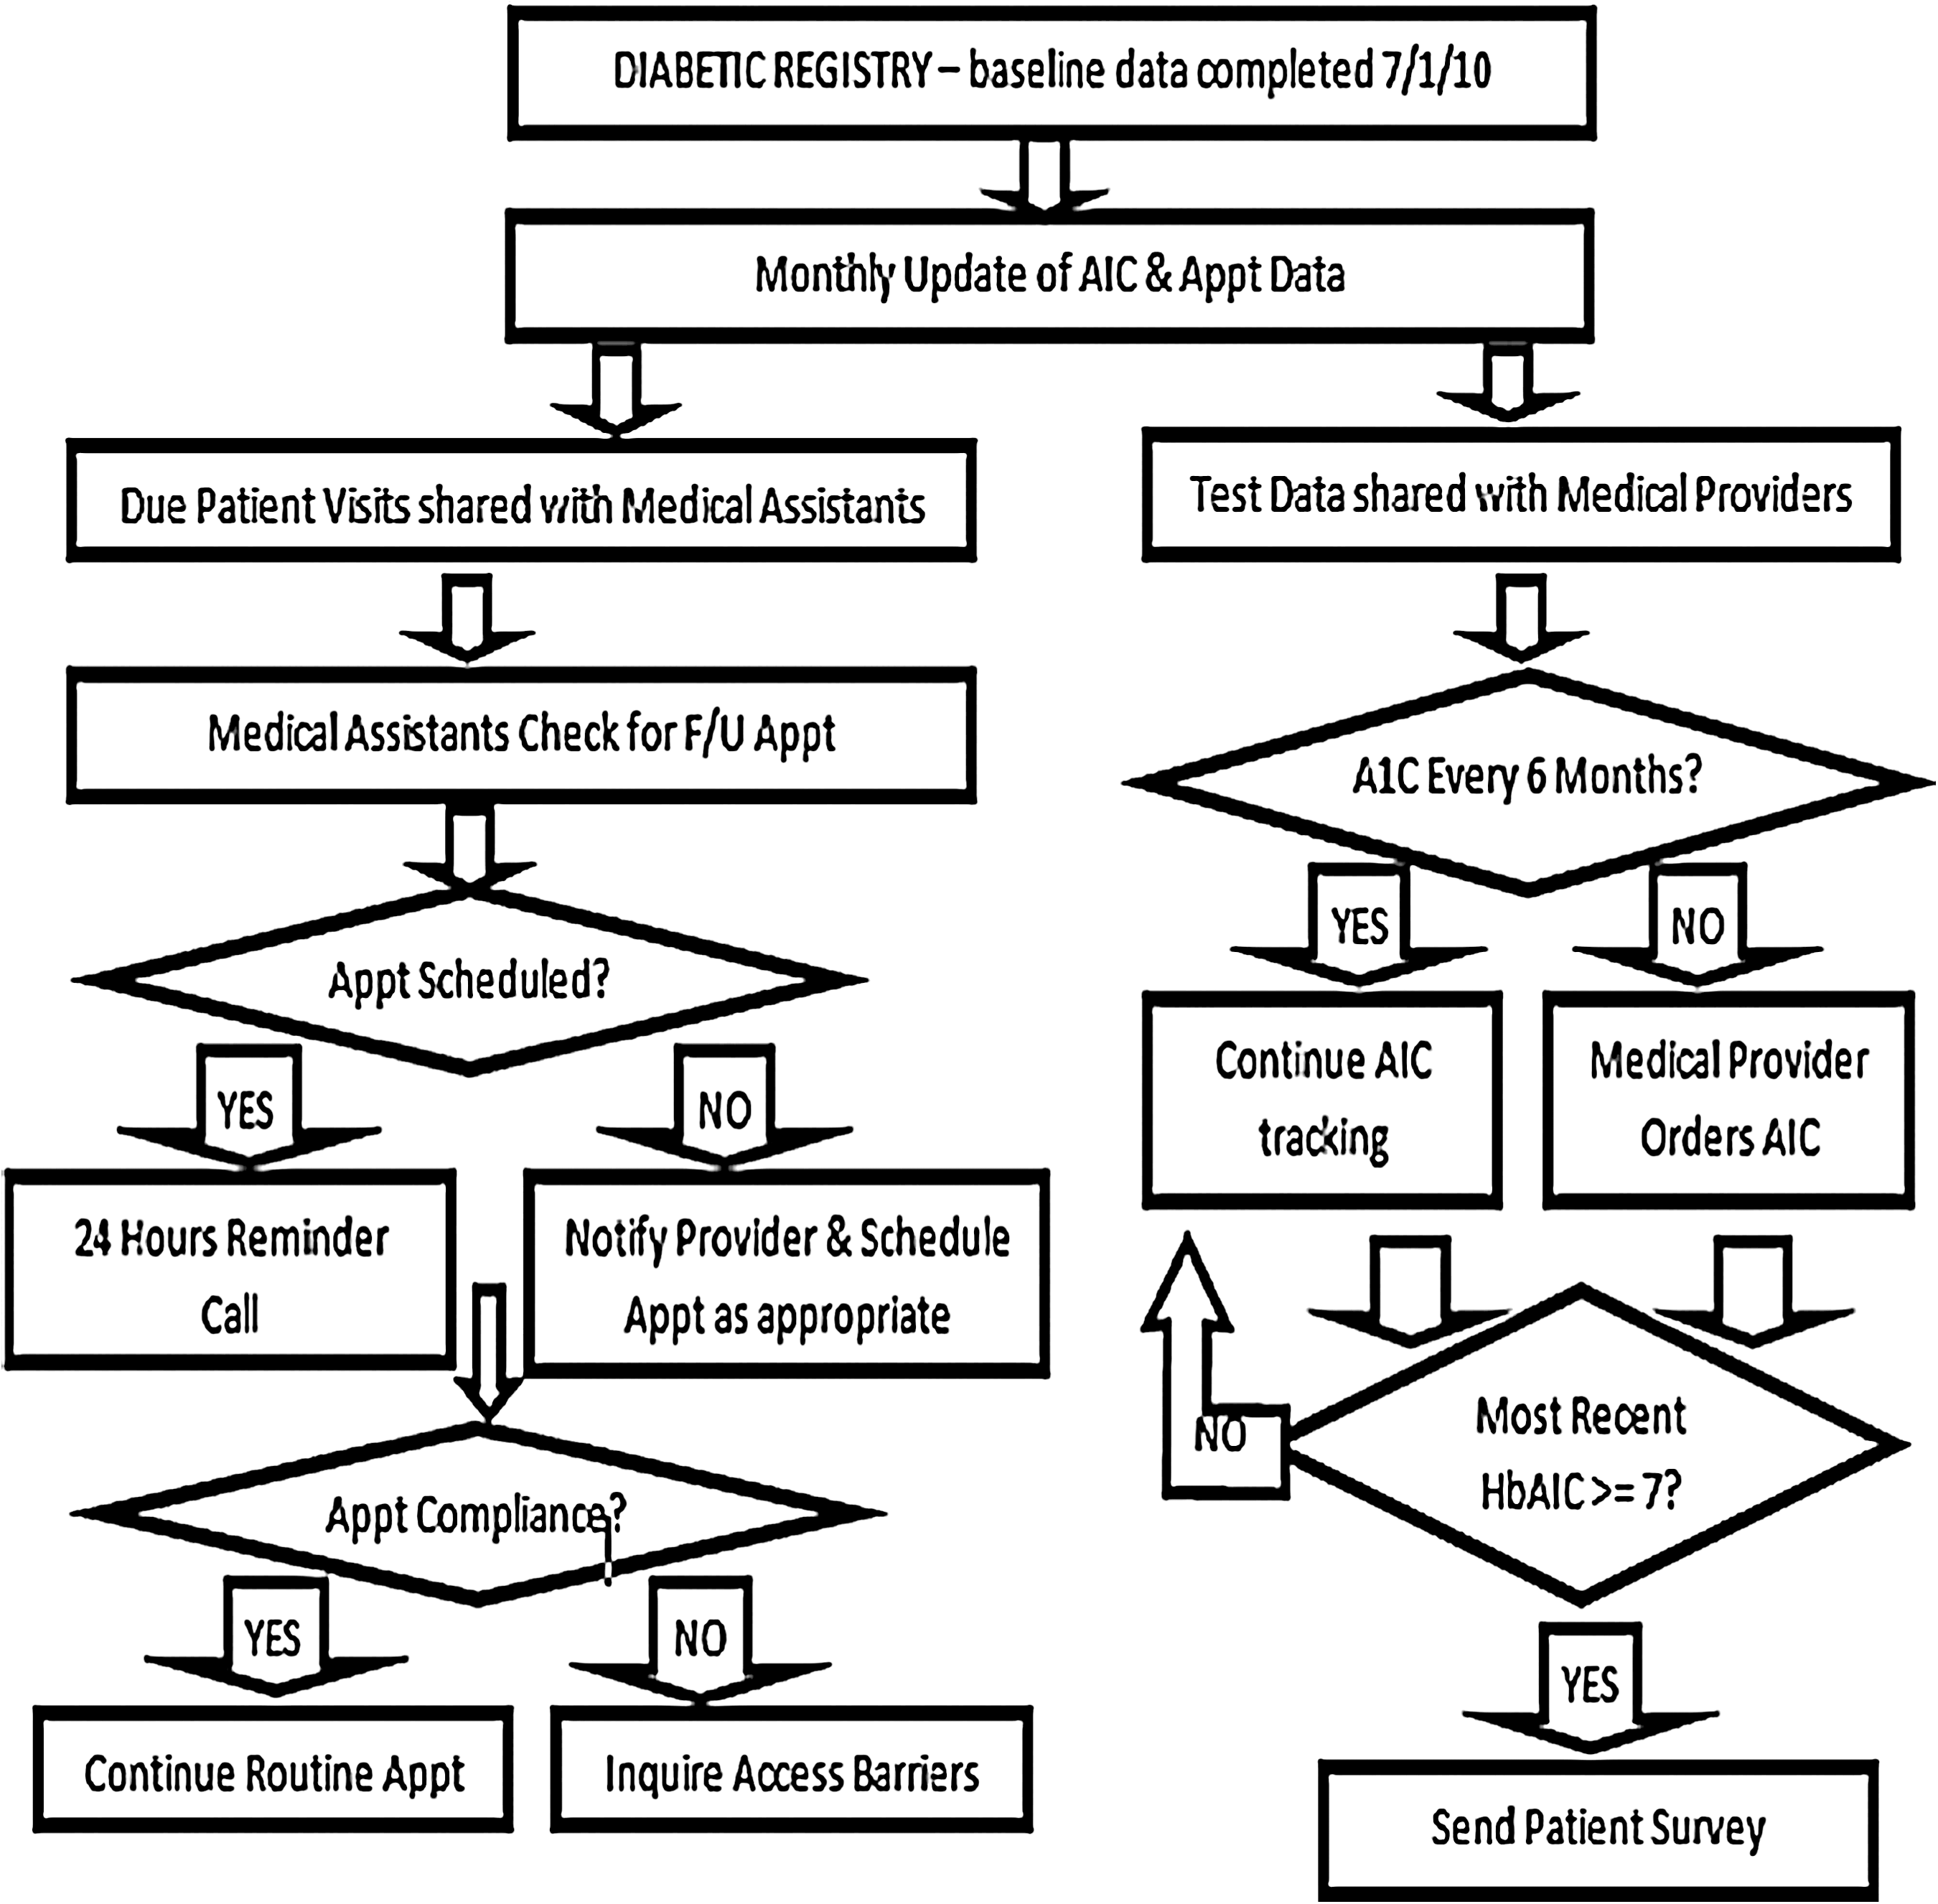
Project flowchart. Appt, appointment; F/U, follow-up.
Building the registry (October 2009 to June 2010) and maintaining it (Study period: July 2010 to February 2011)
The QI team, consisting of the medical director, QI manager, a part-time QI coordinator, and a nursing doctorate student, was responsible for this task. The QI manager built the diabetic registry in Microsoft Access 2007 (Microsoft Corporation, Redmond, WA) following the national standardized measures established by the Health Resources and Services Administration. 12
To identify patients with diabetes seen in the clinic, the QI team retrospectively reviewed patient charts, the appointment database, and reimbursement records from Medicare, Medicaid, and private insurance companies. Demographic and clinical data for the identified patients were entered into the registry. The demographic data consisted of age, sex, ethnicity, and insurance code, whereas the clinical data included office visits and A1c results. The QI staff updated the registry for clinical data monthly, printed the data, and communicated to the clinic staff and providers quarterly.
Reaching out to patients (Study period: July 1, 2010 to February 28, 2011)
Adhering to the recommendation by the American Diabetes Association (ADA), patients were offered appointments twice a year. Using the registry as a guide, the medical assistants contacted patients for follow-up visits. They reminded the patients 24 hours before the appointment. For those patients who did not return, the medical assistants further inquired about access barriers by calling the patients at home and sending them a letter if they were not reached by phone.
Tracking and improving glycemic status (Study period: July 1, 2010 to February 28, 2011)
Following the ADA's 2010 recommendation, the medical providers checked their patients' A1c level twice a year and more frequently for those with poorly controlled A1c (>9%). For people without diabetes, the normal A1c range is between 4% and 6%; for people with diabetes, a general goal is to reduce the level to below 7% to prevent or delay the progression of diabetes complications. 5
The diabetic registry allowed the medical providers to track their patients' A1c levels more consistently and to individualize treatment plans based on A1c trends and patterns.
Finally, as part of the QI process, the clinic staff and providers constructed a survey to identify any treatment barriers for patients with uncontrolled diabetes (A1c ≥7% per the ADA 2010 guideline). The survey was translated into Chinese, Vietnamese, and Tagalog to meet patient needs.
Evaluation of process and clinical outcomes
The process outcomes measured how consistently the medical assistants contacted patients and how consistently the physicians checked A1c levels.
When the medical assistants called a patient, they entered “appointment confirmed,” “patient will reschedule,” or “message left for patient” next to the patient's name in the clinic's appointment database. A review of the database revealed any missed opportunities to contact patients. The medical providers documented patients who declined a blood test in their progress notes. Checking the chart distinguished whether a missed A1c was because of patient refusal or an omission by the provider.
The clinical outcomes reviewed the appointment return rate for this patient population and the pre and post A1c results for patients who returned for treatment.
Data analysis
Data were analyzed using SPSS software (IBM, Chicago, IL). Patients' demographic information, including age, sex, and ethnicity, were computed in descriptive statistics. The process outcomes of the medical assistants and providers were also reported in descriptive statistics. A paired t test was used to compare differences of A1c measures before and after the implementation of the diabetic registry. Finally, a McNemar's test was run to determine whether the intervention had an effect on patients who converted from uncontrolled to controlled diabetes at the end of the study.
Results
Population
By retrospectively reviewing patient charts and billing claim records, the QI team identified 580 patients with diabetes who were seen at the AACI Health Center between July 1, 2009 and June 30, 2010. For the first time, the clinic had a comprehensive list of their patients with diabetes, who could then be tracked by the registry. The registry also facilitated communication with patients by the medical staff. Table 1 shows the demographic breakdown of the patient population.
Appointment adherence and nonadherence
Process outcomes
The medical assistants were evaluated for consistency in contacting patients for follow-up appointments. Routine checks of the clinic's appointment database revealed that they contacted all 580 patients, and many patients were reminded more than once about their appointment. The medical assistants achieved 100% compliance with the intervention.
Clinical outcomes
Among the 580 patients, 443 (76%) returned for their follow-up visits and 137 (24%) did not return. Of the 137 patients who missed their appointment: • 7 were deceased • 5 were in nursing homes • 5 reported that their health was optimal and did not need a visit • 10 reported financial difficulties • 24 had family obligations overseas • 21 left the clinic. The common reasons reported for leaving the clinic included relocation and transportation issues. A few patients had changed to a clinic with staff who spoke Hindu.
Finally, 65 patients could not be reached. Among them, 24 provided an invalid number and 41 did not return phone messages.
Hemoglobin A1c results
Process outcomes
The physicians were evaluated for consistency in checking A1c levels. Of the 443 patients who returned, 436 were offered an A1c test. This yielded a fidelity rate of 98.4% with only 7 missed opportunities for testing. Among the 436 patients, 431 completed the test and 5 declined.
Clinical outcomes
Pre and post A1c data were available for 431 patients; their demographics are shown in Table 2. To evaluate these patients' glycemic status, we followed the ADA's 2010 guideline for controlled and uncontrolled diabetes. Controlled diabetes is defined as A1c below 7% whereas uncontrolled diabetes refers to A1c of 7% and above.
Results were statistically significant at P<0.001. The paired t and McNemar's tests were performed on the entire population but not individual ethnic groups because of the very small sizes of many groups; analysis of these data would have been of questionable value.
DM, diabetes mellitus.
Of the 431 patients who returned for treatment, the mean A1c was reduced from 7.27% (standard deviation [SD]=1.3, range 5.2–16.7) at baseline to 6.97% (SD=1.0, range 5.2–12.1) post intervention. This difference was statistically significant (t=6.5, P<0.001).
At baseline, 204 patients (47.3%) had A1c <7% and were considered to have controlled levels while 227 (52.7%) had A1c ≥7%. Eight months later, of the 204 patients who had been in control at baseline, 182 (89.2%) stayed in control while the A1c values of 22 (10.8%) were in out of control range. Conversely, among the 227 patients with uncontrolled A1c values at baseline, 74 (32.6%) had values that were now in control, and 153 (67.4%) continued to have uncontrolled A1c values. These findings were statistically significant (McNemar=28.7, P<0.001). Table 2 shows the A1c results by ethnic groups.
Finally, the baseline diabetes status of the 137 patients who did not return for appointments was investigated. Seventy (51.1%) had controlled A1c values and 67 (48.9%) had uncontrolled values at baseline. As a group, their mean A1c of 7.31% was comparable to the mean A1c of patients who returned for treatment (7.27%). However, in the subgroup of patients who provided an invalid contact number and were lost to contact, the mean A1c was 7.7% at baseline, 0.43% higher than the group who returned for treatment.
Survey findings
As part of the QI process, the clinic sought to understand any treatment barriers for patients with uncontrolled diabetes. Patients who had uncontrolled diabetes at baseline received a survey in the mail to inquire about challenges with diabetes management.
A total of 290 surveys with return postage-paid envelopes were mailed; 108 patients (37.2%) completed and returned the survey. Among these respondents, “taking medication as prescribed” was noted as the top challenge, followed by diet, and exercise (Table 3).
Discussion
Appointment adherence and nonadherence
Using the diabetic registry as a guide, the medical assistants were able to contact all of the patients with diabetes. This reinforces the hypothesis that a registry is an effective tool to coordinate care.
The patients also responded well to phone calls; 76% returned for treatment. For a community center, achieving this level of compliance was encouraging when compared to the 61%–85% of appointment keeping rates reported by commercial ambulatory care facilities. 18 –20
Regarding the patients who did not return, this study uncovered several unique findings. A portion of patients reported family obligations overseas and almost half of the no-shows could not be contacted. These findings were different from the commonly reported reasons in the literature (eg, transportation, child care, financial problems). 21,22
About one fifth of the no-show patients reported family obligations overseas. All but 1 of them was Asian. In the context of Asian culture, taking care of aging parents, and sometimes siblings, is a family obligation. 23,24 Asian Americans who uphold this traditional value are responsible for taking care of their aging elders who may reside overseas. Through reaching out to their patients, the AACI Health Center found that if they offered a flexible follow-up schedule, such as twice a year, many patients would return. At the time of this writing, several of the 24 patients who originally missed their appointments because of family obligations had rescheduled a follow-up visit.
Among the patients who could not be reached, 24 provided an invalid number and 41 did not respond to phone calls. This subgroup of patients had a higher mean A1c value than others at baseline. Lacy et al performed an in-depth exploration to understand patients with “no-call and no-show” behaviors at an urban clinic and found that emotional barriers were a main contributor to those who missed appointments without notifying the clinic. 25
Emotional barriers to keeping appointments (eg, fear of going to the doctor) have been documented in the literature. In the context of Asian culture, many people may not view a doctor–patient relationship as a partnership; rather, the doctor is considered the authority. 23 Regarding the patients who provided an invalid number or did not respond to phone messages in the study, it is unclear whether they were afraid to be contacted or were indeed unavailable. The group comprised not only Asian Americans but a mix of Hispanics, Africans, and whites. A home visit might provide a better picture of their situations. This opens the door for more research to understand patients with “no call and no-show” behaviors.
Hemoglobin A1c results
The medical providers achieved almost perfect fidelity (98.4%) in checking their patients' A1C levels, outperforming the average rate (82.2%) of A1c testing reported by community clinics and health centers in California. 26
The medical providers saw a marked improvement in patients' A1c measures within 8 months of implementing the diabetic registry. Among the patients who returned, one third had reduced their A1c whereas 12% moved in the other direction. At the end of the project, 59% of the patients achieved controlled diabetes. Comparing this percentage to the average control rate reported by commercial insurers (43.3% with 14.6% variability), Medicare (43.4% with 27.9% variability), and Medicaid (32.9% with 26.0% variability) in 2009, 27 the AACI Health Center performed better on this measure than many health plans nationwide.
Survey findings
Sixty-five percent of the survey respondents with uncontrolled diabetes at baseline reported “taking prescribed medication” as their top challenge. This finding suggests why their diabetes was not in control.
In response to the top challenge of adhering to prescribed medicine in the diabetes control survey, the clinic physicians and QI committee have approved medication reconciliation with their patients with diabetes as the next step. When the medical assistants contact patients for follow-up appointments, they will ask patients to bring their current medications to the appointment. Following the protocol, when preparing patients for their physical exam, the medical assistants will discuss adherence to the medication regimen with each patient. The medical providers will review the patients' medications and check with them as to challenges to taking the medicine as prescribed.
Cost-benefit analysis
The clinic spent $74,121 in the first year of the project to implement the diabetic registry. The cost breakdown, as provided by the clinic, is shown in Table 4. The expenditure was funded by a Kaiser Permanente grant for Community Benefit Programs.
QI, quality improvement.
The personnel costs included wages, employee benefits, and continuing education. The QI manager attended conferences and registry training to build a functional database structure for the project. She trained staff to use the registry. The lead author spent over 400 clinical hours collecting, integrating, and computing data into meaningful information for the medical team. Because of the large amount of data generated during the project, a part-time QI coordinator was hired to input and update data.
The nonpersonnel costs, including information technology (IT) support and consultations, purchases of equipment and supplies, and overhead expenses, approximated $15,550. Through IT support, the clinic established ongoing online access to 2 major local laboratories where AACI patients are referred for blood tests. The QI team was able to view patients' laboratory results online and transferred the updated results into the clinic's registry.
As most of the cost was for personnel involved with implementing and maintaining the registry, the clinic anticipates that the project expenditure for Year 2 will be similar to Year 1. However, the clinic is planning to implement an EMR system that can support registry functions within the next 1 to 2 years. The connectivity between the clinic's registry and EMR system will help reduce the personnel cost to input and communicate data manually.
Aside from the expenses for the project, the clinic physicians and staff are seeing significant improvement in their patients' diabetes status. Research has shown that for every $1 invested in early and routine interventions, health care systems can save up to $8.76 treating diabetes complications, including heart disease, stroke, neuropathy, retinopathy, nephropathy, and amputations. 28,29 Clearly, using a diabetic registry to coordinate routine care can reduce medical costs in the long run.
Limitations and recommendations
This study has several limitations. One is a short study period covering a long-term problem. Diabetes, once diagnosed, often requires lifelong monitoring. Although the process and clinical outcomes were encouraging 8 months after implementation of the diabetic registry, one cannot extrapolate its current success beyond 1 or 2 years. Sustaining an innovative technique often is more challenging than initially adopting it. Dedication to adhere to what worked and reinvent what did not work is required to sustain a new practice. 30 A long-term study is recommended to evaluate the sustainability of the innovation.
Another limitation is that the QI staff was not formally evaluated for process fidelity in maintaining the registry. However, there was a check and balance system to ensure that data were updated accurately and in a timely manner. Because an EMR was not available during the study, the patient data were not entered into the registry in real time. To improve data currency and timeliness, the AACI Health Center is planning to implement an EMR system within the next 1 to 2 years.
This study has several strengths. It demonstrated how a community center utilized a diabetic registry to reach out to patients and improve their diabetes control. Additionally, it provided evidence of perceived barriers to following treatment recommendations. Tracking the process and clinical data in the study aligns with the federal government's need for data collection to examine the quality of care received by members of different racial and ethnic groups as a critical first step in addressing health disparities. 31
Conclusion
Contrary to the 2010 National Healthcare Quality and Disparities Reports' indication that progress on health disparities is elusive, 1 this study suggests that reducing racial and income disparities in diabetes management is possible when evidence-based strategies such as a diabetic registry are used to manage the problem.
This single, evaluative study demonstrated how 1 primary care community clinic translated scientific evidence into practice and improved their patients' diabetic health. Utilizing evidence-based strategies, the QI staff created a diabetic registry to track process and clinical data. The medical team responded to the meaningful data by following best practice guidelines to deliver care. Their collaborative work enabled them to improve their patients' diabetes control rate from 47% to 59% over 8 months. This study demonstrates that a diabetic registry is an effective tool to manage diabetes in an underserved population like the one described in this study, and that reducing racial and income disparities in diabetes management can be done.
Footnotes
Acknowledgments
The authors acknowledge the Asian Americans for Community Involvement (AACI) quality improvement manager, Chao Lin Tseng, RN, MSN, for creating and managing the diabetic database; all the AACI physicians and staff for their commitment to the successful implementation of the project; and Nell Farr, JD, BS, for her insight and keen editing skills.
Author Disclosure Statement
Drs. Seto, Turner, Champagne, and Liu disclosed no conflicts of interest.
This project was supported by the Kaiser Permanente Northern California fund for Community Benefit Programs at the East Bay Community Foundation (Grant #20100607).