
Abstract
This study evaluated the impact of The Prevention Plan™ on employee health risks after 1 year of integrated primary prevention (wellness and health promotion) and secondary prevention (biometric and lab screening as well as early detection) interventions. The Prevention Plan is an innovative prevention benefit that provides members with the high-tech/high-touch support and encouragement they need to adopt healthy behaviors. Support services include 24/7 nurse hotlines, one-on-one health coaching, contests, group events, and employer incentives.
Specifically, we analyzed changes in 15 health risk measures among a cohort of 2606 employees from multiple employer groups who completed a baseline health risk appraisal, blood tests, and biometric screening in 2008 and who were reassessed in 2009. We then compared the data to the Edington Natural Flow of risks.
The cohort showed significant reduction in 10 of the health risks measured (9 at P ≤ 0.01 and 1 at P ≤ 0.05). The most noticeable changes in health risks were a reduction in the proportion of employees with high-risk blood pressure (42.78%), high-risk fasting blood sugar (31.13%), and high-risk stress (24.94%).
There was an overall health risk transition among the cohort with net movement from higher risk levels to lower risk levels (P < 0.01). There was a net increase of 9.40% of people in the low-risk category, a decrease of 3.61% in the moderate-risk category, and a 5.79% decrease in the high-risk category.
Compared to Edington's Natural Flow model, 48.70% of individuals in the high-risk category moved from high risk to moderate risk (Natural Flow 31%), 46.35% moved from moderate risk to low risk (Natural Flow 35%), 15.65% moved from high risk to low risk (Natural Flow 6%), and 87.33% remained in the low-risk category (Natural Flow 70%) (P < 0.001). (Population Health Management 2010;13:275–284)
Introduction
Health insurance cost, the second largest expense beyond payroll for many employers, is linked directly to employee health for employers that self-fund or purchase medically underwritten plans. Community-rated groups also feel the impact of employee health through annual rate increases driven by community experience.
Poor employee health also impedes profitability by reducing productivity. Compared to a healthy person, an employee in poor health is more likely to be absent from work and less productive while on the job (presenteeism or health-related performance reduction). Several studies indicate that the financial impact of employee absenteeism and decreased productivity due to poor health is more costly compared to medical and pharmacy claims costs alone. 3 –7 In fact, in a multiemployer study of over 1,134,281 medical and pharmacy claims across 51,648 employees using the Health and Work Performance Questionnaire developed by Ron Kessler, PhD and the World Health Organization, the average employer health-related productivity costs (presenteeism and absenteeism) were found to be 2.3 times the medical and pharmacy costs alone. 3
To absorb escalating costs, most large employers plan to shift a greater share of health care costs to their workers. The worker contribution, or the portion of premiums paid by the employee, has increased 128% since 1999. 2 According to the 2009–2010 annual survey by the National Business Group on Health and Towers Watson, employees at many companies will experience significantly higher premiums, deductibles, and co-payments next year. The survey also found that 28% of employers plan to impose spousal surcharges next year, an increase from 21% this year. 8
The trend of escalating costs and increased cost-sharing is unsustainable. Continued cost increases without corresponding increases in income impede profitability and many employees cannot afford to shoulder continually increasing portions of their health insurance premiums.
However, this health care cost quandary is, in large part, the result of a growing health crisis from an unmitigated growth in the burden of personal health risks leading to chronic illness. In the United States 75% of health care costs stem from the same preventable chronic conditions—heart disease, cancer, stroke, chronic obstructive pulmonary disease (bronchitis, emphysema), and diabetes. 9 Rising health care costs are more connected to increased health care utilization (due to this unrelenting burden of health risks and illness) than to the increase in unit price for health care services. 10
In 2008, a large employer estimated its total health-related costs (medical + pharmacy + presenteeism + absenteeism costs) using the Integrated Benefits Institute Health and Productivity Snapshot (which is based on the Health and Work Performance Questionnaire developed by Dr. Ron Kessler of Harvard along with the World Health Organization). 11 As a hypothetical example, if the employer were able to reduce the health-related productivity loss through a comprehensive wellness program by just 1 day per full-time employee per year, it would generate $18.8 million to bottom-line earnings before income tax, depreciation, and amortization. To generate the same impact by increasing top-line revenue, sales revenue would have to grow by $76.6 million. The chief financial officer then translated this figure to $0.84 of value per share improvement, based on the company's current market value. 12
Today's reality is that health is a performance driver. The only sustainable way to relieve the economic pressures of rising health care costs is to drain some of the manageable health risks and illness burden from the population. 12
According to a Milken Institute study, 13 implementing primary (wellness and health promotion to keep healthy people healthy), secondary (screening for earlier detection/diagnosis), and tertiary (earlier evidence-based treatment to reduce complications and disability) prevention in homes and workplaces nationwide would reduce the economic impact of disease by 27%—saving $1.1 trillion annually by 2023 and reducing cases of chronic disease by 40 million. The study calculated that 7 chronic conditions (ie, cancer, heart disease, hypertension, mental disorders, diabetes, pulmonary conditions, stroke) cost the US economy more than $1 trillion per year. Based on the growing prevalence of those conditions, it projected an illness-related cost burden of $4 trillion by 2023. However, estimates of gains through improved prevention, detection, and treatment of those 7 conditions would reduce annual treatment costs in the United States by $217 billion and reduce health-related productivity losses by $905 million by 2023. Lowering obesity rates alone could lead to productivity gains of $254 billion and avoid $60 billion in treatment expenditures, according to the study.
As shown by Edington in the landmark article, “Emerging Research: A View from One Research Center,” costs follow risks. 14 A high risk for any single risk factor is associated with higher medical costs. When individuals are grouped according to their overall health risk levels and age categories, those with the higher risk levels are more costly to the organization. As risks increase or decrease over time, changes in costs follow in the same direction. Therefore, an organization that succeeds in moving a population from a high-risk category to a moderate-risk category can expect reduced cost levels. Similarly, an organization that succeeds in maintaining a high percentage of employees in low-risk categories can avoid the cost increases associated with moderate- and high-risk categories. The goal of a health promotion program, therefore, should be to move the population into low-risk, low-cost categories—and to keep them there. 14
For health management programs to succeed in moving people into lower risk categories, however, they must attain a high participation rate from the employee population. Incentives, communications, and organizational commitment through a sustainable culture of health play important roles in growing participation. Employers are increasingly using innovative incentives to increase health promotion participation rates. Incentives are often both extrinsic (financial) and intrinsic (nonfinancial) rewards designed to motivate individuals to modify their behavior by changing the cost and benefits associated with the behavior. Typically, the stronger the culture of health and the better the communication/marketing of the programs, as well as the higher the average dollar value of an incentive, the higher the participation levels. 15
Methods
The Intervention
The eligible population was offered The Prevention Plan™, a first-of-its-kind prevention benefit program that identifies an individual's top health risks and designs a customized personal prevention plan to reduce those risks. The Prevention Plan™ provided a suite of innovative technology, tools, and services encompassing integrated primary prevention (wellness and health promotion), secondary prevention (biometric and lab screening as well as early detection/diagnosis), and tertiary prevention (early intervention and evidence-based chronic condition management) – all based on the clinical science of preventive medicine. This study evaluated the impact of The Prevention Plan™ on employee health risks after 1 year of integrated primary and secondary prevention interventions in a cohort of 2606 individuals.
The Prevention Plan™ participants completed an online health risk appraisal (HRA), which is a comprehensive questionnaire (totaling approximate 77 questions) about their current health risks, health status, and lifestyle. Their results were posted in a secure personal online storage space for health records on The Prevention Plan™ Web site. Members also had the option of storing their medical information—such as lab results, surgeries, and immunizations—and tracking their progress and incentive points in this password-protected area.
After completing the HRA, the 2606 cohort participants completed a blood test (at a minimum this included a lipid profile and fasting blood glucose). Professionals from a national laboratory performed blood draws in the workplace or at an off-site clinical lab. Biometric measurements (eg, height, weight, blood pressure) also were taken. Based on the results of the HRA, blood tests, and biometric measures, each member received a customized Personal Prevention Plan. Each individual's top health and lifestyle risks were identified and the individual was provided with step-by-step recommendations to lower his or her health risks and prevent medical conditions from developing.
Some members also had the option of selecting a physician review. This included a review of all the identified health risks and the blood test results by a licensed physician who provided the member with written recommendations about his or her health status. The Prevention Plan™ also made recommendations about screenings, tests, and other follow-up exams based on the age and sex of the member and accepted evidence-based medical protocols and clinical indicators. The report made available to the members included a summary of the preventive benefits covered by the member's health plan (when purchased through the employer).
After the initial assessment as described, The Prevention Plan™ provided members with the support and encouragement necessary to adopt healthy behaviors and lifestyle changes, such as increased exercise, reduced alcohol consumption, or following a low-fat diet. Support services included 24/7 nurse hotlines, one-on-one health coaching, contests, group events, and employer incentives/rewards. Members also received their own customized and personal health dashboards on The Prevention Plan™ Web site to navigate their health needs. Members had the option of completing action programs, typically 8- to 10-week educational programs that addressed key health areas such as nutrition, weight management, smoking cessation, depression, and lowering cholesterol. E-mail and telephone alerts, as well as reminders about needed screenings, were also used to motivate and assist members. A robust health library, symptom checker, medical animations, and daily health news were all made available to members.
Within their personal password-protected account, a score meter showcased The Prevention Score for a member, providing an instant snapshot of his or her own prevention efforts as well as progress toward completion of educational tutorials, screenings, and participation in other activities and adherence to recommended programs. As the member engaged in The Prevention Plan™ during the course of the year—via challenges, action programs, activity trackers, registered nurse coaching, among others—his or her Prevention Score increased. While protecting employee personal health information, the score level achieved was then linked to customized rewards and incentives such as prizes, gift cards, or health insurance premium reductions, which further drove both enrollment in The Prevention Plan™ and engagement in the program during the course of the year.
Data
The worksite population examined in this study came from 3 employer groups—a health services company, a hospital, and a global insurance brokerage—ranging in size from approximately 139 employees to 7661 employees with a total eligible population of 10,899. In 2008, The Prevention Plan™ (HRA, biometrics, and blood tests) was offered to these employees by their employers, resulting in a 52% registration (5667 people). However, because not everyone who registered at baseline completed all 3 steps (HRA, biometrics, and blood tests), and those who did complete all 3 steps the first year may not have completed all 3 steps the second year, in addition to those who did not have all data points in their entirety from the HRA, biometrics, or blood tests in either year–the number of employees studied was limited to the 2606 who met all criteria for the study cohort and, therefore, was much smaller than the group that actually participated in the HRA and some of the programs. The final sample for the study consisted of a smaller cohort of 2606 employees, registered in The Prevention Plan™, who completed an HRA, blood tests, and biometric screening in both 2008 and 2009, and had a complete set of the 15 health risk data points in both years. Baseline demographics of the cohort can be found in Table 1.
In order to evaluate the impact of The Prevention Plan™ over the course of 1 year, we compared the risk transition in the study group to the Natural Flow model developed by Edington. 14 The Edington Natural Flow model measured the health risks in a population in which employees did not participate in a health improvement program. An updated version (as of April, 2010) of Edington's research on the Natural Flow transition between risk groups was used (Table 2).
The Natural Flow numbers used in the current paper are from updated research by Dr. Edington as of April, 2010.
Although ideally we would like to have appropriately adjusted for age and sex, in this analysis our adjustment was limited to matching 15 individual risk factors as much as possible to the ones used by Edington in the 2001 study. 14
Variable description
Information on health risks, health-related absences, and perception of health were obtained from employees' responses to the HRA questions, and from the blood tests and biometric screenings completed. Edington used the 15 health risk measures and the corresponding high-risk criteria as indicated in Table 3. The current study matched the majority of the measures and criteria except as indicated.
HDL, high-density lipoprotein.
Adopting similar health risk definitions to those used by Edington, 14 Burton et al, 16 and Musich et al, 17 we were able to assess 15 high risks as shown in Table 3. Our HRA did not assess life or job satisfaction and these were replaced with questions about fatty diet consumption (assessed through HRA questionnaire) and fasting blood glucose (assessed through blood tests). For the former we asked, “How often do you eat foods high in unhealthy fats, such as red meats, oils, fried foods, bakery goods, or high-fat dairy products?” Responses that indicated consumption several times a day, once a day or several times a week were considered high risk. For some of the high-risk evaluations, our HRA had slightly modified questions, which are also indicated in Table 3.
Edington's safety belt use criteria assessed anyone using a safety belt less than 90% of the time as high risk. The question in our HRA asked, “How much of the time do you buckle your safety belt when driving or riding?” and gave the following as response choices: always, usually, sometimes, rarely, or never. We defined high risk as those employees answering, “sometimes,” “rarely,” or “never.”
Similarly, for physical activity Edington defined high risk as those who exercised less than 1 time per week. Our physical activity questions were worded, “On average, how often do you engage in moderate physical activity for 30 minutes or more?” and “On average, how often do you engage in vigorous physical activity for 20 minutes or more?” Examples of moderate physical activity given to employees were brisk walking, cycling, vacuuming, and gardening. Examples of vigorous physical activity given to employees were heavy lifting, running, aerobics, and fast cycling. The choices available for each of the two questions included: never, 1 day per week, 2 days per week, 3 days per week, 4 days per week, 5 days per week, 6 days per week, or every day. To be assessed as high risk in our analysis the employee would need to have answered “never” to both of the physical activity questions.
Table 3 shows the rest of the 15 criteria used in our study and how they compared to Edington. 14 Following Edington, we define employees with 0–2 health risks as low risk, those with 3–4 health risks as moderate risk, and those with 5 or more health risks as high risk.
Procedure
We examined trends in health risks, health-related absences, and perceptions of health among 2606 employees who completed an HRA, biometrics, and lab tests in both 2008 and 2009. Both internal and external comparisons were done to identify the impact of the intervention program. The internal analysis compared the change in outcomes for employees who experienced an improvement or reduction in health risks to employees who experienced no change in health risks and, separately, employees whose health risks worsened. The specific outcomes of interest are changes in health risks, health-related absences, and employees' perceptions of their own health. The external analysis compared changes in health risks between the employees in the program and the “unmanaged” employees from Edington's Natural Flow. We conducted 2-sided hypothesis tests and, depending on the statistic, report significance at the .05, .01, or .001 level.
Results
Aggregate health transitions
Table 1 summarizes the demographics of the baseline and 1-year follow-up of the Prevention Plan™ participants (n = 2606). A significantly greater percentage of this cohort was female (69.3%); the average age for the cohort was 39 years.
In Table 4 we report the distribution of health risk levels among the participants in 2008 and 2009. In 2008, a total of 1452 employees (55.72%) were identified as low risk, 809 (31.04%) were identified as moderate risk, and 345 (13.24%) were identified as high risk. In 2009, the overall risk distribution for these employees improved with 1697 (65.12%) at low risk, 715 (27.44%) at moderate risk, and 194 (7.44%) at high risk.
We found that the employees showed a significant improvement after exposure to The Prevention Plan™ program. Relative to 2008, the proportion of low-risk employees in the program in 2009 was 9.40 percentage points higher, the proportion of moderate-risk employees was 3.61 percentage points lower, and the proportion of high-risk employees was 5.79 percentage points lower (P < 0.01, n = 2606).
In Figure 1, we show the risk level transitions of the cohort from 2008 to 2009 using the Markov chain analysis. For employees in the high-risk category (5 or more high-risk factors) at baseline, 35.7% remained at high risk, 48.7% moved to moderate risk, and 15.7% moved to low risk. For employees in the moderate-risk category (3–4 high-risk factors) at baseline, 45.9% remained at moderate risk, 46.4% moved to low risk, and 7.7% moved to high risk. We find that 87.3% of low-risk employees (0–2 high risk factors) in 2008 remained low risk in 2009, 12.1% of low-risk employees moved to moderate risk, and 0.6% of low-risk employees moved to high risk. These results show a strong net population movement from higher to lower risk levels.
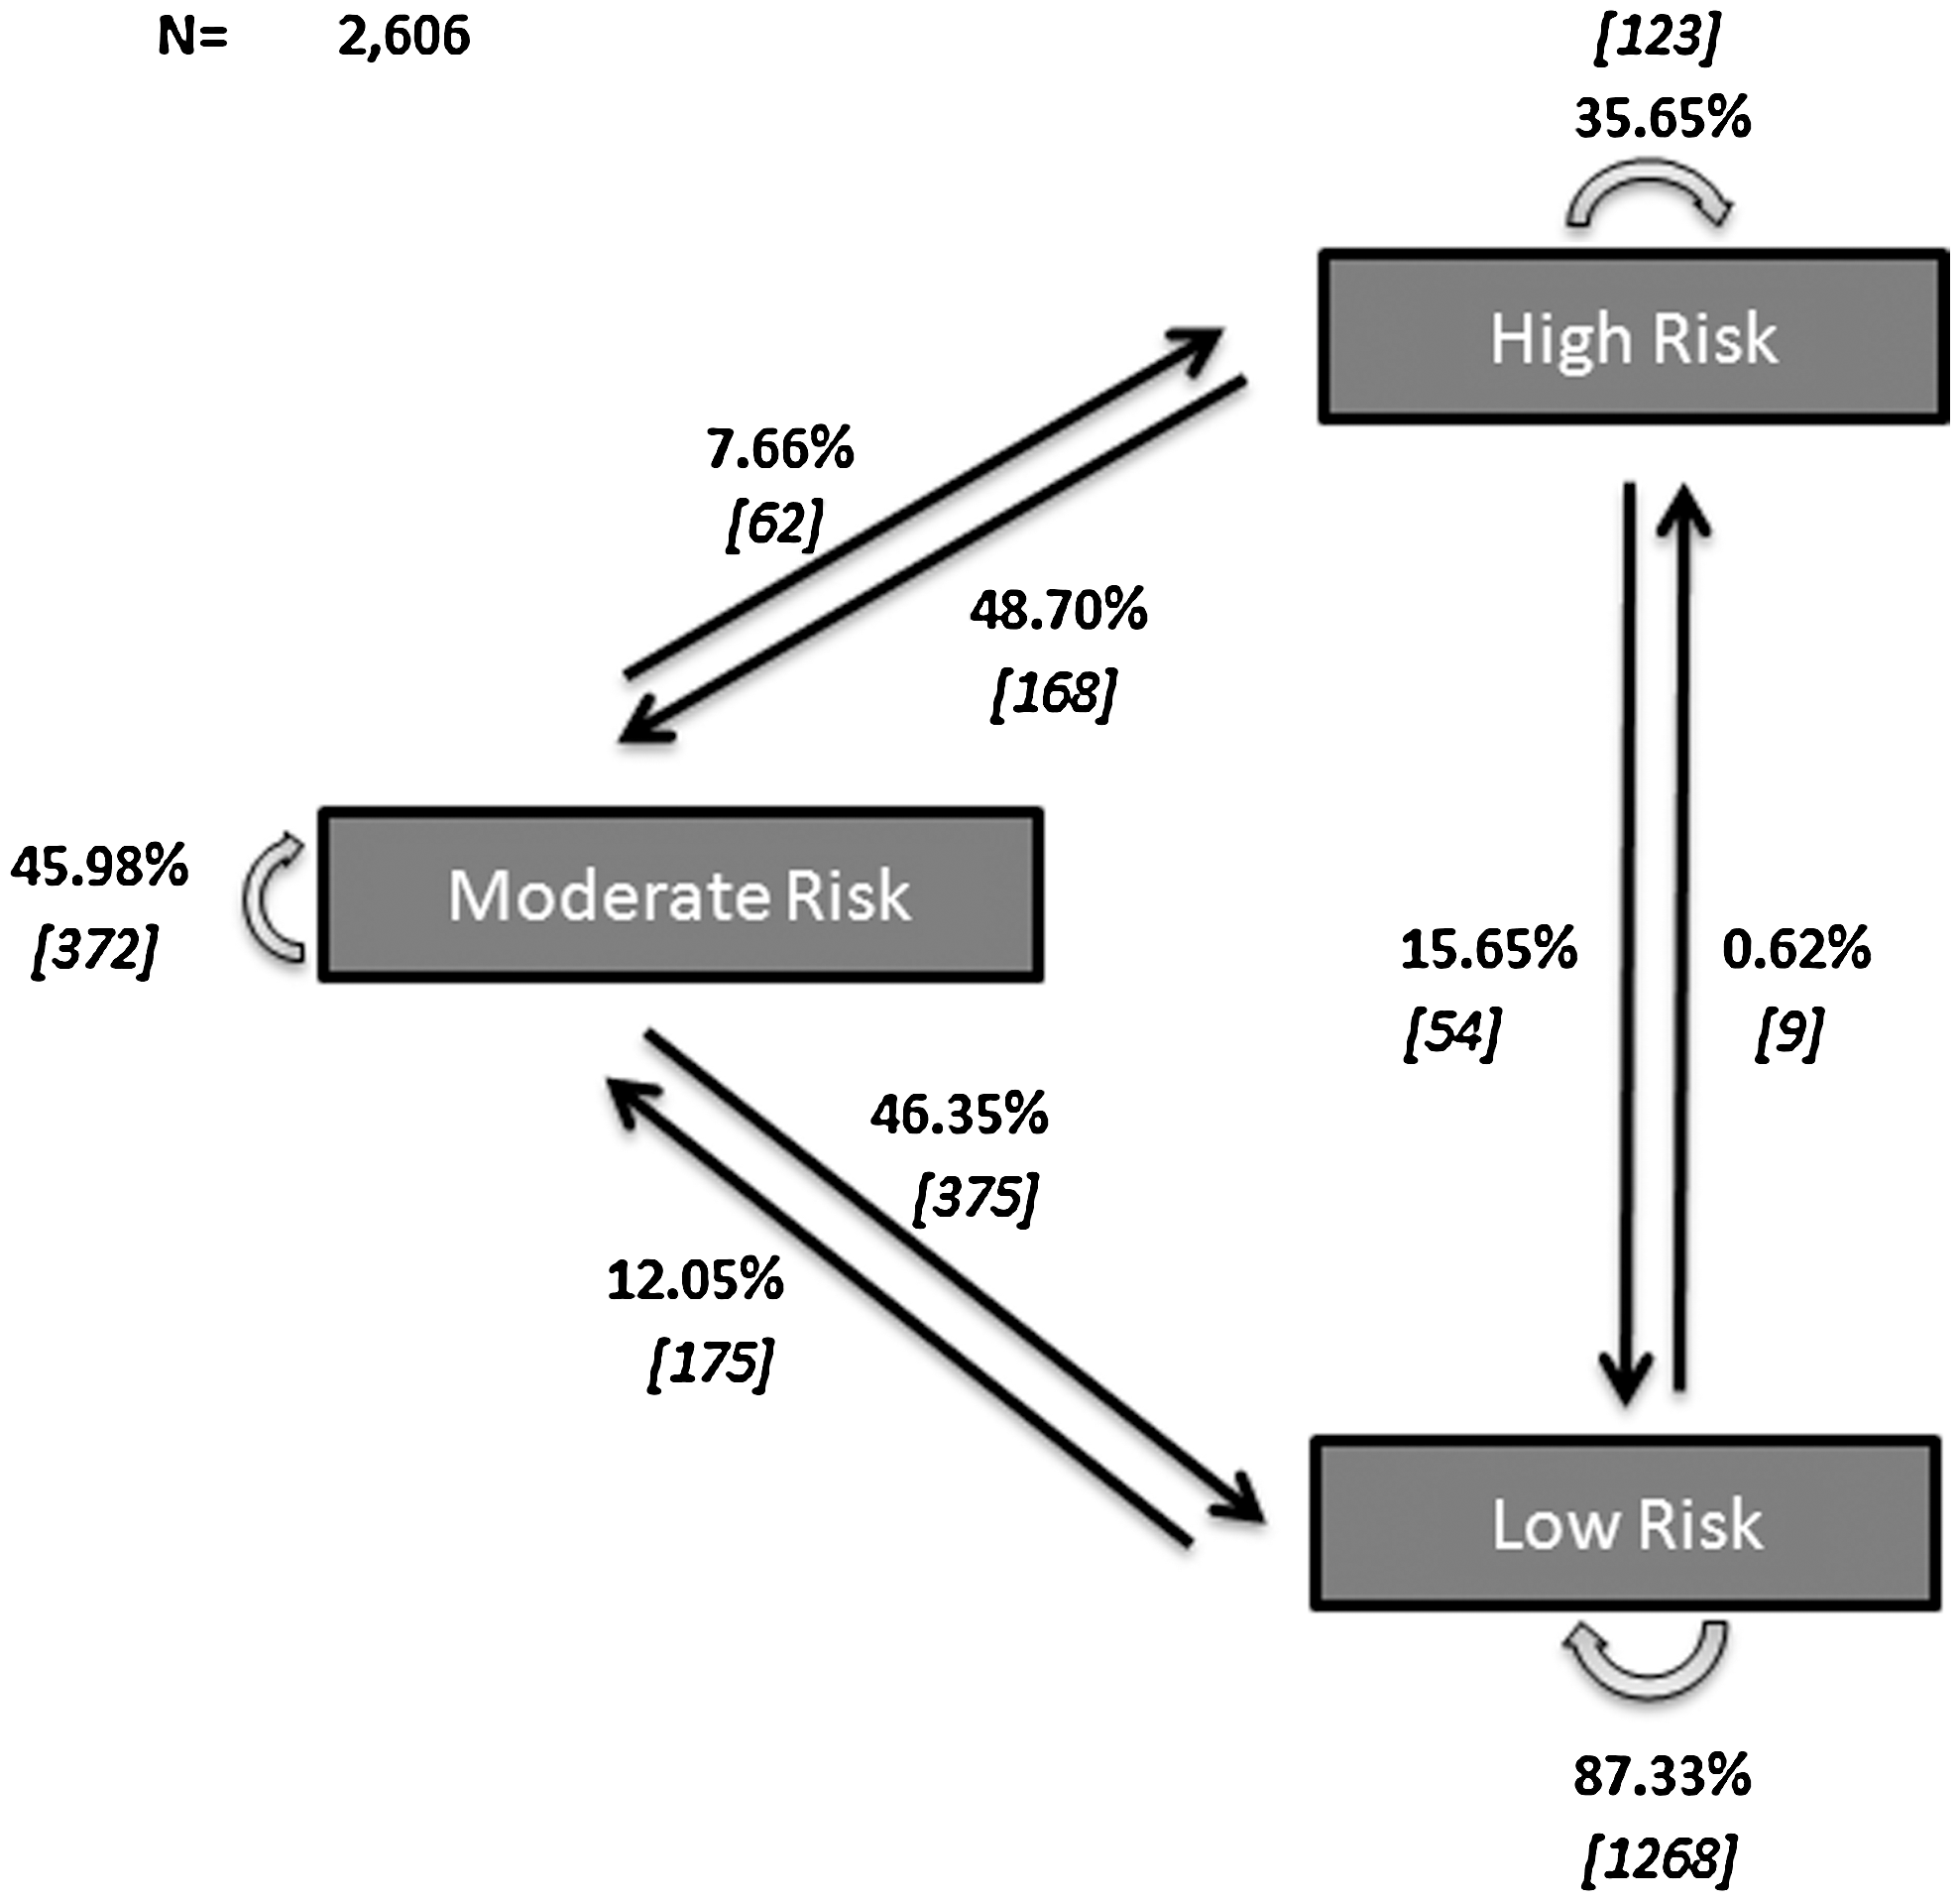
Health risk level transitions between 2008 and 2009.
Accepting the Edington data for Natural Flow 14 as providing a legitimate benchmark comparison, the actual program risk level transitions are also statistically different from the projected natural flow. In Table 5 we report the health risk level transitions among the cohort compared to the Natural Flow. Modeling the Natural Flow's risk level transitions, 31% (107) in our cohort were expected to move from a high-risk level to a moderate-risk level, 35% (283) from a moderate-risk level to low risk, 6% (21) from a high-risk level to low risk, and 70% (1016) were expected to remain in the low-risk category.
The actual program risk level transitions were statistically different (P < 0.01) from the projected natural flow distribution with 48.70% (168) in our cohort moving from a high-risk level to a moderate-risk level, 46.35% (375) moving from moderate risk to low risk, 15.65% (54) moving from high risk to low risk, and 87.33% (1268) remaining in the low-risk category.
In Table 6 we summarize the Natural Flow and The Prevention Plan™ comparing the percentage of employees whose health risks improved, remained unchanged, or worsened overall. As can be seen in the table, The Prevention Plan had a statistically significant (P ± 0.001) risk transition compared to the Natural Flow, with 22.91% having lowered risk, 67.65% with unchanged risk, and 9.44% moving into higher risk levels. Evaluating the percent unchanged further indicates that although 67.65% were in this unchanged category, 71.92% of them were those employees who remained in the low-risk category, 21.10% were those who remained unchanged in the moderate-risk category, and 6.98% were those who remained unchanged in the high-risk category.
Transition based on number of individual risks identified.
In Table 7 we went a step further and analyzed the distribution of risk level change based on the number of individual risks identified in 2008 and 2009. Instead of using the broader category of low (0–2 high risks), moderate (3–4 high risks), and high (5+ high risks), the risk levels were broken down into the number of individual risks identified.
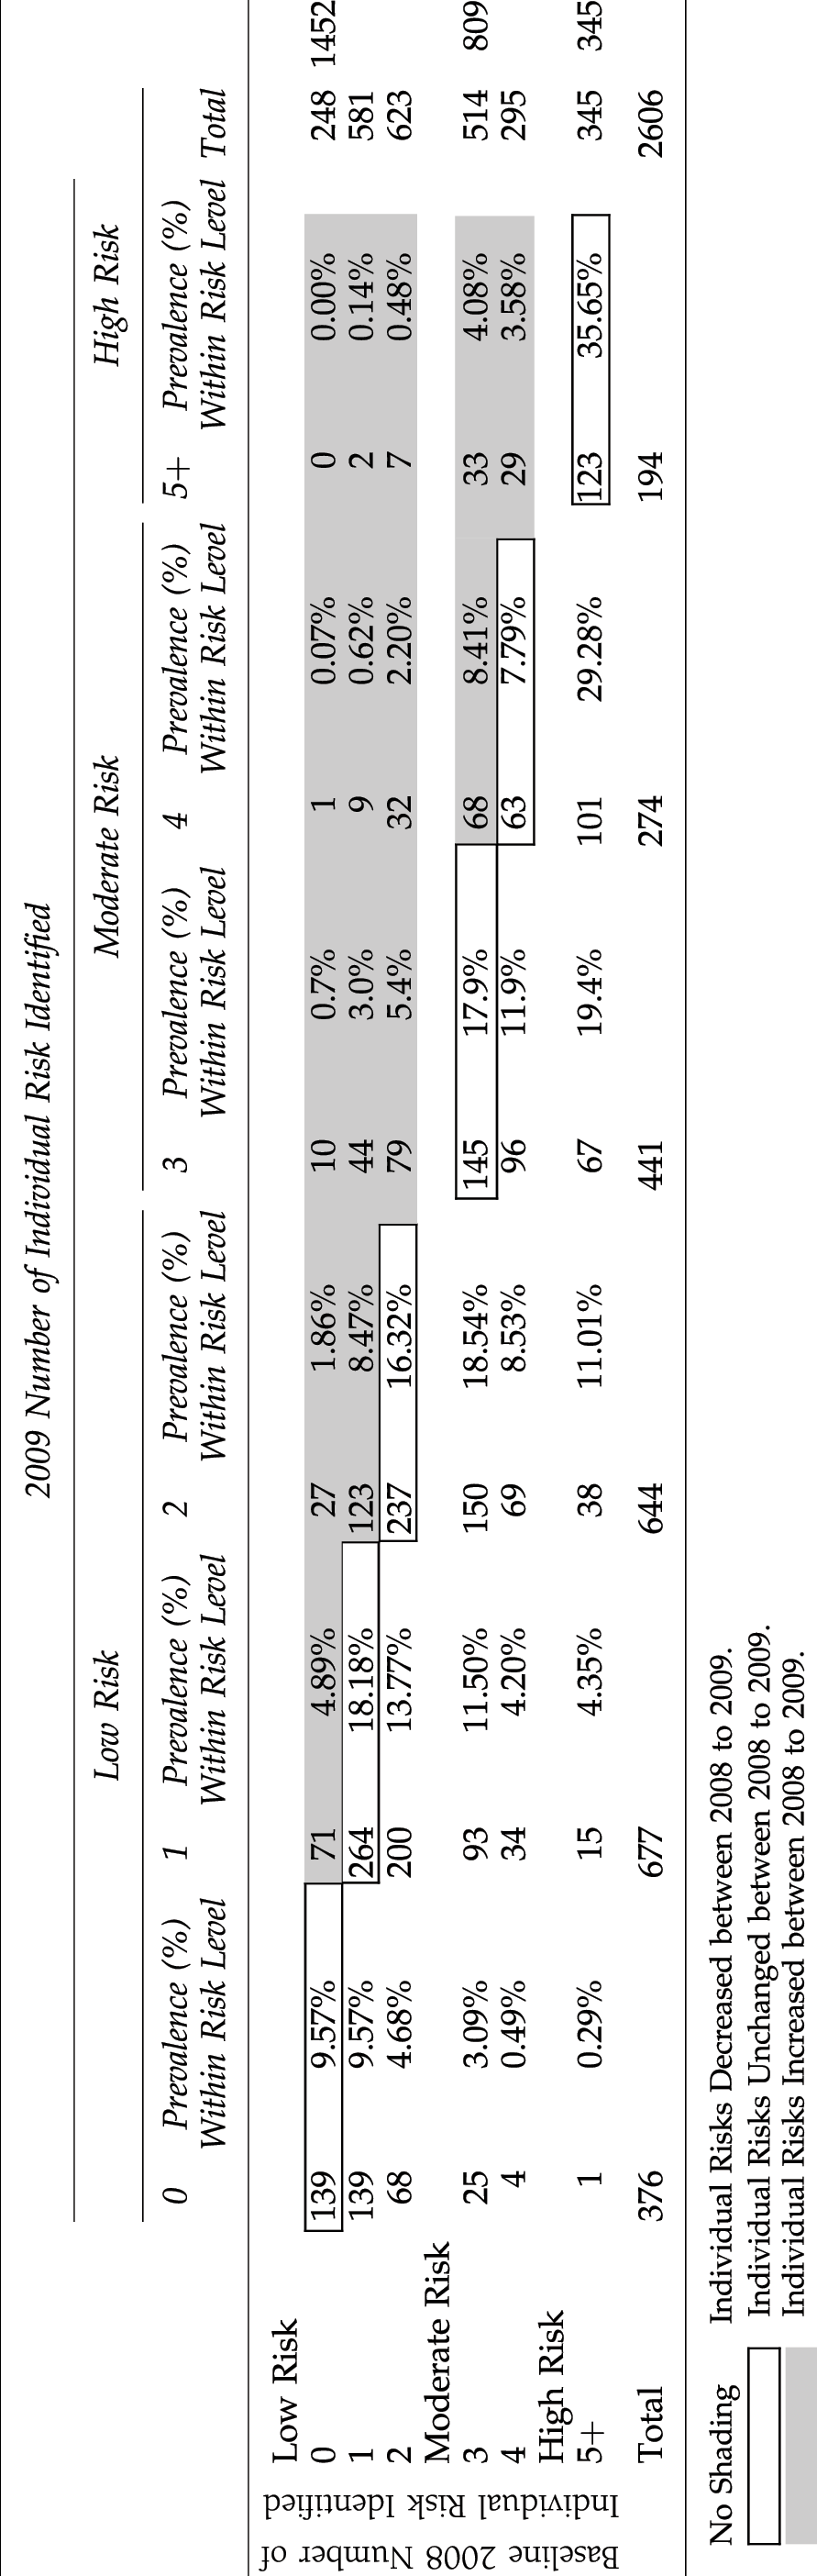
From this table, one can observe who is reducing and adding risks from 2008 to 2009. For example, of those who were low risk in 2008 (n = 1452), 139 (9.57%) had 0 high risks and stayed at 0 high risks in 2009. Similarly, 71 (4.89%) had 0 high risks in 2008 but moved to 1 high risk in 2009, 27 (1.86%) moved to 2 high risks in 2009, and 10 (0.7%) moved to 3 high risks in 2009. Following the same logic in the table, one can further track the other number of individual risks identified (1, 2, 3, 4, and 5+) in 2008 and see their corresponding movement in 2009. Table 8 summarizes this transition and, as can be seen, overall 1100 (42.21%) had a decrease in number of individual risks in 2009, 971 (37.26%) remained unchanged, and 535 (20.53%) had an increase in the number of high risks between 2008 and 2009.
As expected, these numbers are different from those identified in Table 6 because of the more granular analysis. In fact, when we look at the individual risk movements within the risk categories at this magnification, there is a striking increase in the number of people showing health risk improvement – 42.21% of the entire cohort of 2606 when we look at individual risk transitions vs. 22.91% of the entire cohort of 2606 when we look at the broader risk categories.
Taking this a step further, we also focused on the broader 5+ risk category (5–15 risks). Because this risk level consists of all individual risks 5–15, we expected that individual risks within this level may have shown changes but that these would not have been picked up by when they were combined in the general high-risk category. We concluded that by setting the trigger point for data analysis of the high-risk category to be individuals with 5 or more high-risk factors, we would miss the potential movement of individual risks within that broad category. Therefore, upon more detailed analysis, we discovered that although it seemed that 123 (35.65%) high-risk individuals from 2008 showed no change in 2009 (ie, they remained in the high-risk level), there actually was some significant risk reduction in individual risk factors within that broader high-risk category. By breaking this group down further into individual risk levels (6, 7, 8, 9, and 10+ individual risks), we were able to measure that 40 people (32.52% of the 123 people who remained “unchanged” in the high-risk category) actually did lower their number of health risks. For example, this included 20 people who had 6 individual risks identified in 2008, and who moved down to 5 individual risks in 2009. Similarly, 6 people who had 7 individual risks identified in 2008 moved down to 6 individual risks in 2009; of the people who had 8 individual risks identified in 2008, 3 moved to 7 risks and 3 moved to 6 risks in 2009. Only 57 people (46.34% of the 123 people who remained in the high-risk category) remained truly unchanged between 2008 and 2009.
Transitions in specific health risks
In Table 9, we report the net change in individual high health risks. The table includes the number of employees who had a particular high health risk in 2008 and 2009 and the percent decrease in those risks in 2009 (8 at P ≤ 0.01 and 2 at P ≤ 0.05). Use of drugs for relaxation, existing medical conditions, smoking, and body mass index (BMI) showed a slightly higher percentage at high risk in 2009 but these were not statistically significant at P ≤ 0.05. Of note is a decrease in 2009 of 169 people who had high-risk blood pressure and a decrease of 146 people who had a high fasting blood sugar in 2008 (both at P ≤ 0.001). Similarly, people who reported fatty diet consumption decreased by 255 in 2009 (P ≤ 0.001). There were other relatively large reductions for stress, alcohol, cholesterol, improvements in physical activity, and perceptions of health.
HDL, high-density lipoprotein cholesterol.
Many studies have found that improvements in diet and exercise contribute to reductions in high blood pressure, high fasting blood sugar, and high cholesterol. 18 –21 Although we did not see a statistically significant change in BMI over 1 year, an improvement in exercise and/or diet may trigger improvements in obesity over the next few years similar to or greater than the improvements in blood pressure, fasting blood glucose, and/or cholesterol we have already seen.
Discussion
Reducing health risks is a critical goal for employers because it has been shown to reduce health care costs and improve productivity in the workplace. 12 ,14, 22 –25 This study evaluated the impact of The Prevention Plan™ on employee health risks after 1 year of integrated primary prevention (wellness and health promotion) and secondary prevention (biometric and lab screening as well as early detection) interventions. The study demonstrates that The Prevention Plan™ reduces key employee health risk factors and effectively moves employees to lower overall health risk categories. It also reinforces the view that comprehensive, evidence-based primary and secondary prevention programs can begin achieving measurable health improvements in the first year of intervention. The Prevention Plan™ yielded strong levels of employee participation, personalized prevention recommendations, and health coach advocacy, which may well have had an impact on the level of individual engagement and progress and, therefore, the level of results.
This study also provides insight into the health risks that can be most quickly addressed through comprehensive health management. The most significant were a reduction in the proportion of employees with high-risk blood pressure, high-risk fasting blood sugar, and high-risk stress. Of note is the fact that the first two are data points obtained through actual measurements—blood pressure reading and a blood glucose test. The significant improvement in the fasting blood test—an actual test and not a self-reported questionnaire response – is especially indicative of the success of the program over 1 year. In addition, employees showed improvement in cholesterol levels, physical activity, a reduction in fatty diet, and a reduction in heavy drinking. The population also achieved a reduction in health-related illness days and improvement in perception of health. While we did not see a measurable reduction in the high-risk sector on BMI over the 1-year time period of this study, we know that there may well have been weight loss by people who had a much higher BMI at baseline but did not lose enough weight to get under the high-risk threshold of 27.8. We also realize that there can be a lag between improved physical activity and healthy eating and corresponding weight loss outcomes.
In this study, we went a step further and analyzed the distribution of risk level change across the cohort of employees (n = 2606) based on both health risk category transitions as well as the number of individual risks transitioned in 2008 and 2009. Therefore, when measuring the risk transitions among the broader categories of low (0–2 high risks), moderate (3–4 high risks), and high (5+ high risks) we also looked more closely at individual risk movements within those risk categories. We observed that while 22.91% of the cohort showed improvement based on the broader low-, moderate-, and high-risk categories, a much higher percent of the cohort (42.21%) had actual reductions in individual health risk factors. We believe this higher level of analysis is important to consider in studies because the broader risk categories may otherwise miss the fact that these individuals in reality have had a decrease in the number of risk factor(s).
Similarly, we applied this higher lens of granular analysis to detect health risk movement within the 5+ high-risk category (5–15 health risks). Upon more detailed analysis, we concluded that although it seemed that 123 people (35.65% of the high-risk individuals) from 2008 showed no change in 2009 (ie, they remained in the high-risk level), there actually was some significant risk reduction in individual risk factors within the broader high-risk category.
By breaking this group down further into individual risk levels (6, 7, 8, 9, and 10+ individual risks), we were able to detect that 40 people (32.52% of the 123 people who remained “unchanged” in the high-risk category) did actually lower their number of health risks—even though they remained in the high-risk category. For example, this included 20 people who had 6 individual risks identified in 2008, and who moved down to 5 individual risks in 2009. Similarly, 6 people who had 7 individual risks identified in 2008 moved down to 6 individual risks in 2009 and of the people who had 8 individual risks identified in 2008, 3 moved to 7 risks and 3 moved to 6 risks in 2009. Only 57 people (46.34% of the 123 people who remained in the high-risk category) remained truly unchanged between 2008 and 2009.
It is also important to note that keeping the low-risk individuals in that category between years should be considered as much an indicator of success as moving people from high risk to lower risk levels, given the natural flow of the population toward higher risk levels. 14 As was evident in this study, The Prevention Plan™ was successful in having a high number (87.33%) of employees remain in the low-risk category.
Research has shown that as prevention and health improvement interventions reduce health risks, reduction in health care costs and improvement in health-related productivity follows. Conversely, those who remain at high risk or have an increase in their risks over time have increased health care costs and experience a decline in their productivity. 25,27 In fact, some studies have shown a linear trend of improved productivity for those employees who reduced the greatest number of health risks and decreased productivity among those who increased health risks. 26 Burton et al have concluded that for each risk factor changed, there is a 1.9% change in self-reported productivity loss. 26,27
Study Limitations
As is the case with most studies, this study has a few limitations. Because participation in the program was voluntary, there may be some selection bias through self-selection. Furthermore, certain groups of employees may be underrepresented in the cohort, which may also impact the results. The small number of certain subsets identified also means that this may not be a true representation of the population. In this type of a study, the Hawthorne effect is always a concern. Participants may report better answers in the HRA for no reason other than the fact that they are being questioned. The fact that our 15 risk factors did not exactly match the ones from the Natural Flow, that some of the questions were asked differently, and that others had different options for answers, may also impact our results. Comparing to the Natural Flow as opposed to the nonparticipating cohort of employees from the 3 employer groups may also have been a limiting factor. Similarly, risk factors such as high blood pressure and high fasting blood sugar may actually represent health conditions and not just health risk factors, which may have been impacted by treatment rather than by lifestyle changes alone. Lack of adjustment for age and sex to the Natural Flow further limits the nature of our conclusions.
The short duration (1-year outcome measurements) also means that these changes over 1 year may not necessarily translate into real outcomes that indicate permanent, or at least persistent, health improvements. The study population would need to be followed and evaluated over the next few years. Nevertheless, despite these types of limitations, the literature is filled with studies that show that HRAs are an effective means to assess a population's health risk level and can be used to evaluate and monitor the health of employees. 28 –30
Conclusion
Large-scale, population-based changes in health behaviors require a multipronged approach to be successful. Interventions that lead to better health outcomes and subsequent lower health care costs take time. With various stakeholders - from the government to private businesses - all playing a role, much can be accomplished. One of the key factors in tackling lifestyle behaviors will continue to be the education and engagement of the individual in his or her own health. With the power of the Internet, mobile phones, and applications, for the first time in human history we have the ability to directly reach and engage the vast majority of Americans in a literal movement toward better health. The Prevention Plan™, an innovative prevention benefit with engaging technology and interactive Web-based tools as well as high-touch outreach by health coaches, provides evidence that personalized prevention recommendations and health coaching advocacy can reduce health risks by engaging individuals to be more proactive about their health. The first year results outlined in this study provide a glimpse into the impact such programs can have even over a relatively short period of time.
Furthermore, this study yields more evidence for the business case that prevention is an investment to be leveraged rather than a cost to be justified. It also supports the premise that our health care ecosystem would benefit by focusing as much on the health as we do on the care of people. In that way, we could strengthen our current reactive, illness-oriented sick care system by structuring a more proactive, wellness-oriented health care system built upon the pillars of prevention.
Footnotes
Author Disclosure Statement
The authors reported no conflicts of interest.