
Abstract
The objective of this cross-sectional, retrospective study assessing commercially insured patients was to provide a useful benchmark to US health care payers and decision makers to assess quality of care, medication use and adherence, and health care resource utilization/costs associated with common chronic diseases. Measures of quality of care were suboptimal and substantial numbers of patients were not using any pharmacotherapy considered acceptable according to treatment guidelines. The widespread nature of undertreatment, poor medication adherence, and substantial health care costs highlights deficits and points to the need for comprehensive, multifaceted strategies to improve clinical and economic outcomes for chronic diseases. (Population Health Management 2011;14:33–41)
Introduction
Despite recent major advances in understanding the pathophysiology of common chronic diseases and in the proliferation of new medical and pharmaceutical options for management of disease, chronic diseases continue to exact enormous human and economic tolls. For example, diabetes has reached epidemic proportions in the United States and is among the nation's most costly diseases in both human and economic terms. 7 The annual direct and indirect costs of diabetes and its complications exceed $105 billion in the United States. More than 1 of every 10 US health care dollars and 1 in 4 Medicare dollars are spent on patients with diabetes. 7 By 2050, the prevalence of diagnosed type 2 diabetes is projected to increase by approximately 165% in the United States, compared with 2000, and costs of diabetes care are projected to increase accordingly. 8,9
Why have efforts to reduce the human and economic toll of chronic diseases not been more effective? Data from several sources point to deficits in adherence to recommended processes for basic care as an important factor in the failure to reduce the personal and economic impacts of disease. Receipt of evidence-based care and medication adherence each strongly predict clinical and economic outcomes across chronic diseases 10 –16 and are arguably among the most important factors affecting morbidity and mortality. Data from the Community Quality Index (CQI) study demonstrated that adults living in the United States received only about half of recommended processes involved in basic care (54.9% of preventive care, 53.5% of acute care, 56.1% of chronic care). 17 While providing very useful information regarding evidence-based practices, the CQI study methods are currently not replicable for the majority of managed care organizations (MCOs) in their ongoing assessment and management of quality care.
MCOs and self-insured employers have traditionally used a disease-based, utilization approach (eg, therapies used, per member per year cost) through payment claims data to help them assess and manage patient care and the cost of care. Larger firms, particularly those with a national presence, have enough data available to isolate groups and benchmark against themselves. However, because these data are proprietary, there is often no benchmark data available to assess how rates compare overall to national averages. This is especially difficult for smaller firms. Although no publicly available claims database can produce a weighted national benchmark relevant to every commercial MCO, this type of data from a large national data source, provided publicly on an ongoing basis using standardized, transparent methodology, could potentially provide a useful platform for any number of interested organizations to assess national trends and approach a benchmark for their care assessment and management.
The objective of this study was to provide a useful benchmark to US health care payers and decision makers to assess quality of care, medication use and adherence, and health care resource utilization and costs associated with common chronic diseases using readily available claims data.
Methods
This study was a cross-sectional, retrospective study utilizing a commercial database to assess care associated with 8 common conditions: asthma, chronic obstructive pulmonary disease (COPD), coronary artery disease (CAD), new depression, diabetes, heart failure (HF), hyperlipidemia (HL), and hypertension (HTN). These conditions were chosen based on their high rate of disease prevalence, resource utilization, and the availability of nationally recognized treatment guidelines.
Data source
This study utilized the Ingenix Impact National Managed Care Benchmark Database. 18 The database, which is fully de-identified and Health Insurance Portability and Accountability Act compliant, includes data from more than 45 commercial MCOs covering 9 census regions and contains the complete medical and pharmacy claims records for more than 65 million patients seen in the commercial setting, making it representative of the US commercially insured population younger than 65 years of age. The database contains administrative claims with linked patient enrollment eligibility, pharmacy, and physician/medical claims information and is one of the largest, most diverse publicly available claims databases in the United States.
Sample
In order to establish an annual benchmark assessment of utilization, all analyses were conducted using 2007 data. Patients were either identified in 2006 or in the first 6 months of 2007 and were required to be eligible for services the last day of 2007 to ensure they were active, relevant patients. The design allowed new patients to enter the study population during 2007 but required at least 6 months of follow-up to be included. Here, the intent was to include patients entering the patient mix during 2007 who would have been of interest for current year assessment and current year care management activities. Specifically, patients with at least 1 of the 8 target conditions (asthma, COPD, CAD, depression, diabetes, HF, HL, HTN) were identified (based on disease-specific criteria described in Table 1) using data from Jan 1, 2006 to June 30, 2007 for all conditions except depression. New episode depression patients were identified using data from Jan 1, 2007 to Jun 30, 2007. New episode depression patients were excluded if they had a depression diagnosis or antidepressant medication in the prior 6 months. All measurements were conducted and reported using 2007 data to calculate 2007 rates. In order to select “active” patients who were currently enrolled and had enough data to help ensure relevance, patients identified for each condition were required to have been continuously eligible for at least 6 months after their identification date and were required to be eligible for services on the last date of the available data (December 31, 2007). The first identification of any condition (ID index) was based on the first occurrence of the inclusion criteria.
Measures and data analysis
All data were summarized with descriptive statistics; no hypothesis testing was undertaken. Data were summarized separately for each condition.
Because a goal of this study was to provide a benchmark descriptive assessment from the health system point of view, patient comorbidities were not controlled. Patients were allowed to be included in more than 1 condition-based cohort.
Quality measures
Measures of quality of care were determined for asthma, COPD, depression, and diabetes in 2007. These conditions were chosen based on the availability of current national guidelines assessing overall quality indicators of care or other claims-based markers available that could provide an indication of quality such as asthma and rescue medication use. The measure of quality of care for asthma included the percentage of patients with 12 months of coverage who filled 4 or more short-acting beta-agonist prescriptions. This measure was chosen because the frequent use of rescue medications has been shown to increase the risk of exacerbation. 5,19 This measure is not definitive but rather intended to identify what proportion of patients are potentially uncontrolled as well as which patients and/or providers might benefit from intervention.
Measures of quality of care for COPD included the percentages of patients with 12 months of coverage who had a Level II exacerbation (COPD-related hospitalization) and/or a Level III exacerbation (respiratory failure). 20 Based on Agency for Healthcare Research and Quality clinical practice guidelines, 21 the quality of care measure for depression was the percentage of newly diagnosed patients with depression who filled at least 1 antidepressant prescription in 90 days from the index diagnosis. Measures to assess diabetes care quality were based on American Diabetes Association guidelines 22 and included the percentages of patients with at least 1 A1c test, at least 1 low-density lipoprotein (LDL) test, an eye exam, as well as the percentage of patients who received the minimally acceptable number of ≥2 A1c tests in a year for patients with at least 12 months of continuous coverage.
Medication use, persistence, and compliance
The percentage of patients who filled a prescription for any acceptable therapy throughout the year was calculated for each disease with the exception of depression, for which 6 months from index date was utilized. “Any acceptable therapy” was defined for each condition according to disease-specific national treatment guidelines. 5,20,21,23 –27 Treatment guidelines and all classes of medications used are listed in Table 1. Medication use for diabetes was calculated for all patients on medications and then more specifically for oral diabetes medications.
Medication persistence was calculated for patients filling at least 1 acceptable medication and utilized a form of the proportion of days covered (PDC), defined as the total days of supply from the first fill to the end of the year for all conditions except depression, which was calculated from the first fill of a newly identified episode through 6 months. The percentage of patients with persistence ≥80% was determined. By definition, patients must have had at least 1 fill in 2007 for the medication of interest and at least 6 months of eligibility from the first prescription fill to the last day of available data in 2007, or to the end of the 6-month period for depression, in order to be included in the persistence analyses.
Medication compliance was calculated for patients who filled at least 2 acceptable medications to assess timeliness of fills and utilized a medication possession ratio (MPR), defined as the total days' supply between the first and last fills (not including the last fill's supply) divided by the total number of days between the first and last fills for any acceptable therapy in the most recent 6 to 12 months for all conditions excluding depression; 6 months was used for depression. As with PDC, MPR was calculated only for patients with at least 6 months of continuous eligibility from the first prescription fill in 2007 to the last day of available data in the same year, or the end of 6 months for depression. The percentage of compliant patients (MPR ≥80%) was determined for each disease.
Patients on insulin therapy were excluded from the diabetes cohort when calculating PDC and MPR rates because the data on this injectable medication were not considered to be as reliable as those for oral medications.
Health care utilization and costs
Measures of health care utilization included the percentage of patients with at least 1 emergency room (ER) visit or at least 1 hospitalization and the mean number of visits by type. Health care cost measures included medical costs, pharmacy costs, and total costs (medical + pharmacy). Medical costs included all inpatient, ER, and outpatient medical claims. Both all-cause and disease-related health care utilization and costs were determined. The costs are allowed payments standardized across health plans using a resource-based relative value scale approach that does not include deductibles, coinsurance or other cost-sharing data. Because follow-up periods varied from 6 to 12 months among patients, data on health care resource use and costs of care were annualized.
Results
Sample
A total of 5,497,103 patients were eligible to be included in the study population. Prevalence (mean age and % gender) were as follows for the 8 select conditions: asthma 4% (31 years, 44% male), COPD 1% (58 years, 50% male), CAD 3% (57 years, 66% male), depression 0.5% (38 years, 38% male), diabetes 5% (52 years, 55% male), HF 1% (57 years, 59% male), HL 17% (50 years, 52% male), and HTN 13% (53 years, 53% male). Sample sizes and relevant samples for all metrics are included in Table 2.
Patients who filled at least 1 medication per guidelines; **Patients who filled at least 1 medication per guidelines and had 6 months of follow-up after first medication fill; **Patients who filled at least 2 medications per guidelines and had 6 months of follow-up after first medication fill.
CAD, coronary artery disease; COPD, chronic obstructive pulmonary disease.
Quality measures
Quality measure results for asthma, COPD, depression, and diabetes are displayed in Figure 1. The percentage of patients with 12 months of coverage who showed potential poor asthma control as reflected in at least 4 short-acting beta-agonist prescription fills was 9%. Of the COPD patients with a full year of coverage, 3% of patients had a Level II or Level III exacerbation. The percentage of patients with newly diagnosed depression having no antidepressant prescription fills in 90 days was 64%. Among those with diabetes and a full year of coverage, the percentage of patients with no A1c test was 44% and those with no LDL test was 48%. The percentage of patients receiving the minimally acceptable number of 2 A1c tests per year was 38% and only 46% had at least one eye exam in a year.
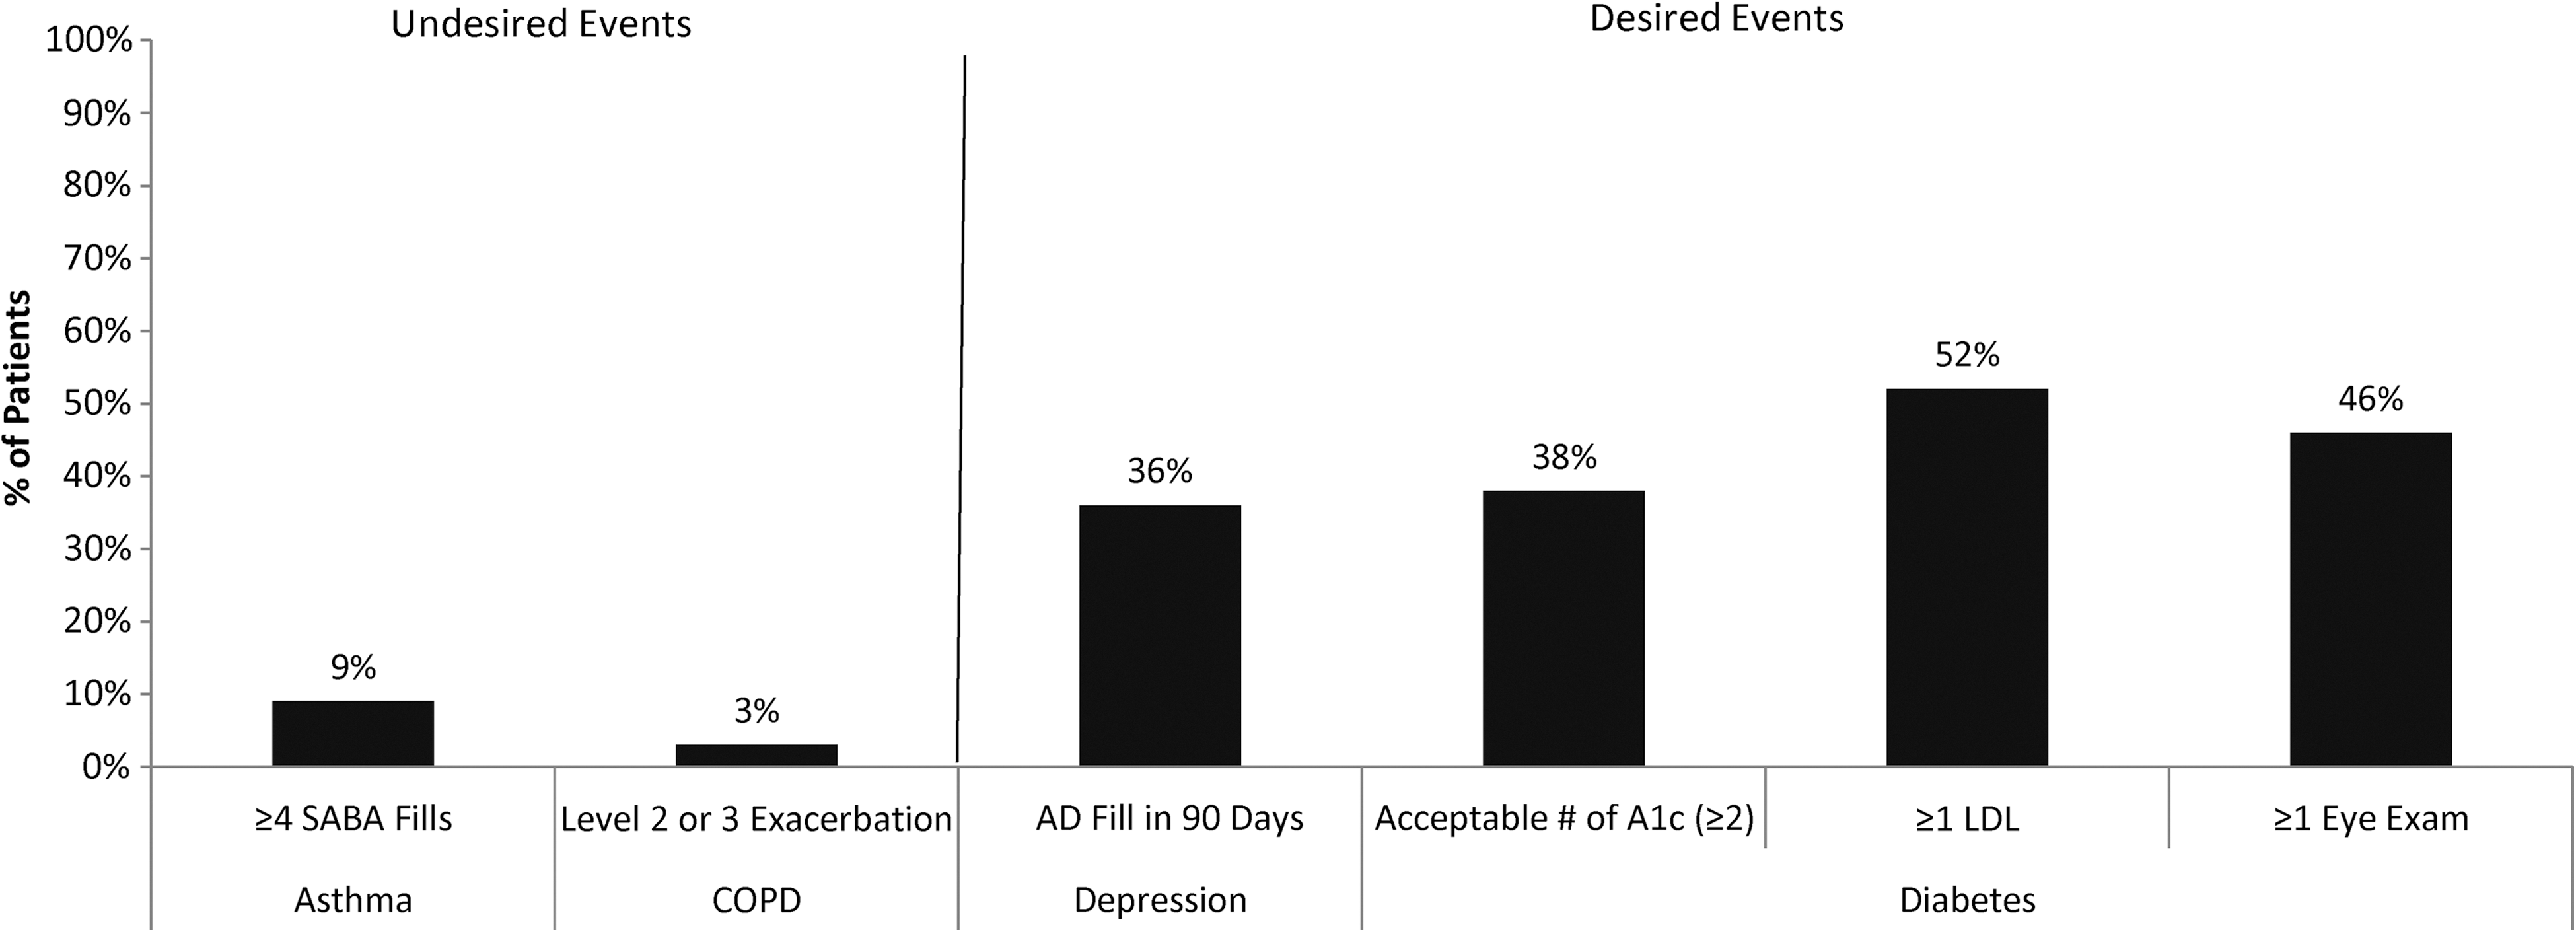
Results of quality of care metrics for asthma, chronic obstructive pulmonary disease (COPD), depression, and diabetes. AD = antidepressant.
Medication use, persistence, and compliance
Any acceptable therapy
The percentage of patients who filled a prescription during 2007 for any pharmacotherapy considered acceptable according to treatment guidelines was low across conditions (Fig. 2). The percentages ranged from a low of 40% for depression to a high of 79% for HF.
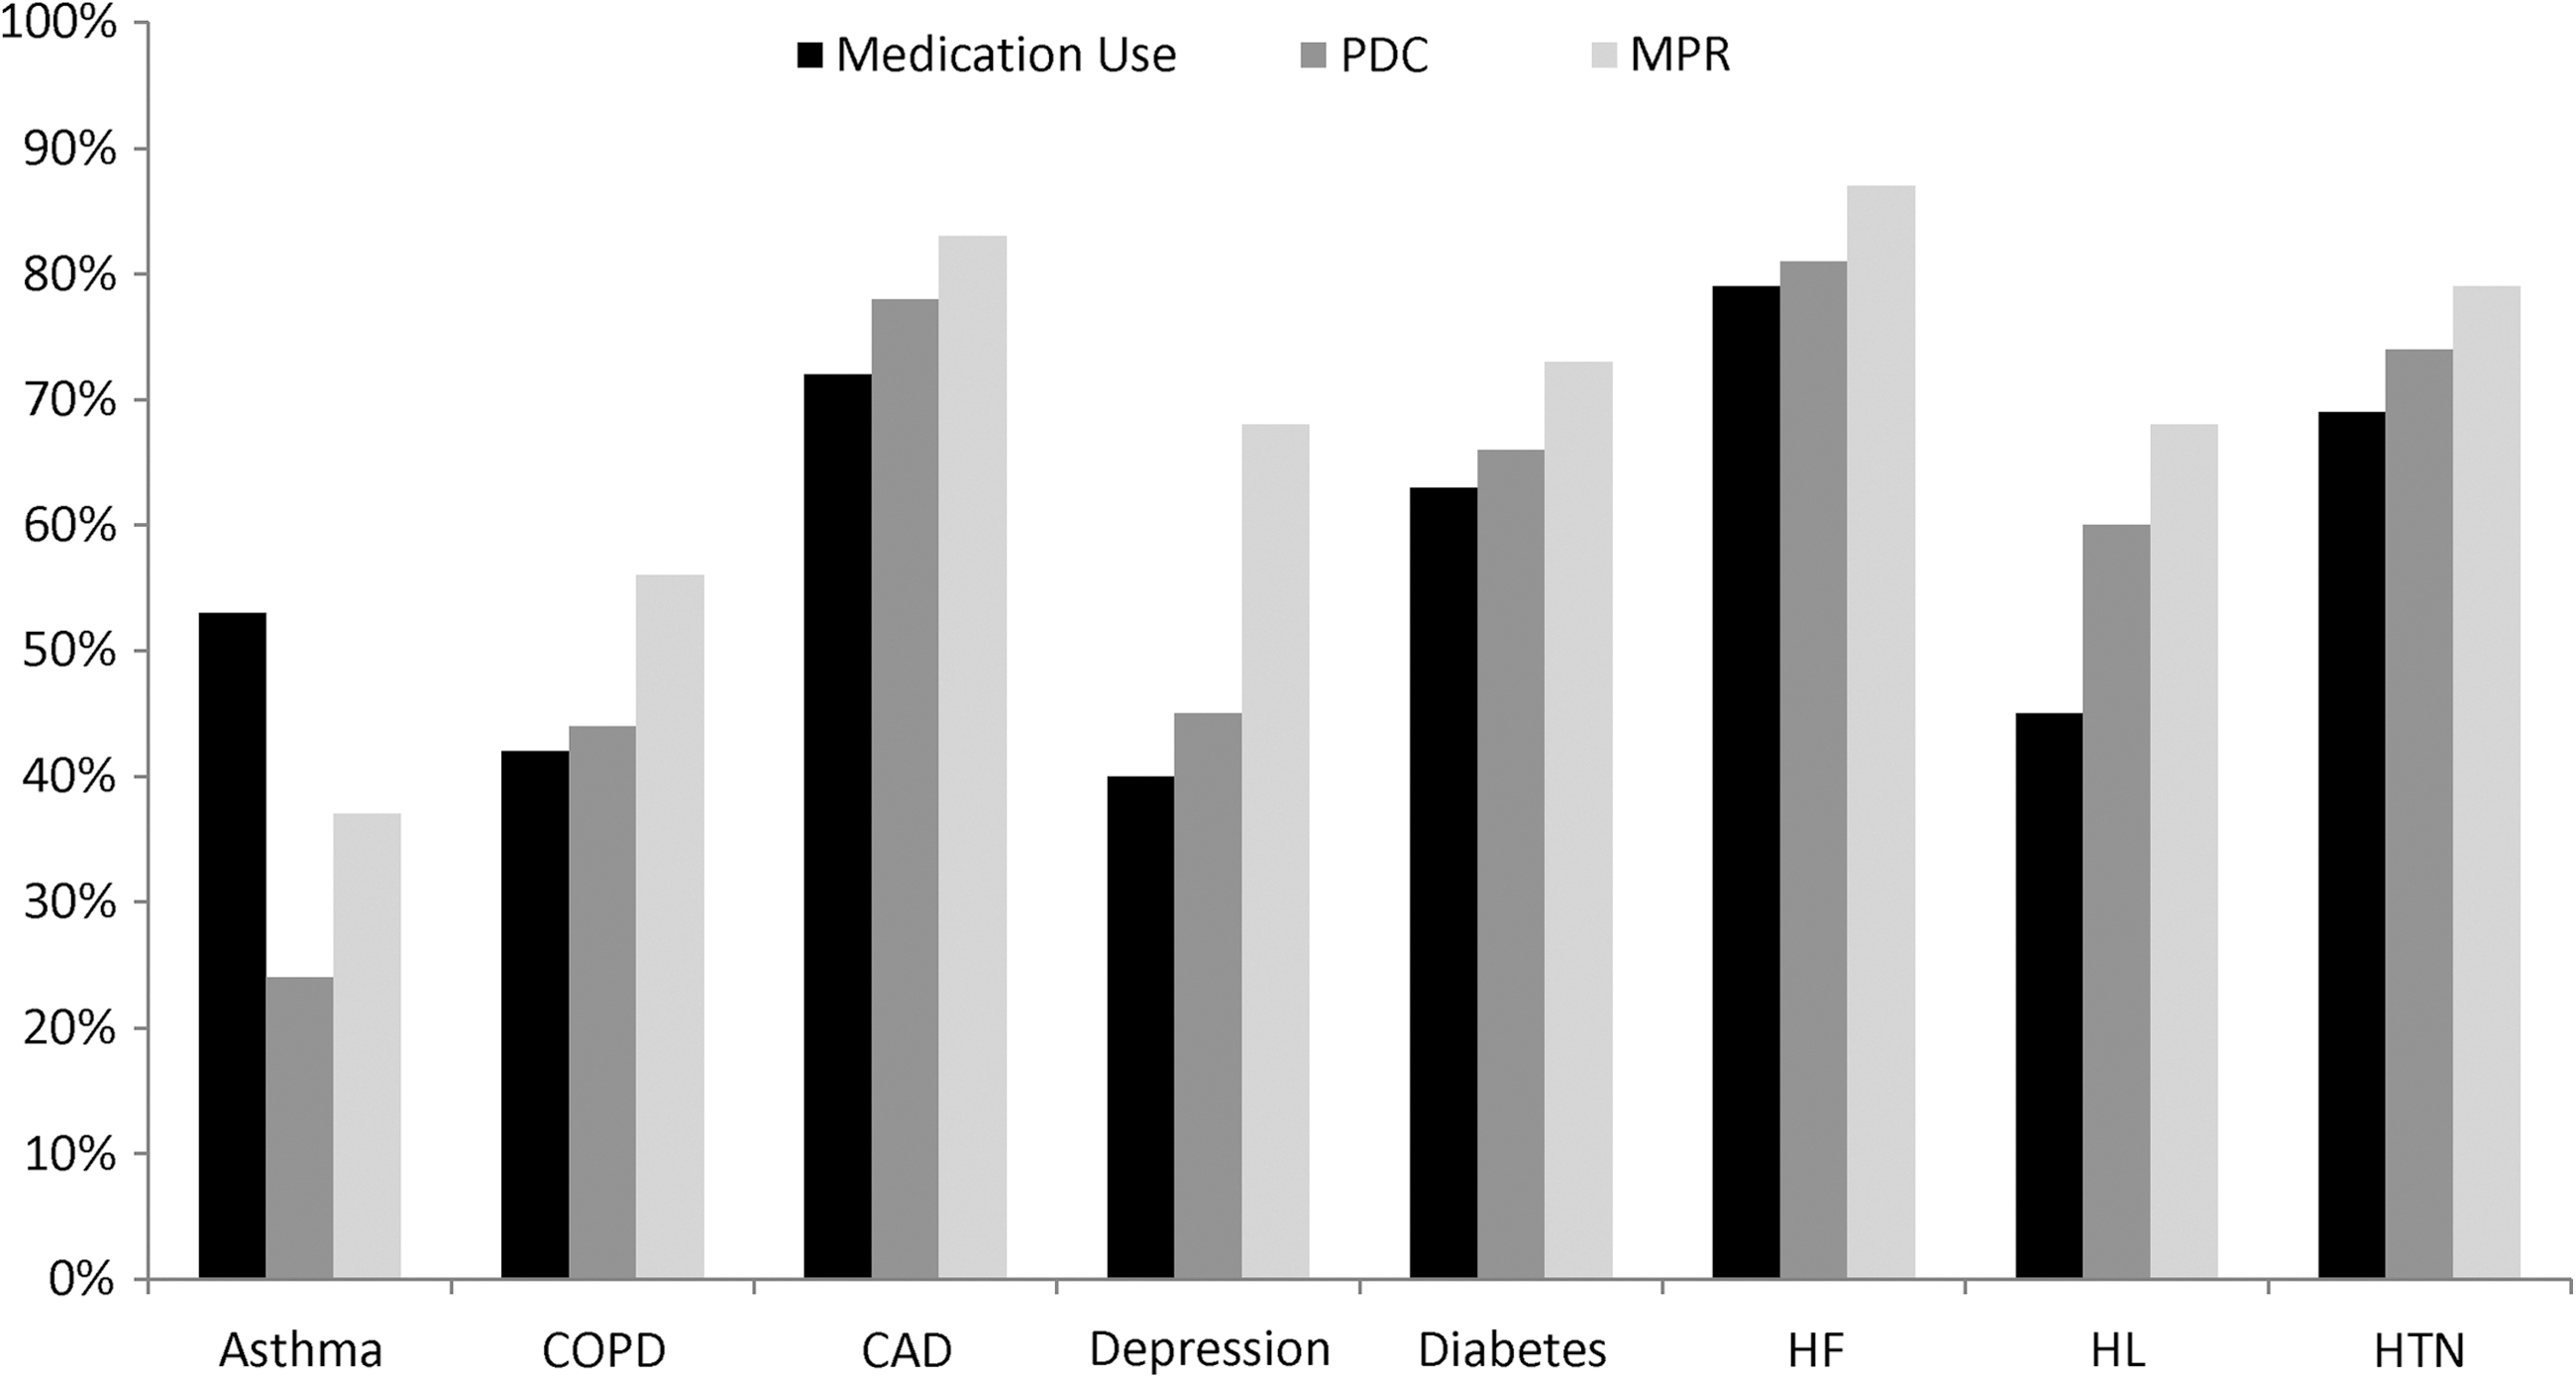
Percentage of patients with any medication use, persistence (PDC ≥80%), or compliance (MPR ≥80%) to any acceptable therapy.
Figure 2 also shows the percentages of these patients who were persistent with therapy (PDC ≥80%) and those who filled at least 2 prescriptions who were compliant (MPR ≥80%). The percentages of patients considered persistent ranged from a low of 24% for asthma to a high of 81% for HF. Similarly, rates for compliance ranged from 37% for asthma to 87% for HF.
Select medication classes
The percentage of patients who filled a prescription for select medication classes (considered to be gold standards according to treatment guidelines) during the study period was low across diagnoses (Table 3). Twenty-one percent of COPD patients filled a prescription for anticholinergics, 30% of depression patients filled a prescription for selective serotonin reuptake inhibitors, 37% of diabetes patients filled a prescription for biguanides, 38% of hyperlipidemia patients filled a prescription for statins, and 42% of asthma patients filled a prescription for any inhaled corticosteroid. Higher percentages of CAD, HTN, and HF patients filled prescriptions.
Appropriate beta-blocker includes 3 specific medications based on the American College of Cardiology/American Heart Association heart failure guidelines.
Large numbers of patients across selected therapies had persistence and compliance rates below 80% (Table 3). Persistence was particularly poor for patients with asthma and COPD, and was highest for patients with CAD and HF. Similarly, compliance rates followed the same pattern. The least compliant patients were those with asthma and COPD; the most compliant were those with CAD and HF.
Health care utilization
All-cause
The mean numbers of ER visits and hospitalizations for any cause per year for patients with at least 1 visit or hospitalization are shown in Table 4. The diseases with the highest percentages of patients with at least 1 ER visit for any cause in a year were HF, COPD, and CAD. These same conditions had the highest percentages of patients with at least 1 hospitalization for any cause in a year. For patients with at least 1 ER visit or hospitalization for these three conditions, the average number of ER visits ranged from 1.9 to 2.3, while hospitalizations ranged from 3.4 to 5.2.
Mean number of visits or hospitalizations in patients with ≥1 ER visit or hospitalization.
Disease-specific
The mean numbers of disease-specific ER visits and hospitalizations per year for patients with at least 1 ER visit or hospitalization are shown in Table 4. The highest percentages of patients with at least 1 disease-related ER visit were those patients with HF, asthma, CAD, COPD, or depression. The diseases with the highest percentages of patients with at least 1 disease-related hospitalization in a year were HF, CAD, COPD, and depression.
Health care costs
All-cause
Table 5 shows per person per year health care costs for each diagnosis. All-cause total (medical + pharmacy) average per-person per-year costs were highest for patients with a diagnosis of HF ($32,655) followed by COPD, CAD, and diabetes. Medical costs rather than pharmacy costs accounted for the majority of the health care dollars for these conditions.
Disease-specific
Table 5 also shows average disease-specific per-person per-year disease-related costs for each diagnosis. Disease-related total (medical + pharmacy) per-person per-year costs were highest for CAD and heart failure, followed by depression, diabetes, and COPD.
Discussion
In this study of 8 common chronic conditions (asthma, COPD, CAD, depression, diabetes, HF, HL, and HTN), these conditions were highly prevalent and associated with substantial health care resource use and costs in this commercially insured population of 5,780,012 enrollees.
Perhaps the most striking finding is the significant undertreatment of chronic diseases according to national guidelines. Substantial numbers of patients did not fill any pharmacotherapy considered acceptable according to treatment guidelines regardless of diagnosis. Undertreatment was most prevalent for patients with depression, COPD, HL, and asthma. Measures of quality of care also suggest that chronic conditions were undertreated in this population. For example, almost half of patients with diabetes received no A1c test or LDL test in a 1-year period. These findings are consistent with the CQI study that found that, on average, Americans receive only about half of recommended care.
Medication adherence was generally poor across diagnoses, particularly among patients with asthma and COPD. The percentage of patients deemed compliant did not exceed 87% even for heart failure, the condition usually associated with the highest medication adherence. The data obtained in the “real-world” settings of the current study are consistent with results of other studies showing that nonadherence is particularly widespread among patients with chronic conditions that require long-term drug therapy. 11,28,29
The results of the current study show the need for interventions and more coordinated care for patients living with chronic diseases. By benchmarking these conditions and the burden they place on the health care system, it is possible to develop targeted interventions to improve care where the most benefit could be gained from limited resources. The push for new models, such as the Medical Home model, 30 may be beneficial in trying to educate patients, coordinating the care they receive for their condition, and assuring that guideline-recommended care is being received. Pay-for-performance initiatives are already under way across the country to help ensure that patients receive appropriate care. 31 Averill and colleagues suggest that a focus on quality improvement measures tied to reimbursement such as pay for performance, best practice pricing, price discounting, alignment of incentives, the medical home, payment by episodes, and the incorporation of provider performance reports are a series of payment reforms that can lead to lower costs. 31 Creating such a system to reward quality can create the framework for future savings by establishing and rewarding long-term provider behavior changes. Similar measures are incorporated in the health care reform bill that was recently signed into law.
A limitation of the current study is the reliance on diagnosis coding, which has well-known shortcomings with respect to accuracy and completeness. In addition, the utilization and cost data were unadjusted to create MCO-like indices and therefore do not factor in comorbidities, which were highly prevalent for some conditions. These results can provide only a partial assessment of adherence. The number of days of medication supply and the patient's refilling behavior reflect the availability of medication to the patient. Although the methods employed in this study are used extensively in research, availability of medication is not sufficient to ensure adherence, which also depends upon whether patients actually take the medication and whether they take the medication at the time and in the manner prescribed. The latter two determinants of adherence were not assessed in this study. Another limitation is the fact that the methods were employed to generate annual rates, and allowed for new patients to enter the sample until the end of June of the measurement year. This design helps approach activities typical of MCO efforts to assess and manage relevant patients and report rates (in this case percents) annually but does not allow all patients equal time throughout the assessment. Depending on the condition, 67% to 80% of patients were identified in 2006 prior to the measurement year and therefore had full year 2007 assessments. All nonpercent calculations were annualized based on eligible time in 2007. Also, the database is representative of commercially insured lives younger than 65 years of age; it is not representative of those 65 of age and older. Other limitations include the retrospective, observational design, which allows for the possibility of confounding and operation of various biases, and lack of information about reasons for nonadherence. These limitations are offset to some extent by the study's strength of being conducted in the real-world setting and employing a large, representative sample with standard methodology to compare results across 8 chronic conditions.
This study is not meant to draw conclusions or test hypotheses but rather to profile and describe the commercially insured population using common managed care definitions and techniques that can potentially provide a more widespread index in a format that can aid managed care utilization and quality efforts. This type of index developed with a large national population using standard methods can aid decision makers to identify the best opportunities for improvement to optimize health care quality and spend. With increasing resource constraints, falling budgets, rising costs, and the need for increased outcomes, this type of approach can help enable cost-effective activities and health care spends as it adds to current utilization activities.
As mandated employer-provided health insurance (as well as mandates for others to be insured or to purchase insurance) unfolds as a result of the health care reform legislation recently passed, the data found here and similarly researched data elsewhere as a result of benchmarking studies will take on an even more significant emphasis. Reduced morbidity and lower health care expenditures resulting from adherence and persistence with therapeutic regimens has the potential to keep people healthier and to improve any number of benchmarked outcomes.
Conclusion
In conclusion, undertreatment and poor medication adherence were prevalent and health care resource utilization and costs were substantial for 8 common chronic diseases in this large, commercially insured, US population. While not surprising in itself, this study is unique with regard to the standard MCO-like methods employed and comparison across many different chronic diseases in one study, which can provide a benchmark of the current state of health care for chronic disease. The widespread nature of the deficits in treatment and adherence point to the need for comprehensive, multifaceted strategies that involve both patient and provider stakeholders in improving clinical and economic outcomes for chronic diseases. It was not feasible to include all data for each condition within this manuscript. Additional results by condition are available upon request. It is the authors' intent to post all results additionally online.
Footnotes
Acknowledgments
The authors acknowledge Jane Saiers, PhD, for assistance with writing this manuscript. We also acknowledge Tim Niecko for his independent validation of all programming that produced the results for this study. GlaxoSmithKline funded Dr. Saiers' and Mr. Niecko's work.
Author Disclosure Statement
Drs. Cantrell, Cook, and Burch, and Ms. Priest are all employees of GlaxoSmithKline and own stock in the company based on employment benefits. Dr. Fincham disclosed no conflicts of interest.