
Abstract
Lipids play crucial biological roles in health and disease, including in cancers. The phosphatidylinositol 3-kinase (PI3K) signaling pathway is a pivotal promoter of cell growth and proliferation in various types of cancer. The somatic mutations in PIK3CA, the gene coding for the catalytic subunit p110α of PI3K, are frequently present in cancer cells, including breast cancer. Although the most prominent mutants, represented by single amino acid substitutions in the helical domain in exon 9 (E545K) and the kinase domain in exon 20 (H1047R) are known to cause a gain of PI3K function, activate AKT signaling and induce oncogenic transformation, the effect of these mutations on cellular lipid profiles has not been studied. We carried out untargeted lipidomics using liquid chromatography-tandem mass spectrometry to detect the lipid alterations in mammary gland epithelial MCF10A cells with isogenic knockin of these mutations. A total of 536 species of lipids were analyzed. We found that the levels of monosialogangliosides, signaling molecules known to enhance cell motility through PI3K/AKT pathway, were significantly higher in both mutants. In addition, triglycerides and ceramides, lipid molecules known to be involved in promoting lipid droplet production, cancer cell migration and invasion, were increased, whereas lysophosphatidylcholines and phosphatidylcholines that are known to inhibit cancer cell motility were decreased in both mutants. Our results provide novel insights into a potential link between altered lipid profile and carcinogenesis caused by the PIK3CA hotspot mutations. In addition, we suggest untargeted lipidomics offers prospects for precision/personalized medicine by unpacking new molecular substrates of cancer biology.
Introduction
Lipids play important roles in regulating various cellular functions, and diverse classes of lipids have been implicated in multiple types of cancers, including breast cancer (Blucher and Stadler, 2017). Aberrant metabolism of lipids has been involved in tumor growth and recurrence due to altered biosynthesis and uptake of lipids (Fernandez et al., 2018; Vargas et al., 2015). Although phosphoproteomics, glycoproteomics, and extracellular vesicles proteomics on cells bearing hot spot mutations of E545K in the helical domain and H1047R in the kinase domain have been studied previously (Saraswat et al., 2022a; Saraswat et al., 2022b; Wu et al., 2014), the effects of these mutations on lipid profile and lipid metabolism have not been reported.
Phosphatidylinositol 3-kinases (PI3Ks) belong to a heterodimeric lipid kinase family that converts phosphatidylinositol-4,5-diphosphate (PIP2) to phosphatidylinositol-3,4,5-triphosphate (PIP3) in response to growth factor stimulation. PIP3 provides docking sites at the plasma membrane for its downstream signaling molecules by binding to the pleckstrin homology domain of proteins such as serine/threonine protein kinase AKT (Chen et al., 2018; Vanhaesebroeck and Alessi, 2000). PI3Ks are involved in a broad spectrum of cellular signaling events affecting cell proliferation, cell survival, and cell metabolism (Engelman et al., 2006; Liu et al., 2009).
Class 1A PI3K is composed of a regulatory p85 subunit and a catalytic p110α subunit. The p110α catalytic subunit of PI3K is encoded by PIK3CA gene and mutations in PIK3CA have been found in many types of cancer, including breast, colorectal, gastric, and brain (Cancer Genome Atlas, 2012; Parsons et al., 2005; Samuels et al., 2004). The two most common mutations in PIK3CA are E545K in the helical domain and H1047R in the kinase domain of p110α unit (Janku et al., 2014; Leontiadou et al., 2018; Samuels et al., 2005).
These mutations lead to enhanced activation of AKT and its downstream signaling pathways that play critical roles in promoting cellular transformation and oncogenesis (Sarbassov et al., 2005; Vasudevan et al., 2009; Wu et al., 2014). Indeed, our previous results have shown that cells with these mutations display enhanced motility, likely through AKT-mediated phosphorylation of Cortactin (Wu et al., 2014). Another study examining the proteomic alterations of extracellular vesicles caused by these mutations has observed enhanced expression of glucose transporter 1, a downstream target of AKT known to stimulate glucose uptake and energy metabolism in cancer cells, including breast cancer (Harris et al., 2021; Saraswat et al., 2022a).
In this study, we carried out untargeted lipidomics using liquid chromatography-tandem mass spectrometry (LS-MS/MS) to investigate the lipidomic alterations in the breast epithelial cells bearing hotspot mutations in PIK3CA, E545K, and H1047R.
Materials and Methods
Cell culture
The breast epithelial cell line MCF10A (hereafter referred to as parental) and PIK3CA mutant cells bearing E545K mutation in exon 9 (hereafter referred to as Exon 9) and another bearing the H1047R mutation located in exon 20 of the PIK3CA (hereafter referred to as Exon 20) were gifted from Dr. Ben Ho Park (Gustin et al., 2009). All cell lines were grown in cell culture media (Dulbecco's modified Eagle's medium: nutrient mixture F-12 (Life Technologies, Carlsbad, CA, USA), 10 μg/mL insulin, 5% horse serum, 0.5 μg/mL hydrocortisone (Sigma-Aldrich, St. Louis, MO, USA), 100 ng/mL cholera toxin (Sigma-Aldrich) with 20 ng/mL epidermal growth factor (EGF) for MCF10A and 0.2 ng/mL EGF for knockin cells. For each group, three pellets of 1 × 10⁷ cells were harvested and washed with 1 × phosphate buffer three times. The in vitro work described in this study was conducted after approval of the institutional biosafety committee at Johns Hopkins University.
Sample preparation
Lipids were extracted from parental, Exon 9 and Exon 20 cell pellets using neutral and acidic lipid extraction method (Lee et al., 2017). An internal standard (IS) mixture was prepared by mixing the following standards: phosphatidylcholine (PC) (17:0/17:0), phosphatidylethanolamine (PE) (17:0/17:0), phosphatidylinositol (PI) (17:0/20:4), phosphatidylglycerol (PG) (17:0/17:0), phosphatidylserine (PS) (17:0/17:0), phosphatidic acid (PA) (17:0/17:0), lysophosphatidylcholine (LPC) (17:0), lysophosphatidylethanolamine (LPE) (17:1), lysophosphatidylglycerol (LPG) (17:1), lysophosphatidylserine (LPS) (17:1), lysophosphatidic acid (LPA) (17:1), sphingomyeline (d18:1/17:0), lysopshingomycline (d17:1), ceramide (Cer) (d18:1/17:0), monohexosylceramide (MHC) (d18:1/17:0), cholesteryl ester (ChE) (17:0), monoglyceride (MG) (18:1-d7), diglyceride (DG) (15:0/18:1-d7), and triglyceride (TG) (17:0/17:1/17:0-d5) was added to all samples before extraction.
A total of 300 μL of chloroform:methanol (1:2, v/v) was added and tip sonicated three times for 5 sec with 30 sec cooldown on ice bath in between each sonication. After tip sonication, 700 μL of chloroform:methanol (1:2, v/v) was added and vortexed shortly for 1 min. The mixture was incubated on ice for 10 min for protein precipitation and centrifuged at 13,800 g for 2 min at 4°C. After centrifugation, the supernatant was collected. To the remaining layer with protein precipitate, 750 μL of chloroform:methanol:37% 1 M HCl (40:80:1, v/v/v) was added, vortexed for 1 min and left at room temperature for 15 min. Followed by the addition of 250 μL of ice-cold chloroform and 450 μL of 0.1 M HCl, the mixture was centrifuged at 6500 g for 2 min. The bottom organic layer was collected and combined with the previously collected organic layer and dried using a speed vacuum. The dried lipid extracts were stored at −80°C until LC-ESI-MS/MS analysis.
Untargeted lipidomics using LC-ESI-MS/MS
Mass spectra were acquired using a Q-Exactive Plus mass spectrometer (Thermo Scientific, San Jose, CA, USA) by alternating between positive and negative ion modes in each run. The mass spectrometric parameters were as follows: spray voltage at 3.3 kV, sheath gas at 30, auxiliary nitrogen pressures set at 5, capillary temperature at 300°C, and S-lens radio frequency (RF) level at 35. Full scan MS data, followed by MS/MS, were collected in data-dependent acquisition mode from m/z 280–1350 in positive ion mode and m/z 380–1300 in negative ion mode. A Dionex UltiMate 3000 RS (Thermo Scientific) was coupled to the Q Exactive orbitrap for the chromatographic separation using Accucore C18 column (2.6 μm × 2.1 mm × 150 mm).
Mobile phase A composed of water: acetonitrile (9:1, v/v) and mobile phase B composed of isopropanol:methanol:acetonirile (7:2:1, v/v/v) were used to separate lipids and each mobile phase contained 0.1% formic acid and 1 mM ammonium formate as modifiers. With a flow rate of 250 μL/min, mobile phase B was increased from 0% to 65% over 1 min, 75% of 20 min, 82% over 26 min, 100% over 8 min, and maintained at 100% for 5 min. The mobile phase B was decreased to 0% over 0.1 min and kept for 5 min for re-equilibration. Each sample was injected twice and the autosampler temperature was maintained at 4°C for all experiments.
Data processing and statistical analysis
Lipids were annotated based on precursor ion and MS/MS spectra and annotated lipids were quantified based on extracted ion chromatogram of precursor ion. Both annotation and quantitation were carried out by LipidSearch (Thermo Scientific) and peak areas of IS were calculated using Thermo Xcalibur. All lipids were normalized by the peak areas of IS sharing the identical head group. Statistical analysis was performed using MetaboAnalyst 5.0. Principal component analysis was carried out based on quantitative values of all lipids analyzed from parental, Exon 9, and Exon 20 cells. To visualize the lipid pathways, we used BioPAN, a web-based tool on the LIPID MAPS Lipidomics Gateway (Gaud et al., 2021). Pathways and calculation options used to generate the pathways were as follows: Exon 9 and Exon 20 as conditions of interest, parental MCF10A as control condition, lipid type, active status, lipid subclass level, reaction subset of lipid data, p < 0.01, and no paired data.
Results and Discussion
Lipid profiling of PIK3CA mutant cells by LC-MS/MS
It is noteworthy that untargeted lipid analysis on the differences in lipid profiles between parental cells, Exon 9 and Exon 20 mutant cells has not been studied. To discover lipidomic alterations induced by PIK3CA hot stop mutations, we performed untargeted lipidomics using high-resolution LC-ESI-MS/MS on parental MCF10A cells and the mutant cells harboring the PIK3CA mutations (Fig. 1A).
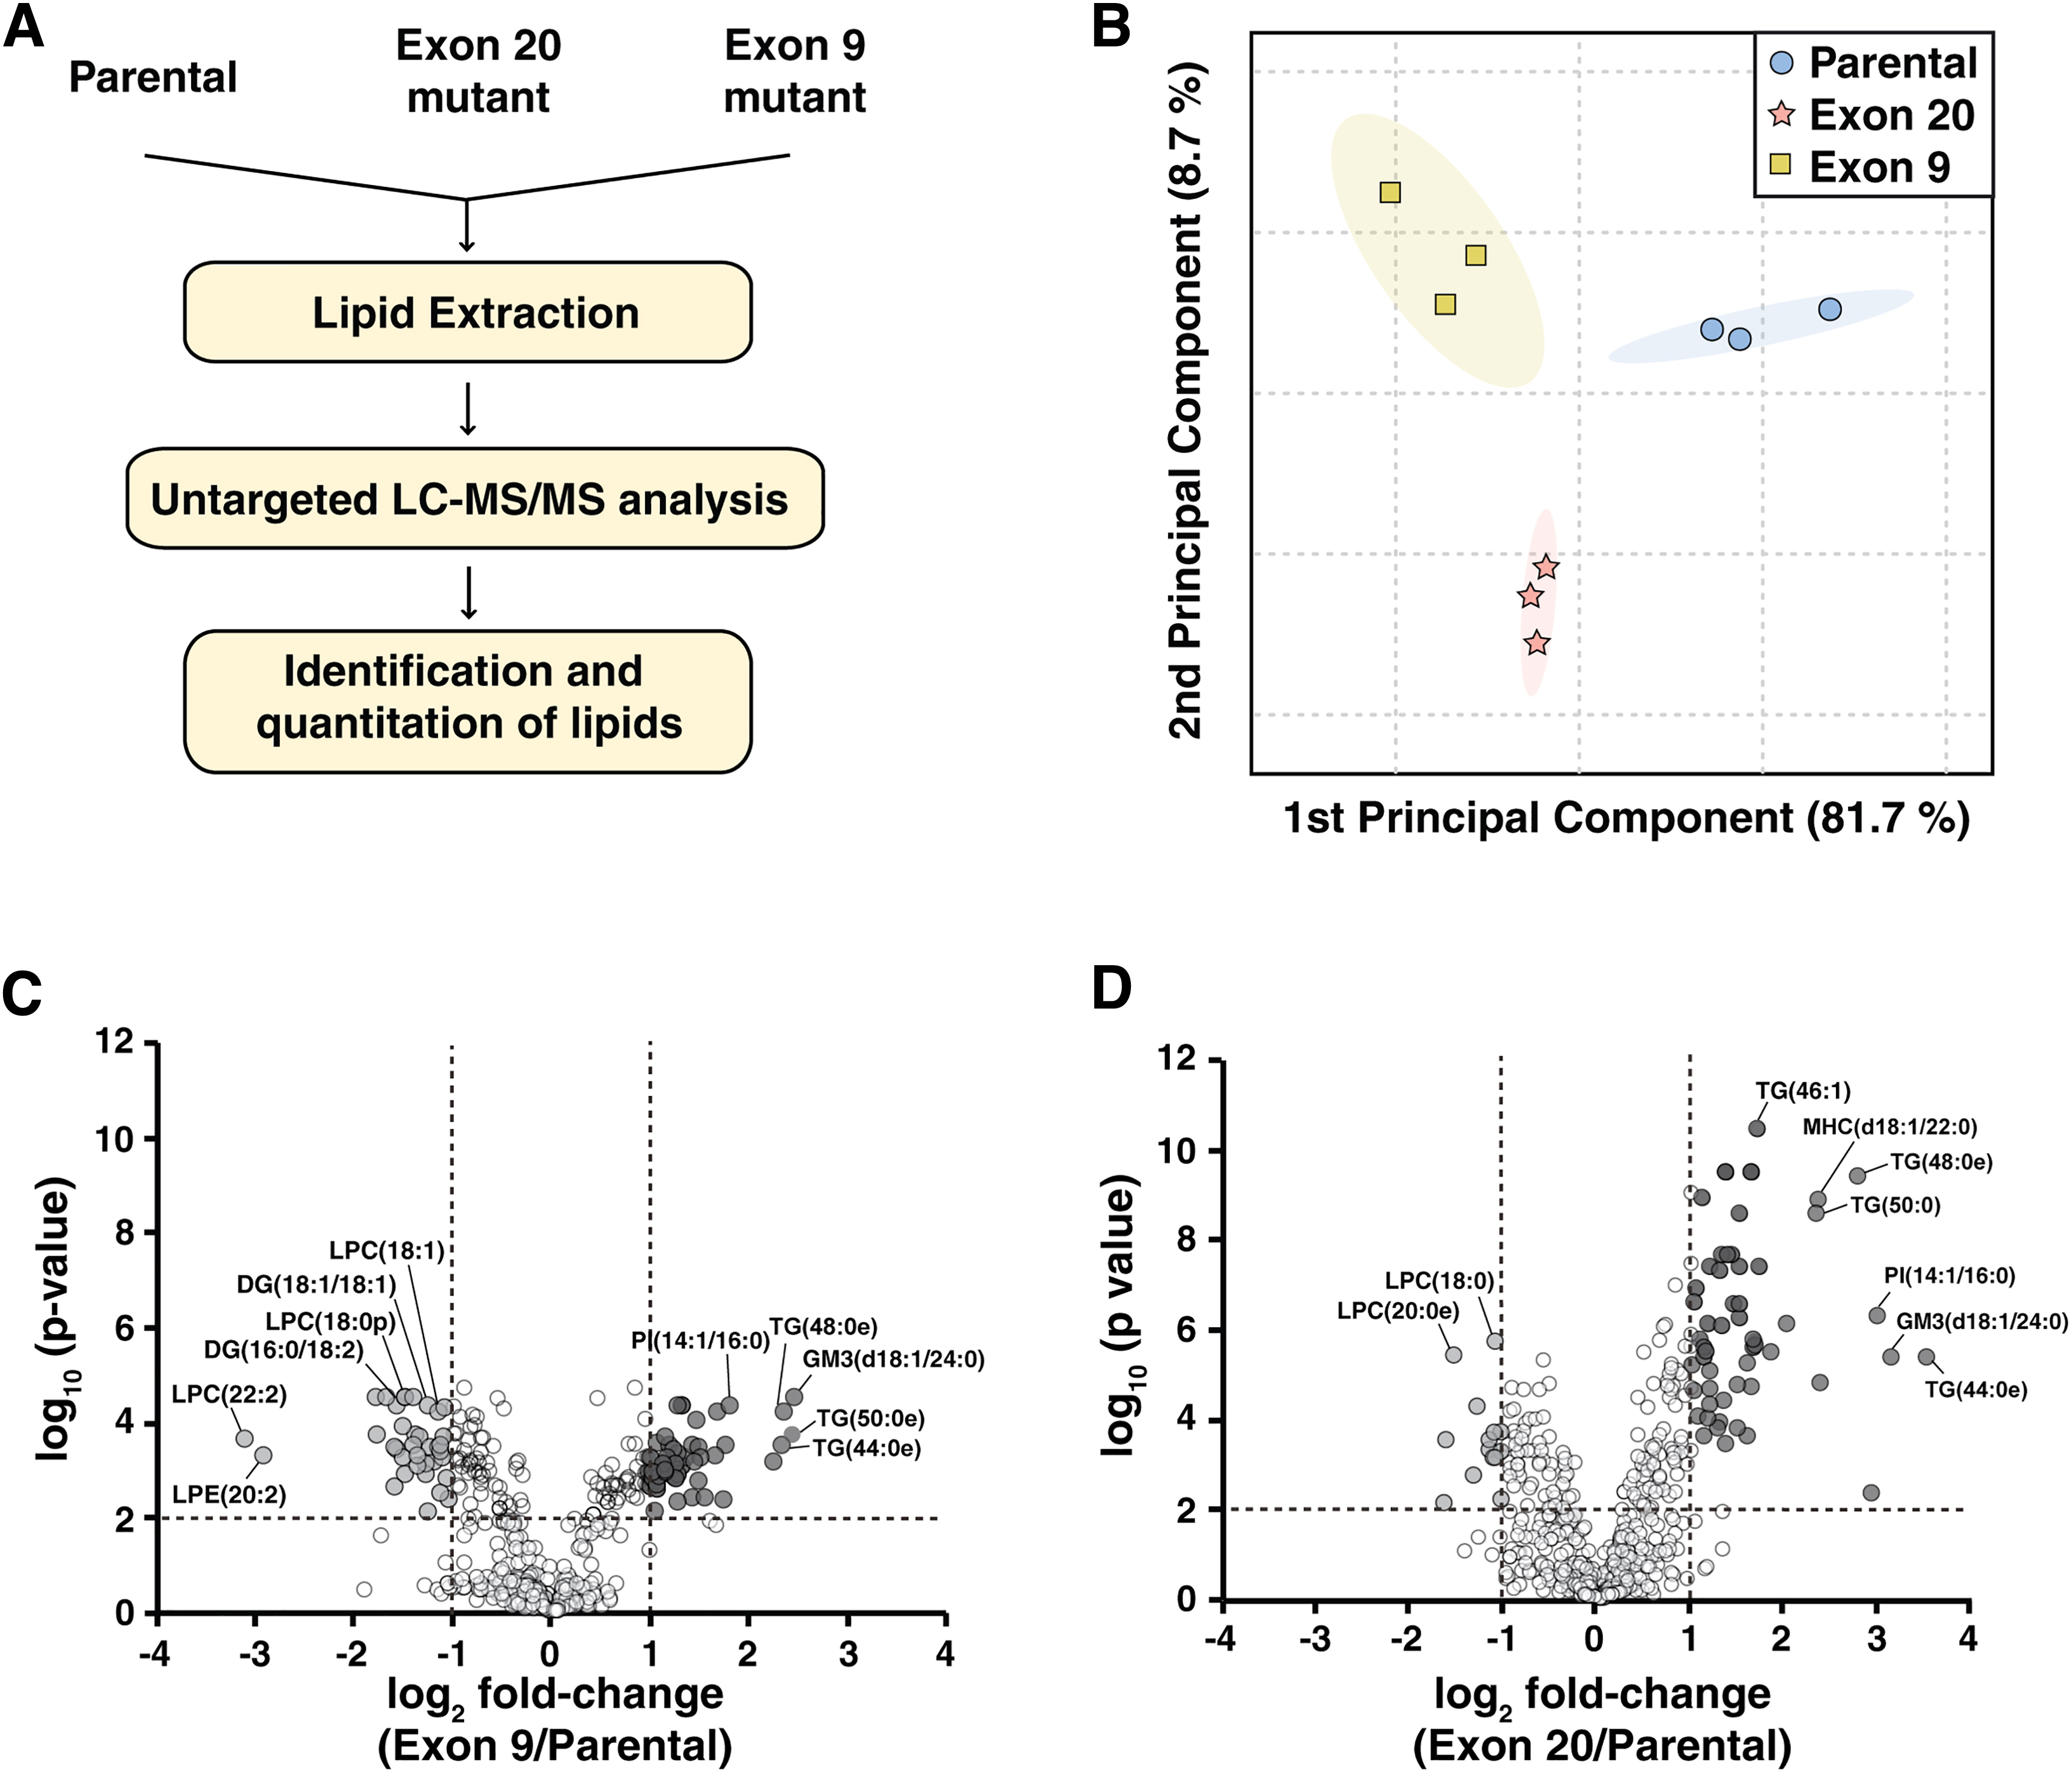
From the global lipidomic profiling, we identified and quantified 536 lipid species. We used two levels of lipid identification: level 1 where confident identification was made based on accurate precursor mass, estimated retention time and MS/MS spectra confirming structures of both side chains of fatty acid (FA), whereas level 2 identification was made based on accurate precursor mass, estimated retention time, and MS/MS spectra only providing partial identification of fatty acyl chains. The list of identified lipids is summarized in Supplementary Table S1. Accordingly, these species span:
91 PC, 81 PE, 64 PI, 16 PG, 46 PS, 6 PA, 28 LPC, 26 LPE, 11 lyso phosphatidylinositols (LPI), 1 LPG, 5 LPS, 3 LPA, 3 cyclic phosphatidic acids, 12 dimethylphosphatidylethanolamines, 6 lysodimethylphosphatidylethanolamines, 4 sphingosines (So), 12 Cer, 12 MHC, 4 dihexosylceramides (DHC), 5 trihexosylceramides, 15 sphingomyelins (SM), 1 lysosphingomyelin, 2 monosialogangliosides (GM3), 1 ChE, 6 MG, 19 DG, and 56 TG.
In Supplementary Figure S1A, MS/MS spectrum of m/z 883.53 from the parental cell line shows FA of 18:1-FA (m/z 281.25) and 20:4-FA (m/z 303.23), and m/z 241.01 is a signature ion of PI, as it corresponds to the loss of water from phosphoinositol. Other fragment ions, including m/z 417.24 and 579.30, confirm the precursor ion to be PI (18:1/20:4) as these fragment ions were generated from the loss of water from deprotonated LPA and LPI, respectively. Representative MS/MS spectra of other classes of lipids, including LPE and PE, are shown in Supplementary Figure S1B and C, where fragment ions were used for structural characterization.
Unsupervised principal component analysis was performed using untargeted lipidomics data from the parental, Exon 9 and Exon 20 cells, as shown in Figure 1B. A clear separation between MACF10A parental cells and mutant cells was observed, indicating significantly altered lipid profiling in PIK3CA hotspot mutant cells.
To explore the lipid alterations in PIK3CA mutant cells, 536 identified lipids were quantified and compared across the groups. The peak area of each species was normalized by the peak area of the IS that shares an identical head class of lipids. For those the identical head class standards were not available, IS with the closest retention time was used for normalization. Relative abundance values of individual lipids are listed in Supplementary Table S1. Individual lipid species with fold-change >2 or <0.5 and adjusted p-value <0.01 in mutant cells compared with parental cells were considered to have a significant difference.
A total of 45 species were increased significantly, whereas 36 species were decreased significantly in Exon 9, compared with parental cells (Fig. 1C). In Exon 20, 55 and 14 species were significantly increased and decreased, respectively, compared with parental cells (Fig. 1D). We compared the lipid species that showed significant changes in both mutant cells and of these 44 species showed the identical trend of changes in both mutant cells, compared with parental; 36 species including GM3(d18:1/24:0) were significantly increased, whereas 8 species including DG (18:1/18:2) were significantly decreased in both mutant (Fig. 2). There were lipid species that showed significant changes only in one PI3K mutant cells compared with parental cells; 37 and 25 lipids showed changes in Exon 9 or Exon 20 only, respectively (Fig. 2). Although most of these species showed a similar trend of changes in the PI3K mutant cells, several selective species showed larger degree of changes in one mutation type than the other.
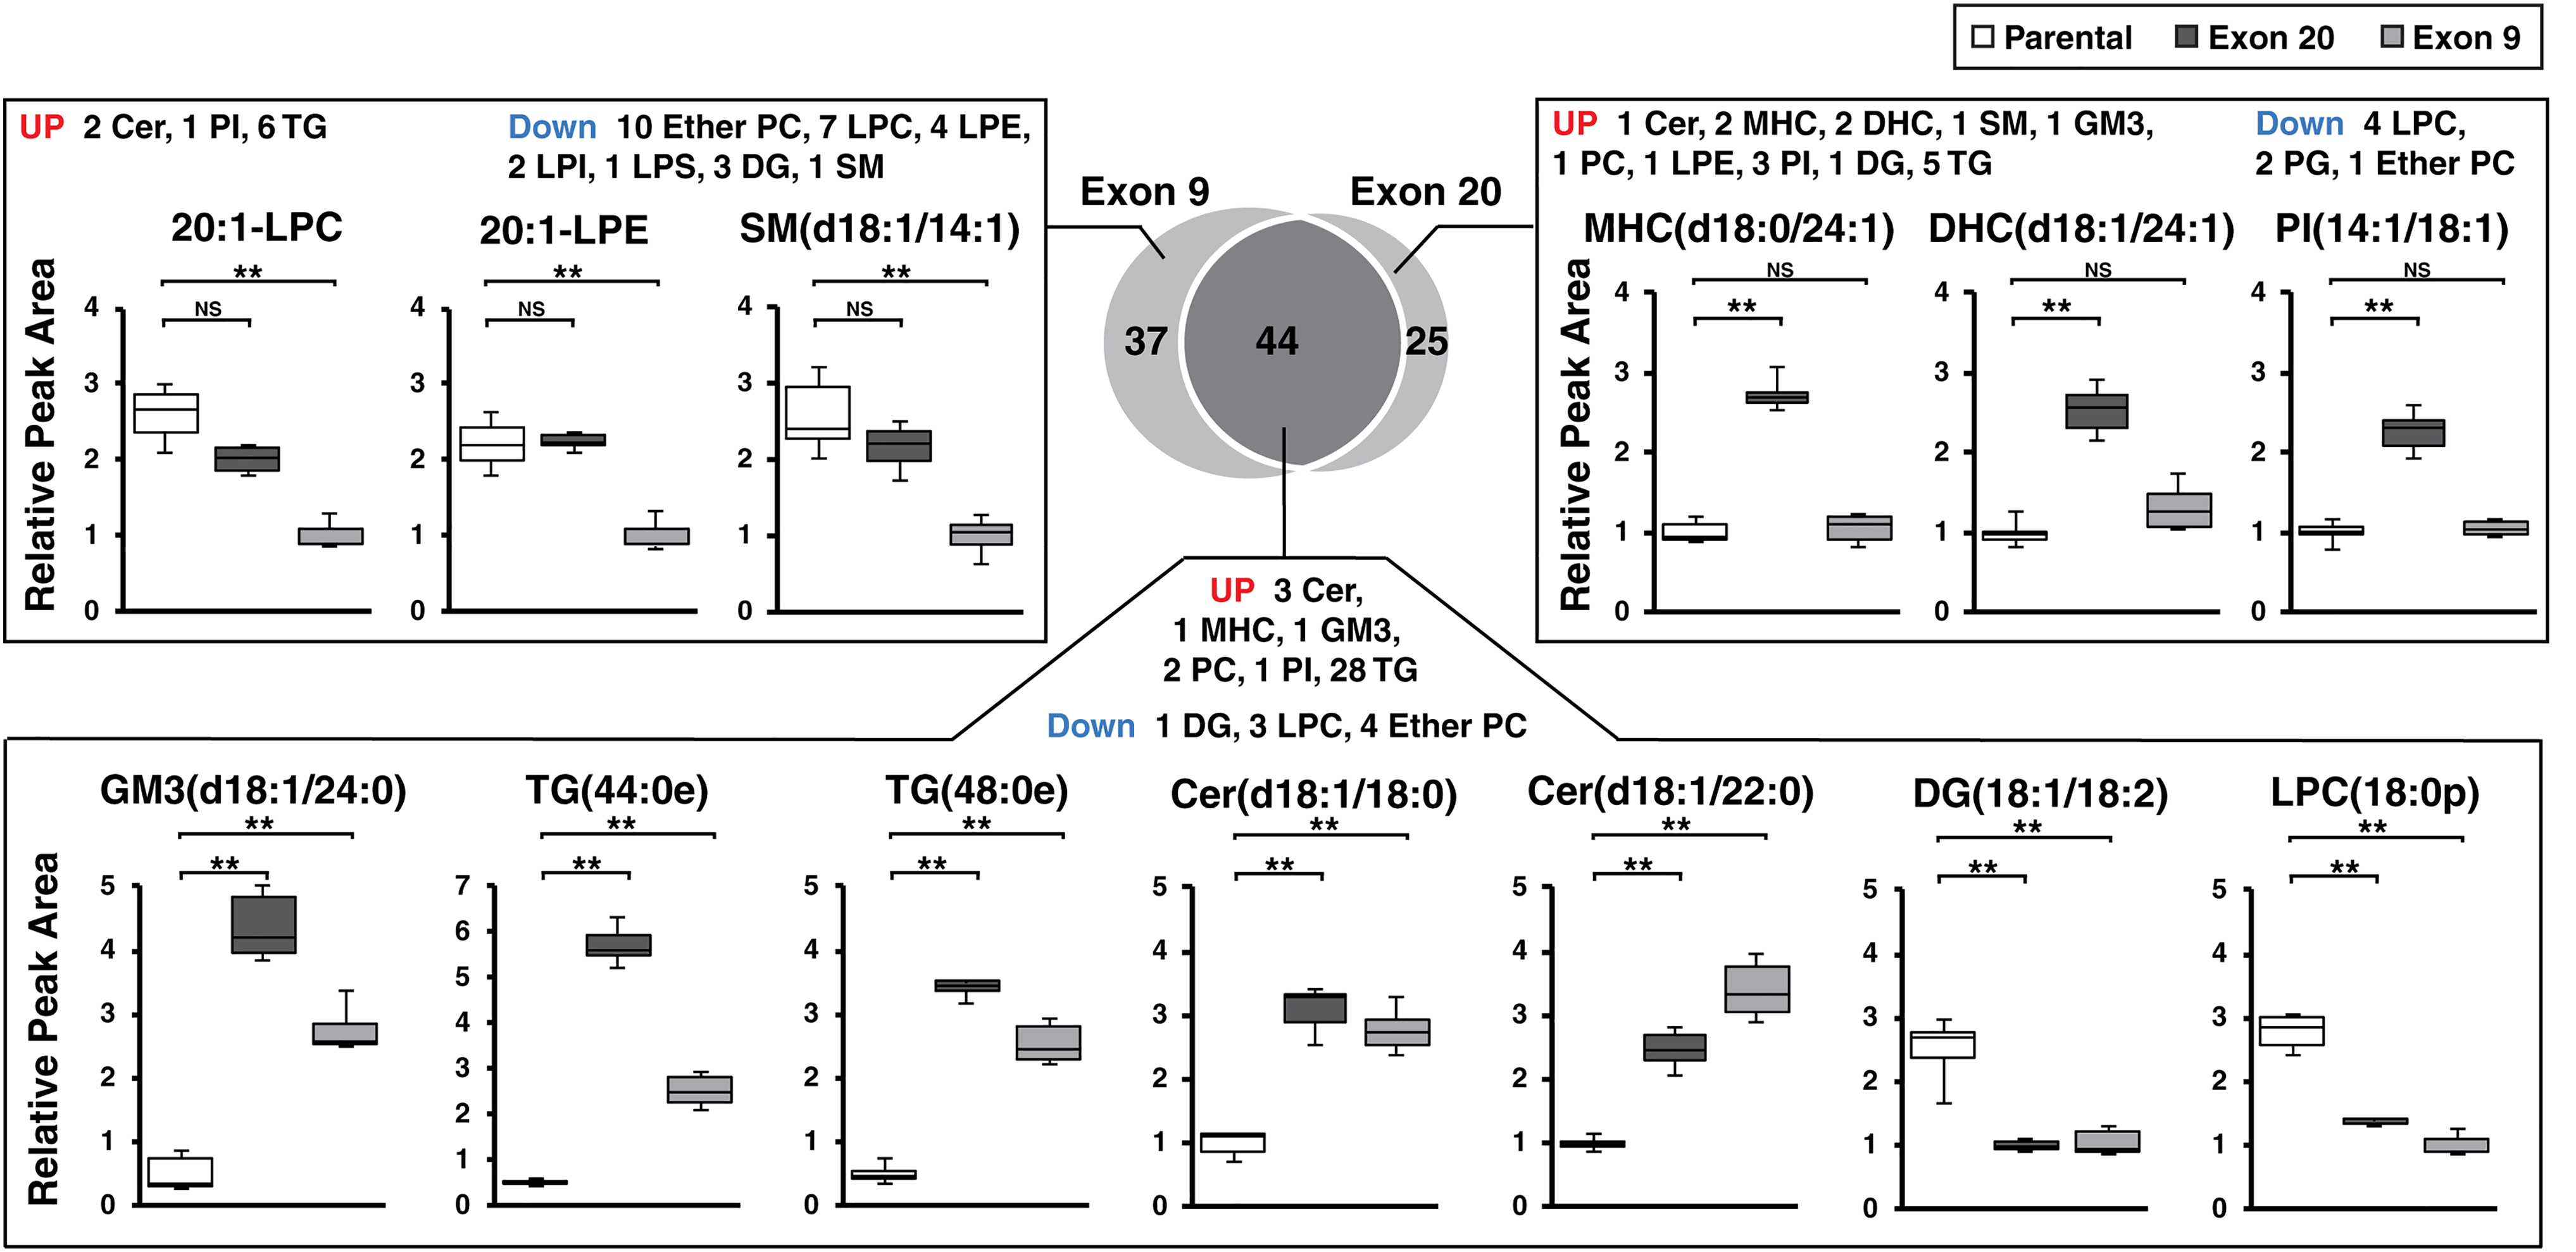
Venn diagram and box plots of lipid species showing significant changes (adjusted p < 0.01 and fold-change >2 or fold-change <0.5) in Exon 20 or Exon 9 only or in both mutants. **Adjusted p < 0.001. Cer, ceramide; DHC, dihexosylceramide; LPA, lysophosphatidic acid; LPI, lysophosphatidylinositol; NS, no significance; PC, phosphatidylcholine; PE, phosphatidylethanolamine; PG, phosphatidylglycerol; SM, sphingomyelin.
Several classes of lipids are altered in PIK3CA mutant cells
Changes in total class of lipids were calculated by summing the peak areas of species within each class, and the relative changes across the classes are shown in Table 1. Several classes of lipids, including GM3, TG and Cer, were increased significantly (adjusted p < 0.01) in both Exon 9 and 20, whereas DHC showed significant elevation in Exon 20 only (Fig. 3). In contrast, DG, LPC, PC, and LPI were significantly decreased (adjusted p < 0.01) in both PIK3CA mutant cells (Fig. 3).
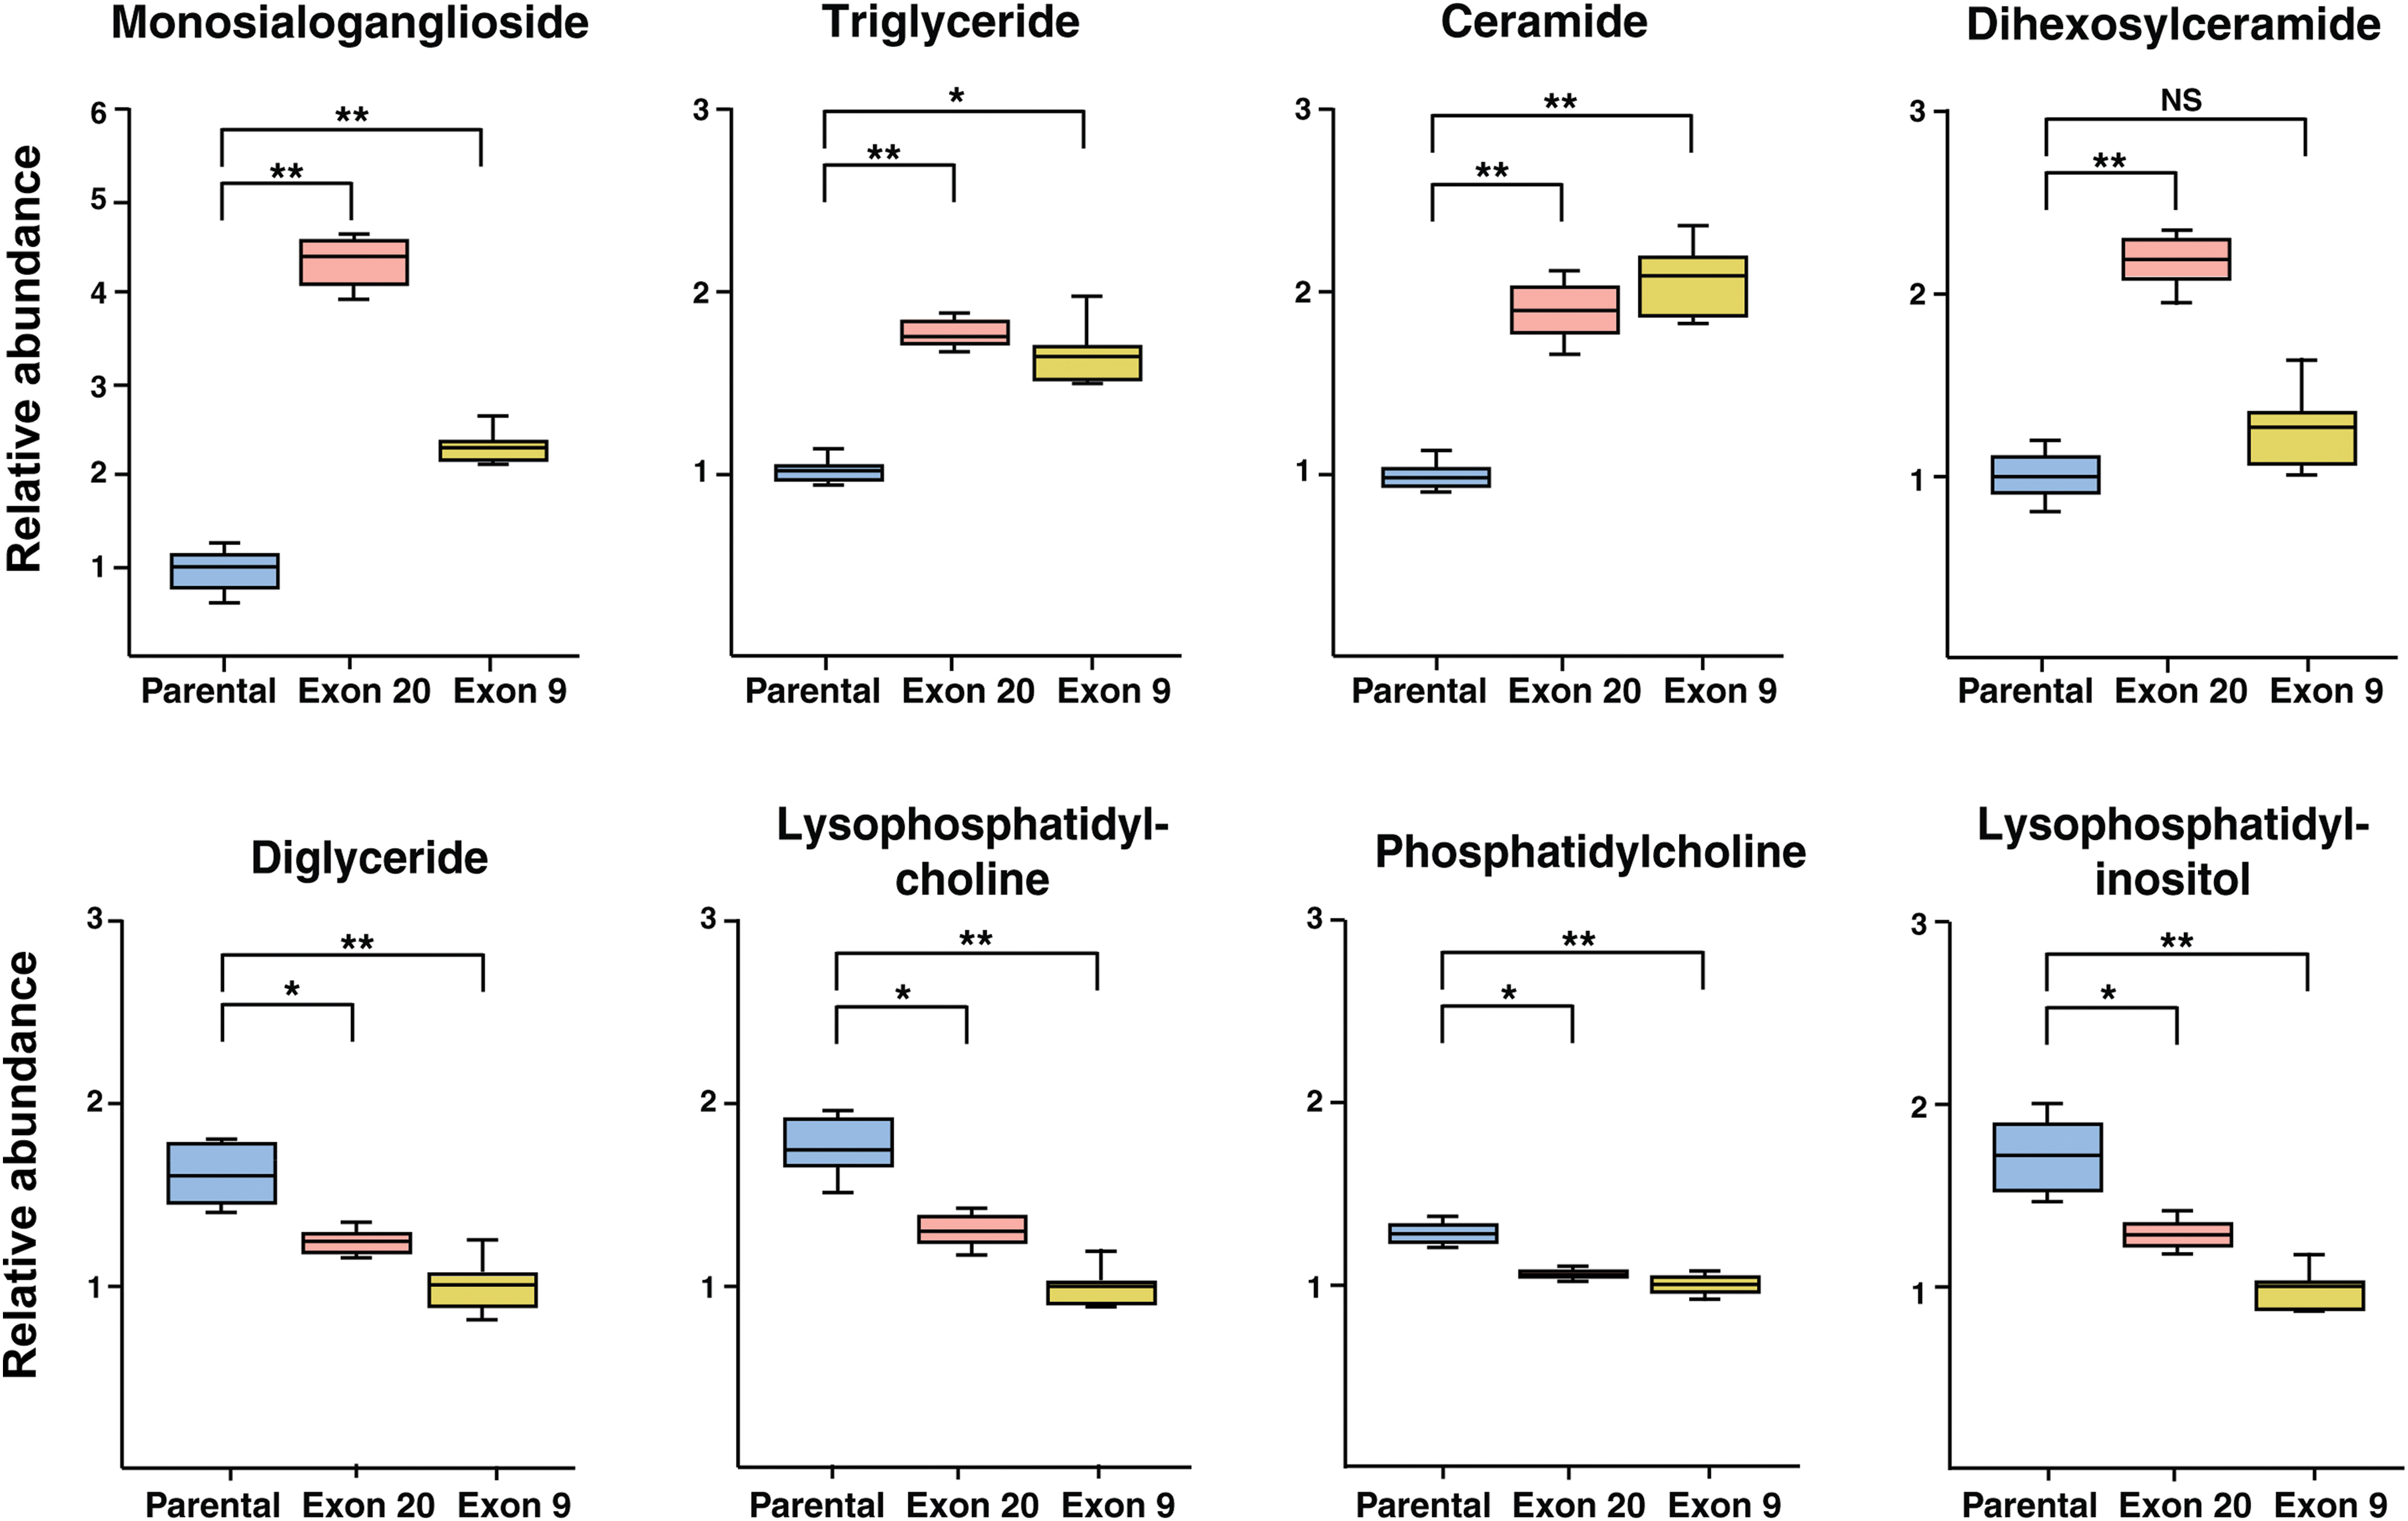
Box plots of lipids showing changes in Exon 9 or Exon 20 versus parental MCF10A cells. *Adjusted p < 0.01; **adjusted p < 0.001.
Relative Changes of Lipids in Isogenic PIK3CA Mutants Compared with Parental Cells
Of various classes of lipids, GM3 exhibited the largest changes in PIK3CA mutant cells as it was increased by fourfold and twofold with p < 0.001 in Exon 20 and 9, respectively (Fig. 3). GM3 is a lactosylceramide with sialic residue and synthesized from lactosylceramide by GM3 synthase. GM3 and its synthase play distinct roles in affecting cancer cell motility and PI3K/AKT activity, depending on the cell types and growth factors (Zheng et al., 2019). GM3 expression is correlated with tumor growth and its expression is high in several cancer types, including renal cell carcinoma, melanoma, and colon cancer (Handa and Hakomori, 2012; Tringali et al., 2012).
GM3 synthase induces anchorage-independent growth and promotes migration and invasion of cancer cells (Gu et al., 2008), whereas suppression of GM3 synthase has been reported to inhibit cancer cell migration and invasion. DHC is a precursor of GM3 and DHC is also increased in Exon 20 mutant by twofold compared with the parental cell line (Fig. 3), indicating increased GM3 synthase in the mutant. These results are consistent with a previous study showing that GM3 enhanced cancer cell motility through activation of the PI3K/AKT pathway (Li et al., 2013).
PI3K/AKT is known to stimulate both lipid synthesis and lipid uptake in multiple types of cancer cells (Feng and Kurokawa, 2020). Lipid droplets are primarily considered as a deposit of lipids that exist in various human cells, including adipocytes. Not only are they known to store fats, but they also modulate lipid, endoplasmic reticulum, and membrane homeostasis (Farese and Walther, 2009; Petan et al., 2018). Lipid droplets are also known to accumulate in various cancer types and partake in tumor development and aggression by mediating inflammation (Cruz et al., 2020). The formation of lipid droplets is linked to neutral lipid synthesis as the core is largely made up of TG (Walther and Farese, 2012). TG is synthesized from DG by diglyceride acyltransferase (DGAT) enzymes at the last step of neutral lipid synthesis (Walther and Farese, 2012).
Our study discovered higher levels of TG in both mutants, whereas those of DG were lower, which may be reflective of overexpression of DGAT in these hotspot mutations (Fig. 3). Previous studies have also reported overexpression of DGAT enzymes in cancer cells and tissue, including breast and prostate cancer (He et al., 2021; Hernandez-Corbacho and Obeid, 2019) and inhibition of DGAT can reduce proliferation of prostate cancer cells (Hernandez-Corbacho and Obeid, 2019). Thus, our results on changed levels of TG and DG suggest that PIK3CA hotspot mutations may lead to increased production of lipid droplets that promote cancer cell proliferation and tumorigenesis.
Both Exon 9 and Exon 20 mutants exhibited a nearly twofold increase of Cer with p < 0.001 (Fig. 3). Cer can be synthesized through multiple pathways, including a recycling pathway from So to Cer by ceramide synthase (CerS) (Tettamanti et al., 2003) or de novo synthesis where sphinganine is acylated to form dihydroceramides by CerS and then dihydroceramides are oxidized to Cer. Whereas earlier studies observed reduced levels of Cer and depletion of CerS in several cancer types, including human head and neck squamous cell and carcinoma cells (Koybasi et al., 2004; Meyers-Needham et al., 2012), recent results have shown overexpression of CerS or elevated Cer in colorectal tumor tissues (Chen et al., 2015), colorectal cancer cells (Jang et al., 2018), lung cancer cells (Suzuki et al., 2016), oral cancer cells (Senkal et al., 2010), and gastric cancer cells (Uen et al., 2018), likely related to the antiapoptotic role of Cer (Morad and Cabot, 2013).
Interestingly, in a study by Suzuki et al. (2016) knockdown of one of CerS enzymes, CerS6, in lung cancer cells reduced cell migration and invasion, which is in line with our previous observations showing enhanced motility of Exon 9 and Exon 20 mutant cells (Wu et al., 2014). As one of the CerS family members, CerS6 generates Cer containing C14- and C16-FAs, and Cer (d18:0/16:0) and Cer (d18:1/16:0) species were increased significantly (p < 0.01) in both mutants (Supplementary Table S1).
Similar to other classes of lipids, LPC also plays diversified roles in the development of multiple human diseases, including cancer (Liu et al., 2020). Correlation of reduced LPC to cancer has been reported. Plasma or serum LPC were decreased in ovarian cancer (Kim et al., 2014), colorectal cancer (Zhao et al., 2007), digestive tract tumors (Kuliszkiewicz-Janus et al., 1996), renal cell carcinoma, and renal pelvic carcinoma (Sullentrop et al., 2002). LPC affects cellular functions by binding to G-coupled protein receptors and toll-like receptors (Flavahan, 1993; Okajima et al., 1998). LPC is derived from the cleavage of PC by phospholipase A2 (Gauster et al., 2005). In line with decreased LPC, PC was also reduced (p < 0.01) in both mutants (Fig. 3). Multiple studies have shown that LPC can inhibit cancer cell migration and invasion (Jantscheff et al., 2011; Raynor et al., 2015; Ross et al., 2016), which may explain why LPC is decreased in these mutant cells.
The lipid networks at the lipid sublevel for Exon 9 and Exon 20 as compared with parental cells are shown in Figure 4A and B, respectively. Several reaction pathways, including SM→Cer, DG→PE, and LPC→LPA, were found to be active, whereas Cer→SM and PC→DG were suppressed in both Exon 9 and Exon 20.
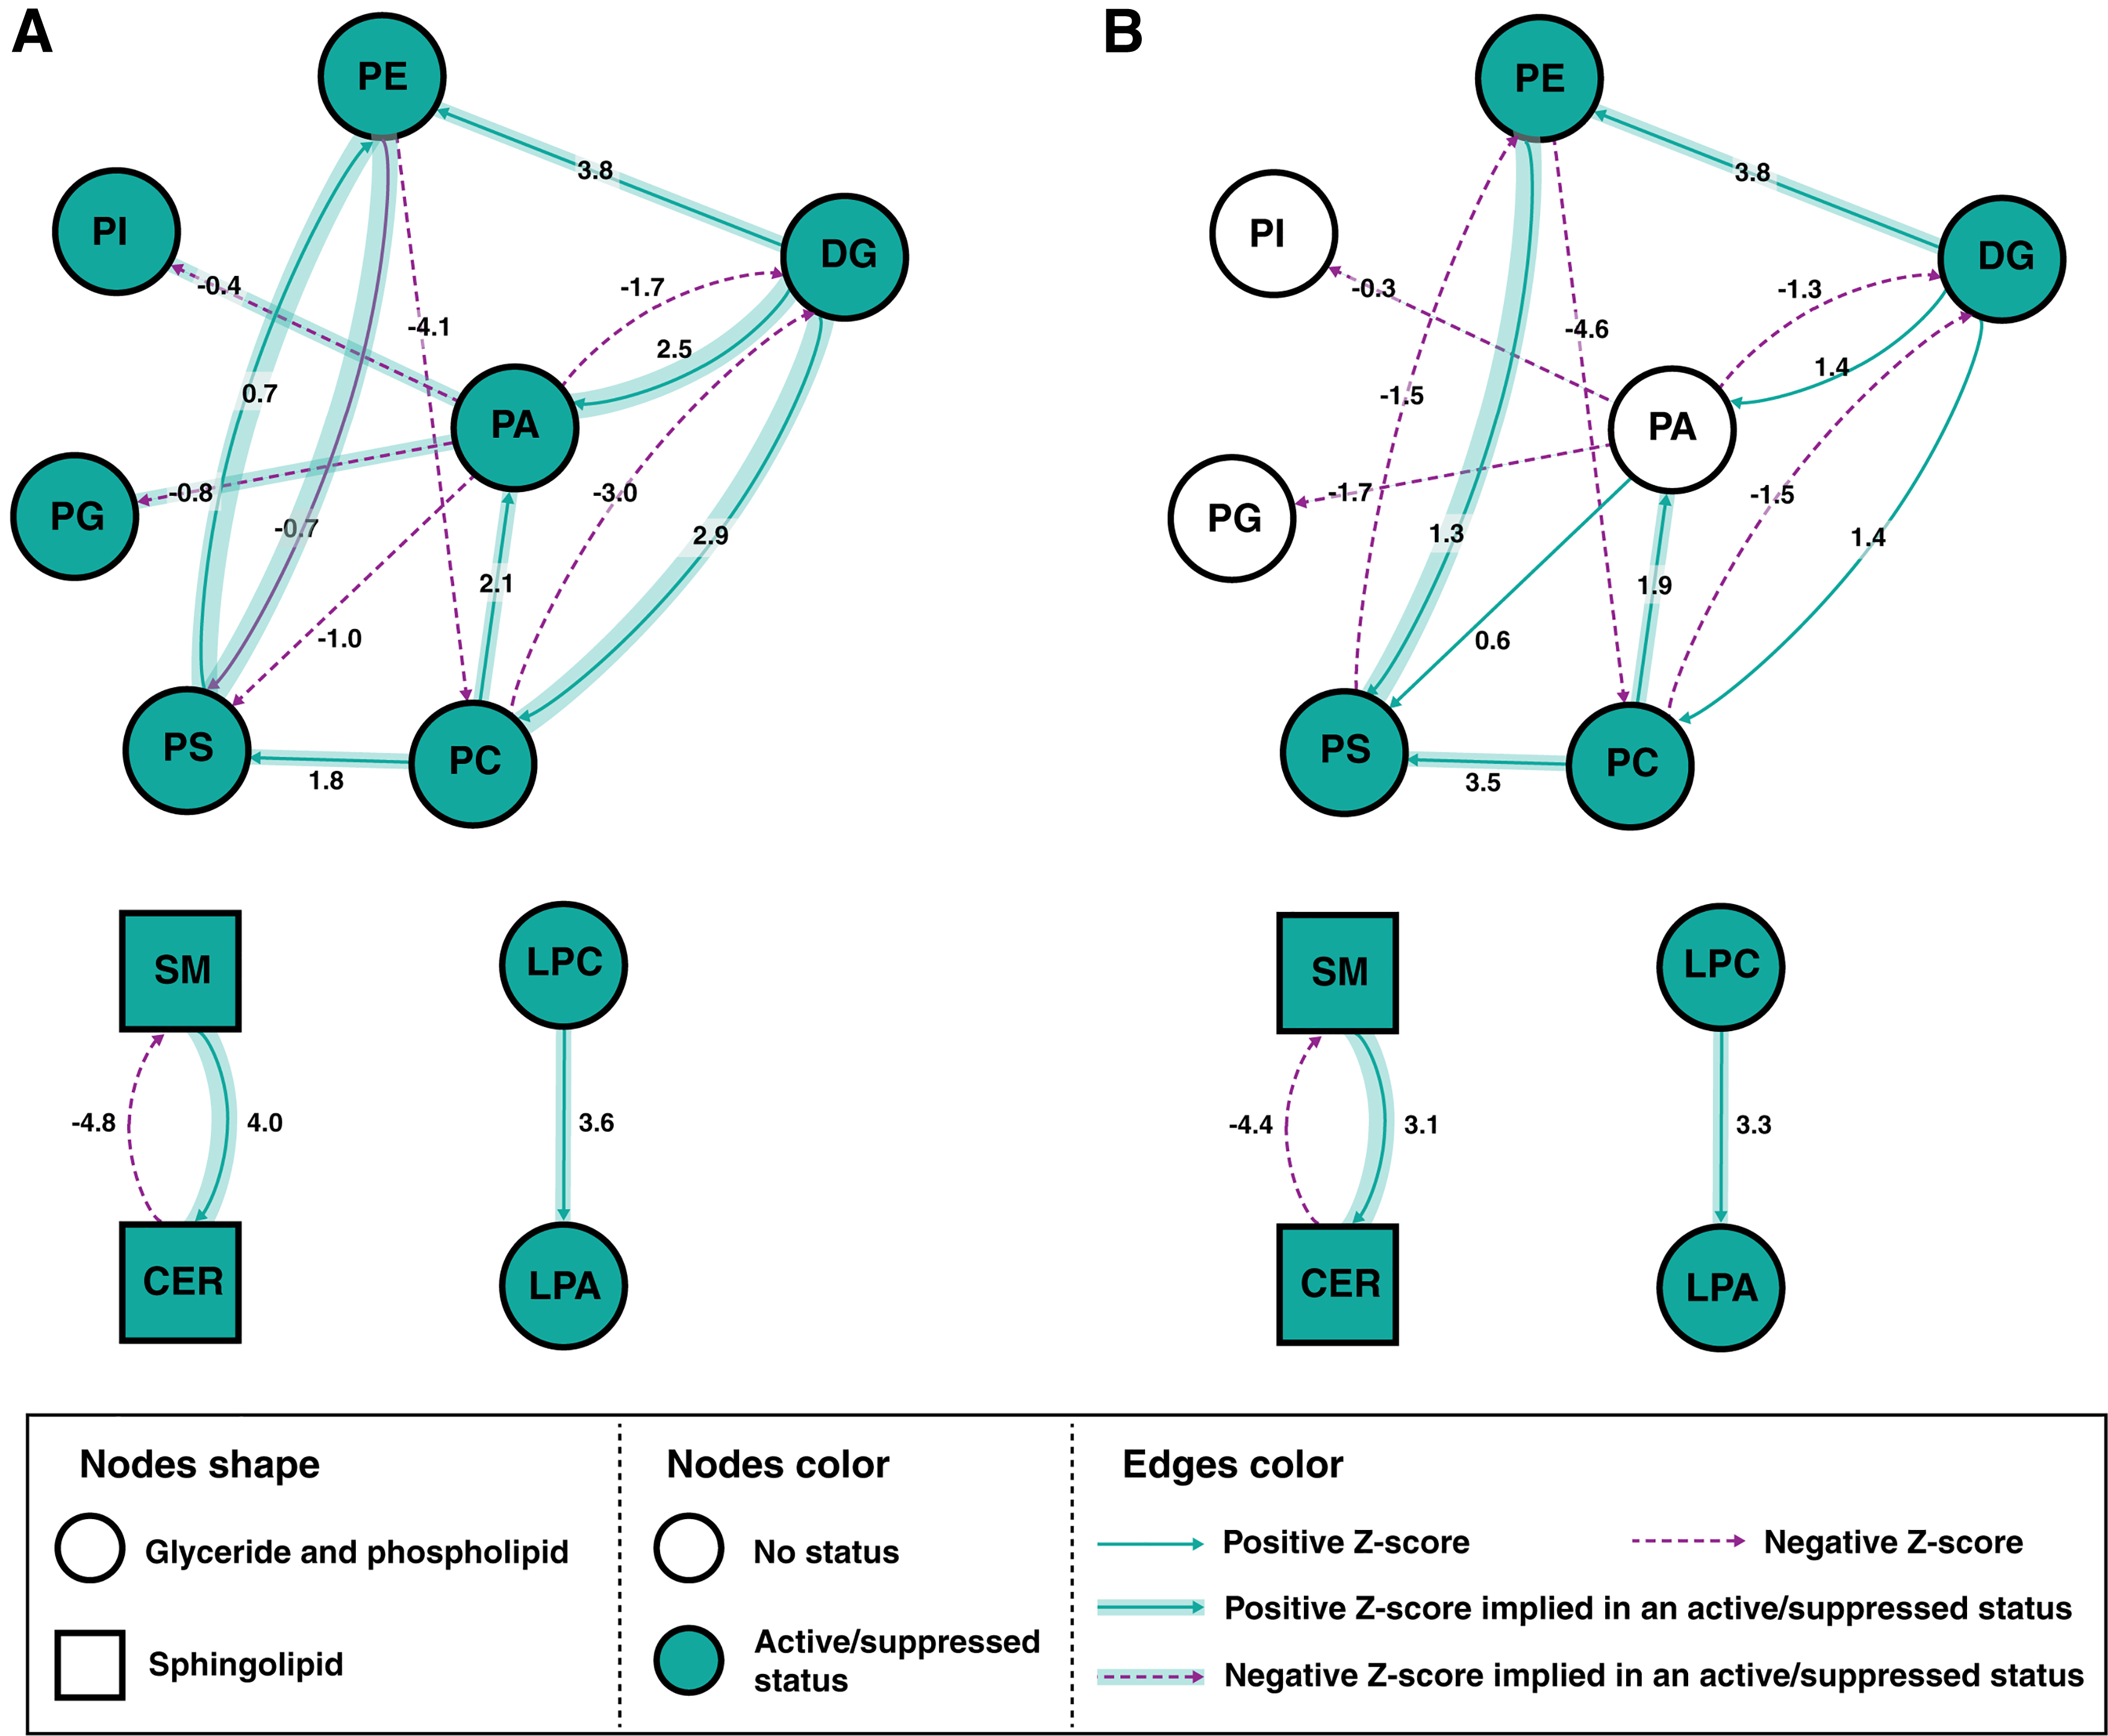
Lipid networks created using BioPAN for the
Conclusions
Our results demonstrate that levels of several classes of lipids are altered by E545K and H1047R mutations of PIK3CA in MCF10A breast epithelial cells. Overall, similar changes in these lipids in both mutants compared with parental cells were observed. Although these lipidomic alterations can be potentially linked to cancer cell motility, production of lipid droplets, and cancer cell apoptosis, the functional connection between the lipidomic changes and the tumorigenesis caused by the hotspot mutations of PIK3CA requires further investigation.
Footnotes
Authors' Contributions
Methodology, formal analysis, investigation, data curation, visualization, and writing—review and editing by J.H.J. Writing—original draft preparation, review, and editing by D.-Q.Y. Investigation and writing—review and editing by H.S. and X.Wang. Conceptualization, methodology, and writing—review and editing by X.Wu. Supervision and writing—review by K.P.K. Conceptualization, funding acquisition, writing—review and editing, and supervision by A.P. Methodology, data curation, visualization, writing—original draft preparation, review and editing, and supervision by S.K.B.
Author Disclosure Statement
The authors declare they have no conflicting financial interests.
Funding Information
This study was supported in part by a grant from NCI to the Mayo Clinic Comprehensive Cancer Center (P30CA15083).
Abbreviations Used
References
Supplementary Material
Please find the following supplemental material available below.
For Open Access articles published under a Creative Commons License, all supplemental material carries the same license as the article it is associated with.
For non-Open Access articles published, all supplemental material carries a non-exclusive license, and permission requests for re-use of supplemental material or any part of supplemental material shall be sent directly to the copyright owner as specified in the copyright notice associated with the article.