
Abstract
Abnormal blood pressure is strongly associated with risk of high-prevalence diseases, making the study of blood pressure a major public health challenge. Although biological mechanisms underlying hypertension at the single omic level have been discovered, multi-omics integrative analyses using continuous variations in blood pressure values remain limited. We used a multi-omics regression-based method, called sparse multi-block partial least square, for integrative, explanatory, and predictive interests in study of systolic and diastolic blood pressure values. Various datasets were obtained from the Finnish Twin Cohort for up to 444 twins. Blocks of omics—including transcriptomic, methylation, metabolomic—data as well as polygenic risk scores and clinical data were integrated into the modeling and supported by cross-validation. The predictive contribution of each omics block when predicting blood pressure values was investigated using external participants from the Young Finns Study. In addition to revealing interesting inter-omics associations, we found that each block of omics heterogeneously improved the predictions of blood pressure values once the multi-omics data were integrated. The modeling revealed a plurality of clinical, transcriptomic, and metabolomic factors consistent with the literature and that play a leading role in explaining unit variations in blood pressure. These findings demonstrate (1) the robustness of our integrative method to harness results obtained by single omics discriminant analyses, and (2) the added value of predictive and exploratory gains of a multi-omics approach in studies of complex phenotypes such as blood pressure.
Introduction
Hypertension is a pathological elevation of blood pressure associated with greater risk of high-prevalence diseases. In particular, hypertension is known to increase the risk of cardiovascular disease (Jordan et al., 2018) as well as cerebrovascular and renal diseases (Kelly and Rothwell, 2020; Ku et al., 2019), making its study of major public health importance. In addition to its broad effects, hypertension has multiple origins, including environmental causes such as nutrition and excessive alcohol consumption (Puddey et al., 2019; Schwingshackl et al., 2017). It also has a substantial genetic component, as demonstrated by twin and molecular genetic studies (Arnett and Claas, 2018). The existence of genetic and environmental influences on blood pressure further motivates the use of omics data.
The advent of high-throughput technologies has made it possible to obtain sufficiently large volumes of data to highlight significant findings and to gain insight into the biological mechanisms underlying hypertension. Many studies have thus examined the structural and functional genomics of blood pressure using genetic variants and transcriptomics, respectively (Huang et al., 2020; Surendran et al., 2020). Environmental influences have also been investigated, for example, through methylation studies and high-throughput clinical phenotypes in the field of phenomics (Irvin et al., 2021).
Although biological mechanisms underlying hypertension at the single omic level have been discovered, multi-omics integrative analyses using continuous variations in blood pressure values remain limited. Evaluation of the integrated predictive value of various molecular substrates of hypertension is also actively being pursued (Baek et al., 2020; Kwong et al., 2018; Wang et al., 2018). A better understanding of the mechanisms reflecting unitary changes in blood pressure could allow for fine mapping of interindividual differences than those captured by discriminant or categorical analyses. Binary discretization of individuals into normotensive and hypertensive status fails to capture risk factors likely to increase or decrease blood pressure within the normotensive or hypertensive patient groups.
Integration across multiple omics knowledge domains to dissect the phenotypes associated with blood pressure regulation and hypertension is much needed in the present moment. It is in response to these challenges and prospects that this study was undertaken.
We integrated blood pressure data, specifically transcriptomic, methylation, clinical, metabolomic, and polygenic risk scores (PRS) from participants of the Finnish Twin Cohort (FTC) to gain insight into the intra- and inter-omics biological mechanisms underlying unitary increases in systolic blood pressure (SBP) and diastolic blood pressure (DBP). We also present the predictive performance of each of these omics blocks within a multi-omics model based on a regression-type method called sparse multi-block partial least square (sMBPLS). Predictive performance was assessed by comparing the predictions of SBP and DBP values in a test cohort of substantial size with their measured values.
Materials and Methods
Data blocks and sources
The study protocol was approved by the Institutional Ethics Board of the Hospital District of Helsinki and Uusimaa, Finland (ID 154/13/03/00/11) and the Institutional Review Board of Augusta University. Omics datasets were obtained from within the FTC (Kaprio et al., 2019) for up to 444 twins, and all applicable written and informed consent was obtained in relation to the data generated or used for analysis.
Twins were selected based on responses to items on blood pressure and hypertension in the fourth survey of the FTC in 2011–2012; twin pairs with a difference in blood pressure were targeted, as previously described in detail (Kaprio et al., 2019). The twins came in for 1 day of measurement of blood pressure, completed interviews and questionnaires and provided a fasting blood sample for biochemical measures, and samples for omics. In addition, weight, height, and waist and hip circumference were measured (Tuomela et al., 2019).
In total, clinical, metabolomic, methylation, transcriptomic, and PRS data were collected for a subset of this initial number of participants. Metabolomic data for 434 participants were collected with nuclear magnetic resonance spectroscopy and included in the study. The proportion of individuals with methylation (Illumina 450k) and transcriptomic data (Microarray) was lower (360 participants for methylation, 389 participants for transcriptomic data) (Fig. 1). Four PRSs related to SBP, DBP, body mass index (BMI), and coronary artery disease (CAD) were also included.
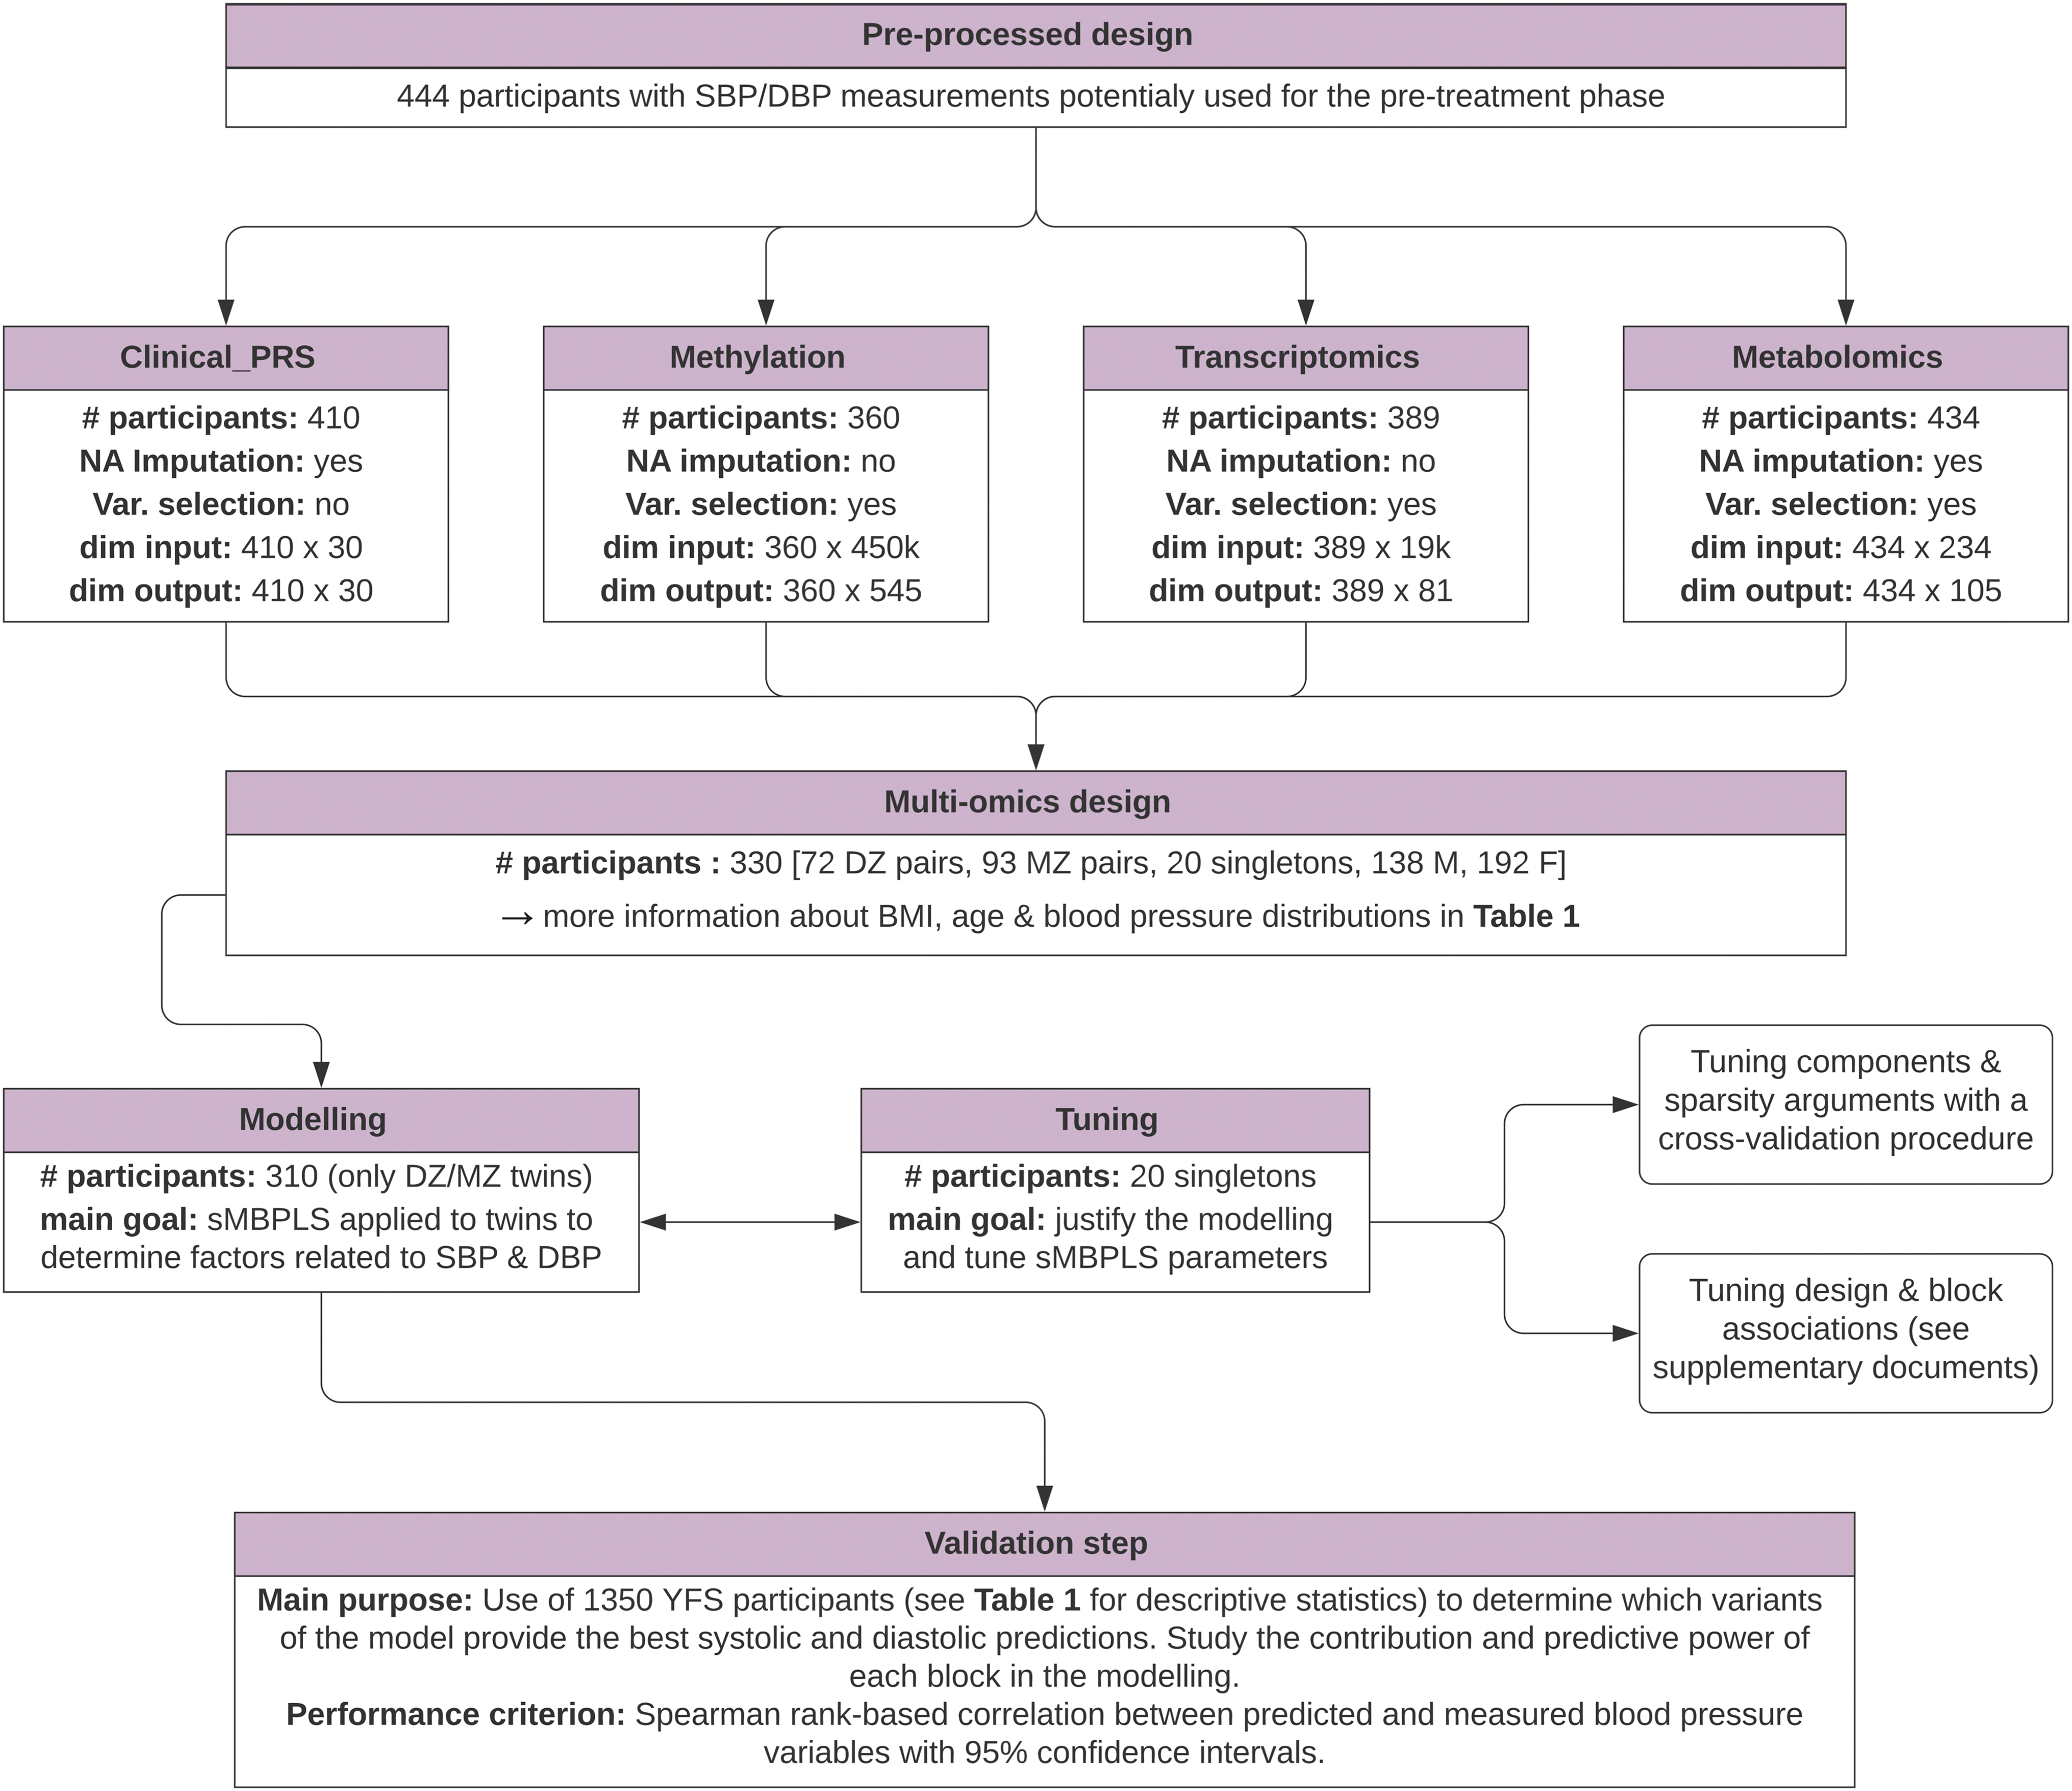
Study design diagram. The study design is structured into three main phases: a preprocessing phase at the scale of each omic, a multi-omic modeling phase and a prediction phase. #, number; DBP, diastolic blood pressure; dim, dimension; DZ, dizygotic; F, female; M, male; MZ, monozygotic; NA, missing value; SBP, systolic blood pressure; Var., variable.
The preprocessing steps of each omics block before integration into the model sometimes required, for example, imputation of missing values and selection of variables (Supplementary Document, Section S1). Once these preprocessing steps were completed, four omics blocks of different dimensions were considered for the modeling phase (Fig. 1) (Abayomi et al., 2005; Aryee et al., 2014; Benton et al., 2017; Boks et al., 2009; Cazaly et al., 2016; Domingo-Relloso et al., 2021; Du et al., 2008; Friedman et al., 2010; Hayati Rezvan et al., 2015; Honaker et al., 2011; Kaprio et al., 1987; Keil et al., 1991; Lin et al., 2008; Nikpay et al., 2015; Price et al., 2006; Salvador et al., 2019; Triche et al., 2013; van Buuren and Groothuis-Oudshoorn, 2011; Vilaplana, 2006; Waldmann et al., 2013; Yengo et al., 2018; and Zou and Hastie, 2005).
In addition to the FTC participants, data from the Young Finns Study (YFS) (Raitakari et al., 2008) were used for the predictive phase of our study. This test cohort consists of a total of 1350 participants for whom the same omics blocks as described above for the FTC were available (Supplementary Document, Section S2 for details of the methylation preprocessing methodology) (Ahola-Olli et al., 2019; Elovainio et al., 2015; McCartney et al., 2021; Soininen et al., 2015; Võsa et al., 2021). A large number of variables within each block have been retrieved, although some were missing (Performance Criteria and Data Linkage sections). Clinical differences between the YFS and FTC cohorts were noteworthy, as reflected in the blood pressure values and age distributions (Table 1).
Description of the Finnish Twin Cohort and the Young Finns Study Participants
The distributions of BMI and waist circumference were similar between the two cohorts, but differences in alcohol consumption, age, SBP and DBP distributions were observed. Age in years.
Alc, alcohol consumption (g/month); BMI, body mass index in kg/m2; DBP, diastolic blood pressure (mmHg); F, female; M, male; Pctl, percentile; SBP, systolic blood pressure (mmHg); Waist, waist circumference (cm).
Integrative methods
Latent structures and integration
Partial least square (PLS) regressions, sometimes referred to as latent structure projections, are a family of methods that proceed by deriving latent variables defined as linear combinations of variables (Abdi and Williams, 2013). One of these PLS-based methods adapted to a multi-omics context, called sMBPLSs, was used to integrate the different omics blocks into a single model. sMBPLS calculates latent components for each block (hereafter referred to as block-related components) and for the outcome matrix Y before averaging the block-related components to obtain upscaled latent components (Li et al., 2012). These computations were carried out by iteratively maximizing the covariance between the latent components, defined as weighted sums of the block-related components, and the latent components of the Y matrix.
This method therefore expresses Q omics block matrices X1,…,XQ as matrix products of block-related components by loading vectors (Q = 4 in this study), and provides upscaled latent components used in our study to predict a two-dimensional Y matrix composed of the SBP and DBP variables.
The sMBPLS modeling was performed using methods implemented in the mixOmics R package (Rohart et al., 2017). In addition to the classical sMBPLS structure, the mixOmics package introduces a so-called design matrix, allowing for linking each omics block to influence the covariance maximization phase (Lê Cao and Welham, 2021). This Q × Q design matrix, commonly noted as C, associates an omics block to another omics block using a coefficient defined on the segment [0,1] (0 = no link, 1 = complete association). Because the choice of this matrix is based on a priori and observational choices, we used all the participants who did not have their co-twin (Fig. 1) among the initial 330 to estimate this matrix, resulting in the selection of 20 participants, hereafter called singletons.
This exploratory approach allowed us to tune the design matrix (Supplementary Document, Section S3 and Supplementary Fig. S1 and Supplementary Table S1) by introducing a metric weighting the systolic and diastolic root mean square error (RMSE). Two nonzero omics block associations minimized this metric: a moderate association (0.4) between the Metabolomics and Clinical_PRS blocks as well as a weak association (0.1) between the methylation and transcriptomics blocks. The design matrix was therefore set accordingly. Each block Xi was also penalized with a penalty term λi that enables variable selection in each omics block. These λi,…, λQ (Q = 4) constrain the number of variables within each block.
To avoid defining sparsity arguments and the number of components (k) based on a biological a priori, we implemented a cross-validation procedure in a mixOmics framework to automatically select the best combination (k*,
Cross-validation procedure
Links between sMBPLS and traditional methods such as principal component analysis (PCA) exist, insofar as PCA aims to summarize information from linear combinations of variables to project individuals into a reduced space built from components. Within the framework of PCA, some tools make it possible to establish an optimal number of components to be selected to optimize the explained variance wisely; one can note the use of elbow or Kaiser criteria as examples. In the sMBPLS framework, this selection is more subtle and no automatic mixOmics method exists when it comes to a quantitative Y matrix to be regressed: cross-validation is only available for the discriminant version of sMBPLS, called sMBPLS-DA. The main drawback of the sMBPLS-DA cross-validation procedure is the computational time cost, because the sparsity arguments applied to each block as well as the number of components k make rapid increase in the number of modeling combinations to be tested.
With the awareness of the potential computational shortcomings of this type of cross-validation procedure, we implemented a self-governed cross-validation tailored to sMBPLS (Li et al., 2012) in R using the features of mixOmics (Supplementary Document, Section S4). A total of N = 310 individuals were therefore distributed into L = 10 groups before training L models on N − N/L individuals to derive the loadings and weight vectors. A CV score was calculated at each iteration, for each combination of sparsity arguments λi (i = 1,…,Q) and number of components k. The best model combination minimizes the CV score.
Predictive methods
Data linkage
Although all blocks were overlapped in the YFS test cohort, the variables in each block were only subsets of the variables in the corresponding block in the FTC cohort. Of the clinical data, almost one-third of the variables were not retrieved in the YFS data. Lymphocytes, neutrophils, B neutrophils, B lymphocytes, and the two PRS variables for SBP and DBP were not available. The PRS for CAD risk and the PRS for BMI were obtained using a p-value threshold of 10−5 (Võsa et al., 2021). Only 5 of the 105 metabolomic variables were missing in the YFS data; the other 100 variables did not suffer from missing values.
YFS methylation data were obtained from Illumina EPIC, and the β-values were computed (Supplementary Document, Section S2). CpG site selection was carried out by name linkage with the FTC methylation data, leading to the selection of 463 methylation variables from the original 545. The selection of transcriptomic variables was more subtle, as several probes pointed to the same genes (MYADM, CD97). To match each probe obtained with FTC data and those available within the YFS data, a linkage by ProbeID was performed. A total of 66 YFS transcriptomic variables were thus retrieved, whereas there were 81 in the FTC data.
A consequence of missing variables and cohort heterogeneity may be a significant bias in predictions. The absence of a few clinical variables with strong predictive power should be avoided even if the mixOmics package allows predictions to be made from partially missing data. To reduce the discrepancies in predictions, a correction for batch effect using the Combat method (Leek et al., 2012) on transcriptomic and methylation data was carried out (Supplementary Document, Section S5 and Supplementary Fig. S2). This correction resulted in a reduction of the dimensions of the FTC transcriptomic and methylation datasets, as the batch correction imposes the same FTC and YFS variables. This operation was necessary as predictions without batch-effect correction proved unreliable because the prediction errors were particularly high.
Performance criteria
In addition to missing variable management, significant clinical heterogeneity between the two cohorts was observed and suspected to introduce prediction biases as illustrated by the age distribution of the two cohorts (Table 1). These cohort differences may bias an RMSE-type measure as the weight given to age in the modeling based on FTC participants is likely to be underestimated when using the YFS test cohort. For all these reasons, a rank-based Spearman correlation ρ was preferred as a performance measure. Besides the correlation coefficients, 95% confidence intervals were calculated as implemented in the DescTools R package (Signorell et al., 2021).
This performance measure was used both to estimate the correlation between predicted and observed blood pressure values in the YFS and FTC cohorts as well as to gauge the correlation between variables and the phenotypic traits of interest (SBP and DBP). Correlation nullity tests were also undertaken using R base implemented functions.
Results
Parameter estimation and cross-validation
Under the optimal design matrix outlined in the Materials and Methods section, the number of components was set to k = 1 pursuant to the CV score values (k = 1: pooled CV score = 166,198, standard deviation [SD] = 386; k = 2: pooled CV score = 309,956, SD = 1082; k = 3: pooled CV score = 348,222, SD = 26,422). A final cross-validation procedure was performed to tune the sparsity arguments related to the Clinical_PRS and Metabolomics blocks because variable selection was already performed on the transcriptomic and methylation data (Supplementary Document, Section S1).
The CV score over 20 iterations by testing different sparsity value ranges (2 × 2 for the Clinical_PRS block and 4 × 4 for the Metabolomic block simultaneously) revealed that a nonsparse model produces the lowest CV score. This result can be explained by the fact that the weights of the Clinical_PRS and Metabolomic blocks were found to be consistent in both the integrative and predictive phases of our study. The definition of the CV score (Li et al., 2012) thus likely offered a significant weight to the variables of these two blocks in the creation of the CV score, strongly penalizing the removal of one of them.
When tuning sparsity arguments in the methylation and transcriptomic blocks, differences in CV score as a function of sparsity restriction were heterogeneous. These differences were weak for the methylation block: the CV score with all 466 methylation variables remained within 1 SD of the CV score with 100 methylation variables. In the transcriptomic block, the CV score was more sensitive to changes in sparsity: a nonexistent sparsity argument significantly minimized the CV score. In addition to showing difficulties in association with other blocks (Supplementary Document, Section S3), the cross-validation procedure pointed to the low weight of CpG sites in minimizing the CV score criterion.
Uneven predictive gains across omics blocks
To estimate the predictive contribution of each omics block within the modeling (k = 1; no sparsity arguments), systolic and diastolic data from the 1350 participants in the YFS cohort were predicted from block permutations. Spearman correlation coefficients were calculated, as described in the Materials and Methods section, to estimate the correlation between predicted and measured blood pressure values (Table 2). The performance of six models was studied, including the original four-block model (noted as C+Me+T+Mb hereafter). A three-block model excluding the methylation block (C+T+Mb) was also studied, for which only the Clinical_PRS/Metabolomics association of the design matrix was preserved. In addition to these two permuted models, four submodels corresponding to four single-block PLS regressions, that is, simple PLS regressions, were used to highlight the predictive power of each isolated block.
Predictive Performance Expressed as Spearman Correlation Coefficients by Permuting Omics Blocks in the Model
The three-block model achieved the best predictive performance for both SBP and DBP, highlighting the failure to integrate methylation data for which the Spearman correlation between blood pressure measurements and blood pressure predictions was not significantly non-null at the 5% threshold in a single-block context.
CI, confidence interval of ρ; C, Clinical_PRS; Mb, metabolomics; Me, methylation; PRS, polygenic risk scores; T, transcriptomics.
The omics blocks had heterogeneous predictive power (Table 2). We reported a Spearman correlation close to 5% for the methylation data, for both SBP and DBP, in a single-omic setting. The 95% confidence intervals also contained the value 0 by a small margin in both SBP and DBP; methylation data struggled to provide good predictions (Spearman correlation nullity test, p-value >5% for DBP and SBP). Integration of methylation data in the four-block modeling was also deemed to be deleterious, insofar as the Spearman coefficient ρ was 9.4% lower in the case of DBP (compared with 7.7% in the case of SBP). Once the methylation block was removed from the four-block model, the three-block model obtained the best predictive performance, with a ρ close to 50% for DBP.
Although the differences in predictive performance between the three-block and single-omics models appear to be slight, biological and technical limitations prevent particularly high correlation coefficients from being obtained and strong statistical differences from being shown. Cohort differences (age and blood pressure distributions in particular) and missing clinical predictors illustrate these limitations. Integrating multiple blocks also averages each block-related latent variable into a single latent variable, thus explaining the difficulty of significantly improving predictions although the modeling has been enriched. These block-related components also showed consistent predictive powers compared with those obtained in single-omics predictive phases (Table 2), while embedded in a multi-omics model.
Indeed, the distributions of each of these block-related components of the first and last decile of DBP, that is, the 10% of participants with the lowest (compared with highest) DBP in each of the two cohorts, show a slight replication defect of the transcriptomic data (Fig. 2). Similar to the weaker predictions reported for the transcriptomics block in single-omic settings (ρ = 17.6% for SBP, ρ = 14.7% for DBP; Table 2) compared with those measured for the metabolomics and clinical data, we observed a greater weakness of the transcriptomic block in distinguishing the first and last DBP decile of the YFS cohort in a multi-omics framework. Projections of the first and last DBP decile of the YFS test cohort onto the Metabolomic and Clinical_PRS block-related components have been more convincing in that their distribution is markedly different along the component (Fig. 2).
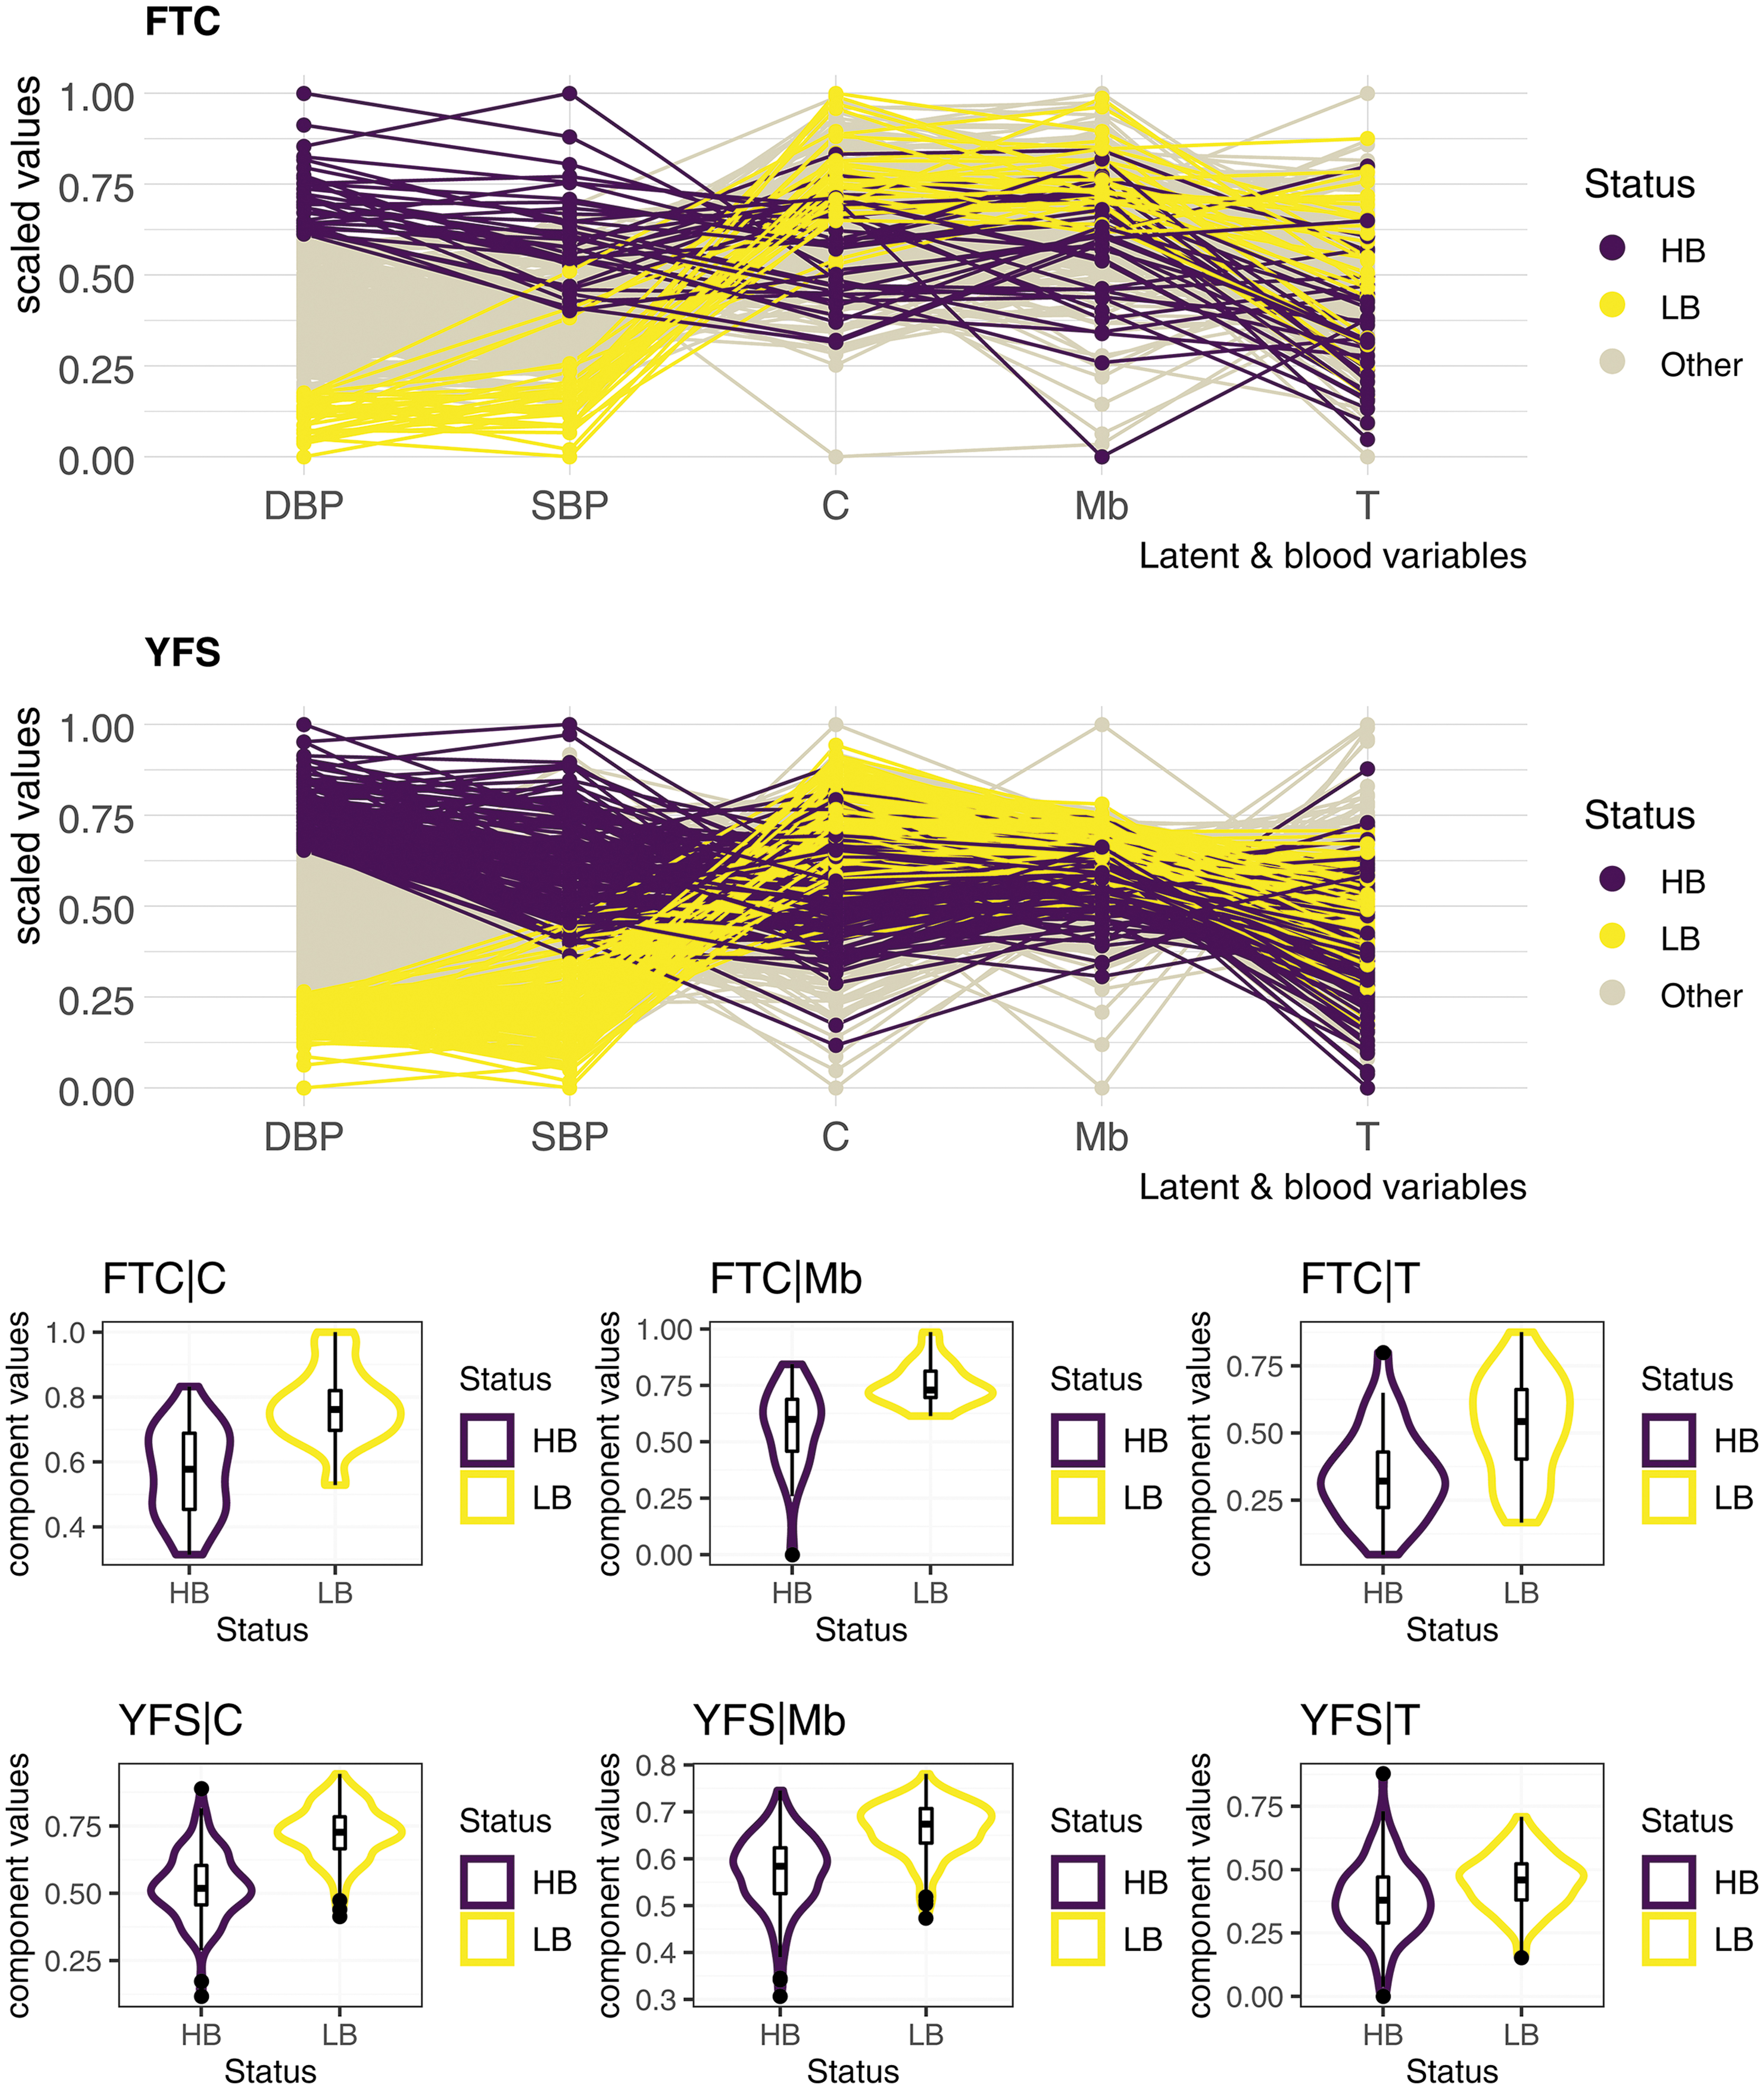
Projection of participants of both cohorts on each block-related component. Despite strong differences in the distribution of diastolic (and systolic) blood pressure between the two cohorts (Table 1 and Supplementary Document, Section S4), the three-block model distributed the first and last decile participants fairly distinctly over its block-related components. The transcriptomic component, however, lost some of its strength in that the distributions of the first and last decile on the YFS cohort are considerably closer. Blood measures and block-related components were scaled in each of the two cohorts to obtain this figure. C, clinical_PRS; HB, last decile; LB, first decile; Mb, metabolomics; PRS, polygenic risk scores; T, transcriptomics; YFS, Young Finns Study.
Global view of the modeling
To better understand the biological relevance of a multi-omics approach in the study of blood pressure values, the loading vectors of the three-block model (C+T+Mb) were derived. These have the function, as in the case of a PCA, of showing which variables contribute most to the creation of the sMBPLS block-related components. The log p-values obtained by testing the nullity of the Spearman correlation between each transcriptomic variable and SBP or DBP corrected for age, sex, and BMI in the YFS test cohort were compared with the loading factors of these transcriptomic variables in the modeling (Fig. 3). Genes contributing little to the creation of the transcriptomic-related component, that is, having a loading factor close to 0, struggled to be replicated within the YFS cohort, whereas the key replicated genes identified in the variable screening step (Supplementary Document, Section S1) had a major role in the modeling.
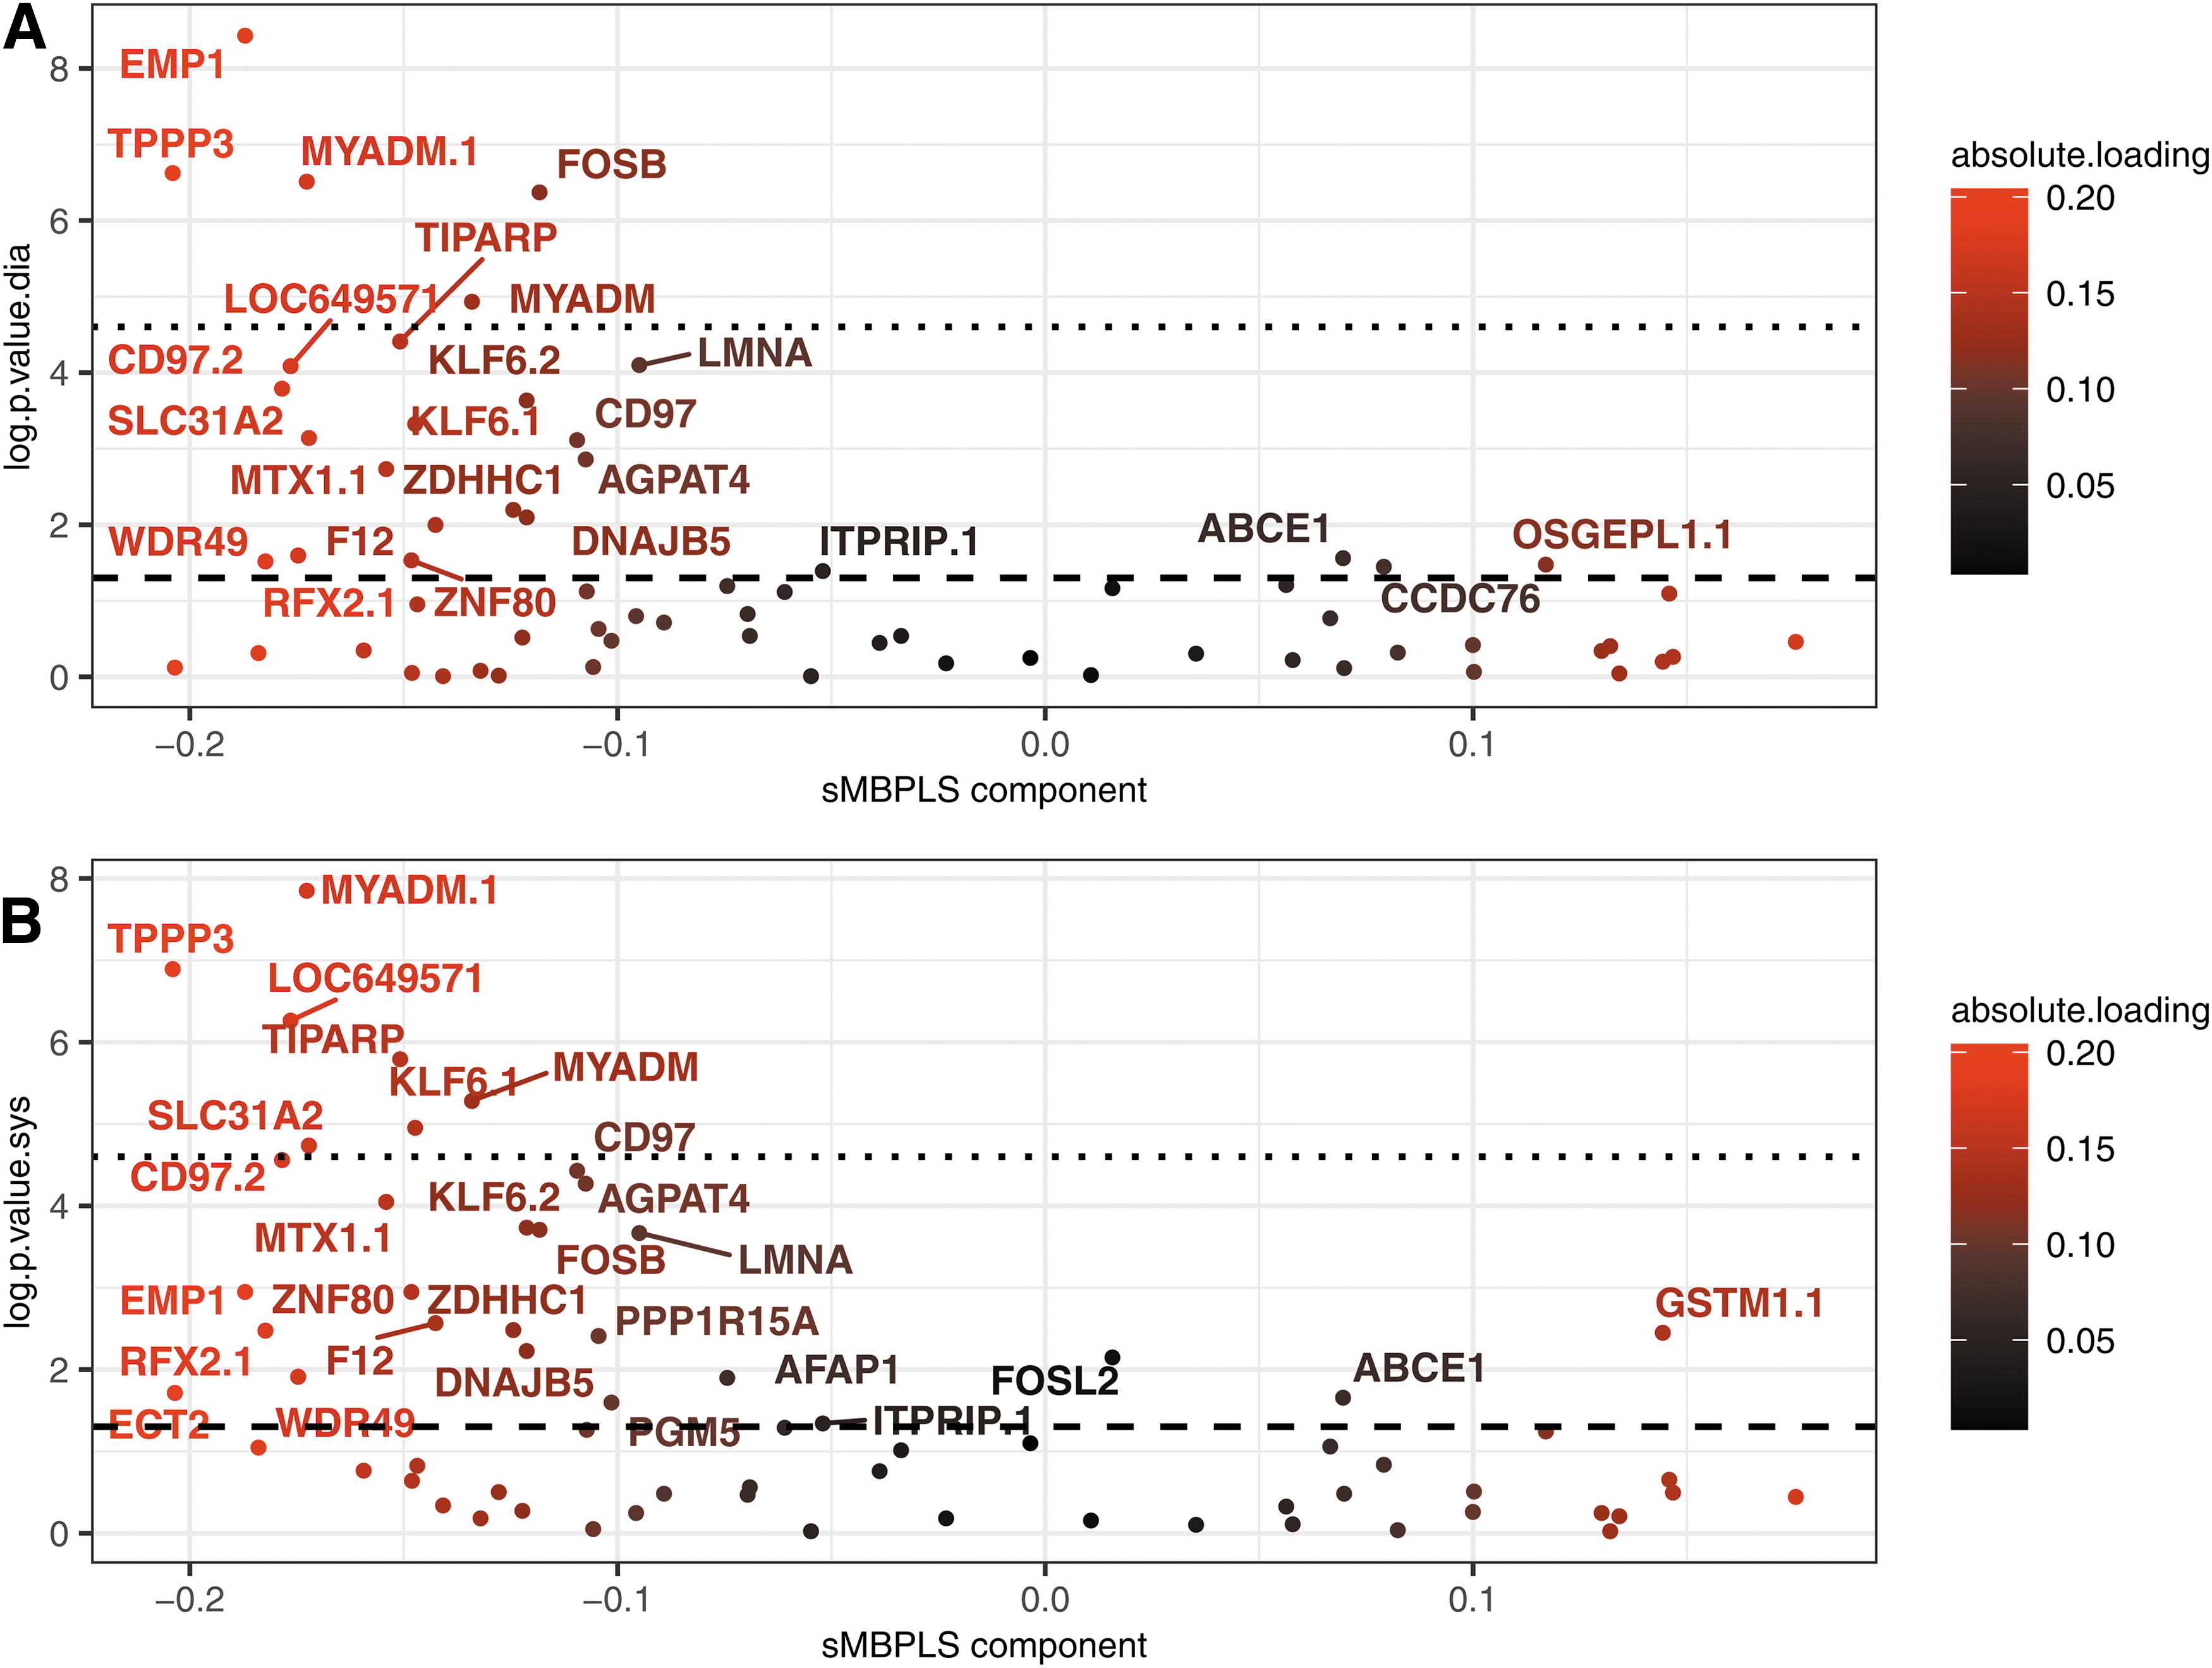
Transcriptomic loadings compared with p-values in Spearman's correlation nullity test in corrected SBP and DBP applied on YFS participants. Genes contributing the most to the creation of the transcriptomic component, that is, having high loading factors in absolute value, tended to have low Spearman's correlation nullity test p-values compared with SBP and DBP controlled by age, sex, and BMI. The axis log.p.value.sys on plot
The transcriptomic values of the replicated TPPP3 and MYADM genes (Huan et al., 2015; Zeller et al., 2017) were significantly correlated with the corrected values of SBP and DBP in the YFS cohort, as these two genes remained significantly associated even after Bonferroni correction. High loading-factor genes TIPARP and SLC31A2, replicated in the hypertension and blood pressure literature (Huan et al., 2015; Zeller et al., 2017), remained significant after Bonferroni correction for SBP, but not for DBP. Other genes with low correlation null test p-values close to 10−5 like CD97, LMNA, F12, and AFAP1 were also found to be well represented in the hypertension literature (Kraja et al., 2017; Zeller et al., 2017). Thus, the modeling gave significant weight in the creation of the transcriptomic latent variable to genes replicated in both the YFS cohort and the hypertension literature, bridging the gap between the hypertension literature and our study dealing with unitary increases in SBP and DBP.
BMI and waist and hip circumference had particularly high loading factors (Table 3) reinforcing the clinical value of performing such measurements for predictive purposes. In addition to classical clinical variables such as lymphocyte or leukocyte counts, metabolomic variables were found to be related to BMI (e.g., branched chain amino acids [BCAAs] such as leucine and isoleucine) (Felig et al., 1969; Pietiläinen et al., 2008) and blood lipid levels. The association between BCAAs and blood pressure was also driving the modeling, extrapolating the known link between BCAAs and hypertension (Mahbub et al., 2020) to the study of blood pressure values. Although valine, 1 of the 3 BCAAs, played a minor role in the modeling, it was found to be highly correlated with the variables leucine and isoleucine for which a Pearson correlation of >70% in both cases was measured in the 310 FTC participants included in the modeling.
Ten Clinical and Metabolomic Variables with the Highest Absolute Loading Factors
co, concentration; f.a, fatty acid; LHDL, large high-density lipoprotein; ro, ratio.
Discussion
The integration of multiple datasets in multi-omics frameworks has become, in recent years, one of the leading methods to both compile knowledge in a domain and discover highly complex relationships between omics (Olivier et al., 2019). We conducted this study to extend the use of such integrative approaches in the study of blood pressure values. Metabolomic, clinical, and transcriptomic risk factors highlighted in the blood pressure modeling were widely replicated in the hypertension literature at the single omic level, proving the robustness of our approach to recover results usually obtained in single-omics and discriminative approaches.
In particular, the CD97, MYADM, TIPARP, SLC31A2, and TPPP3 genes strongly contributed in creating the transcriptomic latent variable. Their significant contribution corroborated the previous results in hypertension and blood pressure settings (Huan et al., 2015; Huang et al., 2018; Zeller et al., 2017) while also showing that the connection between blood pressure and hypertension remains tight when studying the transcriptome.
Metabolomic and clinical factors replicated in the hypertension literature have been highlighted as playing a key role in understanding blood pressure, such as BCAAs (Mahbub et al., 2020) and obesity-related measures (Tanaka, 2020) while spotlighting the link connecting BCAAs to obesity measures in the study of blood pressure values. The multi-omics approach thus allowed overlapping with replicated results in the hypertension and blood pressure literature, while providing new multi-omics insights and readout in understanding the biological mechanisms underlying blood pressure unit variations.
The findings of our study go beyond novel biological contributions: they are part of a clinical and public health context and perspective. An in-depth understanding of the blood pressure-related mechanisms is of definite clinical and public health importance. Numerous studies have focused on blood pressure fluctuations in longitudinal frameworks, showing associations between high blood pressure variability over time and increased risks of cardiovascular or coronary heart diseases (Parati et al., 2018; Stevens et al., 2016). In addition, it is recently known that some diseases, such as cardiovascular disease, are associated with linear or nonlinear increases in blood pressure (Arvanitis et al., 2021; Wan et al., 2021), demonstrating the value of the present multi-omics integrative findings in considering blood pressure in its continuous, nondiscriminatory form.
The predictive contribution of each omic block on the test cohort showed a strong predictive potential, especially for clinical and metabolomic data. The best predictions were obtained with a three-block model discarding the methylation data, although a slight defect in replication of the transcriptomic block in the test cohort was observed. This three-block model was able to order participants according to their SBP and DBP in the test cohort, despite particularly different SBP and DBP distributions between the training and test cohorts (Supplementary Document, Section S6 and Supplementary Fig. S3 and Table 1). The rejection of methylation data in the modeling was motivated by its deleterious role in acquiring good predictions. The preselection of CpG sites by elastic-net (Supplementary Document, Section S1) could be one of the sources of this integration failure as there was a lack of statistical power.
The study of blood pressure values in its quantitative form could also play an important role in this failure as studying unit increases in SBP and DBP is probably too ambitious in light of the sample size. However, these may not be the only reasons for this failure and beyond the purely technical aspect, it is the predictive robustness of the methylation data that seems to be problematic when using an external replication cohort. An additional study (Supplementary Document, Section S7 and Supplementary Table S2) using a different methylation preprocessing method (van Dongen et al., 2021) and considering a selection of replicated CpG sites (Richard et al., 2017) in the modeling showed that the predictive power of the methylation block remained particularly low.
Thus, the choices made in our study do not seem to be the major cause of this integration failure. Because the epigenome is strongly sensitive to age and a large number of confounders such as smoking (Bollepalli et al., 2019; Martin and Fry, 2018), the difficulty in obtaining satisfactory quality predictions may mainly be explained by differences between training and test cohorts as well as a lack of finesse in controlling for blood variables. The use of methylation data for predictive purposes is therefore challenging in the context of blood pressure and would require further studies. The use of multi-omics methods for nonpredictive exploratory purposes could, however, be relevant and has already been demonstrated in a wide variety of contexts (Kolenc et al., 2021).
The achievement of better predictions of blood pressure values is also conditioned on other factors. The democratized use of deep learning (DL) methods to predict complex phenotypes (Cao et al., 2018) could also be suitable for the study of blood pressure values: the high volumes of blood pressure-related data and the growing knowledge in the field could allow the acquisition of excellent quality predictions. As the black box effect is difficult to counter with DL methods, the use of the sMBPLS method is all the more justified to derive biological and clinical interpretations easily. However, the sMBPLS method still needs to be used more extensively to understand its full value, as has already been carried out with discriminative versions of latent-based methods (Singh et al., 2019).
Recent work tends to gain interpretability with DL methods by forming connections with traditional PLS methods, such as in the context of metabolomic data (Mendez et al., 2020): increased methodological developments should, in the coming years, make it possible to reconcile interpretability and predictive performance. Adding data to feed the modeling could also easily improve these predictions, in addition to uncovering important biological mechanisms. Proteomics could fulfill both these tasks as some blood pressure-related proteomic species are already identified (Arnett and Claas, 2018; Carty et al., 2013) and their predictive potential in a discriminatory context has already been demonstrated (Gajjala et al., 2017). Associations between proteomics and other omics such as transcriptomic data are also common (Kolenc et al., 2021), making their use in the study of blood pressure-related phenotypes encouraging. Other omics could also be suitable for multi-omics integration, but more exploratory studies need to be conducted for this purpose.
Complementary approaches can also significantly improve the quality of modeling and predictions, such as multi-omics imputation methods. Although multiple imputation has been used judiciously to impute a reasonable proportion of missing clinical and metabolomic values (Supplementary Document, Section S1), the use of new emerging methods specifically designed for multi-omics contexts may allow for easier imputation with at least as good quality (Song et al., 2020). The increasing use of multi-omics approaches therefore induces the development of auxiliary methods making its use easier, more efficient, and more relevant. The massive use of multi-omics approaches in the understanding of complex phenotypes can only be encouraged because, in addition to its biological and predictive interest, it contributes to the methodological expansion of the multi-omics field.
Data Availability
The YFS dataset comprises health-related participant data and their use is therefore restricted under the regulations on professional secrecy (Act on the Openness of Government Activities, 612/1999) and on sensitive personal data (Personal Data Act, 523/1999, implementing the EU data protection directive 95/46/EC). Owing to these legal restrictions, the Ethics Committee of the Hospital District of Southwest Finland has in 2016 stated that individual-level data cannot be stored in public repositories or otherwise made publicly available. Data sharing outside the group is carried out in collaboration with the YFS group and requires a data-sharing agreement with the understanding that collaborators will protect the data and not share it with any other parties.
The list of all investigators that collaborate with the YFS group is displayed at the website of the YFS (http://youngfinnsstudy.utu.fi/). Investigators can submit an expression of interest to the chairperson of the data sharing and publication committee, professor Mika Kähönen (Tampere University) and for genomics information to professor Terho Lehtimäki (Tampere University).
The Finnish Twin Cohort data used in the analysis is deposited in the Biobank of the Finnish Institute for Health and Welfare (https://thl.fi/en/web/thl-biobank/for-researchers). It is available to researchers after written application and following the relevant Finnish legislation.
Footnotes
Authors’ Contributions
G.D. conducted this study and performed the analyses. J.K. supervised this work. G.D. wrote the first draft of the article with editing assistance from J.K., O.M., J.M., and P.M. The revision of the article was carried out by G.D., J.K., M.O. and J.M. M.O., O.R., T.L., M.K., X.W., and J.K. collected the data used in this article. J.M. handled the transfer and preparation of the YFS data. All authors had a substantial role in the completion of this study. All authors read and approved the final version of the article.
Acknowledgments
The authors thank Alyce Whipp for her proofreading and language correction assistance during the revision phase of the paper.
Author Disclosure Statement
The authors declare they have no conflicting financial interests.
Funding Information
The FTC has been supported by the Academy of Finland (Grants 265240, 263278, 308248, 312073, 336832 to Jaakko Kaprio and 297908 to Miina Ollikainen) and the Sigrid Juselius Foundation (to Miina Ollikainen). The DNA methylation study in FTC was supported by NIH/NHLBI grant HL104125.
The Young Finns Study has been financially supported by the Academy of Finland: grants 322098, grants 338395, 330809, and 104821, 286284, 134309 (Eye), 126925, 121584, 124282, 129378 (Salve), 117787 (Gendi), and 41071 (Skidi); the Social Insurance Institution of Finland; Competitive State Research Financing of the Expert Responsibility area of Kuopio, Tampere and Turku University Hospitals (Grant X51001); Juho Vainio Foundation; Paavo Nurmi Foundation; Finnish Foundation for Cardiovascular Research; Finnish Cultural Foundation; the Sigrid Juselius Foundation; Tampere Tuberculosis Foundation; Emil Aaltonen Foundation; Yrjö Jahnsson Foundation; Signe and Ane Gyllenberg Foundation; and Diabetes Research Foundation of Finnish Diabetes Association.
This project has received funding from the European Union's Horizon 2020 research and innovation program under grant agreements No. 848146 for To Aition and grant agreement 755320 for TAXINOMISIS; European Research Council (Grant 742927 for MULTIEPIGEN project); Tampere University Hospital Supporting Foundation, Finnish Society of Clinical Chemistry and the Cancer Foundation Finland (for Terho Lehtimäki Grant No.) (decision day November 16, 2016).
Abbreviations Used
References
Supplementary Material
Please find the following supplemental material available below.
For Open Access articles published under a Creative Commons License, all supplemental material carries the same license as the article it is associated with.
For non-Open Access articles published, all supplemental material carries a non-exclusive license, and permission requests for re-use of supplemental material or any part of supplemental material shall be sent directly to the copyright owner as specified in the copyright notice associated with the article.