
Abstract
Abstract
Molecular mechanisms of Parkinson's disease (PD) have already been investigated in various different omics landscapes. We reviewed the literature about different omics approaches between November 2005 and November 2017 to depict the main pathological pathways for PD development. In total, 107 articles exploring different layers of omics data associated with PD were retrieved. The studies were grouped into 13 omics layers: genomics–DNA level, transcriptomics, epigenomics, proteomics, ncRNomics, interactomics, metabolomics, glycomics, lipidomics, phenomics, environmental omics, pharmacogenomics, and integromics. We discussed characteristics of studies from different landscapes, such as main findings, number of participants, sample type, methodology, and outcome. We also performed curation and preliminary synthesis of multiple omics data, and identified overlapping results, which could lead toward selection of biomarkers for further validation of PD risk loci. Biomarkers could support the development of targeted prognostic/diagnostic panels as a tool for early diagnosis and prediction of progression rate and prognosis. This review presents an example of a comprehensive approach to revealing the underlying processes and risk factors of a complex disease. It urges scientists to structure the already known data and integrate it into a meaningful context.
Introduction
P
In this review, we summarized heterogeneous genomic loci, reported to be associated with PD, and stratified them according to omics landscapes. Our review highlights the most ubiquitously explored omics types and presents typical examples of omics studies, approaches, and methodologies related with PD. This study presents an example of a comprehensive approach to revealing the underlying processes and risk factors of a complex disease such as PD. It urges scientists to look at the big picture of complex diseases, to structure the already known data, and to integrate it into a meaningful context.
Materials and Methods
We searched the PubMed database and the Web of Science from November 2005 to November 2017 (https://www.ncbi.nlm.nih.gov/pubmed, http://webofknowledge.com/WOS). We used the combination of keyword “Parkinson's disease” and keywords on omics type and method, for example, “transcriptomics and RNA sequencing.” We searched for studies in humans using both single locus and genome-wide approaches. Collected omics approaches were sorted according to the taxonomic classification of omics studies proposed by Pirih and Kunej (2017). In addition, we retrieved studies reporting lipidomics, glycomics, and integromics, wherein the overlap of more omics was used to generate results.
We used the genome-wide association study (GWAS) catalog database (https://www.ebi.ac.uk/gwas) for the search of GWASs, which belong to the genomics layer–DNA level (Welter et al., 2014). We used Online Mendelian Inheritance in Man (https://www.omim.org) to check the gene annotations. Terminology of gene names was edited according to the HUGO Gene Nomenclature Committee (www.genenames.org). Symbols of microRNA (miRNA) were adjusted according to Desvignes et al. (2015). The Human Metabolome Database (www.hmdb.ca) was used to extract metabolites' IDs (Wishart et al., 2013).
Results
We retrieved 107 articles exploring different layers of omics data associated with PD. We grouped the studies into 13 omics layers: genomics–DNA level (22 articles), transcriptomics (16 articles), epigenomics (1 article), proteomics (3 articles), ncRNomics (10 articles), interactomics (5 articles), metabolomics (5 articles), glycomics (1 article), lipidomics (1 article), phenomics (3 articles), environmental omics (6 articles), pharmacogenomics (30 articles), and integromics (4 articles). All studies used either single locus or genome-wide approach, except for phenomics studies, wherein the type of research was more epidemiologically oriented. All retrieved studies were performed on human samples.
In the following chapters, we describe the most typical studies highlighting individual omics approaches in PD. We summarize the main findings and discuss the advantages and disadvantages of a particular omics landscape. Characteristics of studies belonging to a specific landscape are explained in more detail in tables included in each chapter and/or in Supplementary Tables.
Genomics–DNA level
Initially single locus studies were performed to search for susceptibility factors of PD, but an increasing number of recent studies used whole genome approaches. The number of significant hits and the main characteristics of the retrieved studies are presented in Table 1. Additional data of each study are listed in the Supplementary Table S1.
Sample used was human whole peripheral blood.
NA, not applicable; SNPs, single nucleotide polymorphisms.
A typical example of a single locus study evaluated the association of three single nucleotide polymorphisms (SNPs) in IL10 (−1082 and −519) and TNF (−308) with PD susceptibility and the age of PD onset. The study included 316 PD patients (102 early-onset and 214 late-onset PD) and 300 controls. TNF −308A allele was found to be more frequent in early-onset patients than controls, suggesting that the TNF −308AA genotype might increase the risk for early-onset PD (Bialecka et al., 2008). However in subsequent studies, association of TNF SNPs with PD risk could not be consistently replicated, pointing out the limitations of the single locus approach in complex diseases and heterogeneous patient phenotypes (Pascale et al., 2011). Despite the large number of single locus studies relating to PD susceptibility, no validated biomarker for translation into clinical practice was identified.
Whole genome approaches brought a promise of surpassing the limitations of single locus studies. We retrieved 22 GWASs, including those with negative results, and their meta-analyses, evaluating genetic defects in PD patients compared with controls (Davis et al., 2013; Do et al., 2011; Edwards et al., 2010; Foo et al., 2017; Fung et al., 2006; Hamza et al., 2010; Hernandez et al., 2012; Hill-Burns et al., 2014; Hu et al., 2016; Lill et al., 2012; Liu et al., 2011; Maraganore et al., 2005; Nalls et al., 2011, 2014; Pankratz et al., 2012; Pickrell et al., 2016; Saad et al., 2011; Satake et al., 2009; Simon-Sanchez et al., 2009, 2011; Spencer et al., 2011; Vacic et al., 2014). The majority of the GWASs were performed on patients of European descent, whereas three focused on Asian population, two on Ashkenazi Jews, and one on Amish (Welter et al., 2014). The last and the most comprehensive meta-analysis of GWAS by Nalls et al. (2014) pointed out 26 SNPs in 24 loci that could contribute to PD risk (Redenšek et al., 2017).
Transcriptomics
Transcriptomics investigates differences in expression between cases and controls. Studies were mostly focused on differential expression of messenger RNAs (mRNAs), but also studied noncoding RNAs (ncRNAs), including miRNAs.
There were at least 16 transcriptomics studies performed on samples of PD patients so far, employing the RNA sequencing (RNA-seq) and microarray methodologies (Botta-Orfila et al., 2012; Calligaris et al., 2015; Garcia-Esparcia et al., 2013; Henderson-Smith et al., 2016; Hossein-Nezhad et al., 2016; Infante et al., 2015, 2016; Lesnick et al., 2007; Moran et al., 2006; Mutez et al., 2011, 2014; Planken et al., 2017; Scherzer et al., 2007; Simunovic et al., 2009; Zhang et al., 2005; Zheng et al., 2010). The studies, their characteristics, and number of differentially expressed transcripts (DETs) are listed in Table 2 and in the Supplementary Table S2. Various sample types were used, such as venous blood, cerebrospinal fluid (CSF), brain tissue, and also skin biopsies.
Reported outcome in all studies was PD risk.
Outcome was early onset PD risk.
Outcomes were PD risk and risk for PD and dementia.
↑, Upregulation; ↓, downregulation; CSF, cerebrospinal fluid; DETs, differentially expressed transcripts; NGS, next-generation sequencing; PBMC, peripheral blood mononuclear cell; PD, Parkinson's disease; RNA-seq, RNA sequencing; RT-qPCR, real-time quantitative polymerase chain reaction; SN, substantia nigra.
Hossein-Nezhad et al. (2016) used next-generation sequencing on CSF samples of patients and controls. In total, 201 DETs were found to be dysregulated: 92 were upregulated and 109 transcripts were downregulated in PD patients. After construction of protein–protein interaction (PPI) networks, 17 of these DETs were validated using the real-time quantitative polymerase chain reaction (RT-qPCR) approach and 13 transcripts were validated.
Calligaris et al. (2015) investigated mRNA transcripts in blood samples of patients and controls. Fifty-four of DETs were confirmed using three different statistical methods. Seven candidate transcripts were validated by RT-qPCR in an additional set of samples.
Simunovic et al. (2009) performed a study on brain tissue samples and targeted dopaminergic neurons of substantia nigra (SN) from patients and controls. Among 465 down- and 580 upregulated genes in the PD samples, 9 were PARK genes, 82 genes were involved in the programmed cell death and mitochondrial function, 41 in protein degradation, 41 in synaptic function, 18 were growth factor related, 10 neurotransmitter related, and 25 genes were ion-channel related.
Planken et al. (2017) analyzed skin biopsies from patients and controls. In total, 1074 genes were found to be differentially regulated between cases and controls (877 up- and 197 downregulated). Using The Ingenuity Pathway Analysis, they identified 10 major functional networks associated with PD. Validation using RT-qPCR was performed for 12 genes on a larger set of samples. The gene expression levels varied between methods, but nine genes showed changes in the same direction.
Besides genomic variability, gene expression is often regulated also by epigenetic modifications of genes or of the regulatory machinery, calling for the next layer of omics approaches.
Epigenomics
In literature screening, only one epigenome-wide association study performed in PD was retrieved. Main findings and characteristics of the study are presented in Supplementary Table S3. The study included 45 participants: 15 PD patients with anxiety, 15 PD patients without anxiety, and 15 healthy controls. Twenty differentially methylated genes (DMGs) were found between PD patients and controls. When comparing patients having PD and anxiety with controls, three genes were hypomethylated in PD patients, whereas nine genes were hypermethylated. When comparing PD patients without anxiety with controls, three genes were reported to be hypomethylated and two genes to be hypermethylated in PD patients.
In both groups of PD patients, two genes were hypomethylated and one was hypermethylated compared with controls. Altogether, 17 DMGs were found between PD patients with anxiety and without anxiety. In the validation arm, 12 top ranked CpG sites within 7 genes were evaluated. FANCC and TNKS2 showed significant differences in methylation patterns between PD cases and controls (Moore et al., 2014).
Genes are differentially expressed in response to different exogenous, but also endogenous factors, which can arise from pathological process going on in the body. DETs may also be reflected in the level of corresponding proteins, which can be explored within the proteomics approach.
Proteomics
With regard to proteomics layers, a lot of studies were already published studying the proteome in association with PD risk (Halbgebauer et al., 2016; Magdalinou et al., 2017; Xing et al., 2015). Characteristics of the retrieved studies and names of differentially expressed proteins (DEPs) are listed in Supplementary Table S4. Different types of samples can be used to determine protein content to find suitable diagnostic biomarkers, but CSF, serum, and SN were most frequently used human samples (Halbgebauer et al., 2016; Kasap et al., 2017). Hereunder we describe two typical proteomics studies.
Proteomics profile of mononuclear cells in CSF of PD patients and controls was evaluated using two-dimensional gel electrophoresis. Spots with differential expression were trypsinized and peptide fingerprint was determined using matrix-assisted desorption-ionization-time-of-flight mass spectrometry. Four proteins were found to be downregulated and five upregulated in patients (Xing et al., 2015).
Another study searching for CSF biomarkers included 104 participants with different neurological diseases and controls. Tryptic digestion followed by liquid chromatography-mass spectrometry (LC-MS) analysis was used for identification of proteins. In total, 79 tryptic peptides, derived from 26 proteins, were found to differ significantly between atypical Parkinsonism patients and controls. They included acute phase/inflammatory markers (increased), neuronal/synaptic markers, and cancer/metastasis formation markers (both decreased). Their levels in PD subjects were intermediate between controls and atypical Parkinsonism (Magdalinou et al., 2017).
Halbgebauer et al. (2016) reviewed 27 published proteomics studies and identified >500 DEPs, but only 28 were detected in 2 studies and 17 in 3 studies.
The level of proteins can also be influenced by the expression of ncRNAs, which act as a regulatory mechanism of translation, bringing ncRNomics into focus.
ncRNomics
ncRNAs are divided into two groups: long (>200 bp) and short (<200 bp) ncRNAs. Long noncoding RNA (lncRNA) and miRNA, a type of short ncRNAs, interfere in transcriptional and translational processes, thus modulating gene expression. Several studies have already investigated ncRNAs and their impact on PD risk in different types of samples (Botta-Orfila et al., 2014; Briggs et al., 2015; Ding et al., 2016; Gui et al., 2015; Kraus et al., 2016; Margis and Rieder, 2011; Martins et al., 2011; Minones-Moyano et al., 2011; Ni et al., 2017; Yilmaz et al., 2016). The characteristics of the retrieved studies are presented in Table 3 and in Supplementary Table S5. Approved symbols of miRNAs are listed in the Supplementary Table S6 if available (Desvignes et al., 2015).
↑, upregulation; ↓, downregulation; lncRNA, long noncoding RNA; miRNA, microRNA.
The impact of lncRNAs was investigated in a study on 30 brain samples (20 PD samples and 10 controls). The expression levels of 90 lncRNAs were analyzed and 5 lncRNAs were differentially expressed in PD (Kraus et al., 2016).
A study on CSF exosomes of PD patients and controls investigated differential expression of miRNAs with TaqMan assays. In total, 27 exosomal miRNAs were found to be differentially expressed: 16 of them were upregulated and 11 were downregulated (Gui et al., 2015).
Serum samples were also tested for differential expression of miRNAs in sporadic PD patients and matched controls. Solexa sequencing followed by an RT-qPCR was used to evaluate the miRNA profile. Five serum miRNAs were found to be differentially expressed (Ding et al., 2016).
Lastly, potential miRNA biomarkers were also searched for in whole blood samples. The study included eight untreated PD patients, seven early onset PD patients, eight controls, and four randomly selected previously untreated patients after 97 days of treatment. RT-qPCR array was used to investigate expression levels of 85 miRNAs, of which 6 were differentially expressed between patient groups. Although miR-1, miR-22*, and miR-29 expression levels allowed to distinguish nontreated PD from healthy subjects, miR-16-2*, miR-26a2*, and miR-30a distinguished treated from untreated patients (Margis and Rieder, 2011).
Proteins that segregate to different functional pathways may interact with each other. From interactomics studies, we can learn which proteins interact and what kind of pathways do they form.
Interactomics
Interactomics layer investigates interactions between proteins and other molecules and the consequences of these interactions. Interactomics also studies the interactions between genes and their products in a more functional way. So far, several studies have already investigated interactions of molecules in PD and their influence on PD susceptibility (Holmans et al., 2013; Moran and Graeber, 2008; Rakshit et al., 2014; Song and Lee, 2013; Zhang et al., 2017b). The information on the relevant interactomics studies is shown in Table 4 with more detailed results given in Supplementary Table S7.
ECM, extracellular matrix; FCC, frontal cerebral cortex; GWAS, genome-wide association study; LSN, lateral parkinsonian SN; MSN, medial parkinsonian SN.
Song et al. used GWAS meta-analysis data set to depict the pathways of PD pathogenesis. The GWAS meta-analysis was performed on 4238 PD cases and 4239 controls (Pankratz et al., 2012). First the candidate causal SNPs were selected, then the annotation of biological mechanism was performed, and in the last stage the pathways were constructed. This approach identified 3 candidate SNPs, 2 genes, and 21 pathways that may contribute to PD susceptibility (Song and Lee, 2013).
The most recent genome-wide pathway-based association analysis combined three GWAS data sets. The pathways were retrieved from the Kyoto Encyclopedia of Genes and Genomes (KEGG) database. Five pathways were found to be associated with PD in all three data sets (extracellular matrix–receptor interaction, focal adhesion, morphine addiction, calcium signaling pathway, and axon guidance). Additional five pathways were identified in two of the data sets. Most of these pathways were associated with nervous system and some of them with immune response (Zhang et al., 2017b).
Another type of interactomics studies is searching for PPI. PPI networks were constructed from proteins encoded by genes that were found to be differentially expressed in SN and frontal cerebral cortex. In total, 37 previously unreported PD markers were identified based on their topological significance in the networks. Eight of these were involved in the core functional modules of the networks constructed, and four were associated with several neurotransmitters including dopamine. Together, these 12 genes were suggested as key PD markers (Rakshit et al., 2014).
Protein interactions are needed to form multienzyme complexes that function as enzymatic machineries, which are responsible for biosynthesis and degradation of low molecular weight compounds and other metabolites, which represent a person's metabolome.
Metabolomics
Metabolome studies investigated differences between PD patients and controls using different body fluids and tissues described in four retrieved studies and one review (Hatano et al., 2016; Kori et al., 2016; Luan et al., 2015; Roede et al., 2013; Trupp et al., 2014). The information on the relevant metabolomics studies is given in Table 5 with more detailed results listed in Supplementary Table S7.
Reported outcome in all studies except a was PD risk.
Reported outcome was progression rate (slow or rapid).
Review article.
↑, increased levels; ↓, decreased levels; CE-MS, capillary electrophoresis mass spectrometry; DIES-MS, direct infusion electrospray mass spectrometry; GC-MS, gas chromatography-mass spectrometry; GC-TOF-MS, gas chromatography time-of-flight mass spectrometry; LC-MS, liquid chromatography-mass spectrometry; LC-QTOF-MS, liquid chromatography-quadrupole time-of-flight mass spectrometry; MRS, magnetic resonance spectroscopy; NMR, nuclear magnetic resonance; UPLC-MS-MS, ultrahigh-performance liquid chromatography-tandem mass spectrometry; UPLC-TOF-MS, ultra-pressure liquid chromatography time-of-flight mass spectrometry.
A study searching for CSF and plasma metabolomic biomarkers included 20 PD patients and 20 controls. Gas chromatography-mass spectrometry was used to detect metabolites. In plasma samples of PD patients, the level of six metabolites was increased compared with those of controls, whereas the levels of two metabolites were decreased. In CSF samples, the levels of eight metabolites were decreased in PD patients (Trupp et al., 2014).
Another study investigated metabolomic biomarkers of slow or rapid progression of motor symptoms of PD. In total, 80 PD patients were included in the study (39 rapid and 41 slow progressors) and 20 controls. Serum samples were first analyzed by liquid chromatography-Fourier transform mass spectrometry, whereas metabolite identities were confirmed through tandem mass spectrometry. N8-acetylspermidine levels were found to be significantly different between slow and rapid progressors (Roede et al., 2013).
To find completely noninvasive biomarkers of PD, also urine samples were investigated. Gas chromatography-mass spectrometry and LC-MS were used to study the metabolic profile of urine in three stages of PD (early, middle, and advanced stages) and in controls. There were 46 differentially present metabolites found. Among them, 18 metabolites had high discrimination ability for the early-stage PD, and could also accurately distinguish the middle and advanced stages PD patients from control subjects (Luan et al., 2015).
Metabolomics studies were reviewed in the article by Kori et al. (2016) wherein 54 metabolite markers were identified in 14 metabolomic studies in PD patients. Among included studies were also the mentioned studies by Trupp et al. (2014) and Luan et al. (2015).
Among the omics approaches, metabolome is the most closely linked to phenotype, because it represents the last level of the omics cascade ranging from genomics–transcriptomics–proteomics to metabolomics. Therefore, researchers have already conducted epidemiological studies exploring different phenotypes associated with PD.
Glycomics
Glycosilation is the most complex and predominant post-translational modification. Glycans, different linear or branched carbohydrates, bind to proteins or lipids in a complex enzymatic process, which affects several cellular processes. Glycomics studies the complete set of sugars, whether free or bound to more complex molecules (Wang et al., 2015). In contrast to ubiquitously researched macromolecules, such as DNA, RNA, and proteins, biosynthesis of glycans does not require a template, which makes glycomics even more challenging. Alterations in processing of glycans may affect human health, which means that glycomics may help to unravel pathogenesis of different diseases such as PD (Adua et al., 2017).
Researchers have already started exploring glycomics in the scope of PD. In a study by Russell et al. (2017), plasma IgG glycome was the main interest. A type of ultraperformance liquid chromatography was used for the analysis. Seven glycan peaks and 11 derived traits in the IgG glycome were significantly different between PD cases and controls (Supplementary Table S9).
Lipidomics
Lipidomics is also one of the emerging fields of omics research. The molecular composition of the cellular lipidome is complex and poorly understood, yet dysregulation of lipid metabolism may perform a crucial role in various diseases (Shevchenko and Simons, 2010). One study that already dealt with lipidomics in PD was retrieved. PD patients and controls were included in the study to compare their profile of lipidomic plasma. High-performance LC-MS revealed the difference between patients and controls in plasma concentration of triacylglycerides and ganglioside-NANA-3. Results showed a good association between high concentration of ganglioside-NANA-3 and PD (Supplementary Table S10) (Zhang et al., 2017a).
Phenomics
Phenomics searches for comorbidities occurring along with PD. We retrieved three studies, which are presented in Supplementary Table S11 (Lethbridge et al., 2013; Lubomski et al., 2015; Russell et al., 2014). One of the studies considered and compared causes of death among PD patients, general population, and matched controls. A total of 63,431 decedents were included. The most common comorbidity in PD patients was Alzheimer's disease/dementia, following by several other disease states (Lethbridge et al., 2013). Lubomski et al. (2015) looked into most frequent indications for admission of PD patients and general population in hospital for acute care. There were 5637 cases and 8143 controls included in the study. PD patients were more or less prone to certain health issues needed to be immediately cared of.
Furthermore, one of the phenomics studies only focused on dementia in PD patients. About 80% of people with PD will eventually develop dementia. Incidence of dementia in PD ranged from 54.7 to 107.14 per 1000 person-years, whereas point prevalence ranged from 19.7% to 35.3% (Russell et al., 2014).
Environmental omics
PD occurrence is in great extent associated with environmental factors, which may in combination with genetics cause PD. Studies in the field of environmental omics encompass both. We retrieved six studies reporting potential genetic biomarkers that may in combination with a certain environmental factor contribute to PD development (Biernacka et al., 2016; Chen et al., 2014; Chung et al., 2013; Gao et al., 2012; Hamza et al., 2011; Hill-Burns et al., 2013). Detailed information on the retrieved studies is listed in Table 6.
Sample type in all of the studies was human whole blood.
MDA, multiple displacement amplification; WGA, whole genome amplification.
A single locus study aimed to look for association between the combined effect of drinking well water and BST1 rs11724635 and PD. Participants, patients and controls, from Taiwan were included in the study. The results show that polymorphism rs11724635 alone is not associated with PD risk, but when combined with drinking well water, it can contribute to PD development (Chen et al., 2014).
Another study that included 1098 cases and 1098 matched controls tried to find associations between combinations of pesticides exposure or tobacco smoking or coffee drinking or alcohol drinking and SNPs in three genes SNCA, MAPT, and LRRK2 with PD risk. No significant interactions were found after correction for multiple testing, but with no correction, five interactions were found to increase PD risk: pesticides × SNCA rs3775423 or MAPT rs4792891, coffee drinking × MAPT H1/H2 haplotype or MAPT rs16940806, and alcohol drinking × MAPT rs2435211 (Chung et al., 2013).
A genome-wide gene–environment interaction study included 1600 persons with PD and 1506 controls, classified as ever smokers and never smokers. After genotyping, none of the SNPs achieved the genome-wide significance, but the highest peak was observed for the SV2C gene, coding for synaptic-vesicle protein (Hill-Burns et al., 2013).
Pharmacogenomics
Studies on response to dopaminergic treatment of PD are among the most frequent omics studies as >30 pharmacogenomic studies were published to date. Most of these studies were single locus and used a candidate gene approach to select individual genes or a small number of genes that may influence drug response. Cohort sizes mostly varied between 150 and 400 PD patients, and qPCR-based methods were usually used for genotyping. These studies reported genes from dopaminergic system and some other systems to be associated with drug response, in particular with dopaminergically induced complications.
Some of these studies also observed associations with the dose of drug required for proper management of the disease (Altmann et al., 2016; Becker et al., 2011; Bialecka et al., 2004, 2008; Cheshire et al., 2014; de Lau et al., 2012; De Luca et al., 2009; Devos et al., 2014; Feldman et al., 2006; Foltynie et al., 2009; Frauscher et al., 2004; Hao et al., 2014; Ivanova et al., 2012; Kaiser et al., 2003; Kaplan et al., 2014; Krishnamoorthy et al., 2016; Lee et al., 2009; Lin et al., 2007; Liu et al., 2009; Moreau et al., 2015; Rieck et al., 2012, 2015, 2016; Rissling et al., 2005; Santos-Lobato et al., 2017; Schumacher-Schuh et al., 2013; Strong et al., 2006; Watanabe et al., 2003; Wu et al., 2014; Xu et al., 2017). An overview of these studies is given in Supplementary Table S12.
Within the dopaminergic system, metabolic genes (MAOB, DDC, and COMT), dopamine receptor genes (DRD1-4), transporter genes (SLC6A3 and SLC22A1), and vesicular storage gene (SV2C) were associated with the occurrence of adverse events and the dose of the dopaminergic drugs. Furthermore, genes involved in neuroprotection (BDNF), glutamate system (GRIN2A, GRIN2B, and HOMER1), adenosine pathway (ADORA2A), opioid system (OPRM1), cholecystokinin system (CCK and CCKAR), and some others (APOE, ACE, and HCRT) were already reported to be associated with the occurrence of adverse events (Jimenez-Jimenez et al., 2016; Kim and Jeon, 2016).
Integromics
To take into account all the different omics layers, integromics (also termed integratomics or integrated omics) studies aim to find an overlap between results of individual omics. At least four integromics studies done on human samples have been recently reported in the field of PD. Different layers of integromics approaches and their interrelationships are presented in Figure 1.
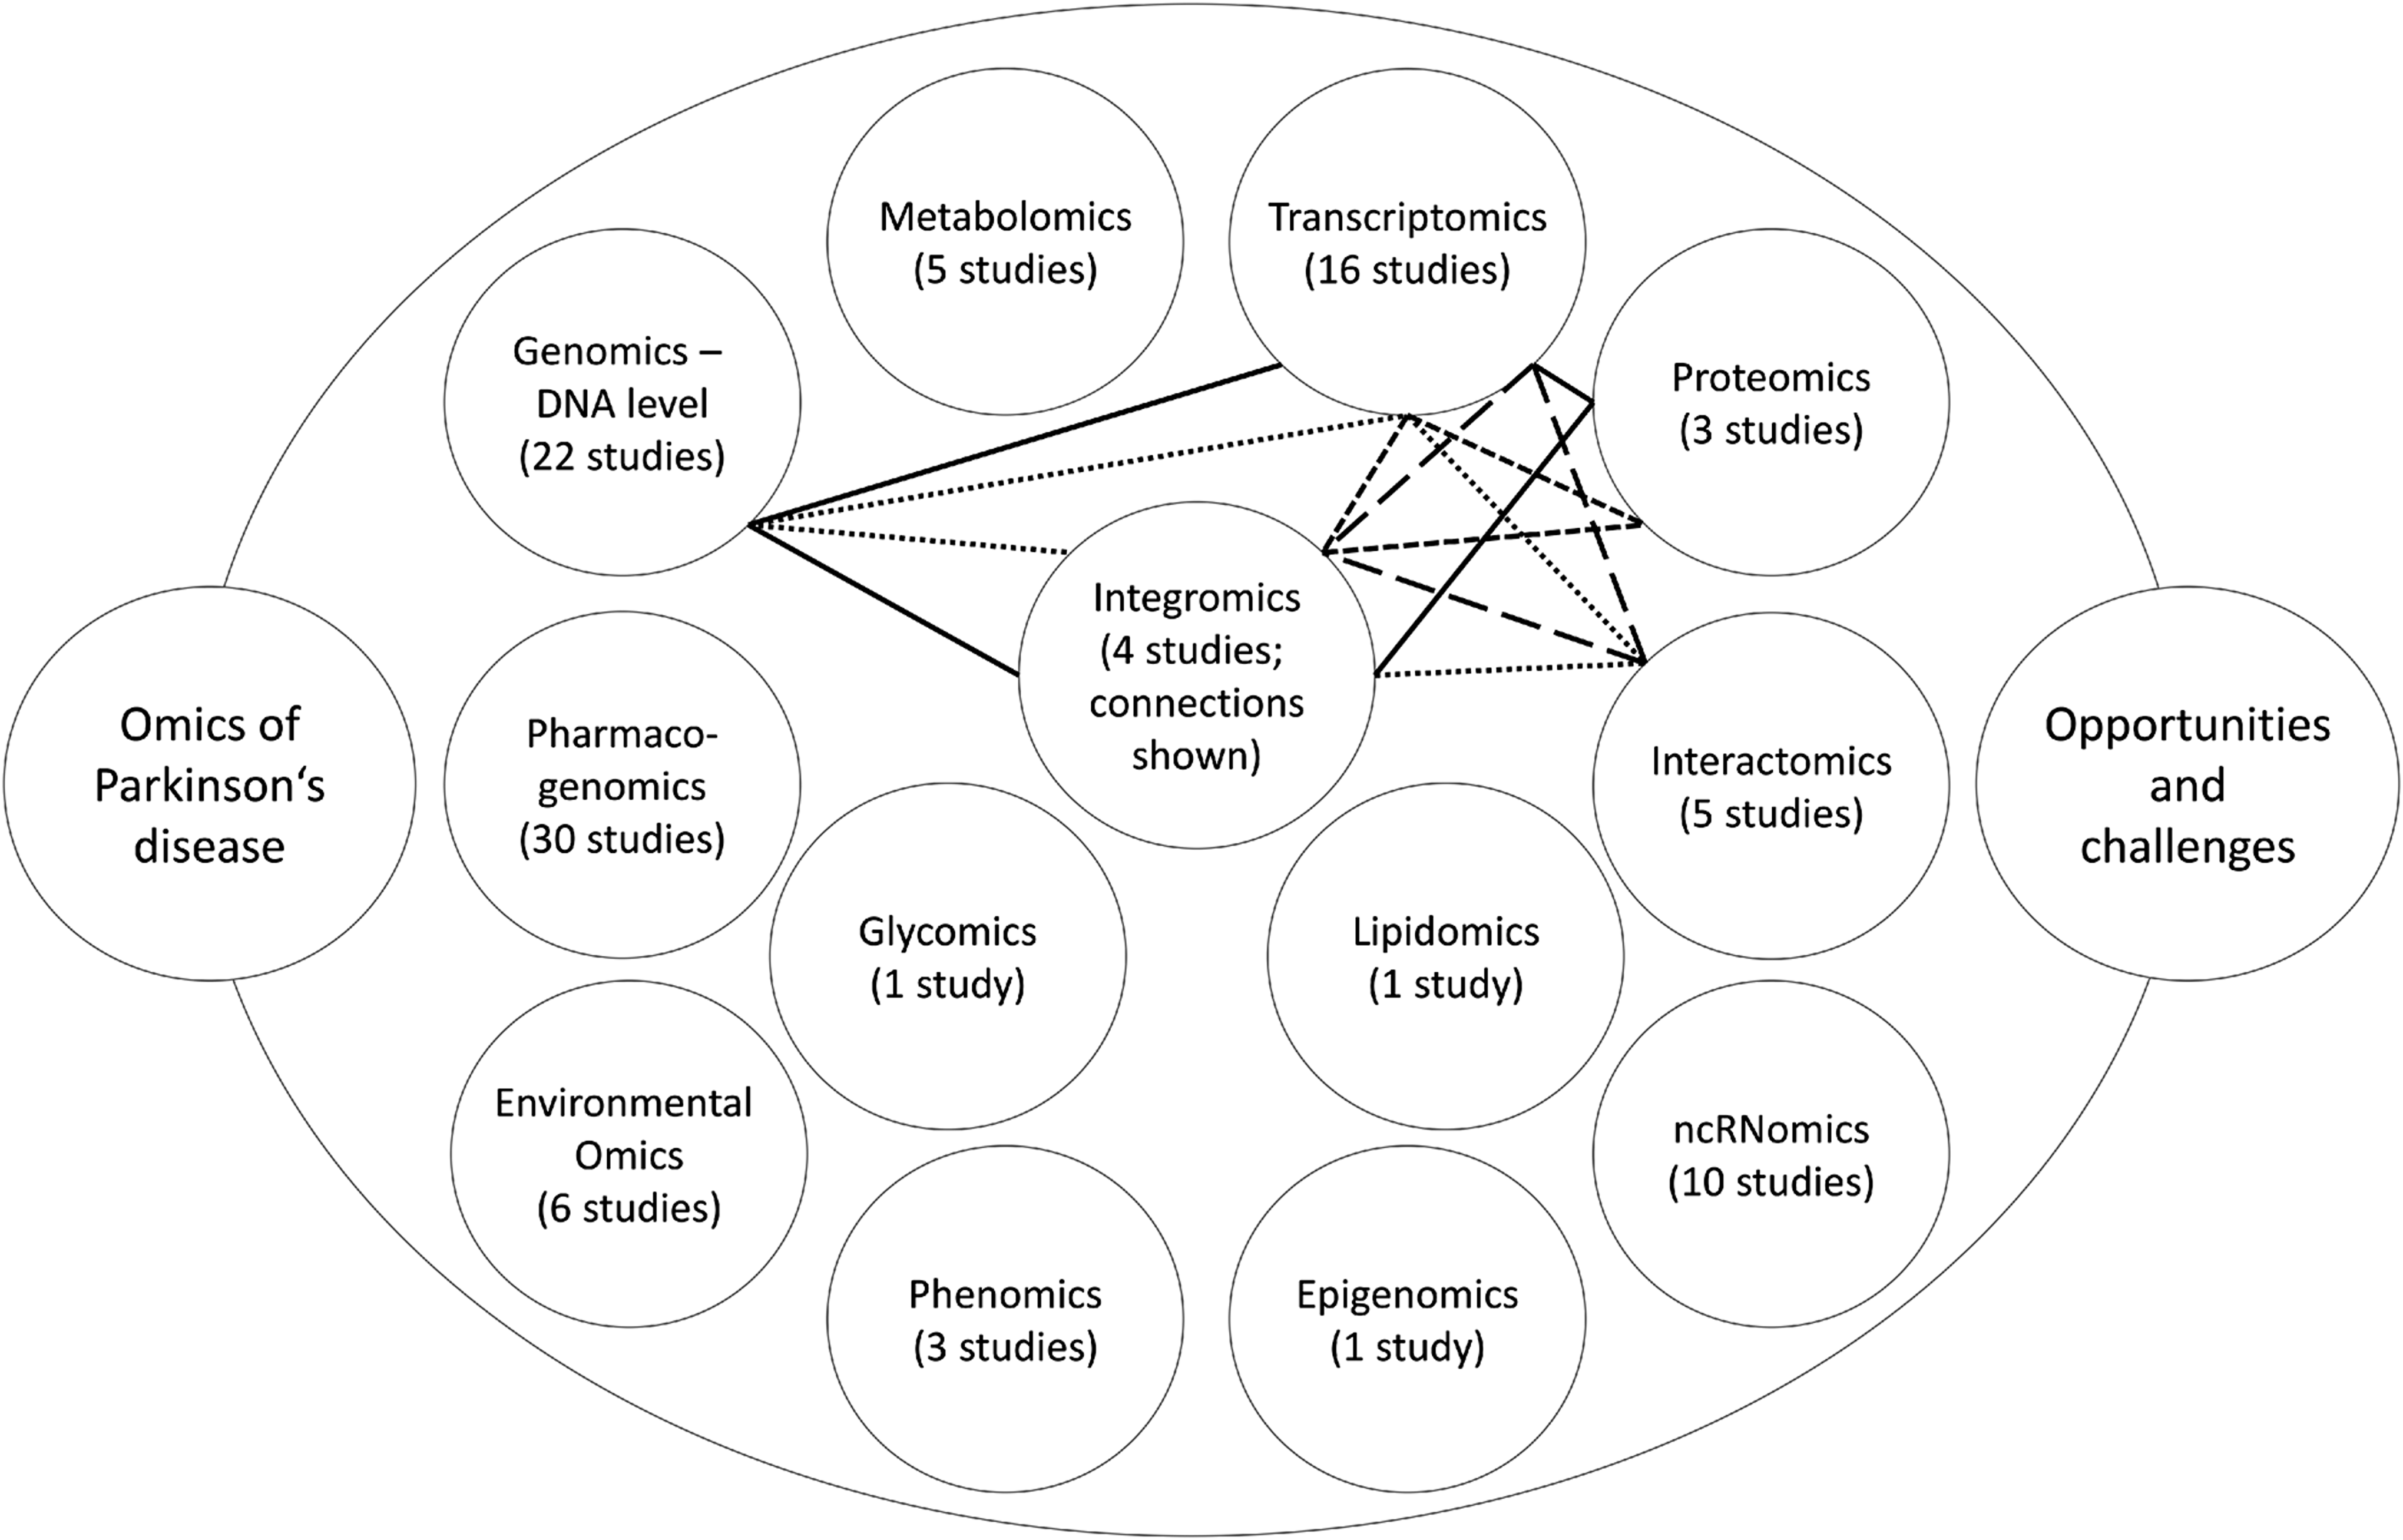
Schematics of omics landscapes. Number of studies retrieved for each omics layer is provided. The lines connect omics layers included in a particular integromics study. Legend: solid line (Maver and Peterlin, 2011), round dots (Liu et al., 2012), square dots (Dumitriu et al., 2016), long dashes (Santiago and Potashkin, 2015)
Maver and Peterlin (2011) aimed to identify candidate genomic regions with the positional integratomic approach, including three layers: genomics–DNA level, transcriptomics, and proteomics. Data sets of linkage, genome-wide association, transcriptomic, and proteomic studies were included into the in silico evaluation. Altogether, 179 regions had significant signal accumulation, but 33 remained significant after merging of neighboring regions. These regions contained 29 Ensembl genes directly or indirectly associated with PD. According to the Bitola software, these genes are involved in the neurodegeneration processes, regulation of neuronal function, regulation of apoptosis in neuronal cells, and/or various other disorders of central nervous system.
Furthermore, according to gene ontology annotations, these genes are involved in the pathways of mitochondrial function, lipid/cholesterol metabolism, metabolism of small molecules, and neural development. Lastly, Reactome enrichment analysis showed involvement of the genes into membrane trafficking, lipid digestion, mobilization and transport, and synaptic transmission.
Liu et al. (2012) also included three layers of omics approaches: genomics–DNA level, transcriptomics, and interactomics, and performed the study in silico. First, genes associated with PD risk were retrieved from the PDgene database. In total, 268 genes were identified. Then gene networks were constructed by mapping to human interactome using Human Protein Reference Database (HPRD) with the help of the Steiner tree algorithm. In total, 185 out of 268 genes were found to be present in the HPRD, so the network was created with the addition of 88 genes by the algorithm. Finally, mRNA expression data were compared with created networks. In particular, small (up to five genes) dysregulated subnetworks were searched for. One such subnetwork was found and it included ABCB1, CAV1, ESR1, JUN, and TP53 genes.
Dumitriu et al. (2016) combined transcriptomics and proteomics approaches with study brain samples from PD patients and controls. Transcriptomics analyses performed using RNA-seq identified that 1095 genes were differentially expressed between 29 PD patients and 44 controls: 570 of them were upregulated and the rest were downregulated. Proteomics analyses were performed with three-stage mass spectrometry tandem mass tag proteomics method in 12 cases and 12 controls. The integratomic analysis identified 3558 unique genes that were differentially expressed. Among them, 283 were significantly different between PD patients and controls: 106 of them were upregulated and 177 were downregulated.
However, genes with increased expression levels were in most cases not replicated on proteomics level. This may be related to post-transcriptional regulatory mechanisms that prevent protein translation for specific highly expressed mRNAs involved in disease-related processes. Only 10 genes (ACTA2, ALDH1A1, CRELD1, GFM1, MTX3, NDUFS1, OPA1, PRUNE2, SLC4A8, and VAPB) were found to be differentially expressed at both layers, 8 of them showing the same direction of effect.
Santiago and Potashkin (2015) combined transcriptomics and interactomics approaches. First, four independent microarray studies were analyzed, which pointed out two potential biomarkers of PD, HNF4A and PTBP1. HNF4A is important in gluconeogenesis and diabetes, whereas PTBP1 is involved in stabilization and mRNA translation. HNF4A was upregulated in PD, whereas PTBP1 was downregulated. These results were confirmed in two consecutive sets of PD patients and controls. The first set included 51 PD patients and 45 controls, whereas the second set included 50 PD patients and 46 controls. Afterward, also network-based meta-analysis was performed, which identified HNF4A as the most significant hub gene. All in all, both factors were found to be useful in clinical utility to monitor disease severity through plasma mRNA levels.
Discussion
PD is a slowly progressive disease, and the motor symptoms are only present when already 60–80% of dopaminergic neurons in the nigrostriatal pathway are already lost. At this point the disease course is irreversible (Kalia and Lang, 2015; Poewe et al., 2017). Consequently, it would be ideal to detect the disease in its preclinical stages, so the loss of dopaminergic neurons could still be stopped or at least slowed down. Therefore, established biomarkers would enable early diagnosis of the disease, and hopefully better prognosis. Screening programs could be established to check the whole population above a certain age or at least those at an increased risk for PD. If such screening programs could be established, the samples used should preferentially be obtained with noninvasive procedures. Biomarkers could also improve our understanding of the pathogenesis and thus maybe also point out new treatment targets.
Different types of biomarkers can be found using the described approaches, either for the disease risk or for the occurrence of certain clinical signs and symptoms that accompany the disease. An ideal PD biomarker should meet the following criteria: high sensitivity and specificity validated by neuropathological examination, satisfactory test–retest reproducibility, it should be inexpensive, noninvasive, and offer the ability to monitor disease progression without being biased by age (Ren et al., 2015).
Extensive studies have already been performed on different omics levels, from DNA level all the way to integromics approaches. The latter were mainly seeking for possible overlaps between the results of different omics. So far, not much overlap has been found between different layers, so no definite biomarker for predicting the risk for the occurrence of PD or for predicting the course of the disease was identified.
However, some of the genes that were pointed out as associated with PD risk in the retrieved studies were detected in more than one omics layer. We found that SNCA, MAPT, ALDH1A1, and SV2C were associated with PD in at least three different layers: SNCA—genomics–DNA level, transcriptomics, and environmental omics; MAPT—genomics–DNA level, interactomics, and environmental omics; ALDH1A1—transcriptomics, proteomics, and integromics; and SV2C—transcriptomics, pharmacogenomics, and environmental omics.
Additional 19 genes were pointed out as associated with PD in at least 2 omics: BST1 (genomics–DNA level and environmental omics), LRRK2, SEMA5A, NSF, and ANXA1 (genomics–DNA level and transcriptomics), HSPA8, TF, SAA1, SERPINA3, VGF, SST, YWHAE, and CHGB (transcriptomics and proteomics), PTBP1 and NDUFS1 (transcriptomics and integromics), SLC6A3 (transcriptomics and pharmacogenomics), GRIN2A (environmental omics and pharmacogenomics), GSN (proteomics and interactomics), and APOE (proteomics and pharmacogenomics). With inclusion of more studies probably even more genes would be identified in more than one layer. Furthermore, genes that were already pointed out in multiple omics layers with the existing selection would probably be pointed out in additional layers.
We are aware of the possibility that not all published studies are included in this review. It is possible that some of the studies were not retrieved due to selection of keywords for literature screening. Furthermore, the use of machine learning and data mining approaches could decrease the potential bias of manual data curation and should be used in future studies. Integrative approaches using multiomics data from different tissues are the future of omics research (Santiago et al., 2017). Owing to fast development and extensiveness of omics studies in PD, we did not manage to review all reported study approaches and omics types. For example, study approaches in the field of functional genomics, RNA-editomics, nutrigenomics, and metagenomics should be added in future studies.
Furthermore, we also searched for the pathways involved in the PD pathogenesis in the Reactome database (Croft et al., 2014; Fabregat et al., 2016). This database searches for enriched pathways by overlaying a gene list on the annotated data, which show what could happen if all annotated proteins and small molecules were present and active simultaneously in the cell. We used the whole set of genes identified as associated with disease risk within the studies listed in this review, which accounts for 611 unique genes (Supplementary Table S13). Results of phenomics, metabolomics, ncRNomics, glycomics, and lipidomics studies were not included in the list. Reactome was not able to find implicated pathways for 167 genes (Supplementary Table S13).
According to the analysis results, several pathways were enriched in PD pathogenesis. Top 40 implicated pathways belong to the core pathways of immune system, cellular responses to external stimuli, metabolism of proteins, developmental biology, signal transduction, metabolism of RNA, neuronal system, and hemostasis (Supplementary Table S14).
There are certain caveats behind various omics approaches. Although population genetics scrutinizes the functioning and composition of the single gene to assess genetic differences within and between populations, genomics addresses all genes and their inter-relationships to identify their combined influence on disease susceptibility or the disease course. Nevertheless, genomics can only identify the susceptible population, but cannot provide insight into the state of the disease, for example, if the disease has started already or how advanced it is, whereas transcriptomics, proteomics, or metabolomics could provide this information (Ren et al., 2015). Still genomics has an advantage compared with other omics, as any type of sample can be used for the analysis. On the contrary, in transcriptomics or proteomics, different results may be obtained depending on the sample type (various tissues and body fluids). Furthermore, genomics results do not vary over time, whereas other omics results often depend on the time of analysis.
The methodological approaches have their limitations as well. Transcriptomic data must be validated by a second method besides the usually used microarrays or RNA-seq. The method most commonly used for validation is RT-qPCR. When exploring the proteomics level, it should also be verified whether the mRNA expression correlates with the corresponding protein level (Caudle et al., 2010). Detecting proteins may be quite challenging also because the abundantly present proteins make it difficult to detect proteins present in lower concentrations, which are usually the focus of interest.
It is also of major importance how the sample is collected, processed, and stored. Contamination must be prevented. Preparation of the sample for the analysis can also change the sample content. In light of this, adherence to standard guidelines is crucial to obtain comparable results.
It is very important to assign biological function to each statistically significant signal or at least define the cellular pathway that a certain gene is involved in. Omics studies usually have no hypothesis, so the results can be very inconsistent and identified signals can have very different cellular functions. Therefore, validation functional studies must be performed to explain why and how the identified signal could be implicated in the disease. It should be further investigated whether the signal in one omics layer is also confirmed in the next omics layer. Although many of the associations found with GWAS lay within noncoding or intergenic regions, also SNPs within protein coding regions, introns, and also miRNA genes were found to be associated with PD susceptibility, which can be reflected in downstream landscapes. A particular downside of GWAS is also a possible inability of exact determination of a contributing gene to disease susceptibility due to overlap of many genes containing a particular SNP and also due to linkage disequilibrium.
One must also be aware of a small effect of a certain biomarker on PD susceptibility. It would be better if a whole panel of different biomarkers was tested to increase the sensitivity and specificity. Moreover, also clinical markers should be considered in combination with molecular biomarkers (Redenšek et al., 2017).
In the end, when gene or locus lists affecting a certain disease are constructed, it is at this time very difficult to distinguish between risk factors and disease-causative genes. Marras et al. (2016) proposed a solution with a different nomenclature for both lists. Disease-causing genes should have a prefix PARK added to the gene name instead of number suffix, for example, PARK-SNCA instead of PARK1. When disease-causing mutations and risk variants arise from the same gene, they should be a part of both lists, but when presented in the list of risk factors, no prefix should be added. The decision on which list a certain genetic variation is a part of is sometimes difficult, especially when penetrance is different depending on the age, sex, or ethnicity.
Conclusions
This review presents the most comprehensive overview of omics research in PD. We described the main approaches to omics research and some typical studies in the fields. We discussed the advantages of omics research and also pointed out some caveats that must be addressed in future studies. Further multilayer studies on independent cohorts are needed to confirm the biomarkers that were already pointed out in individual studies. More studies exploring the course of the disease are also warranted, so the progression rate and the main symptoms in an individual patient could be predicted in advance. With all this knowledge, the management of the disease could be supported with new strategies and new drugs, or at least personalized and tailored within the scope of currently available drugs to best prevent the complication occurrence and to best relieve the symptoms.
Footnotes
Acknowledgment
This study was funded by the Slovenian Research Agency (ARRS), grant numbers P4-0220 and P1-0170.
Author Disclosure Statement
No competing financial interests exist.
Abbreviations Used
References
Supplementary Material
Please find the following supplemental material available below.
For Open Access articles published under a Creative Commons License, all supplemental material carries the same license as the article it is associated with.
For non-Open Access articles published, all supplemental material carries a non-exclusive license, and permission requests for re-use of supplemental material or any part of supplemental material shall be sent directly to the copyright owner as specified in the copyright notice associated with the article.