
Abstract
Abstract
Y-chromosome short tandem repeats (Y-STRs) are genetic markers with practical applications in human identification. However, where mass identification is required (e.g., in the aftermath of disasters with significant fatalities), the efficiency of the process could be improved with new statistical approaches. Clustering applications are relatively new tools for large-scale comparative genotyping, and the k-Approximate Modal Haplotype (k-AMH), an efficient algorithm for clustering large-scale Y-STR data, represents a promising method for developing these tools. In this study we improved the k-AMH and produced three new algorithms: the Nk-AMH I (including a new initial cluster center selection), the Nk-AMH II (including a new dominant weighting value), and the Nk-AMH III (combining I and II). The Nk-AMH III was the superior algorithm, with mean clustering accuracy that increased in four out of six datasets and remained at 100% in the other two. Additionally, the Nk-AMH III achieved a 2% higher overall mean clustering accuracy score than the k-AMH, as well as optimal accuracy for all datasets (0.84–1.00). With inclusion of the two new methods, the Nk-AMH III produced an optimal solution for clustering Y-STR data; thus, the algorithm has potential for further development towards fully automatic clustering of any large-scale genotypic data.
Introduction
Y-
In forensic genetics, Y-STRs are of primary concern in cases where human identification is necessary, for example, in rape and sexual assault cases (Betz et al., 2001), paternity testing (Rolf et al., 2001), missing person cases (Dettlaff-Kakol and Pawlowski, 2002), identification of human migration patterns (Stix, 2008), and reexamination of ancient cases (Gerstenberger et al., 1999). However, in cases that require a process of mass identification, such as in the aftermath of tsunamis or aviation accidents, the efficiency of the identification process could be improved with new approaches such as data mining (Leclair, 2004).
Most applications that employ Y-STR data are based primarily on a direct comparison by using pair-wise analysis, which is easily achieved if the sample size is relatively small. However, where the sample size is large and/or there are multiple samples, multi-criteria analyses such as supervised and unsupervised learning methods produce results that are more informative. Indeed, several methods for grouping multiple samples of Y-STR data automatically have been reported (Schlecht et al., 2008; Seman et al., 2010a; 2012; 2013a). In the supervised learning method, Y-STR data can be classified by haplogroup via the decision tree method (Schlecht et al., 2008; Seman et al., 2013a), Bayesian modeling, and support vector machines (Schlecht et al., 2008). Similarly, unsupervised learning methods can be used to cluster Y-STR data by similar genetic distances (Seman et al., 2010a; 2010b; 2010c; 2010d; 2012).
In a detailed comparison (Seman et al., 2012), a recently developed clustering algorithm, the k-Approximate Modal Haplotype (k-AMH) algorithm, produced optimal results compared to eight other clustering algorithms including the k-Modes (Huang, 1998), fuzzy k-Modes (Huang and Ng, 1999), and new fuzzy k-Modes (Ng and Jing, 2009). The optimization procedure for the k-AMH algorithm, which uses the data and not the mode mechanism as the center of clusters, significantly improves the overall clustering results. Indeed, the advantages of the k-AMH algorithm are the use of objects (the data) as the center (medoid) instead of modes, as well as the new cost function and procedure used to determine the final center of clusters. This procedure is in contrast to the mode mechanism used in the common k-Modes-type algorithms listed above.
In this study we aimed to improve the k-AMH algorithm by introducing two new methods: a method for initial selection of the cluster center and a dominant weighting method. The first method replaces the randomized method in the k-AMH algorithm; the second method replaces the original dominant weighting method. Consequently, the improved algorithm was proposed for use in the further development of clustering applications for large-scale comparative genotyping and kinship analysis using Y-STR.
In the following sections of this article, we first describe the fundamental features of the k-AMH algorithm and the two methods proposed above, as well as the Y-STR data and clustering evaluation methods. Subsequently, we present the clustering results by comparing the performance of (a) the original k-AMH algorithm; (b) the k-AMH algorithm with the new method for the initial selection of the cluster center, which we call Nk-AMH I; (c) the k-AMH algorithm with the new dominant weighting method, named Nk-AMH II; and (d) the k-AMH algorithm combining these two new methods, known as Nk-AMH III. Finally, we discuss the potential applications to be further developed for the fully automatic clustering of large-scale genotypic data.
Materials and Methods
k-AMH algorithm
Consider
The
where:
•
where k (≤n) is a known number of clusters, H is the medoid,
•
subject to:
The optimization procedure for the k-AMH algorithm is shown as follows.
Step 1: Choose randomly an initial center selection called the approximate modal haplotype,
Step 2: Choose X(t+1) such that P(W, D)t+1 is maximized. Replace
Step 3: Set t=t+1. Stop when t=n (the number of objects); otherwise go to Step 2.
A detailed description of the k-AMH algorithm can be found in Seman et al., (2012).
The new initial center selection method
In unsupervised algorithms such as k-Mean- and k-Mode-type algorithms, the randomized initial center selection is one of the factors contributing to the quality of clustering results (Li et al., 2008). However, in a previous study, using the k-AMH algorithm with a randomized initial center, selection produced accuracy scores with higher minimum values compared with those of all other tested clustering algorithms (Seman et al., 2012). Because of the nature of Y-STR data, which are dominated by a high degree of similarity, the probability of obtaining initial center selections that are close together is relatively high. Under these circumstances, the k-AMH algorithm is apparently not sensitive to initial selection centers, despite their being identical or similar to each other. Therefore, the aim of the new initial center selection method proposed here was to select any identical or similar initial center selections. The detailed steps used to select these initial center selections are described in Equations 5, 5a, 6, and 6a.
Step 1: Find a mode, M, from the data, X, such that
where
where p is the number of categories of attribute Aj for 1≤j≤m
Step 2: Calculate the distance between X and M, such that
where
where 1≤i≤n and 1≤j≤m
Step 3: Choose the initial center clusters, H, with the top-k smallest distances.
The new dominant weighting method
The dominant weighting method of the k-AMH algorithm described in Equation 4 is a simple weighting value with either a 50% or 100% probability that an object belongs to a cluster. In fuzzy sense, the maximum membership value (any object that is closer to its cluster) is very subjective. Where membership values fall between 1/k to 1.0 (k is the number of clusters), the probability cannot be 100%. The only condition in which the object belongs to its cluster with 100% confidence is when the maximum membership value is 1.0 (i.e., the object is identical to its cluster center). This is the drawback of the dominant weighting value imposed by the k-AMH algorithm. Therefore, in order to improve the original dominant weighting value, we considered the cut-off point of the upper quartile (Q3) or 75th percentile to be given to any maximum values less than 1.0, with a condition that the values must be greater than 1/k, where k is the number of clusters; otherwise, a cut-off point of median or 50th percentile is given. The new dominant weighting value method is described in Equation 7.
Y-STR datasets
For benchmarking results, six Y-STR datasets were used to compare the clustering performances of all algorithms. These datasets were divided into two categories: (1) Y-STR datasets for haplogroup applications (datasets 1–3; Table 1), and (2) Y-STR dataset for Y-surname applications (datasets 4–6; Table 1). The main difference between these two categories was their similarity distance; the Y-STR haplogroup data were typically more distinct than the Y-STR surname data, having higher similarity distances [for a detailed description and explanation of the characteristics of the data, see Seman et al., (2013)].
Evaluation method
The analyses are based on the mean accuracy scores obtained from experiments that were run 100 times (100-run) for each algorithm and dataset. During the 100-run experiments, the Y-STR objects in the datasets were randomly reordered from the original order of each run. The misclassification matrix was used to analyze the correspondence between the clusters and the classes of the instances. For example, if a particular dataset had four classes (groups) such as A, B, C, and D, then the objective was to cluster the dataset into four clusters. If the number of objects belonging to the classes A, B, C, and D was 10, 10, 10, and 17, respectively, a 100% accuracy score would be achieved if all objects were in their respective clusters, as shown in Table 2.
Thus, the performance of the algorithms was primarily measured by the clustering accuracy, defined by Huang (1998) as described in Equation 8.
where k is the number of clusters, al is the number of instances occurring in cluster l and its corresponding group (haplogroup or surname), and n is the number of instances in the datasets.
In addition to the analysis described above, we performed secondary analysis using precision and recall methods. These methods are described in Equations 9 and 10, respectively.
where bi is the number of incorrectly classified objects, and ci is the number of objects in a given class but not in a cluster.
Results
Here, we present results based on accuracy, precision, and recall scores taken from 100 experimental runs for each dataset and algorithm. Table 3 shows the clustering accuracy results for the six datasets. The results showed that, in general, combining the two new methods in the Nk-AMH III algorithm significantly increased the mean accuracy scores for Dataset 1 (1% increase), 2 (5%), 3 (1%), and 6 (3%), while Datasets 4 and 5 maintained their optimum accuracy score of 1.0. By combining all six datasets, the Nk-AMH III achieved a mean accuracy score of 0.95, representing an increase of 2% compared with the original k-AMH algorithm (0.93).
Considering the implementation of the new methods in the original k-AMH algorithm (i.e., result from Nk-AMH I and Nk-AMH II), both algorithms showed inconsistent performance. The Nk-AMH I significantly increased the minimum values of the accuracy scores for each dataset when compared with the k-AMH algorithm. These results indicate that the new initial center selection method was a main factor contributing to the overall performance of the Nk-AMH I algorithm. In contrast to the minimum accuracy scores, Nk-AMH I produced maximum values for accuracy scores that were slightly decreased compared with k-AMH. For Nk-AMH II, the mean clustering accuracy score when the six datasets were combined was 0.94, a 1% increase on the k-AMH algorithm (0.93). However, the minimum values of the accuracy scores produced by Nk-AMH II decreased slightly compared with k-AMH, whereas the two algorithms produced similar maximum values for accuracy scores.
Table 4 shows an additional comparison based on precision and recall scores for each dataset and algorithm. Nk-AMH III produced a mean precision score of 0.93 when the six datasets were combined, which was a significant increase of 5% compared with k-AMH, 7% compared with Nk-AMH I, and 4% compared with Nk-AMH II. Furthermore, Nk-AMH III produced a recall score of 0.93 for the six datasets combined, which was a significant increase of 7% compared with k-AMH, 5% compared with Nk-AMH I, and 2% compared with Nk-AMH II.
These results indicate that the two newly proposed methods should not be implemented alone. Indeed, the combination of these methods in Nk-AMH III produced the most reliable algorithm for clustering Y-STR data. To test this result further, we performed a one-way ANOVA. In this test, we found that the assumption of homogeneity of variance was violated (Levene F(3, 2396)=7.41, p<0.01); therefore, we reported the Welch F-ratio. There was significant variance in the clustering accuracy scores among the four algorithms (F(3, 1328)=10.39, p<0.01); therefore, we used the Games–Howell procedure for a multiple comparison. Table 5 shows the results of this comparison, comparing the Nk-AMH III algorithm against the others. Performance of Nk-AMH III (M=0.95, 99% CI [0.94, 0.95]) differed significantly from the other three algorithms (p<0.01); thus, it performed significantly better than the other algorithms when clustering Y-STR data.
Figure 1 shows a direct performance comparison for all k-AMH-type algorithms. The range of the box plot for the Nk-AMH III algorithm was relatively small, which represents greater consistency, and its median and minimum accuracy scores were higher than the other k-AMH algorithms. We suggest that the superior performance of Nk-AMH III algorithm was essentially caused by the combination of our two new methods. These new methods are the main factors in the Nk-AMH III algorithm, which can handle the uniqueness of Y-STR data characterized by objects with high similarity.
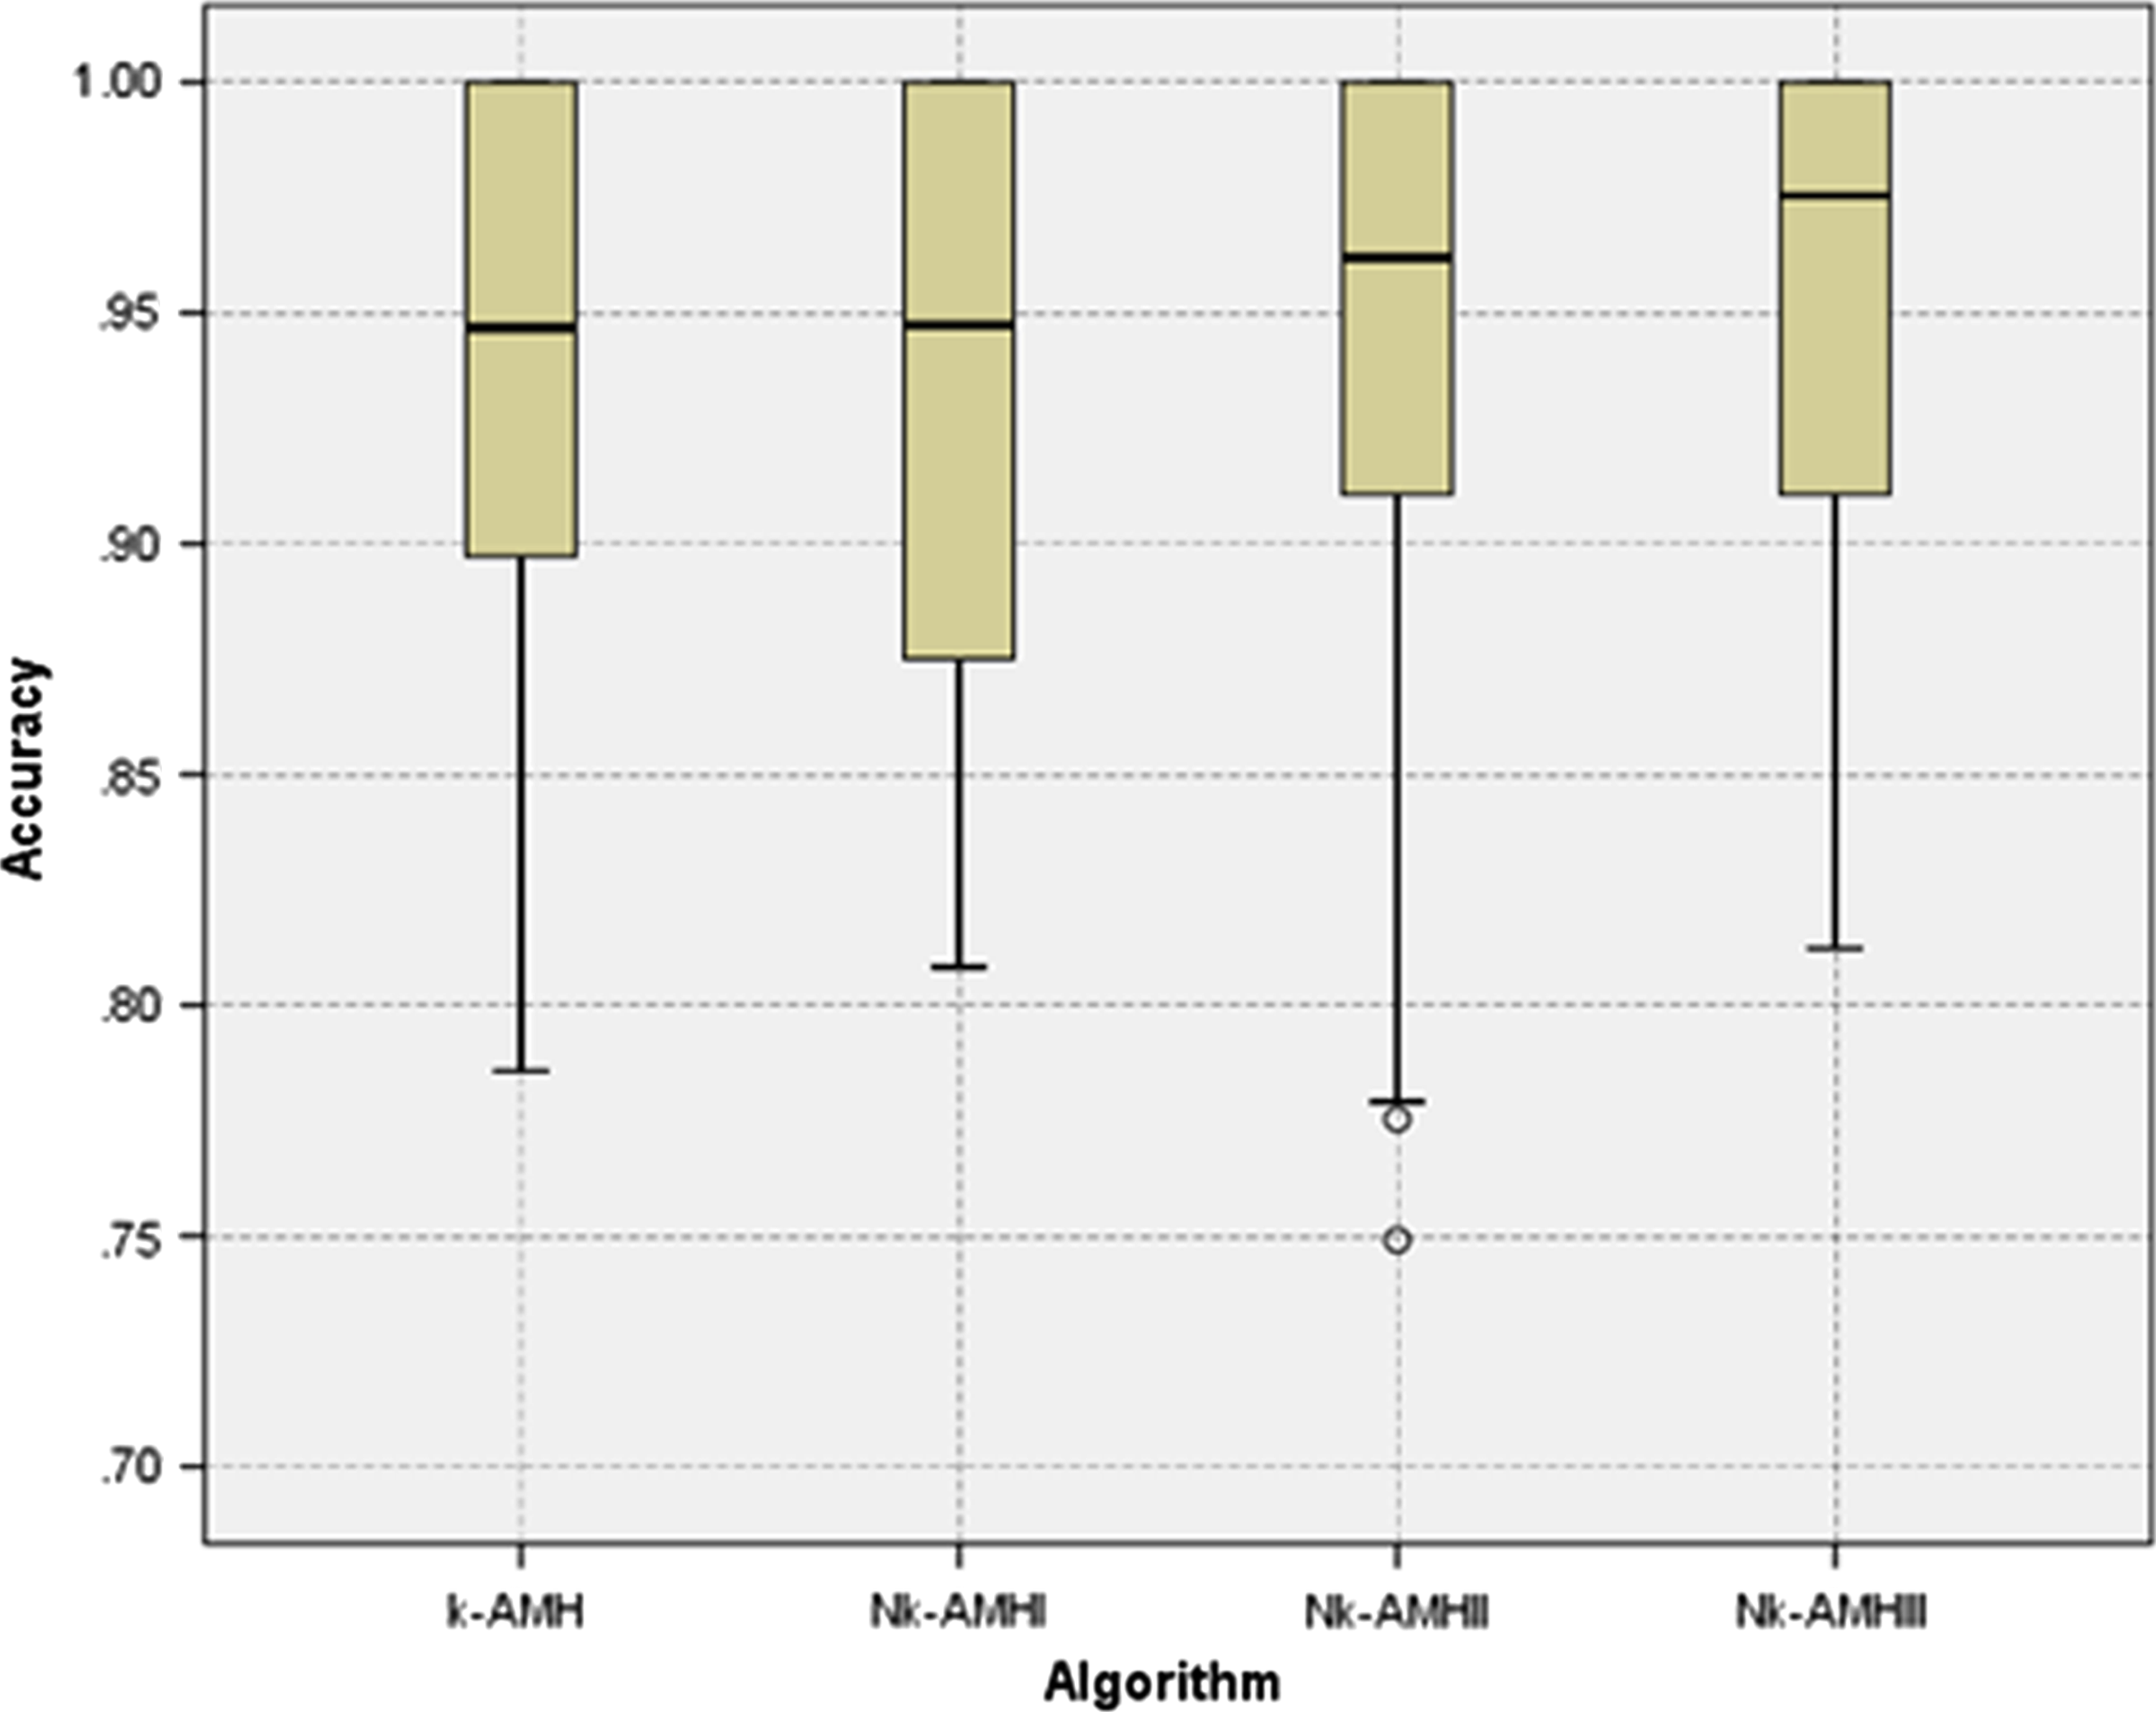
Box plot comparison of the clustering accuracy performance of k-AMH, Nk-AMH I, Nk-AMH II, and Nk-AMH III algorithms.
Discussion
Owing to its superior performance in clustering Y-STR data, the Nk-AMH III algorithm incorporating unsupervised methods has the potential to be the core engine moving towards the development of fully automatic clustering applications for large-scale genotypic data. Furthermore, it could also be applied to any genotypic data with categorical attributes such as autosomal STR, SNP, and DNA sequences.
In this study, Nk-AMH III produced high accuracy scores and showed consistency in the results, suggesting that the algorithm can be considered for the future development of several clustering applications. For example, the algorithm could be applied to develop a clustering tool for forensic identification in the analysis of mass fatality incidents, which would be particularly useful in cases where identification must be achieved solely by using DNA evidence. With Nk-AMH III, the tool could potentially group any set of genotypic data (e.g., STR, SNP) in such a way that data from the same group are more similar to each other than to those from other groups. When dealing with large-scale comparative genotyping and kinship analysis, such a tool could quickly separate genotypic data into groups according to the similarities in the data. Therefore, the Nk-AMH III algorithm could be applied as a complementary tool with the existing tools of mass identification such as MDKAP, MFISys, and DNAVIEW, particularly for kinship data analyses.
These three established applications have their own advantages in mass identifications (e.g., MDKAP is good for kinship analysis through pair-wise comparison, MFISys has an advantage of collapsing and sorting datasets, and DNA VIEW is able to determine kinship by pedigree analysis). In addition, the Nk-AMH III application has also several advantages. For example, it would be useful for providing a quick overview of intra-group and inter-group similarities, which could be used during the pre-processing stages of mass identification. Moreover, the approximate modal haplotypes obtained by the algorithm as the center of clusters could also be used as reference samples for those that belong to the clusters, especially in cases where the DNA samples are collected from unknown remains. Furthermore, the predefined number of clusters, ranging from two to any given maximum, could assist researchers to better identify closeness.
Another application for the Nk-AMH III algorithm could be in the development of a tool for clustering large haplogroups (i.e., groups of similar haplotypes that share a common ancestor). Anthropologists could use a preliminary tool such as this to automate clustering of a group of similar patterned and related descendant haplotypes that share a common ancestor. Indeed, the approximate modal haplotypes obtained by using the algorithm would be a good reference as candidate modal haplotypes for particular haplogroups. In addition to clustering haplogroups, the algorithm could also be used to develop a tool for identifying family trees. Within its capabilities, any genotypic data could be submitted to any family database for the algorithm to automatically identify groups of similar family relatedness.
Conclusions
Of the algorithms tested in this study, the Nk-AMH III algorithm proved to be the superior unsupervised k-AMH algorithm for clustering Y-STR data. The algorithm significantly increased the minimum values of accuracy scores, as well as the overall accuracy scores. Moreover, in general, the algorithm significantly increased mean clustering accuracy scores. The superior performance of the Nk-AMH III can be explained by the newly introduced initial center selection, and dominant weighting value. In addition, the use of objects as the center of clusters in the k-AMH procedure is an important factor that contributes to its optimal performance when processing unique Y-STR data with high similarity distances. With an error rate of just 5% when clustering Y-STR data, the use of the Nk-AMH III algorithm in future research for further development of clustering tools applicable to forensic human identification is conceptually feasible, especially for the analysis of mass fatality incidents. If these applications are to be developed, researchers will need to consider integrating other methods (e.g., for statistical analyses and/or reporting of results) with the algorithm. Nevertheless, implementing the algorithm within the aforementioned clustering tools is experimentally feasible.
Footnotes
Acknowledgments
This research was supported by the Fundamental Research Grant Scheme, Ministry of Education, Malaysia. We would like to thank RMI, UiTM for their support for this research. We extend our gratitude to those who have contributed toward the completion of this publication. We also would like to thank Editage (![]() ) for English language editing.
) for English language editing.
Author Disclosure Statement
The authors declare that no competing financial interests exist.