
Abstract
Abstract
Global health, whether in developed or developing countries, is in need of robust systems diagnostics for major diseases, such as HIV/AIDS, impacting the world populations. Fourier transform Infrared (FTIR) spectroscopy of serum is a quick and reagent-free methodology with which to analyze metabolic alterations such as those caused by disease or treatment. In this study, Attenuated Total Reflectance Fourier-Transform (ATR-FTIR) Spectroscopy was investigated as a means of distinguishing HIV-infected treatment-experienced (HIVpos ARTpos, n=39) and HIV-infected-treatment-naïve (HIVpos ARTneg, n=16) subjects from uninfected control subjects (n=30). Multivariate pattern recognition techniques, including partial least squares discriminant analysis (PLS-DA) and orthogonal partial least squares discriminant analysis (OPLS-DA), successfully distinguished sample classes, while univariate approaches identified significant differences (p<0.05) after Benjamini-Hochberg corrections. OPLS-DA discriminated between all groups with sensitivity, specificity, and accuracy of >90%. Compared to uninfected controls, HIVpos ARTpos and HIVpos ARTneg subjects displayed significant differences in spectral regions linked to lipids/fatty acids (3010 cm−1), carbohydrates (1299 cm−1; 1498 cm−1), glucose (1035 cm−1), and proteins (1600 cm−1; 1652 cm−1). These are all molecules shown by conventional biochemical analysis to be affected by HIV/ART interference. The biofluid metabolomics approach applied here successfully differentiated global metabolic profiles of HIV-infected patients and uninfected controls and detected potential biomarkers for development into indicators of host response to treatment and/or disease progression. Our findings therefore contribute to ongoing efforts for capacity-building in global health for robust omics science and systems diagnostics towards major diseases impacting population health.
Introduction
I
The diagnosis and monitoring of metabolic abnormalities resulting from HIV infection and/or ART is based mainly on radioimmunoassays, dual-energy X-ray absorptiometry (DEXA), and numerous other colorimetric assays (Chang et al., 2004; Negredo et al., 2002; Taylor et al., 2007) where one metabolite or a group of related metabolites are detected at a time. These methods are not only laborious to perform but also expensive and can be subjective (Wohl et al., 2006). A possible solution to some of these issues is offered by metabolomics methodologies where multiple metabolites can be measured in a single analysis.
Several spectroscopic techniques have been employed to obtain metabolic profiles that distinguish diseased from healthy biofluids (Derenne et al., 2012; Edelstein, 2011; Graça et al., 2013; Johnston et al., 2010; Serkova and Niemann, 2006; Sitole et al., 2013). Previous studies from our group described the potential of both nuclear magnetic resonance (NMR) spectroscopy (Hewer et al., 2006; Philippeos et al., 2009) and mass spectrometry (MS) (Williams et al., 2012) in HIV/AIDS metabolomics. Here we explore the use of ATR-FTIR, a methodology incorporating a much simpler data collection approach, for the detection of metabolites in HIV-infected sera compared to negative controls with the secondary goal of determining whether metabolites detected in this manner would be comparable to those identified by NMR and MS-metabolomics and thus leading to the same conclusions.
Vibrational spectroscopic methods such as FTIR- and Raman spectroscopy are multipurpose techniques that offer advantages in simplicity, rapidity, low-cost, and minimal sample preparation. FTIR spectroscopy, in combination with multivariate statistical analysis of data, was shown to be a useful method of metabolic profiling of disease, since it accurately reflected the phenotype of a sample (Ellis et al., 2006). Very few studies have evaluated the potential of FTIR technology for distinguishing spectra from HIV-infected compared to uninfected individuals. Bahmani and co-workers (2009) demonstrated that visible–near-infrared (Vis-NIR) spectra, coupled with partial least square (PLS) regression could detect HIV infection in plasma samples. In their study, Bahmani et al. (2009) showed that plasma Vis-NIR spectroscopy combined with principal component analysis (PCA) and soft independent modelling of class analogy (SIMCA) allowed for a discrimination between samples from HIVpos untreated patients and uninfected controls. This makes sense because the effect of HIV on metabolism is dependent on viral load, with higher levels being more detrimental to the patient and the most extreme cases of metabolic interference being seen in the presence of ART. Data presented by Bahmani et al. (2009) suggested that vibrational changes of the functional groups in ArCH (857–890 nm), ROH (940–970 nm), and RNH2 (1030 nm) were sufficient to discriminate cases in the context of their HIV status. Since these functional groups (ArCH, ROH, and RNH2) are found in proteins, lipids, and saccharides, cautious inferences regarding metabolic irregularities associated with these molecules can be made.
Given the preliminary successes with Vis-NIR spectra able to discriminate HIV-infected compared to uninfected spectra, this current investigation attempted to show an improved discrimination between HIV infected (treated and untreated) and uninfected sera using FTIR spectroscopy in the mid-IR region (4000–400 cm−1). Since the mid-IR region detects vibrations of essential biomolecules, it is widely used in studies of spectral differences of biological samples (as reviewed by Ellis et al., 2006).
The metabolic differences detected by ATR-FTIR spectroscopy between the experimental groups is presented here for the first time. ATR-FTIR spectroscopy coupled with chemometrics successfully distinguished sera from HIV-infected patients and uninfected controls with distinctions visible in the presence of treatment. This data allowed for conclusions similar to those reached using data collected with more sensitive metabolomics methodologies such as NMR and MS.
Materials and Methods
Ethics approval
The ethics committee of the University of Pretoria (Faculties of Natural and Agricultural Sciences and Health Sciences) approved this study with protocol numbers E080-506-019 and 163/2008. All patient volunteers gave their consent for involvement in the study, and patient anonymity was maintained throughout. HIV-infected patients were randomly selected from the King's Hope Clinic in Diepsloot, west of Johannesburg, and from Eersterust Community Health Centre in Pretoria, South Africa. Clinical information on each participant was obtained from both the medical records, and from a questionnaire completed upon sample collection.
Sample collection
Fifty-five HIV-infected serum samples were collected, 39 of which were on anti-retroviral treatment regimens, predominantly non-nucleoside reverse transcriptase inhibitors (NNRTI)-based regimens. The remaining 16 HIV-infected samples were not on any retroviral treatment. Similarly, 30 uninfected controls were also collected. Sample collection, preparation, and storage occurred as described by Hewer et al. (2006) and Williams et al. (2013). Table 1 presents the most relevant clinical information for the patients.
ND=not done; N/A=not applicable.
Mid-ATR-FTIR spectroscopy of serum
Serum samples were liquefied slowly at room temperature. Following 30 min incubation in a 56°C water bath, 5–10 μL serum was transferred onto separate glass slides (Kevley Technologies, Ohio, USA) and air-dried overnight to form homogeneous dried films. Serum samples were then scraped off onto the diamond crystal surface area. IR spectra were acquired in absorbance mode (mid-IR source 4000–400 cm−1) using a Bruker FTIR V70x spectrometer (Bruker Optik GmbH, Karlsruhe, Germany) containing an ATR attachment and operated by OPUS (7) software. A diamond single reflection ATR accessory was used to procure the mid-IR spectra of each serum sample. A background absorption spectrum (for atmospheric correction) was taken after every 10 samples. The ATR diamond crystal was washed with ethanol and distilled water (three washes) and dried with tissue before use and between each analysis. Spectra were obtained at 4 cm−1 resolution and an average of 32 scans per sample was collected. Using OPUS software, rubberband baseline corrections and vector normalizations were performed for all the spectra. Differentiation was carried out using the Savitzky–Golay (SG) algorithm (Savitzky et al., 1964) with the following settings: number of coefficients, 17 (window size); polynomial fit order, 2; differentiation orders, 2.
Spectral processing
Processing of the serum spectra
Standardization of the data was done as described by Hewer et al. (2006). All spectra were normalized prior to multivariate analysis.
Linear discriminant analysis
In order to classify cases into their respective groups (HIVpos ARTpos, HIVpos ARTneg and uninfected control), linear discriminant analysis (LDA) was used as described by Philippeos et al. (2009) where stepwise analysis was applied to the 1867 frequencies to obtain the best data set for the classification. The resulting classification was based on 8 out of the 1867 spectral variables, these 8 variables being the ones that presented the highest difference between the groups. A leave-one-out-at a time cross-validation (LOOCV) was done similar to that described by both Hewer et al. (2006) and Philippeos et al. (2009), where each sample was left out of the analysis (validation data) and then classified based on the other samples (training data). This was repeated such that each sample is left out at least once. The discriminant functions resulting from this analysis are depicted in the scatter plot (Fig. 1).
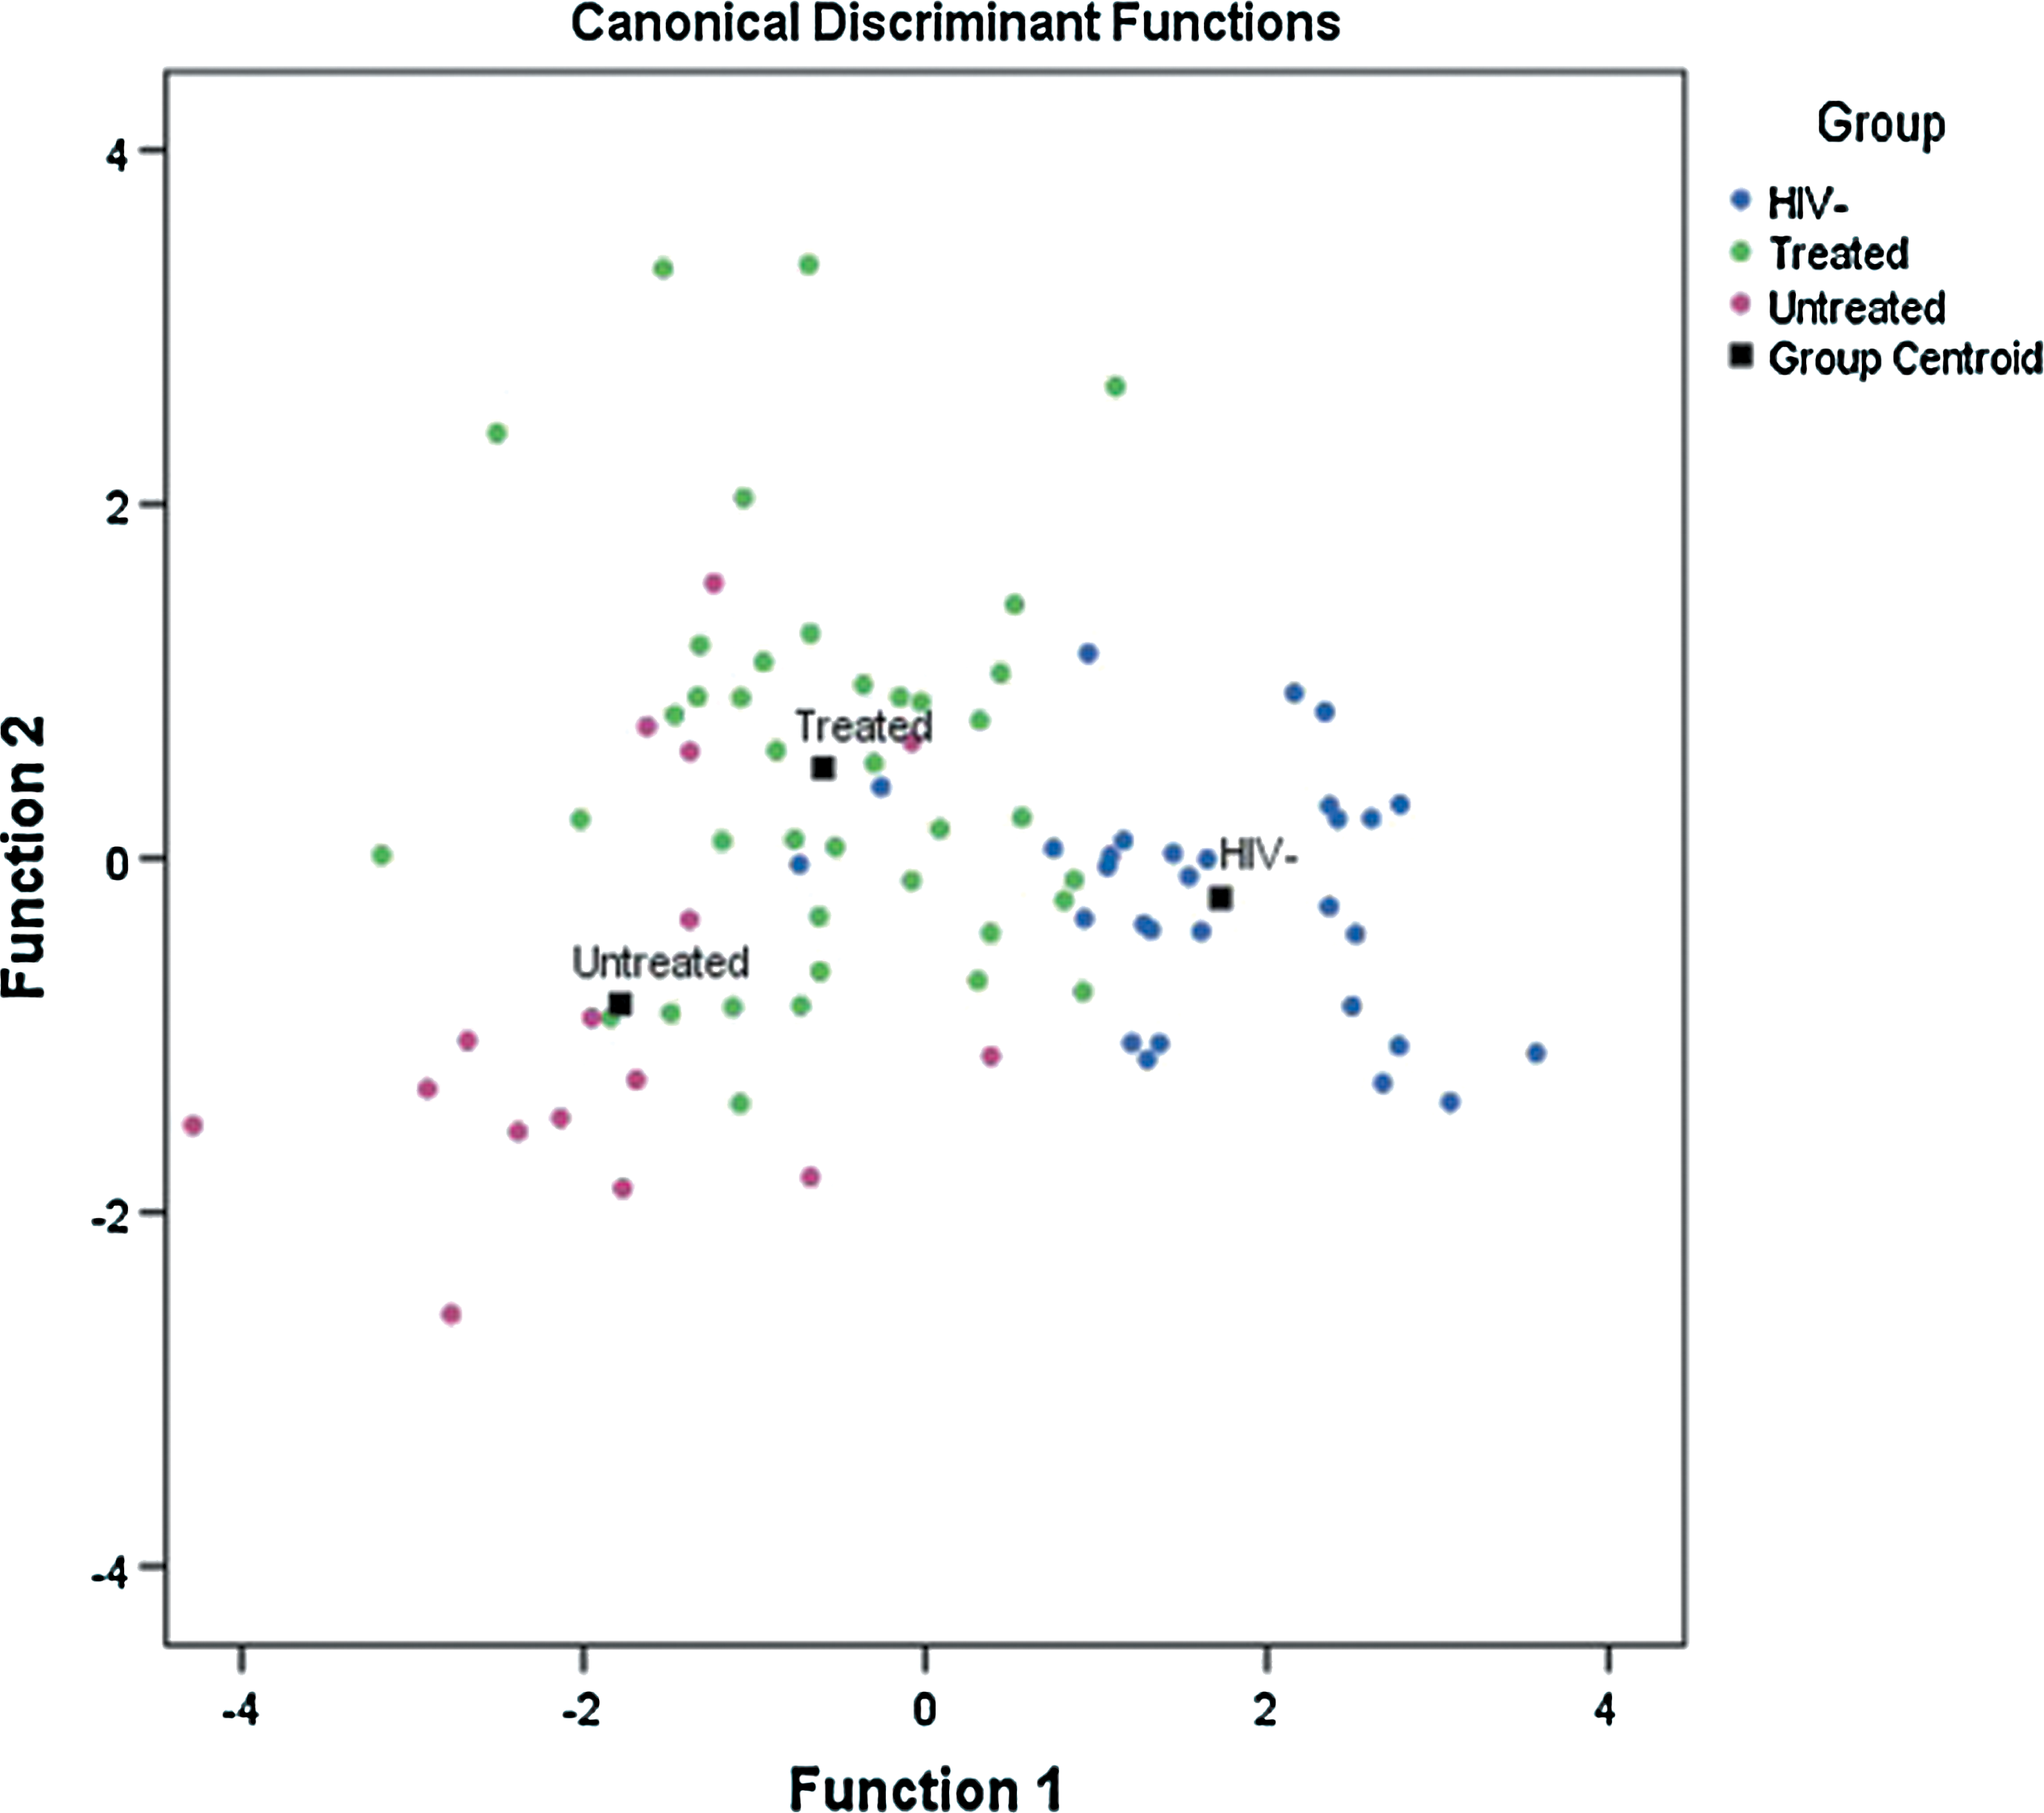
Representative scatter plot of ATR-FTIR spectra obtained from HIV infected (treated and untreated) and uninfected controls. The three experimental groups' discriminant functions are: 30 uninfected controls, 39 HIVpos ARTpos, and 16 HIVpos ARTneg.
Multivariate statistical analysis
Prior to multivariate analysis, an inclusion criterion was applied to the HIV-infected groups that was based on CD4 count. Only samples with CD4 count higher than 200 μ/L were included for the HIVpos ARTpos group, and only samples with CD4 count lower than 200 μ/L were included for the HIVpos ARTneg group. Also, the raw data of six control spectra produced values that were inconsistent with instrument controls and were excluded from further analysis. From the remaining samples, the average CD4+ count for the HIVpos ARTpos patients (n=30) was 357.22 cells/μL, HIVpos ARTneg patients (n=16) was 188.95 cells/μL, and the total number of individuals in the control group was 24.
Further analysis was performed using the SIMCA-P software package, version 13.0 (Umetrics, Umeå, Sweden). PCA was performed to observe inherent group clustering. Supervised PLS-DA was applied to obtain improved class discrimination. The leave-one-out cross-validation method was used to validate the quality of the PLS-DA models, and the R2 and Q2 parameters were used to define the quality of the models. R2 represents the total explained difference for the X matrix and indicates goodness of fit, and Q2 indicates the predictability of a model (Boccard et al., 2013; Szymanska et al., 2012). In biological samples a good predictive capability is indicated by Q2>0.5 and an excellent capability is indicated by Q2>0.9 (Sadeghi-Bazargani et al., 2011). The reliability of the models was further validated by the permutation test where n=200 (Lindgren et al., 1996). In addition, OPLS-DA was used for class discrimination and biomarker identification. OPLS-DA is a supervised method that uses an orthogonal signal filter to find the highest covariance between a given dataset and the sample class. The method was constructed using the FT-IR data as the X matrix, and the class information identifier for the different groups as the Y vector. The OPLS-DA model was performed to give a clearer separation since it removes variability that is not relevant to class separation within a given model. A more detailed explanation of the OPLS-DA methodology can be found in Worley and Powers (2013). Finally, in order to access the reliability of the OPLS-DA model, analysis of variance testing of cross-validated predictive residuals (CV-ANOVA) was performed. CV-ANOVA is generally calculated to highlight the significance of the two group separation in an OPLS-DA model (Ericksson et al., 2008; Wheelock and Wheelock, 2013). In order to identify the variables responsible for the separation of the groups, Variable Importance in Projection (VIP) values was used. VIP scores are used for variable selection as they give the discriminatory power of each variable (Wheelock and Wheelock, 2013). VIP values >1.0 indicate maximum discriminatory power, whereas those with values <1 indicate minimal discriminatory power (Chong et al., 2005). Significance tests using t-test was performed using SPSS version 19.0. Significance was determined after “BH” correction and considered significant when the p value <0.05.
Addressing potentially confounding factors
Since the samples were from a random selection of individuals, there were a number of differences within the groups, the biggest differences being age and gender. To gauge the effects of each of these factors on the metabolomics profiles, an OPLS-DA model was developed that included the effects of age and gender. This was done by comparing the original model with class information of Y=HIVpos ARTpos /HIVpos HIVneg patients and uninfected controls to: i) Age model with class information of Y=A (20–30 years) and B=(40–60years); and ii) Gender model with class information of Y=male and female. This comparison was done to identify whether age and gender were major casual factors. All these models were generated from the same dataset with the only difference being the class information. The age and gender models for the HIVpos ARTpos group are shown in the Supplementary Material section. (Supplementary material is available online at www.liebertpub.com/omi.)
Results
Population characterization
A total of 85 blood samples were collected, of which 30 were from uninfected healthy volunteers (uninfected controls), 39 HIV-infected individuals receiving antiretroviral treatment (HIVpos ARTpos patients), and 16 HIV-infected not on treatment (HIVpos ARTneg patients). The ages, viral load, and CD4 counts for the different patient groups are provided in Table 1.
FT-IR spectra of serum samples
Representative averages of the serum FT-IR spectra of (a) uninfected volunteers, (b) HIVpos ARTpos patients, and (c) HIVpos ARTneg patients are shown in Figure 2A raw data and Figure 2B second derivative in the wavelength range of 400–4000 cm−1. The second derivative spectra highlight small differences that may not be visible in the raw spectra. The standard deviation and distance between the three groups is represented in Supplementary Figures S1 and S2. A few absorption features were identified from all three spectral types. These features include; the C=O stretching vibration modes of the amide I absorption range (1652 cm−1), coupled N-H functional group modes of amide II (1480–1580 cm−1), as well as the functional group modes existing in proteins and amino acids (C-N stretching vibration 1200–1500 cm−1). Also visible are the carbohydrates (1300–925 cm−1) and lipid/fatty acid (3300–2800 cm−1) absorption features. Visually, there were slight differences between the spectra of all three groups which became more pronounced following statistical evaluation of the data.
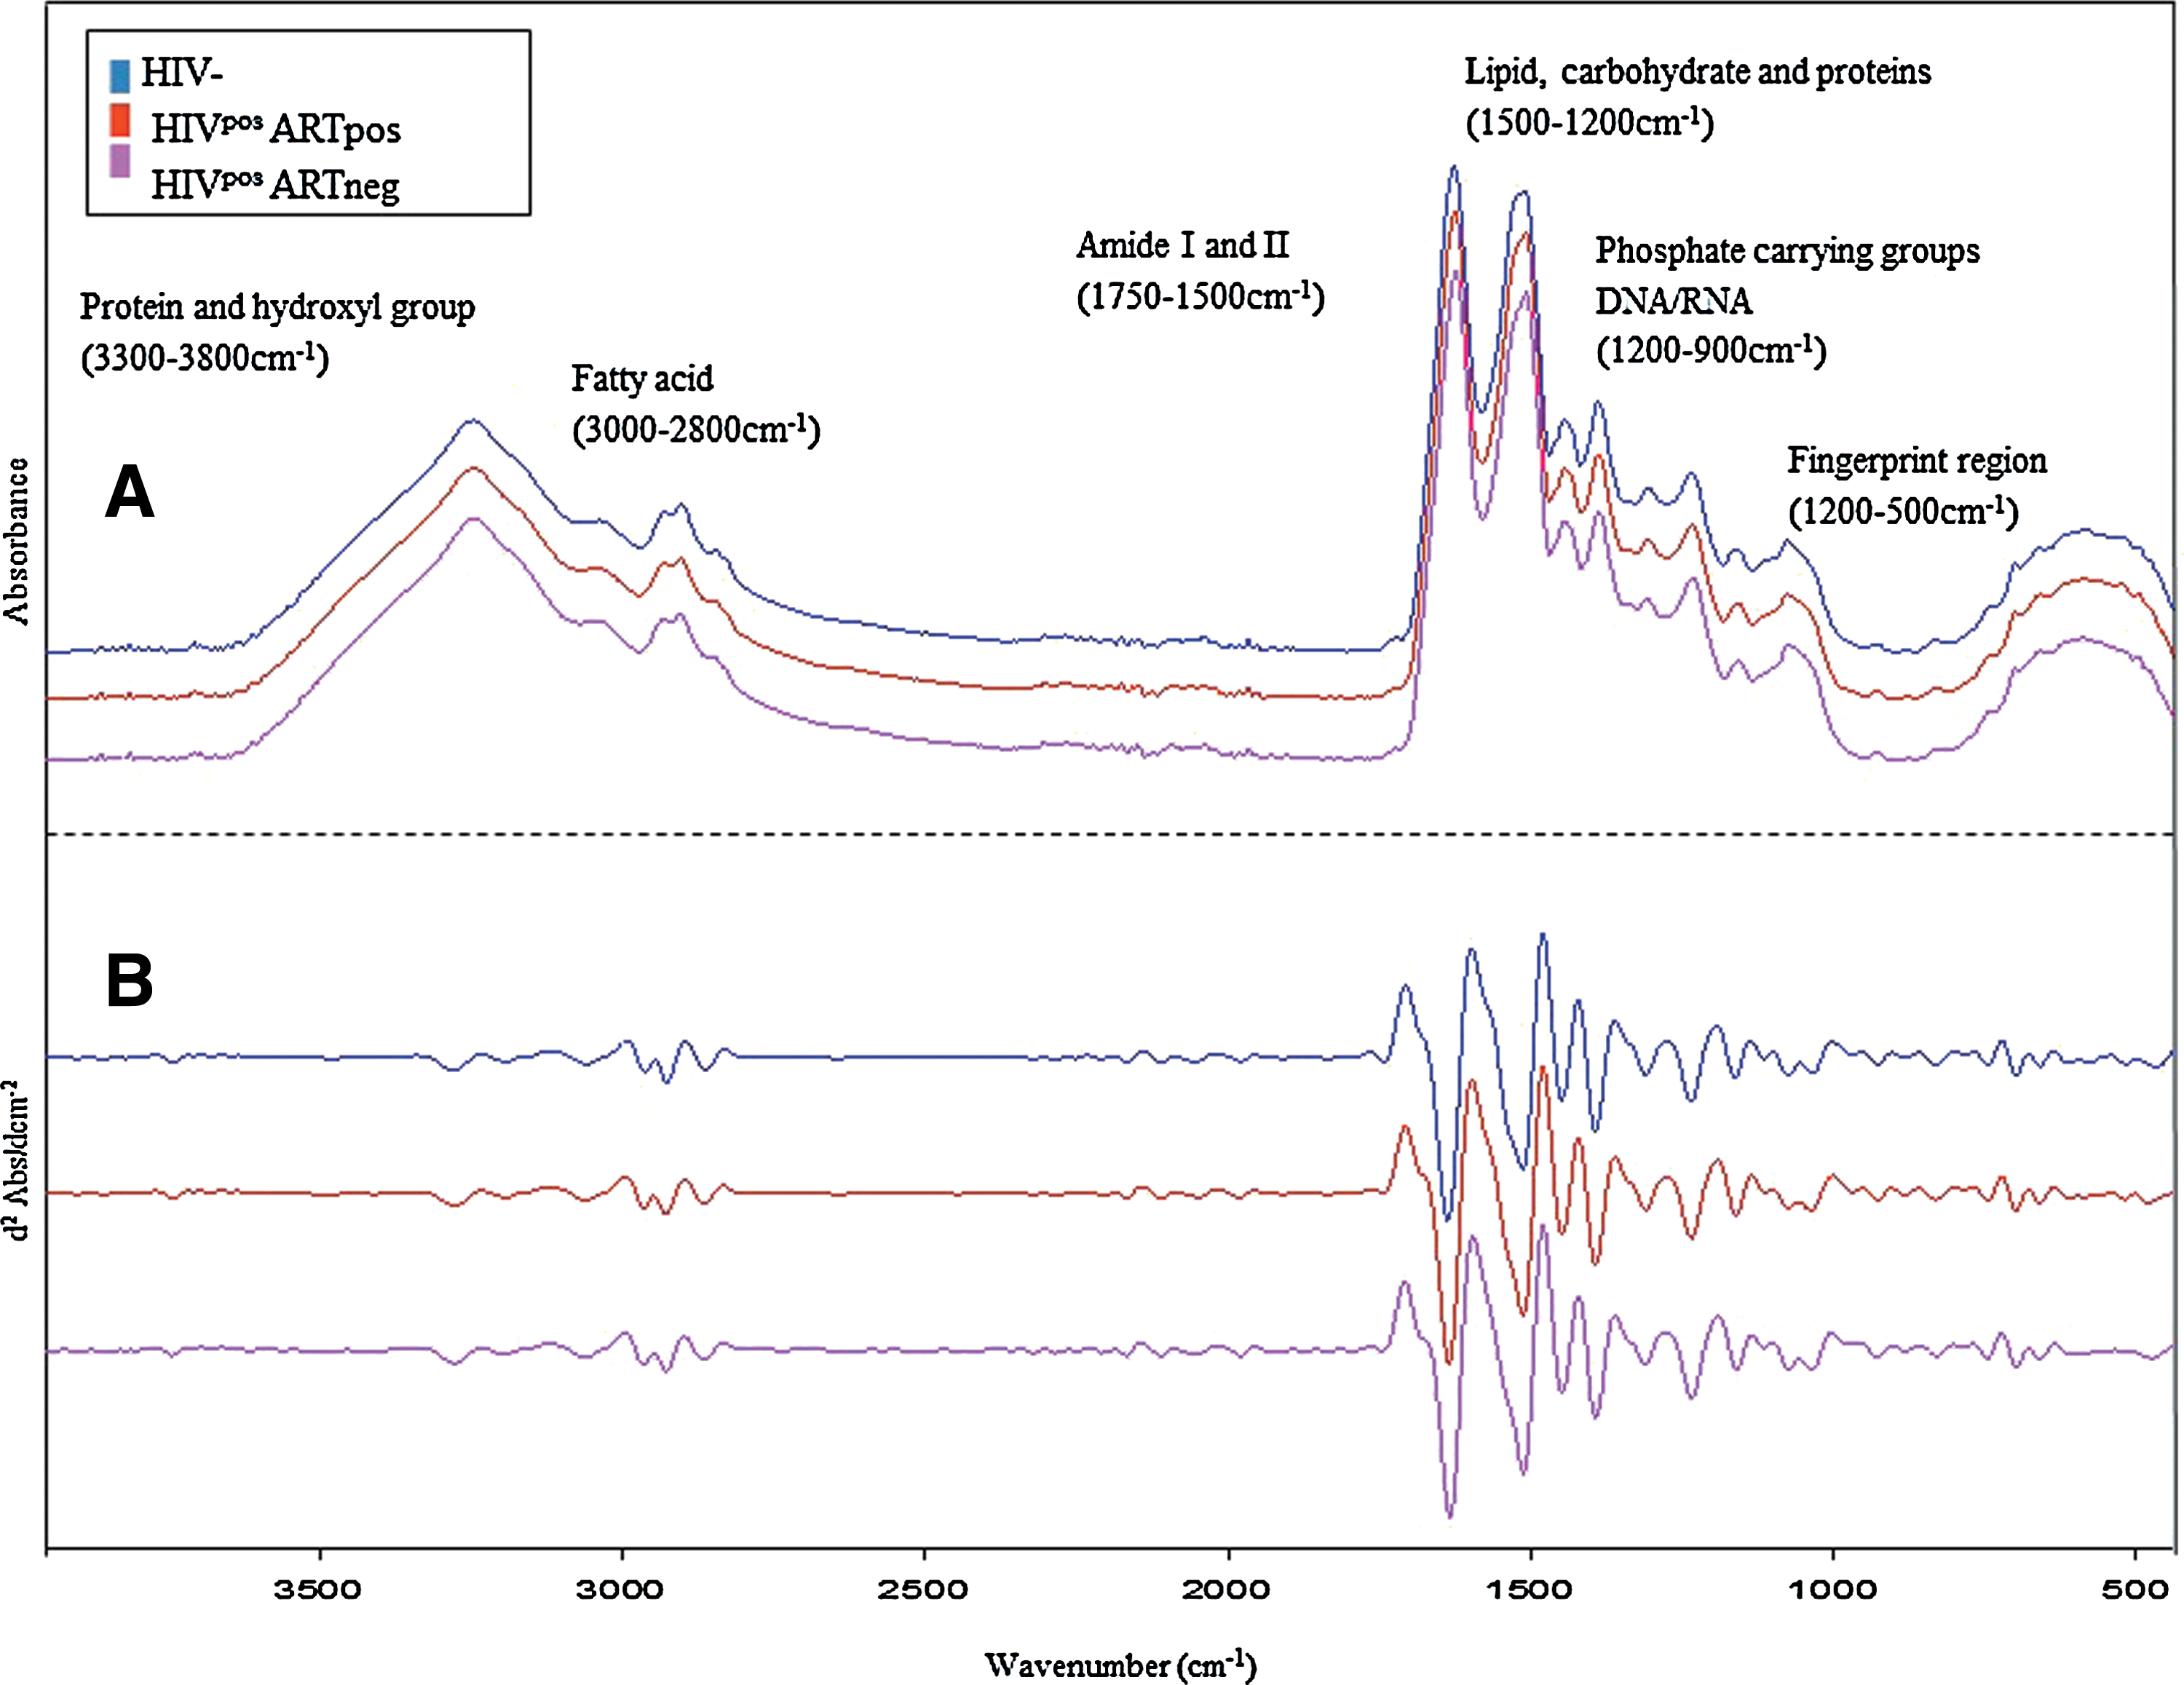
Representative averaged ATR-FTIR spectra of serum obtained from:
Linear discriminant analysis
LDA easily handles cases where the ‘within-class’ frequencies are unequal and maximizes the ratio of ‘between class’ variance to the ‘within-class’ variance in any particular data set, thereby guaranteeing maximal separation (Fukunaga, 1990). Stepwise LDA analysis was performed to confirm that an FT-IR metabolomics approach would be capable of distinguishing three different experimental groups as seen in previous HIV-NMR and MS-metabolomics studies. Table 2 shows the LDA classification of samples as HIVpos ARTpos, HIVpos ARTneg and uninfected controls, with original grouped cases and cross-validated cases. The original classification accuracy was 78.8% and 72.9% after cross-validation (Table 2). Both original and cross-validation analysis verified that classification of the samples into the three separate groups was possible. From the scatter plot (Fig. 1), the three groups show some clustering with a degree of overlap. This overlap is probably due to related metabolic processes occurring in all three groups. Nevertheless, LDA was able to confirm that ATR-FTIR serum spectra of HIVpos ARTpos, HIVpos ARTneg, and uninfected controls could be separated into separate groups.
78.8% of original grouped cases correctly classified; 72.9% of cross-validated grouped cases correctly classified.
Discrimination between HIV-infected patients and uninfected controls
Unsupervised PCA was performed to obtain an indication of the variation between the mentioned experimental groups and to identify outliers. The PCA scores plots identified a few outliers. There are a number of reasons why an observation may be identified as an outlier, including differences in biochemical composition of samples, and presence of other disease and/or infections (tuberculosis, pneumonia, or diabetes). Given that the removal of outliers may at times be biased, the PCA scores plot, scores contribution plots, Hotellings T2, and DModX were used to compare and verify outliers prior to their removal. Nine outliers were identified and excluded before further analysis. Based on the contribution plot, comparisons between the outliers and the rest of the samples within the dataset, these nine outliers exhibited atypical intensities in the hydroxyl and protein spectral regions (3300–3800 cm−1). These observations are currently under further investigation.
Since PCA is an unsupervised method, score plots could not reveal an obvious separation between groups. In order to get a clearer separation between the experimental groups, supervised PLS-DA was applied. The PLS-DA scores plot for HIVpos ARTpos patients versus uninfected controls (Fig. 3A) showed a minor separation (R2X=0.615, R2Y=0.709, Q2=0.495), indicating a difference between the metabolic profiles of HIVpos ARTpos patients and uninfected controls. Similarly, Figure 3B shows a minor difference between the HIVpos ARTneg patients and uninfected controls (R2X=0.695, R2Y=0.8, Q2=0.626). In Figure 3C, there was a degree of overlap between the HIVpos ARTpos and HIVpos ARTneg patients, which suggests that the metabolic profiles of those two groups are similar (R2X=0.671, R2Y=0.602, Q2=0.12). Sensitivity, specificity, and accuracy of the PLS-DA models were also calculated (Table 3). To assess the robustness of the PLS-DA models, permutation tests of 200 permutations were done. The results from the permutations show that the original PLS-DA models were valid, since the Q2 regression lines had a negative intercept and the permutated data on the left was lower than the original data on the right (Fig. 3, left panel). The PLS-DA analysis therefore demonstrated that there were metabolic differences between HIV-infected and uninfected controls.
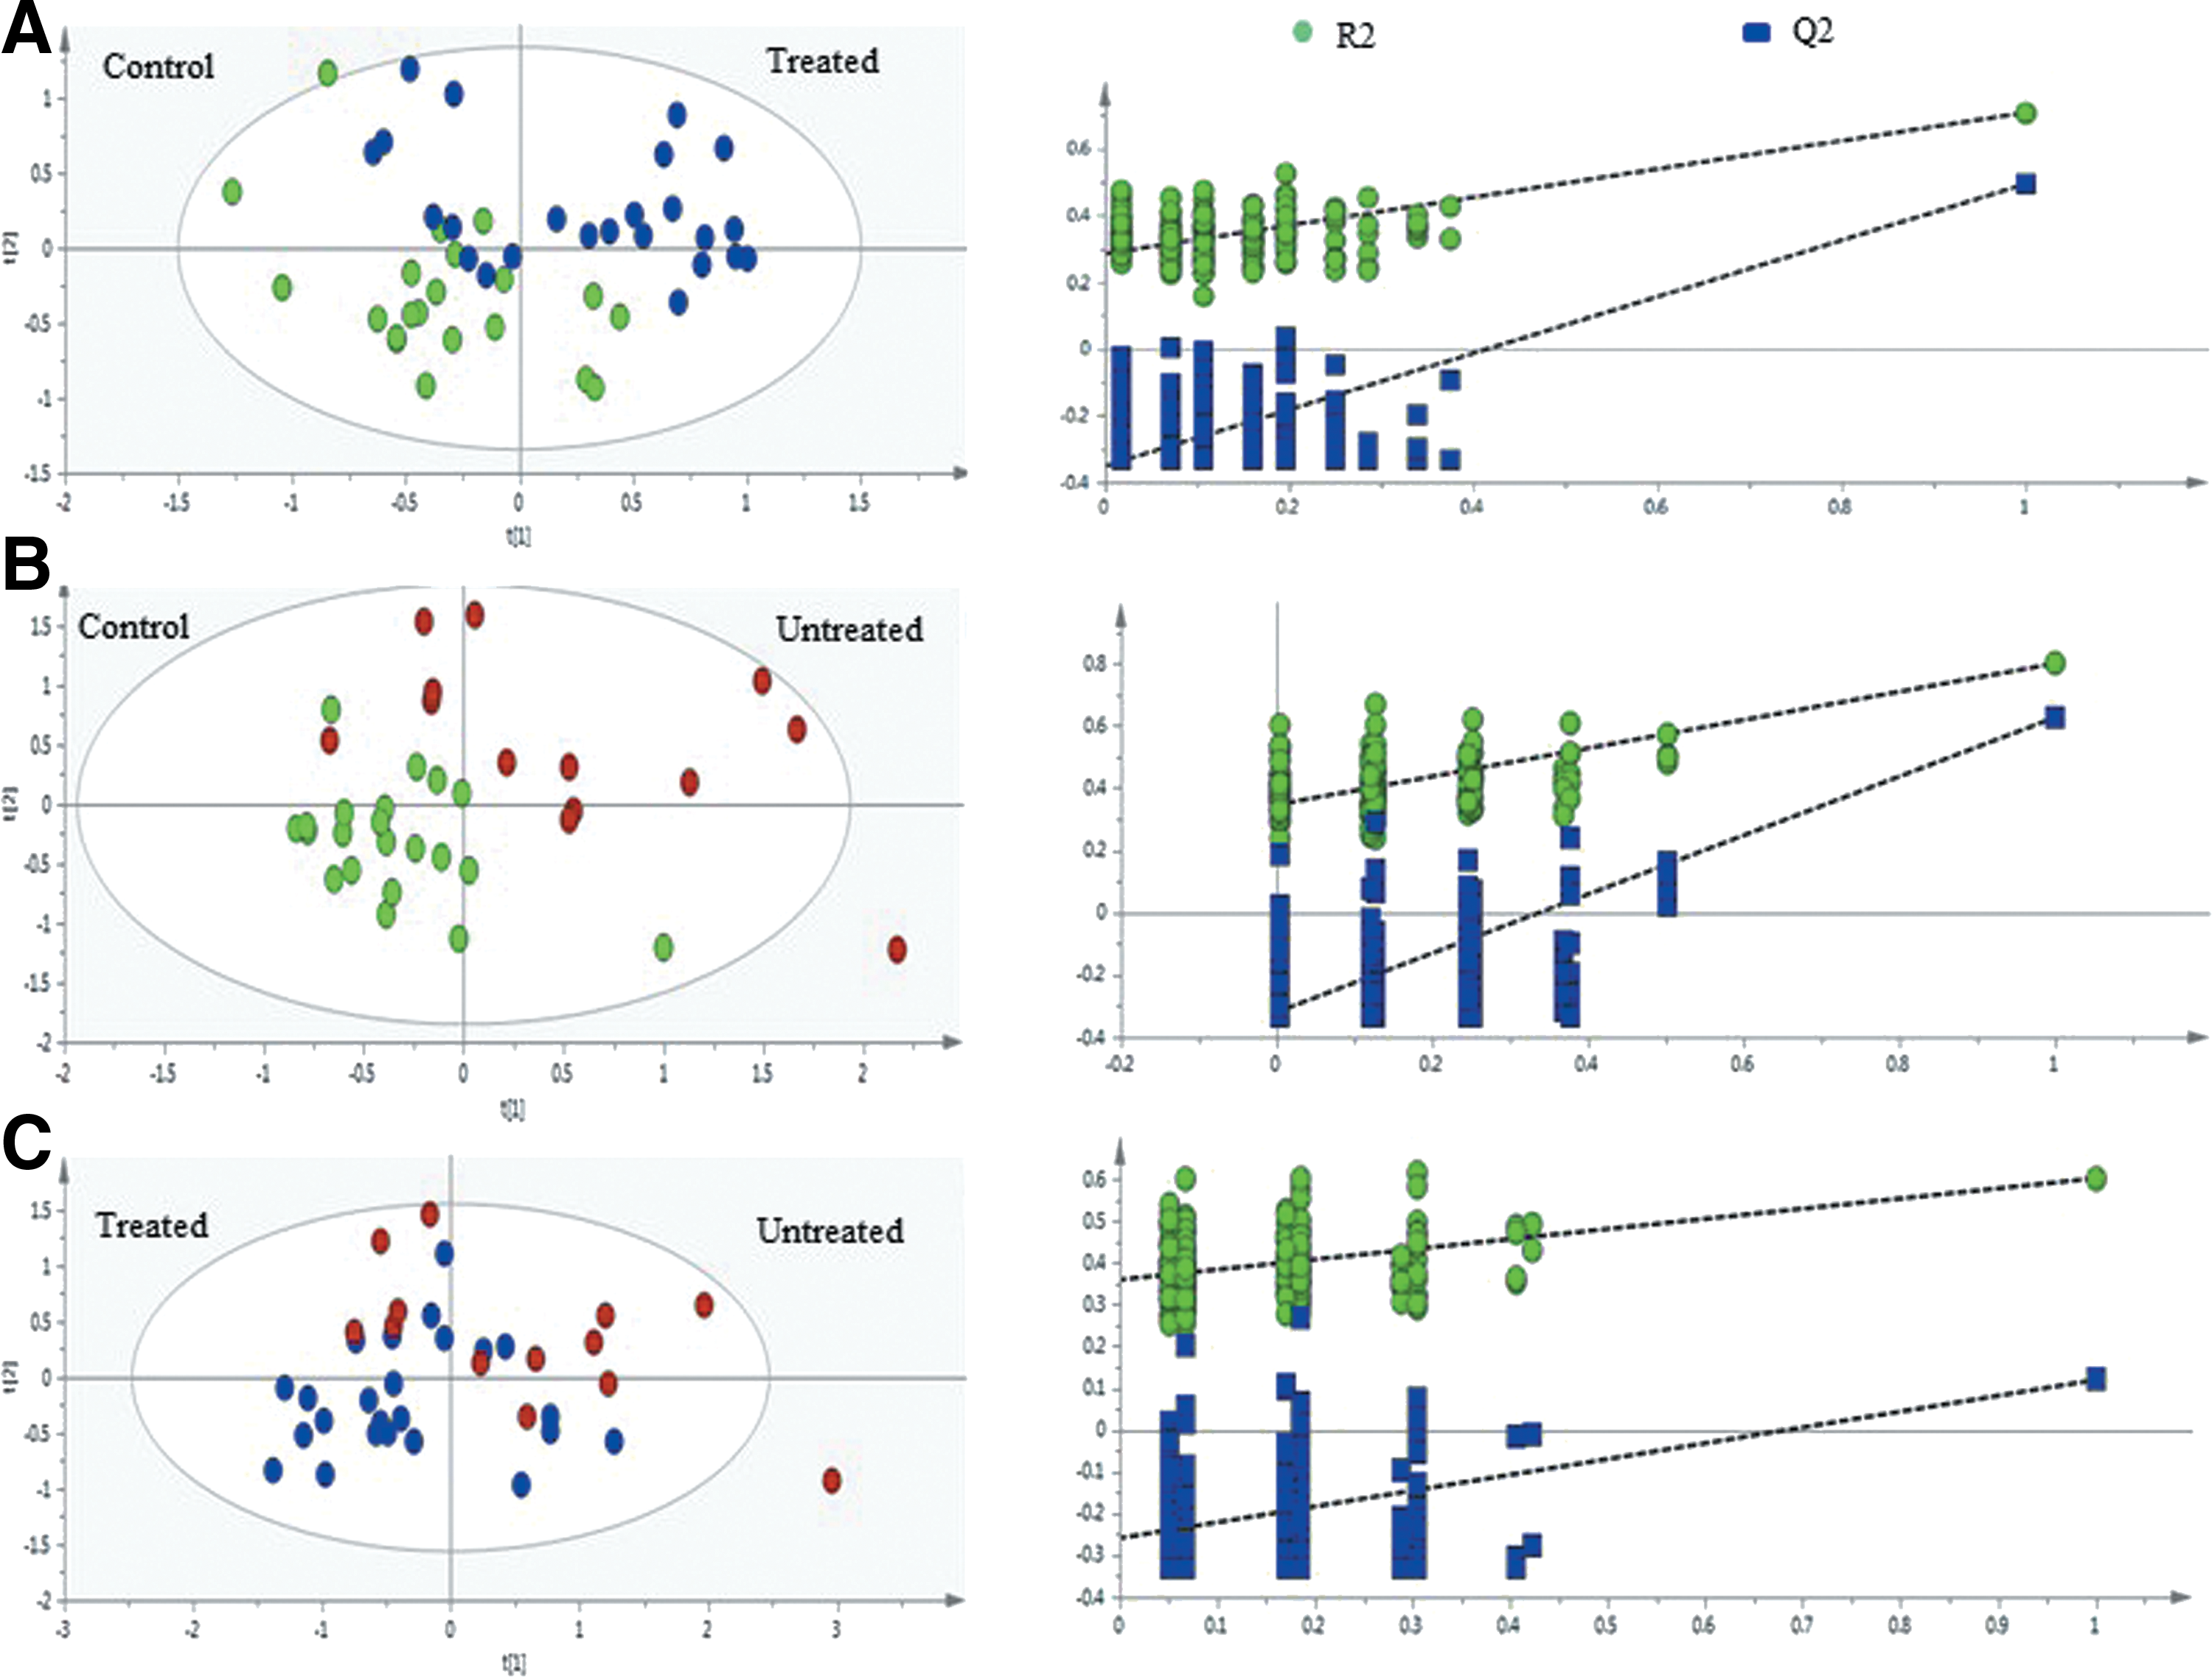
Cross-validation of PLS-DA models obtained from 200 permutation tests. PLS-DA plots indicating the separation between
Sensitivity calculation was determined from the ratio of true positives (HIVpos ARTpos correctly predicted) to total number of modeled HIVpos ARTpos spectra. bSpecificity was calculated from the ratio of true negatives (control samples correctly predicted) to total number of modeled control spectra. cAccuracy was based on the ratio of total number of samples correctly classified to total number of samples predicted. dProbability of a model occurring by chance, satisfied when p<0.05. All calculations are done as widely described in the literature.
Identifying discriminatory metabolites
In order to identify the spectral regions/metabolites responsible for the discrimination of the three groups, OPLS-DA was carried out with a Pareto scaling approach to further maximize the group separation, as well as to establish a global overview of the characteristics of the HIV-infected groups. In the OPLS-DA score plots, the separation between the HIVpos ARTpos patients and uninfected controls was further improved with R2X=0.756 and Q2 X=0.58 (Fig. 4A, left panel). Also, a pronounced difference between the HIVpos ARTneg group and the uninfected control group (Fig. 4B, left panel) is apparent, with R2X=0.823 and Q2=0.674, respectively. The OPLS-DA score plot for the HIVpos ARTpos and HIVpos ARTneg groups showed some degree of separation, with four HIVpos ARTpos samples appearing in the HIVpos ARTneg cluster (Fig. 4C, left panel). The variables responsible for the discrimination in the score plots are shown in the corresponding coefficient loading plots (Fig. 4, right panel). In the loadings plots, the positive direction represents variables that are more prominent in the groups located in the positive direction of the score plot (principal component), while those in the negative directions denote variables that are prominent in the groups located in the negative direction of the score plot. The color scaling maps located on the right of the coefficient plot designates the contribution of variables in discriminating the groups in each score plot. In the color scaling, the red color indicates a more significant contribution than blue.
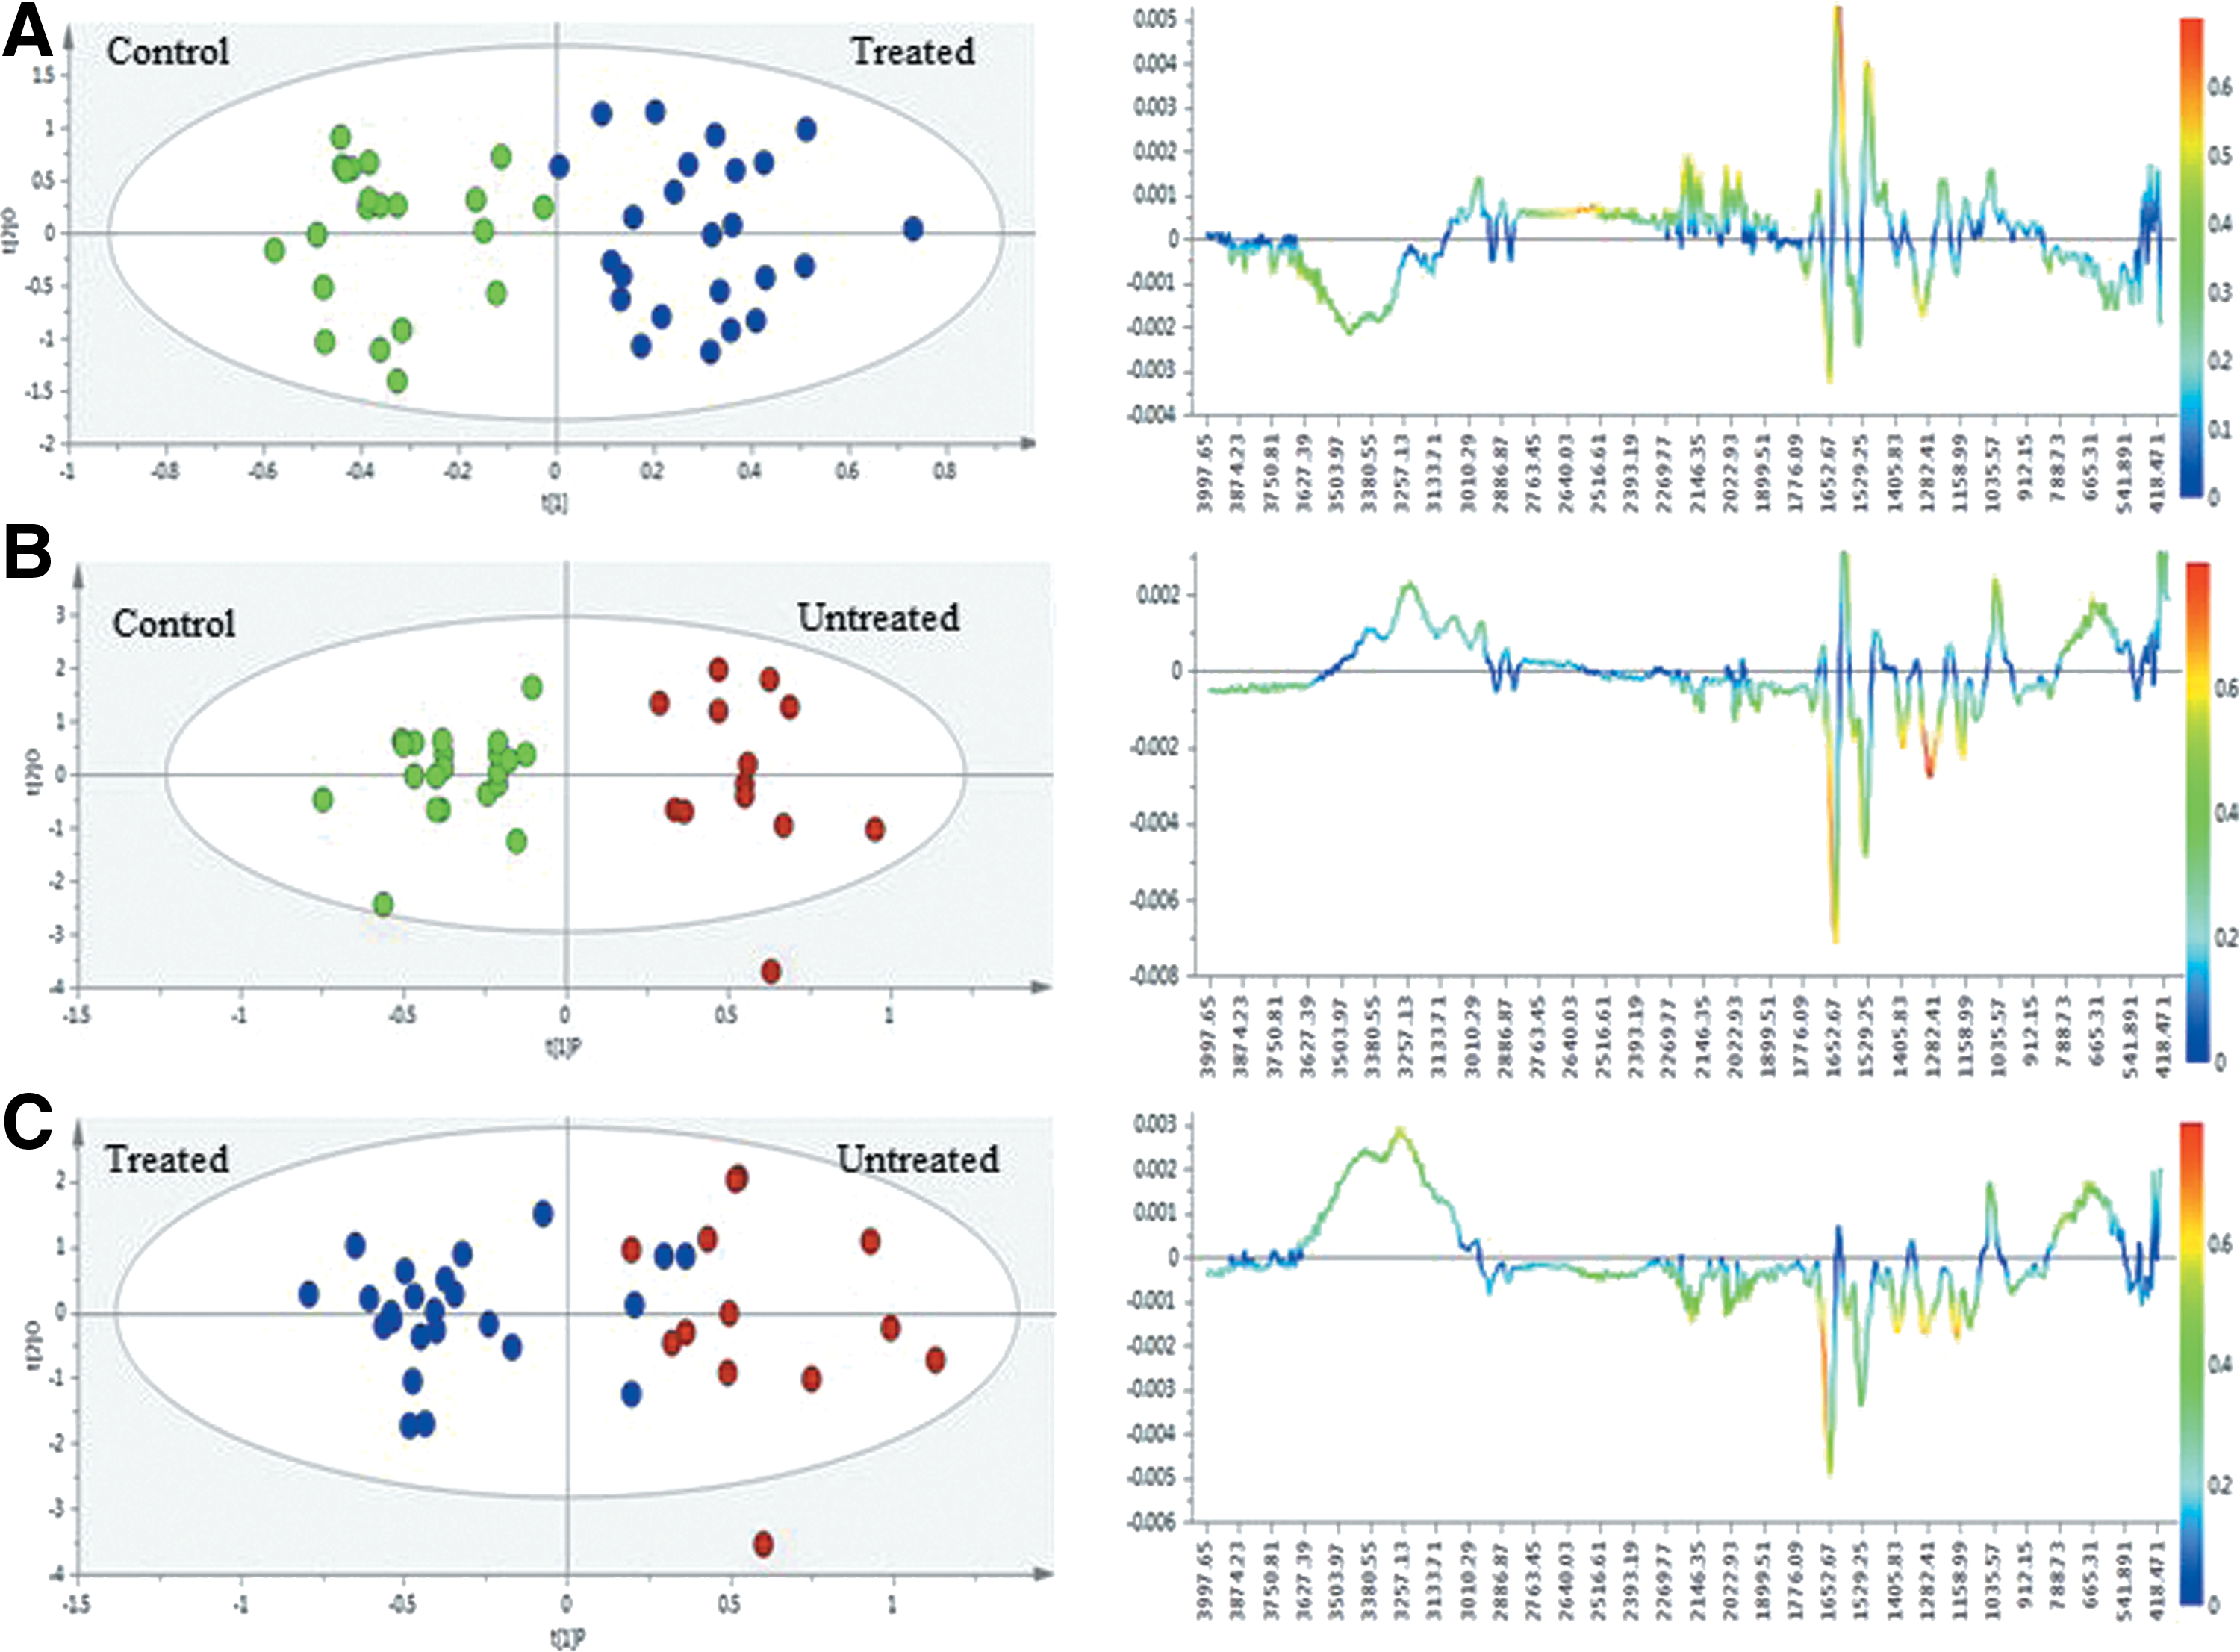
Multivariate statistical analysis of ATR-FTIR-based serum spectra obtained from HIV uninfected patients and uninfected controls. Scores plots (right panel) and loadings coefficient plots (left panel) generated from:
Based on the loadings plot comparison between the HIVpos ARTpos group and the uninfected group (Fig. 4A, right panel), the HIVpos ARTpos group contained prominent spectral absorbance in the proteins (1600 cm−1), lipids (3010 cm−1), and glucose (1035 cm−1) spectral regions, while less prominent spectral absorbance in the fingerprint region (665 cm−1), some carbohydrate regions (1299 cm−1, 1158 cm−1; 1498 cm−1) as well as the hydroxyl/protein (3257-3627 cm−1) region could be observed. Compared with the uninfected control group, the HIVpos ARTneg group (Fig. 4B, right panel) was similar to the HIVpos ARTpos, except for the more prominent absorbance observed in the fingerprint (665 cm−1) hydroxyl/protein (3257–3627 cm−1) regions. When comparing the HIVpos ARTpos and HIVpos ARTneg groups (Fig. 4C, right panel), the spectral absorbance in proteins (amide I) and lipid ester (1700 cm−1) were similar between the two groups, while the absorbance in some carbohydrate regions were more prominent in the treated group. Additionally, the spectral absorbance of the hydroxyl (3257–3627 cm−1), fingerprint (665 cm−1), and glucose region (1035 cm−1) were prominent in the HIVpos ARTneg group. The variables responsible for the outcome of each OPLS-DA model are listed in Table 4 along with the possible band assignments. Using these specific variables, we built classification models in order to check if the discriminatory power of the variables increases, decreases, or remains the same for all three models. Since the results obtained showed no major difference between the two models, we continued with the original models.
Assignments made based on literature guidelines (Gunasekaran et al., 2010; Jackson et al., 1996; Petrich et al., 2001).
The symbol A represents the uninfected control group, bRepresents the HIVposARTpos and cRepresents the HIVposARTneg.
All literature assignments were made based on literature findings.
P values calculated using the t-test and values that are significant after “BH” correction are indicated.
VIP values generated from the OPLS-DA model (values>1)
CV-ANOVA tests performed on the OPLS models resulted in p=0.00032 for HIVpos ARTpos versus uninfected controls, p=0.000963 for HIVpos ARTneg versus uninfected controls, and p=0.230 for HIVpos ARTpos versus HIVpos ARTneg.
Age and gender effects
This was a small exploratory volunteer-based study that was not designed to adjust for covariates. However, since age and gender are important factors in human metabolomics studies, we compared the original model to age and gender-specific models. The resulting age model (Supplementary Fig. S3B) showed that age had no influence on the original model's separation. Since both the original and age-specific models were not identical to each other, we can conclude that age was not the major variable contributing to the original separation. The gender-specific model (Supplementary Fig. S3C) was much more distinct in comparison to the age model. However, given the low predictability (Q2=0.142) and explained variation (R2=0.6), it is also evident that gender was not the primary discriminatory variable in the original OPLS-DA model. Given that gender was a greater confounding factor than age, we removed the seven male subjects and constructed a new OPLS-DA model (Supplementary Fig. S4) to gauge if the effects of gender were of significance. The removal of the male subjects seem to have had an effect on the OPLS-DA model, however this effect was not significant since the variables with discriminatory power remained similar for both models and model predictability (Q2=0.562; R2X=0.686) did not change dramatically.
Discussion
Numerous spectrometric metabolomics studies have identified spectral regions with which to discriminate HIV positive (treatment experienced and treatment-naive) from negative sera/plasma. The spectroscopic methodologies for which most data in this regard have been collected are NMR and MS (Sitole et al., 2013). The purpose of the current study was to explore the use of ATR-FTIR spectroscopy in the detection of potential biomarkers of HIV infection and/or antiretroviral treatment and the possibility of this methodology serving as a complementary tool for NMR and MS. The first application of mid- ATR-FTIR to HIV infected (treated) and uninfected sera, is presented here.
Data presented show that ATR-FTIR-based metabolic profiling can discriminate and identify functional groups that exist in metabolites that have been identified using other HIV-metabolomics spectroscopic techniques. These metabolites include lipids, carbohydrates, and proteins. Irregularities in the metabolic pathways involving these molecules have been implicated in the development of adverse metabolic effects in HIV-infected individuals (Butt et al., 2004; Dube et al., 2003; Friis-Moller et al., 2003; John et al., 2001; Koutkia and Grinspoon, 2003; Omech et al., 2012; Vrieskoop et al., 2008).
Carbohydrate, lipid, and protein metabolism
It has been well documented that HIV and antiretroviral treatment results in disruptions of lipid, carbohydrate, amino acid, and protein metabolism in HIVpos ARTpos individuals (Carr et al., 1998; Dube et al., 1997; Duong Van Huyen, 2003; Karamchand et al., 2008; Mulligan et al., 2000). Here, the most significant vibrations were detected in the proteins (1600 cm−1, 1652 cm−1), carbohydrate (1035 cm−1, 1158 cm−1, 1498 cm−1), and lipid/fatty acid (3010 cm−1) spectral regions. These results are in agreement with our previous observations where NMR-based metabolomics identified significant differences in lipids and glucose between HIVpos ARTpos, HIVpos ARTneg, and uninfected controls (Hewer et al., 2006; Philippeos et al., 2009).
In their Multicenter AIDS Cohort study, Brown et al. (2005), using both prevalence and incidence analysis, demonstrated that HIV-positive men on any ART regimen had a four times greater chance of developing diabetes than did their uninfected counterparts, suggesting that metabolites associated with lipid and glucose metabolism are likely biomarkers for discriminating among HIV-infected individuals on various ART regimens.
Elevations of cholesterol increased the risk of heart disease in HIV-positive persons (Friis-Moller et al., 2003). Significant differences in spectral regions (of C-H, CH2, and CH3 vibrations) of both cholesterol and phospholipids were observed here when comparing uninfected controls and HIV-positive individuals. This is suggestive of a relationship between antiretrovirals and changes in cholesterol levels. Because HIV infection and its treatment have been linked to elevated levels of low-density lipoprotein (LDL), data presented here is reason to assume that ATR-FTIR may be developed into a screening mechanism for virus/treatment-induced cardiovascular complications.
When comparing HIVpos ARTneg subjects to HIVpos ARTpos and uninfected controls, distinct differences were observed in the fingerprint region specifically between 665 cm−1–900 cm−1. The HIVpos ARTneg displayed larger differences in this region compared to samples from treated individuals; this is in agreement with Bahmani et al. (2009) who reported significant differences between HIV-infected (untreated) samples and healthy controls in this spectral region. Changes in this region are assigned to vibrations of ArCH, ROH, and RNH2 whose functional groups form part of the structure of the mentioned metabolites.
Possibly confounding factors
In studies involving metabolic changes due to any stimuli, age and gender can potentially be confounding factors, given the effect of these aspects on metabolism. In this study there were differences between age and gender in the three experimental groups, which is why these two factors were considered as class identifiers (Y-vector) in the statistical model (Supplementary Figs. S3 and S4). The age and gender statistical models were different from the original models where HIVpos ARTpos was compared to uninfected control subjects. The age and gender models show that neither age nor gender were confounding factors in the current study.
ATR-FTIR as a metabolomics tool
NMR and MS are the most widely used metabolomics tools, due to advanced levels of sensitivity and specificity. These methods are however very expensive, difficult to access in resource limited settings, and above all, require expert knowledge for instrument operation and data interpretation. The benefits of FTIR spectroscopy over NMR and MS is its lower cost and easier operation. FTIR cannot replace NMR and MS, but given the proven ability of this instrument in detecting and identifying differential metabolites (Ellis et al., 2006), this type of vibrational spectroscopy is capable of providing information in line with that of more sensitive techniques. Results obtained from this study are comparable to our previous findings (Hewer et al., 2006; Philippeos et al., 2009), confirming the ability of FTIR spectroscopy to produce data relatable to that of NMR and MS metabolomics. Also, given its proven ability as a diagnostic tool in other diseases (as highlighted by Dorling and Baker, 2013), ATR-FTIR may find useful application in HIV-metabolomics-based monitoring of disease progression or treatment success following further development and validation of the approach.
In conclusion, differences in the sera of HIV-infected (treated and untreated) individuals and uninfected controls were identified with a mid-ATR-FTIR metabolomics approach. The current study was limited in sample size but provided original insights for novel systems diagnostics for HIV/AIDS. This work has demonstrated the reliability, simplicity, and predictive ability of FTIR-based metabolomics in discriminating between the experimental groups studied in our sample. Future studies with larger subject numbers are warranted to expand upon the present findings.
Footnotes
Acknowledgments
Financial support for this study was received from the Technology Innovation Agency (TIA) and the University of Pretoria.
Author Disclosure Statement
No competing financial interests exists.
Abbreviations Used
References
Supplementary Material
Please find the following supplemental material available below.
For Open Access articles published under a Creative Commons License, all supplemental material carries the same license as the article it is associated with.
For non-Open Access articles published, all supplemental material carries a non-exclusive license, and permission requests for re-use of supplemental material or any part of supplemental material shall be sent directly to the copyright owner as specified in the copyright notice associated with the article.