
Abstract
Abstract
Integrative genomics has the potential to uncover relevant loci, as clinical outcome and response to chemotherapies are most likely not due to a single gene (or data type) but rather a complex relationship involving genetic variation, mRNA, DNA methylation, and copy number variation. In addition to this complexity, many complex phenotypes are thought to be controlled by the interplay of multiple genes within the same molecular pathway or gene set (GS). To address these two challenges, we propose an integrative gene set analysis approach and apply this strategy to a cisplatin (CDDP) pharmacogenomics study involving lymphoblastoid cell lines for which genome-wide SNP and mRNA expression data was collected. Application of the integrative GS analysis implicated the role of the RNA binding and cytoskeletal part GSs. The genes LMNB1 and CENPF, within the cytoskeletal part GS, were functionally validated with siRNA knockdown experiments, where the knockdown of LMNB1 and CENPF resulted in CDDP resistance in multiple cancer cell lines. This study demonstrates the utility of an integrative GS analysis strategy for detecting novel genes associated with response to cancer therapies, moving closer to tailored therapy decisions for cancer patients.
Introduction
P
In addition, clinical outcome and response to cancer therapies is most likely not due to a single gene (or data type) but rather a complex relationship involving genetic variation, mRNA, miRNA, DNA methylation, and copy number variation. Finally, many complex phenotypes are thought to be controlled by the interplay of multiple genes within the same molecular pathway or gene set (GS). Hence, gene set analysis (GSA) has been widely used in the analysis of mRNA and single nucleotide polymorphism (SNP) data as GSA incorporates biological knowledge, reduces the multiple-testing burden, and may increase the association signal (i.e., increasing the power to detect meaningful associations). However, to date there has been little integration of both SNP and mRNA expression data in the context of GSs.
In 2011, Tyekucheva et al (2011) presented the use of two integrative GSA approaches that they refer to as “integrative” or “meta-analytic.” In their “integrative approach,” a gene-level model is fit with both types of genomic data, followed by combining the gene-level scores to evaluate the association with the GS. In contrast, the “meta-analytic” approach computes a GS score for each data type and then combines the scores across the data types, using either the average or the maximum value. They found their “integrative” GSA to be the more powerful approach. However, their approaches only incorporate cis-acting relationships. In contrast to this approach, we propose an approach that takes into account both cis and trans relationships using a similar step-wise approach we have previously used to find novel genes associated with response to therapies (Li et al., 2009; Niu et al., 2010).
To illustrate the method, we applied our integrative GSA approach to a pharmacogenomic study of the platinum agent cisplatin (CDDP) involving the Coriell Human Variation Panel (HVP) lymphoblastoid cell lines (LCLs). Functional analyses were completed for three genes within each of the top two associated GSs, with two genes (LMNB1 and CENPF) functionally validated. The identification and understanding of the role of genomic variation on response to platinum therapies would help clinicians determine optimal treatment plans for cancer patients.
Materials and Methods
Human Variation Panel cell-based model system
Lymphoblastoid cell lines and cytotoxicity assays
Human Variation Panel (HVP) consists of a sample of lymphoblastoid cell lines (LCLs) derived from 100 African American (AA), 100 Caucasian American (CA), and 100 Han Chinese American (HCA) subjects obtained from the Coriell Cell Repository (Camden, NJ). The National Institute of General Medical Sciences obtained and anonymized these cell lines before deposit, and all subjects provided written informed consent for the use of their samples for research purposes. The cytotoxicity assays for CDDP were completed in a similar manner as outlined in Tan et al (2011). The quantitative phenotype IC50 (effective dose that kills 50% of the cells) was estimated using a four-parameter logistic model (Davidian and Giltinan, 1995; Gallant, 1987), followed by application of the Van de Waerden rank transformation. CDDP cytotoxicity experiments were successfully performed for 283 LCLs (96 CA, 91 AA, and 96 HCA LCLs).
Genotypic data
Genotyping of SNPs was completed on the Illumina HumanHap 550K and HumanHap510S for the LCLs at the Genotyping Shared Resources at the Mayo Clinic in Rochester, MN, as previously described (Li et al., 2009; Niu et al., 2010). As part of quality control, SNPs with Hardy-Weinberg equilibrium (HWE) p values <10−6 in one race or 10−4 in all three races (based exact test for HWE (Guo and Thompson, 1992; Wigginton et al., 2005)), minor allele frequency (MAF) <5%, or call rate <95% were removed from analysis, resulting in 852,829 SNPs for GSA.
Expression data
Whole Genome expression data for cell lines was obtained using the Affymetrix U133 plus 2.0 expression array chip (over 54,000 probe sets). The RNA extraction and the expression array assays were performed following the Affymetrix GeneChip® expression technical manual (Affymetrix, Inc., Santa Clara, CA). Description of the expression data and analysis have been previously described by Li et al. (2008) and Niu et al. (2010). The mRNA expression data has been submitted to the Gene Expression Omnibus and can be found at http://www.ncbi.nlm.nih.gov/geo/query/acc.cgi?acc=GSE23120.
Integrative gene set analysis
An overview of the procedure is presented in Figure 1. First, we identify SNP GSs associated with response, using a principal component analysis to determine gene–level associations, and the Gamma Method to aggregate the association of genes within a GS (referred to as the PC-GM approach) (Biernacka et al., 2012). Then, for this set of GSs, we identify mRNA expression GSs associated with the SNP GSs using a method we developed, which we refer to as GS-eQTL (Abo et al., 2012). Finally, we take these identified mRNA GSs and determine their association with the phenotype using a global random effects model (Goeman et al., 2004). In the following sections, we provide additional information on the various analyses methods used in the integrative GSA.
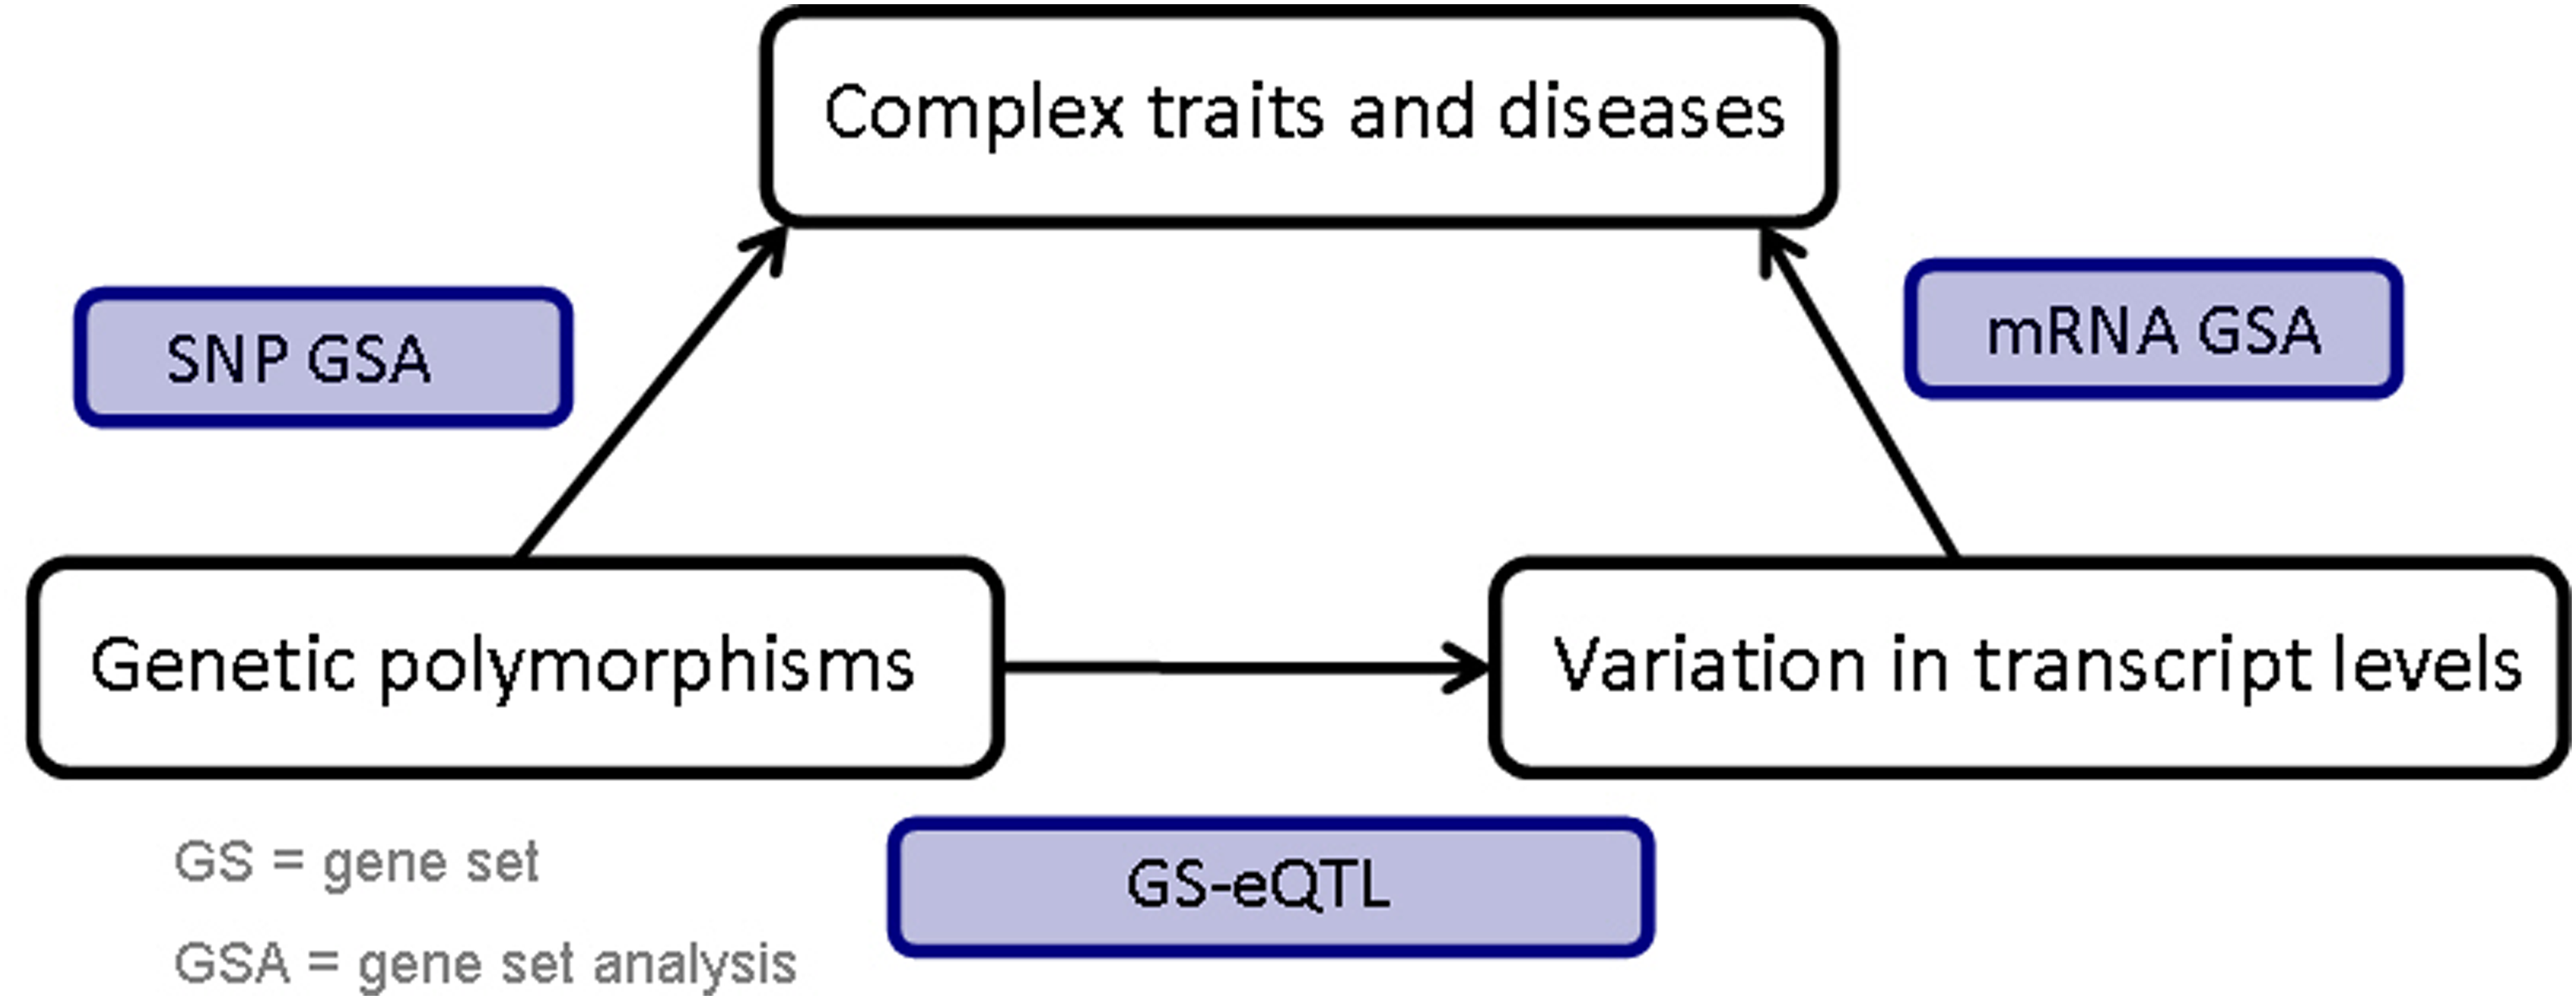
Framework for integrative GSA involving SNP and mRNA expression data.
Gene set analysis for SNP data
For assessing the association of a set of predefined GSs with CDDP IC50 values, we used a self-contained method (Goeman and Buhlmann, 2007). First, SNPs were mapped to genes (±20 KB of first and last exon). These genes were then mapped to GSs from the following sources: Kyoto Encyclopedia of Genes and Genomes (KEGG) (http://www.genome.jp/kegg/) (Kanehisa and Goto, 2000; Kanehisa et al., 2010), the Gene Ontology (GO) project (http://www.geneontology.org/) (Ashburner et al., 2000), and PharmGKB (http://www.pharmgkb.org/) (Eichelbaum et al., 2009; Hewett et al., 2002; Klein et al., 2001). In completing the mapping, SNPs could be mapped to multiple genes, and genes could be mapped to multiple GSs. Once the mapping of SNPs to genes and genes to GSs was completed, GSA was completed using PC-GM approach (Biernacka et al., 2011; Fridley et al., 2012), which uses a principal component analysis (PCA) (Gauderman et al., 2007; Mardia et al., 1979) in combination with the Gamma method (Zaykin et al., 2007). A linear model was used for assessing the association of each gene with CDDP IC50, where the explanatory variables represented the principal components explaining 80% of the genetic variation within the gene. In completing the PCA, genotypes for SNPs within the gene were coded in terms of the number of minor alleles (e.g., 0, 1 or 2). Covariates of sex, race, and eigenvectors from EigenSTRAT (Price et al., 2006) analysis were included in the gene-level analysis.
Following the determination of the gene-level association p values for genes within a GS, these gene-level p values were combined using the Gamma Method (GM) (Zaykin et al., 2007),with soft truncation threshold value (STT) of 0.15. The GM is based on summing transformed p values, similar to Fisher's Method. Simulation studies have shown the PC-GM to be a powerful approach for testing a self-contained GS hypothesis under a variety of genetic models (Biernacka et al., 2011). 10,000 permutations were completed to determine empirical GS p values. To adjust for multiple testing, FDR q-values (Storey, 2002) were computed for each GS.
Gene Set expression quantitative trait analysis (GS-eQTL)
Establishing the association of genetic variation with levels of gene expression is a key component to understand the molecular basis of human traits further, including response to drug therapies. By assessing the relationship between SNPs and gene expression in the context of GSs, we reduce the multiple testing burden. Therefore, for the SNP GSs with genetic variation associated with CDDP IC50, we wish to determine their association with variation in mRNA expression levels in terms of GSs. We refer to this method as gene set eQTL or GS-eQTL (Abo et al., 2012).
First, the mRNA expression probe sets on the Affymetrix U133 plus 2.0 expression array chip were mapped to their respective genes, with multiple probe sets for a gene summarized using the median expression level. These genes were then mapped to GSs in a similar manner as completed for the SNP GSA. We denote GSs involving expression data as GSexpr, while GSs involving genetic variation or SNPs as GSSNP.
The association of genetic variation within GSSNP to the variation within GSexpr was then assessed using a multivariate linear model. For each set of SNPs within the given GS, we performed a PCA. This approach has been applied with success in other GSA methods to produce a lower-dimensional GS (Chai et al., 2009; Tomfohr et al., 2005). In addition, PCA is a commonly used approach for modeling the association of multiple SNPs within a gene, as opposed to GS (Ballard et al., 2010; Gauderman et al., 2007). The design matrix was then constructed using the q components that explain 80% of the variance of the adjusted SNP genotypes (i.e.,
Gene Set analysis of mRNA expression data
To assess the association of GS expression values (GSexp) with CDDP IC50, the self-contained “global model” approach of Goeman et al. (2004) was utilized using the R library “globaltest” (http://bioconductor.org/packages/2.6/bioc/html/globaltest.html). This method has been used successfully in prior pharmacogenomic studies involving the HVP (Fridley et al., 2011) and found to have good power under a variety of genomic models (Fridley et al., 2010). The global modeling approach is based on a linear random effects model in which CDDP IC50 is modeled as a function of the expression values for the genes within the GS. Prior to analysis, the normalized expression data was adjusted for batch/run, gender and race and standardized as previously described (Li et al., 2008; 2009). Empirical p values were computed using Monte Carlo simulations.
Functional validation studies
Functional studies were performed in five human cancer cell lines: A549 (lung adenocarcinoma), CRL5872 (non-small cell lung adenocarcinoma), CRL5823 (variant small cell lung carcinoma), H460 (large cell lung carcinoma), and IGROV1 (ovarian carcinoma). These cell lines were obtained from the American Type Culture Collection (ATCC, Manassas, VA) and were cultured in RPMI 1640 containing 10% FBS. Pools of four specific siRNAs for the candidate genes and negative nontargeting control siRNA pools were purchased from Dharmacon (Chicago, IL). Reverse transfection with siRNA was performed in 96-well plates with cells from these five cell lines, using 0.2 μL of lipofectamine™ RNAi-MAX reagent (Invitrogen, Carlsbad, CA) and siRNA pools at final concentrations of 30 nM for 24 hours. The cells were then treated with a series of concentrations of CDDP. After 72 h, cytotoxicity assays were performed using the CellTiter 96@ AQueous Non-Radioactive Cell Proliferation Assay kit (Promega Corporation, Madison, WI), followed by absorbance measurements at 490 nm in a Safire2 microplate reader (Tecan AG, Switzerland).
Total RNA was isolated from the cultured cells using the Quick-RNA™ MiniPrep kit (Zymo Research, Orange, CA), followed by qRT-PCR performed with the one-step, Brilliant SYBR Green qRT-PCR master mix kit (Stratagene, La Jolla, CA). Specifically, primers purchased from QIAGEN were used to perform qRT-PCR using the ABI StepOne™ Real-Time PCR System (Applied Biosystems, Foster, CA). All experiments were corrected by using beta-actin as an internal control. Cytotoxicity for CDDP in the five cell lines were compared between cells treated with negative control siRNA and gene-specific siRNAs.
Results
Integrative Gene Set Analysis
Mapping of the SNP GWAS data to gene and GSs resulted in 2568 SNP GS (1512, 422, 372 from biological, cellular, and molecular groupings of GO; 201 from KEGG; and 61 from PharmGKB) containing 16,778 genes and 459,275 SNPs. The expression probe sets mapped to 34,266 genes within the 2568 GSs. SNP GSA was completed using the PC-GM approach with STT value of 0.15. This analysis resulted in three GSs evidence of associated with CDDP IC50 values (p≤0.001) (Table 1). These GSs were: detection of abiotic stimulus (p=1.0E-05, 59 genes, 2211 SNPs); positive regulation of catecholamine secretion (p=5.0E-04, 7 genes, 178 SNPs); and negative regulation of heart contraction (p=0.001, 16 genes, 685 SNPs). Of these, only the GS detection of abiotic stimulus, a biological process GS within GO, had a q-value<0.25 (GS q-value=0.02). Next, we assessed the association of the genetic variation within these three GSs with the mRNA gene expression levels for genes within each of the 2568 GSs (i.e., GS-eQTL analysis). This analysis resulted in 93 GS-eQTL associations with p<10−10, where all of these associations involved the genetic variation within the detection of abiotic stimulus GS. Of these 93 GSs, the mRNA expression levels for genes in 36 GSs were associated with CDDP IC50 (p<10−4) (Table 2).
p value ≤0.001.
All GS-eQTL involved the genetic variation within the “Detection of abiotic stimulus” GS.
The top most associated GS was RNA binding (715 genes, RNA binding GSexpr - IC50 p=8.0E-06; detection of abiotic stimulus – RNA binding GS-eQTL p=8.7E-10; detection of abiotic stimulus GSSNP – IC50 p=1.0E-05). RNA binding is a GS within the molecular function set of GSs within Gene Ontology (GO). This GS contains genes which interact selectively and noncovalently with an RNA molecule (http://gowiki.tamu.edu/wiki/index.php/Category:GO:0003723_!_RNA_binding) (June 8, 2012). The second most significant GS was cytoskeletal part (870 genes, cytoskeletal part GSexpr - IC50 p=1.2E-05; detection of abiotic stimulus – cytoskeletal part GS-eQTL p=4.2E-17). The cytoskeletal part is a GS in the cellular component set of GSs within GO that contains genes that play important roles in both intracellular transport and cellular division (http://gowiki.tamu.edu/wiki/index.php/Category:GO:0044430_!_cytoskeletal_part) (June 8, 2012).
Next, for the top two GSs of RNA binding and cytoskeletal part, we assessed the association of mRNA levels for genes within these GSs with CDDP IC50 (Table 3). The top three genes in the RNA binding GS were: HNRNPF (r=−0.283, p=1.34E-06); RNASEH2A (r=−0.282, p=1.38E-06); and SNRPD1 (r=−0.280, p=1.65E-06). The top three genes within the cytoskeletal part GS were: CENPF (r=−0.327, p=1.75E-08); CAMSAP1L1 (r=0.315, p=5.98E-08); and LMNB1 (r=−0.311, p=9.25E-08).
The genes in
Functional Validation for CDDP-related genes
Based on the findings from the integrative genet set analysis involving the cell line model systems, functional validation was attempted for the top three genes within the RNA binding (HNRNPF, RNASEH2A, SNRPD1) and cytoskeletal part (CENPF, CAMSAP1L1, LMNB1) GSs. All studies in the H460 and IGROV1 cell lines showed no effect of the six genes on CDDP response. However, functional studies in the A549, CRL5872, and CRL5823 cell lines showed effect of the genes CAMPSAP1L1, LMNB1, and CENPF on sensitivity to CDDP, which corresponds to the results observed in the integrative GSA in the LCLs (Fig. 2). In particular, we found the effect of LMNB1 to be consistent in all three cell lines, in which knockdown of LMNB1 resulted in CDDP desensitized cells, confirming the GSA results (i.e., no expression of LMNB1 resulted in higher CDDP IC50 value or more resistant cells).
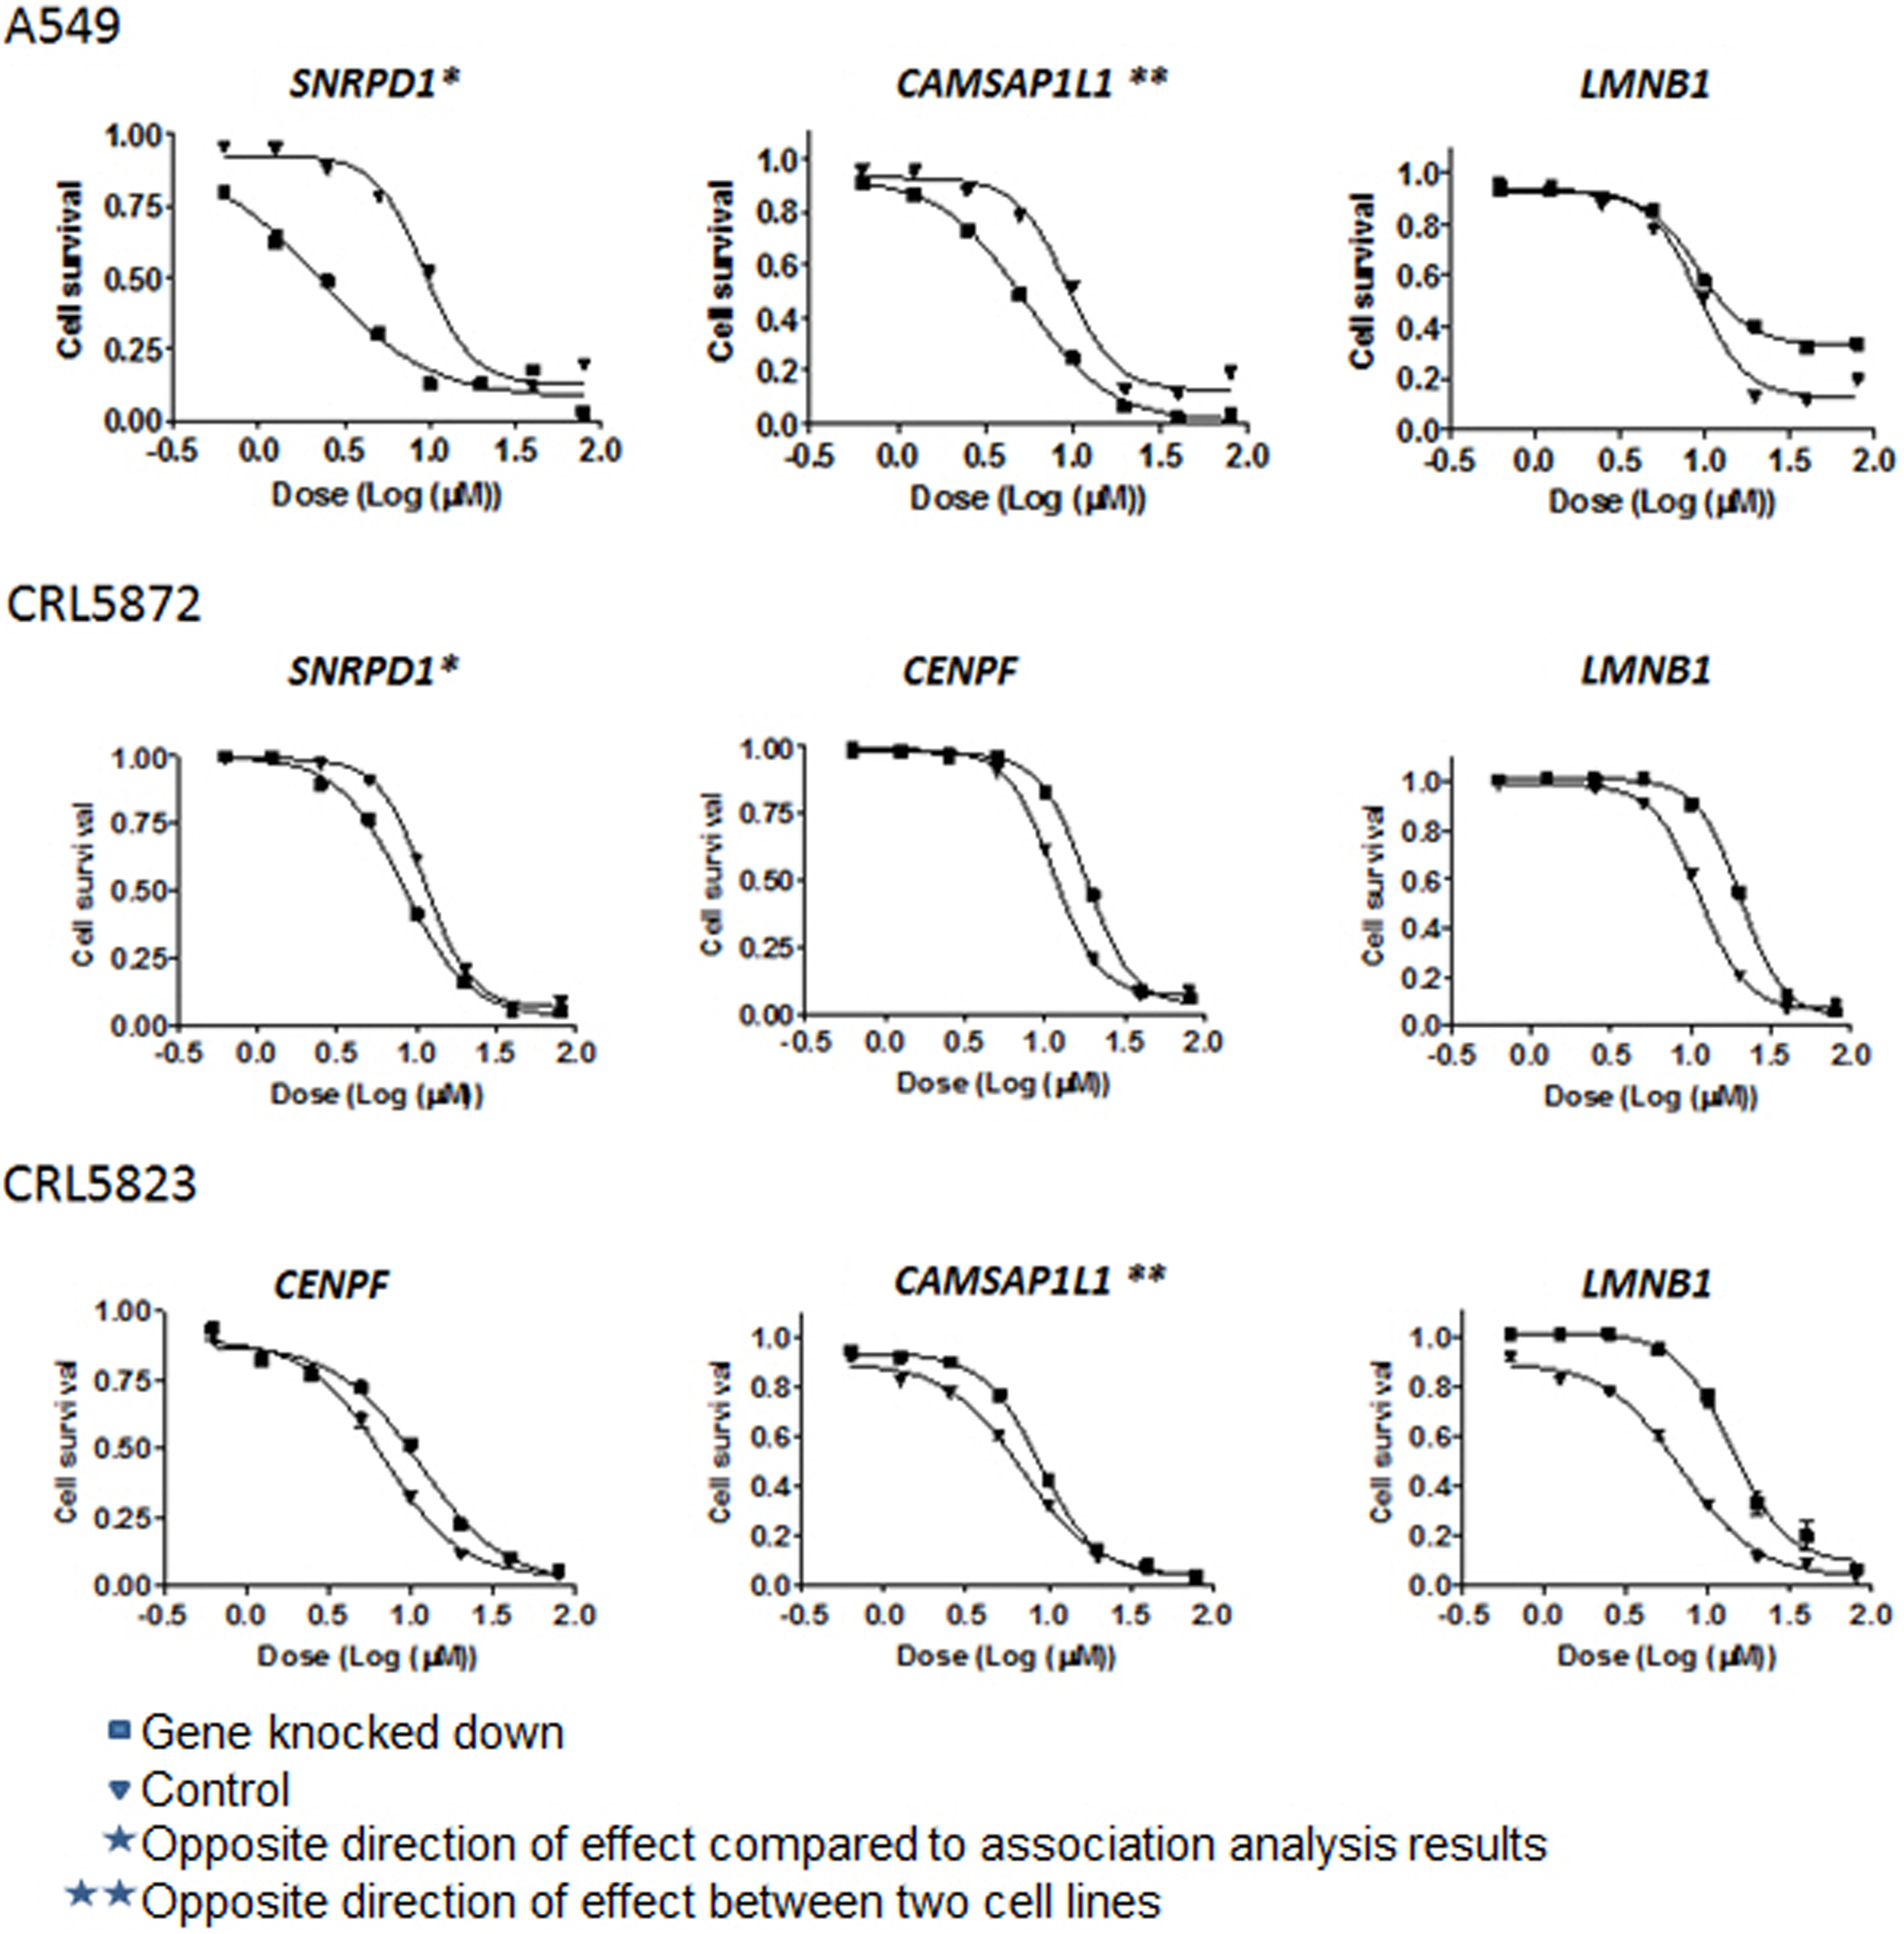
CDDP functional validation in human A549, CRL5872, and CRL5923 cells. siRNA knockdown was performed, followed by drug cytotoxicity for the six selected genes in the top two GSs. Presented are only the results for genes SNRPD1, CAMSAP1L1, LMNB1, and CENPF. A549, CRL5872, and CRL5923 cells were transfected with control siRNA or specific siRNA for the gene of interest. Following 24 h after siRNA transfection, cells were treated with CDDP for an additional 72 h.
Similarly, knockdown of CENPF resulted in cells resistant to CDDP in the CRL5872 and CRL5823 cell lines. However, knockdown of CAMSAP1L1 showed opposite effects in the A549 and CRL5823 cell lines. Knockdown of SNRPD1 showed in the cell lines A549 and CRL5872 rendered cells more sensitive to CDDP. However this relationship contradicts the direction of association observed in the statistical analysis (r=−0.280). The difference in the functional validation of candidate genes might be due to cell-line specificity.
Discussion
In this article, we present a novel approach to integrate SNP, mRNA expression and phenotypic information in the context of GSs to determine novel genomic features related to a complex phenotype (e.g., response to platinum therapy). The proposed approach uses a step-wise GSA approach to integrate multiple types of genomic information, which can also be extended to other types of genomic data, such as methylation or microRNA data. As proof of principle, we applied the proposed integrative GSA approach to a pharmacogenomic study of CDDP involving a cell based model system.
Integrative Gene Set Analysis
As the first step in the integrative GSA, we determined three SNP GSs associated with CDDP drug response using the PC-GM method (Biernacka et al., 2012) (p<0.001). For this set of GSs, we then used a GS-eQTL method (Abo et al., 2012) to determine mRNA expression GSs associated with these SNP GSs (p<10e-10). Finally, for these mRNA GSs we determine their association with CDDP response using a random effects model (Goeman et al., 2004) (p<1e-04). From this integrative GSA, we found 32 expression GSs associated with CDDP response, all associated with the SNP GS “detection of abiotic stimulus”. These mRNA expression GSs included many biologically relevant GSs for CDDP response, a therapy designed to crosslink DNA and interfere with cell division, such as: RNA binding, positive regulation of cell death, cellular response to stress, enzyme binding, metabolic processes, and purine nucleotide binding.
While this integrative GSA has numerous benefits, this type of analysis also has limitations. First, gaps in knowledge may prevent definition of appropriate GSs, and combining a few genes with functional impact on the phenotype with many non-associated genes can lead to loss in power. The fact that GSA assumes that SNPs can be assigned to relevant genes is an important limitation of GSA, particularly in light of the fact that many phenotype-associated SNPs identified to date do not lie in genes. Second, the integrative GSA still fail to account for joint effects that are not due to simple additive (or log-additive) effects of individual SNPs. Methods based on joint modeling of SNP effects could be extended to include assessment of gene–gene interactions. Third, the assessment of statistical significance of the entire integrative testing procedure is not straight forward, with the selection of an arbitrary significance threshold for determining GSs to be carried forward in the step-wise procedure. Therefore, replication and/or functional validation is suggested to confirm association findings from the integrative GSA. However, the results from this study show the usefulness of GSA that integrates both SNP and mRNA variation to determine novel GSs and genes associated with drug response. Further research is needed to build upon the integrative framework presented in this manuscript and to develop other approaches for the integration of multiple types of genomic data in the study of complex traits.
Cisplatin pharmacogenomics
Following the determination of novel GSs involved with CDDP response through the integrative GSA, we selected three genes for functional studies to determine if these genes impact the sensitivity of cancer cell lines to CDDP. Functional validation was attempted for the genes HNRNPF, RNASEH2A, and SNRPD1 in the RNA binding GS and CENPF, CAMSAP1L1, and LMNB1 in the cytoskeletal part GS. The functional studies confirmed the effect of LMNB1 and CENPF. The effect of LMNB1 was consistent in multiple cancer cell lines, in which knockdown of LMNB1 resulted in increased resistance to CDDP. Similarly, knockdown of CENPF also resulted in CDDP resistance in the CRL5872 and CRL5823 cell lines.
LMNB1 is a gene contained within the TNFR1 signaling, caspase cascade in apoptosis, and the breakdown of nuclear lamina pathways, which are involved in cell death, cell cycle, and apoptosis. LMNB1 has been found to be a potential biomarker for early stage liver cancer (Sun et al., 2010) and cancers of the gastrointestinal tract (Moss et al., 1999). Downregulation of LMNB1 has also been implicated in response to DNA-alkylating drugs, 5-fluorouracil, and radiation in pancreatic tumor cells (Kokkinakis et al., 2005). Liu et al. (2012) also found the expression of LMNB1 and CENPF to be associated with hepatocellular carcinoma. CENPF encodes a protein involved in chromosome segregation in mitosis, DNA synthesis, and cell cycle progression. Expression of CENPF has been found to be associated with methotrexate response in the treatment of acute lymphoblastic leukemia (Sorich et al., 2008), head and neck squamous cell carcinomas (de la Guardia et al., 2001), astrocytoma progression (van den Boom et al., 2003), and survival following breast cancer (Campone et al., 2008; Huang et al., 2012). Future research is needed to determine the precise role of LMNB1 and CENPF in response to CDDP and other platinum agents, such as carboplatin.
Conclusions
In conclusion, this research demonstrated the utility of a novel integrative GSA approach to discover two candidate genes, LMNB1 and CENPF, associated with CDDP response. Integrated approaches focusing on comprehensive genomic profiling are crucial for the identification of new drug targets and genes responsible for drug response, and therefore, moving closer to tailored therapy decisions for cancer patients.
Footnotes
Acknowledgments
This research was supported by GM61388, CA140879, GM86689, CA130828, CA138461, CA102701, the Minnesota Partnership, and the Mayo Foundation. The funders had no role in study design, data collection and analysis, decision to publish, or preparation of the manuscript.
Authors' contributions: BLF and RA conceived of the study; BLF, RA, JMB developed the gene set analysis approaches used in the manuscript; RA, GDJ, AB performed the statistical analysis; XT and LW performed the functional validation studies; AMM and LW conducted the cisplatin cytotoxicity studies; BLF drafted the manuscript. All authors read and approved the final manuscript.
Author Disclosure Statement
The authors have no financial conflicts to disclose.