
Abstract
Background:
Transcriptional regulation of gene expression is crucial for the adaptation and survival of bacteria. Regulatory interactions are commonly modeled as Gene Regulatory Networks (GRNs) derived from experiments such as RNA-seq, microarray and ChIP-seq. While the reconstruction of GRNs is fundamental to decipher cellular function, even GRNs of economically important bacteria such as Corynebacterium glutamicum are incomplete.
Materials and Methods:
Here, we analyzed the predictive power of GRNs if used as in silico models for gene expression and investigated the consistency of the C. glutamicum GRN with gene expression data from the GEO database.
Results:
We assessed the consistency of the C. glutamicum GRN using real, as well as simulated, expression data and showed that GRNs alone cannot explain the expression profiles well.
Conclusion:
Our results suggest that more sophisticated mechanisms such as a combination of transcriptional, post-transcriptional regulation and signaling should be taken into consideration when analyzing and constructing GRNs.
Introduction
Bacterial genomes are small and compact; on average, 88% of their genomes consist of coding genes. 1 Consequently, the ability to regulate gene expression in diverse environments is crucial for stabilizing cell homeostasis and adapting to environmental challenges. 2 Computational systems biology uses Gene Regulatory Networks (GRNs) to understand the mechanisms that coordinate the shifts in gene expression and to represent the transcriptional gene regulation of organisms. These networks are consistently expanding our understanding of how the genotype manifests in the phenotype of an organism. Computationally, GRNs are modeled as directed graphs with nodes representing genes and edges or links representing the interactions between regulators, also known as transcription factors (TFs), and their target genes (TGs).3,4
Techniques to measure gene expression levels and infer GRNs include microarrays, 5 ChIP-seq, 6 and RNA-Seq. 7 Microarrays measure the expression levels of known genes through the quantification of the fluorescence emitted by chemically marked complementary DNA attached to a solid surface. Microarrays can also determine the binding site of TFs when combined with chromatin immunoprecipitation.8,9 ChIP-seq is also used to determine the TF binding sites by sequencing DNA fragments that are bound to the TFs during chromatin immunoprecipitation, and is then used to map them to a reference genome. 6 RNA-Seq is used to quantify the entire set of RNA in a biological sample at a particular moment through high-throughput sequencing. 7 Several methods to infer GRNs from such gene expression data have been developed and evaluated10–12 ; these networks are commonly modeled as Boolean and Bayesian networks.13–16 These methods have been applied to reconstruct experimental GRNs and have resulted in multiple databases and online platforms for the analysis of model organisms. Such resources include RegulonDB, 17 Subtiwiki, 18 CoryneRegNet, 19 and Abasy Atlas, 20 for Escherichia coli, Bacillus subtilis, Corynebacterium glutamicum, and several organisms, respectively. Previous evaluations of gene expression-based methods to infer GRNs demonstrated a moderate performance on experimental microarray data and a better performance on in silico-generated gene expression data.10,11 Inference methods developed for both bulk and single-cell data were evaluated with single-cell transcriptomic data, and reached the conclusion that the algorithms performed poorly using both experimental or in silico-generated data.21,22
Despite the importance of GRNs and the low performance of GRN inference methods, few studies systematically evaluated the consistency of these networks with gene expression data. In 2003, Gutiérrez-Ríos et al. 23 assessed the consistency of the E. coli GRN in a few well-studied genes. Later, Siegel et al. 24 developed a mathematical framework evaluating the consistency in interaction graphs; they used an in silico experiment derived from experimental literature data of gene and metabolic networks to test their approach. Based on this framework, Guziolowski et al. 25 analyzed the consistency of the E. coli GRN using three independent microarray datasets and ascertained the inconsistency of the network. Guziolowski et al. developed BioQuali, 26 a Cytoscape app for detecting inconsistencies in GRNs and suggesting changes that would restore the network consistency with the user-provided expression data. Other Cytoscape apps such as contradictions in microarrays, 27 CytoASP, 28 and SigNetTrainer 29 assess the consistency of interaction networks and expression data from a single study. The first makes use of Boolean network models to detect inconsistencies in interaction networks. CytoASP 28 uses logical roles through Answering Set Programming to identify inconsistencies and to suggest how to repair them. SigNetTrainer 29 uses Integer Linear Programming to detect and remove inconsistencies from the networks. Collectively, these pioneer works allowed researchers to evaluate the consistency of the existing GRNs and their gene expression data. Furthermore, some of them pointed to the inconsistency of the GRNs, or gene sets, when evaluated with small sets of regulatory data.
Recently, Larsen et al. 30 studied E. coli GRNs and found that they are inconsistent when evaluated with gene expression data. The authors used a conservative sign consistency approach on a large microarray data compendium. Here, we analyzed the consistency of C. glutamicum GRN using a similar approach and also included RNA-seq gene expression data to obtain an exhaustive data compendium. In general, we assume that activations should increase the expression of the TGs when the TF is upregulated. Likewise, repressions should reduce the TGs’ expression, when the TF is also upregulated. Our results show a positive correlation in both cases, contradicting our current understanding of the role of TF regulation. The consistency model assessment indicates that the C. glutamicum GRN is even less consistent than random GRNs, implying both that additional research is needed to further refine GRNs and additional factors have to be considered to explain gene expression.
Materials and Methods
C. glutamicum GRN and gene expression data
The experimental GRN of C. glutamicum was downloaded from CoryneRegNet 7.0. 19 The gene expression compendium was retrieved from Gene Expression Omnibus (GEO) 31 and consisted of microarray and RNA-seq data with a total of 429 samples (see Supplementary Data S1 for more information about the datasets).
Gene expression data normalization
All gene expression datasets were normalized using limma. 32 Microarray data were background corrected before applying lowess (two-color microarrays) and quantile normalization. Similarly, RNA-seq data were quantile normalized using the voom method. 33 Finally, to have all the data on the same scale, we combined and z-score normalized all gene expression data using the survJamda package. 34 The z-normalized distribution of the expression data is given in Supplementary Figure S1.
In silico data generation
The in silico GRN and gene expression data were generated using GeneNetWeaver. 35 This software uses an experimental network as the model to create an in silico network with similar topology and to simulate gene expression data for the novel network.
Inconsistency detection and assessment
We used the same method applied by Larsen et al. 30 to assess E. coli GRN. In the first step, the method identifies genes that are up- or downregulated in each experiment (contrasts). This is performed by computing the contrasts as the difference between the expression of the reference and the case(s) in the experiment. Next, it uses a conservative sign consistency model similar to the one applied in COMA 27 and BioQuali. 26 For each contrast, the model labels the vertices as: upregulated, downregulated, or unchanged. The labels are attributed based on the expression differences between the control and each case in the contrast, and on a threshold _t_. Then the labels are compared with the role of the regulatory interactions in the GRN to determine the consistency. Finally, we compared the experimental network with random data by applying two perturbation methods. The first method shuffles the expression profiles and keeps the network topology, whereas the second shuffles the network topology and keeps the node degrees and gene expression profiles. For more details about this method, refer to the work from Larsen et al. 30
Statistical analyses
The mean correlation (mc) was calculated by first adding the correlation of each TF and TG/operon pair (cPairs), and then dividing the sum by the total number of pairs (nPairs).
This same process was applied to compute the means for Pearson's and Spearman's correlation. We computed the mean of the global inconsistency load (mGlobal) of the two applied perturbation methods by adding the global inconsistency load (global) of each iteration and then dividing the sum by the number of iterations (nIteration).
We determined the mean edge inconsistency (mEdge) through the sum of the number of inconsistencies of each TF and TG/operon pair (nIncons), which we then divided by the total number of pairs (nPairs).
The significance of the comparison between the inconsistency load in contrasts with and without perturbation was computed using the Mann–Whitney U-test. 36 We used the same test to compute the significance of the number of up- or downregulated genes in each contrast, with and without perturbation.
Results
Correlation between gene regulatory interactions and gene expression profiles
To assess the correlation between expression profiles of known regulatory interactions (e.g., a TF regulating a TG), we applied Pearson's correlation coefficient (Fig. 1). We analyzed the distribution of correlations between known TF–TG pairs and of all possible TF–TG pairs. The mean correlation of known TF–TG pairs is 0.09, whereas for all the possible TF–TG pairs it is −0.0003 (Fig. 1A). For activations, we expect a positive correlation (e.g., increased TF expression enhances TG expression), whereas repressions should result in a negative correlation (e.g., increased TF expression reduces TG expression). However, separately analyzing the distribution of the correlations of known TF–TG pairs by interaction role, we see a very low mean correlation in both cases: 0.11 for activating interactions and to 0.07 for repressing interactions. Complex regulations where multiple TFs control the same TG could influence the results observed in Figure 1B. Taking this into account, we also analyzed the TF–TG pairs where the TG is regulated by a single TF (Fig. 1C). Of interest, the results are similar (0.10 and 0.04 for activating and repressing interactions, respectively).
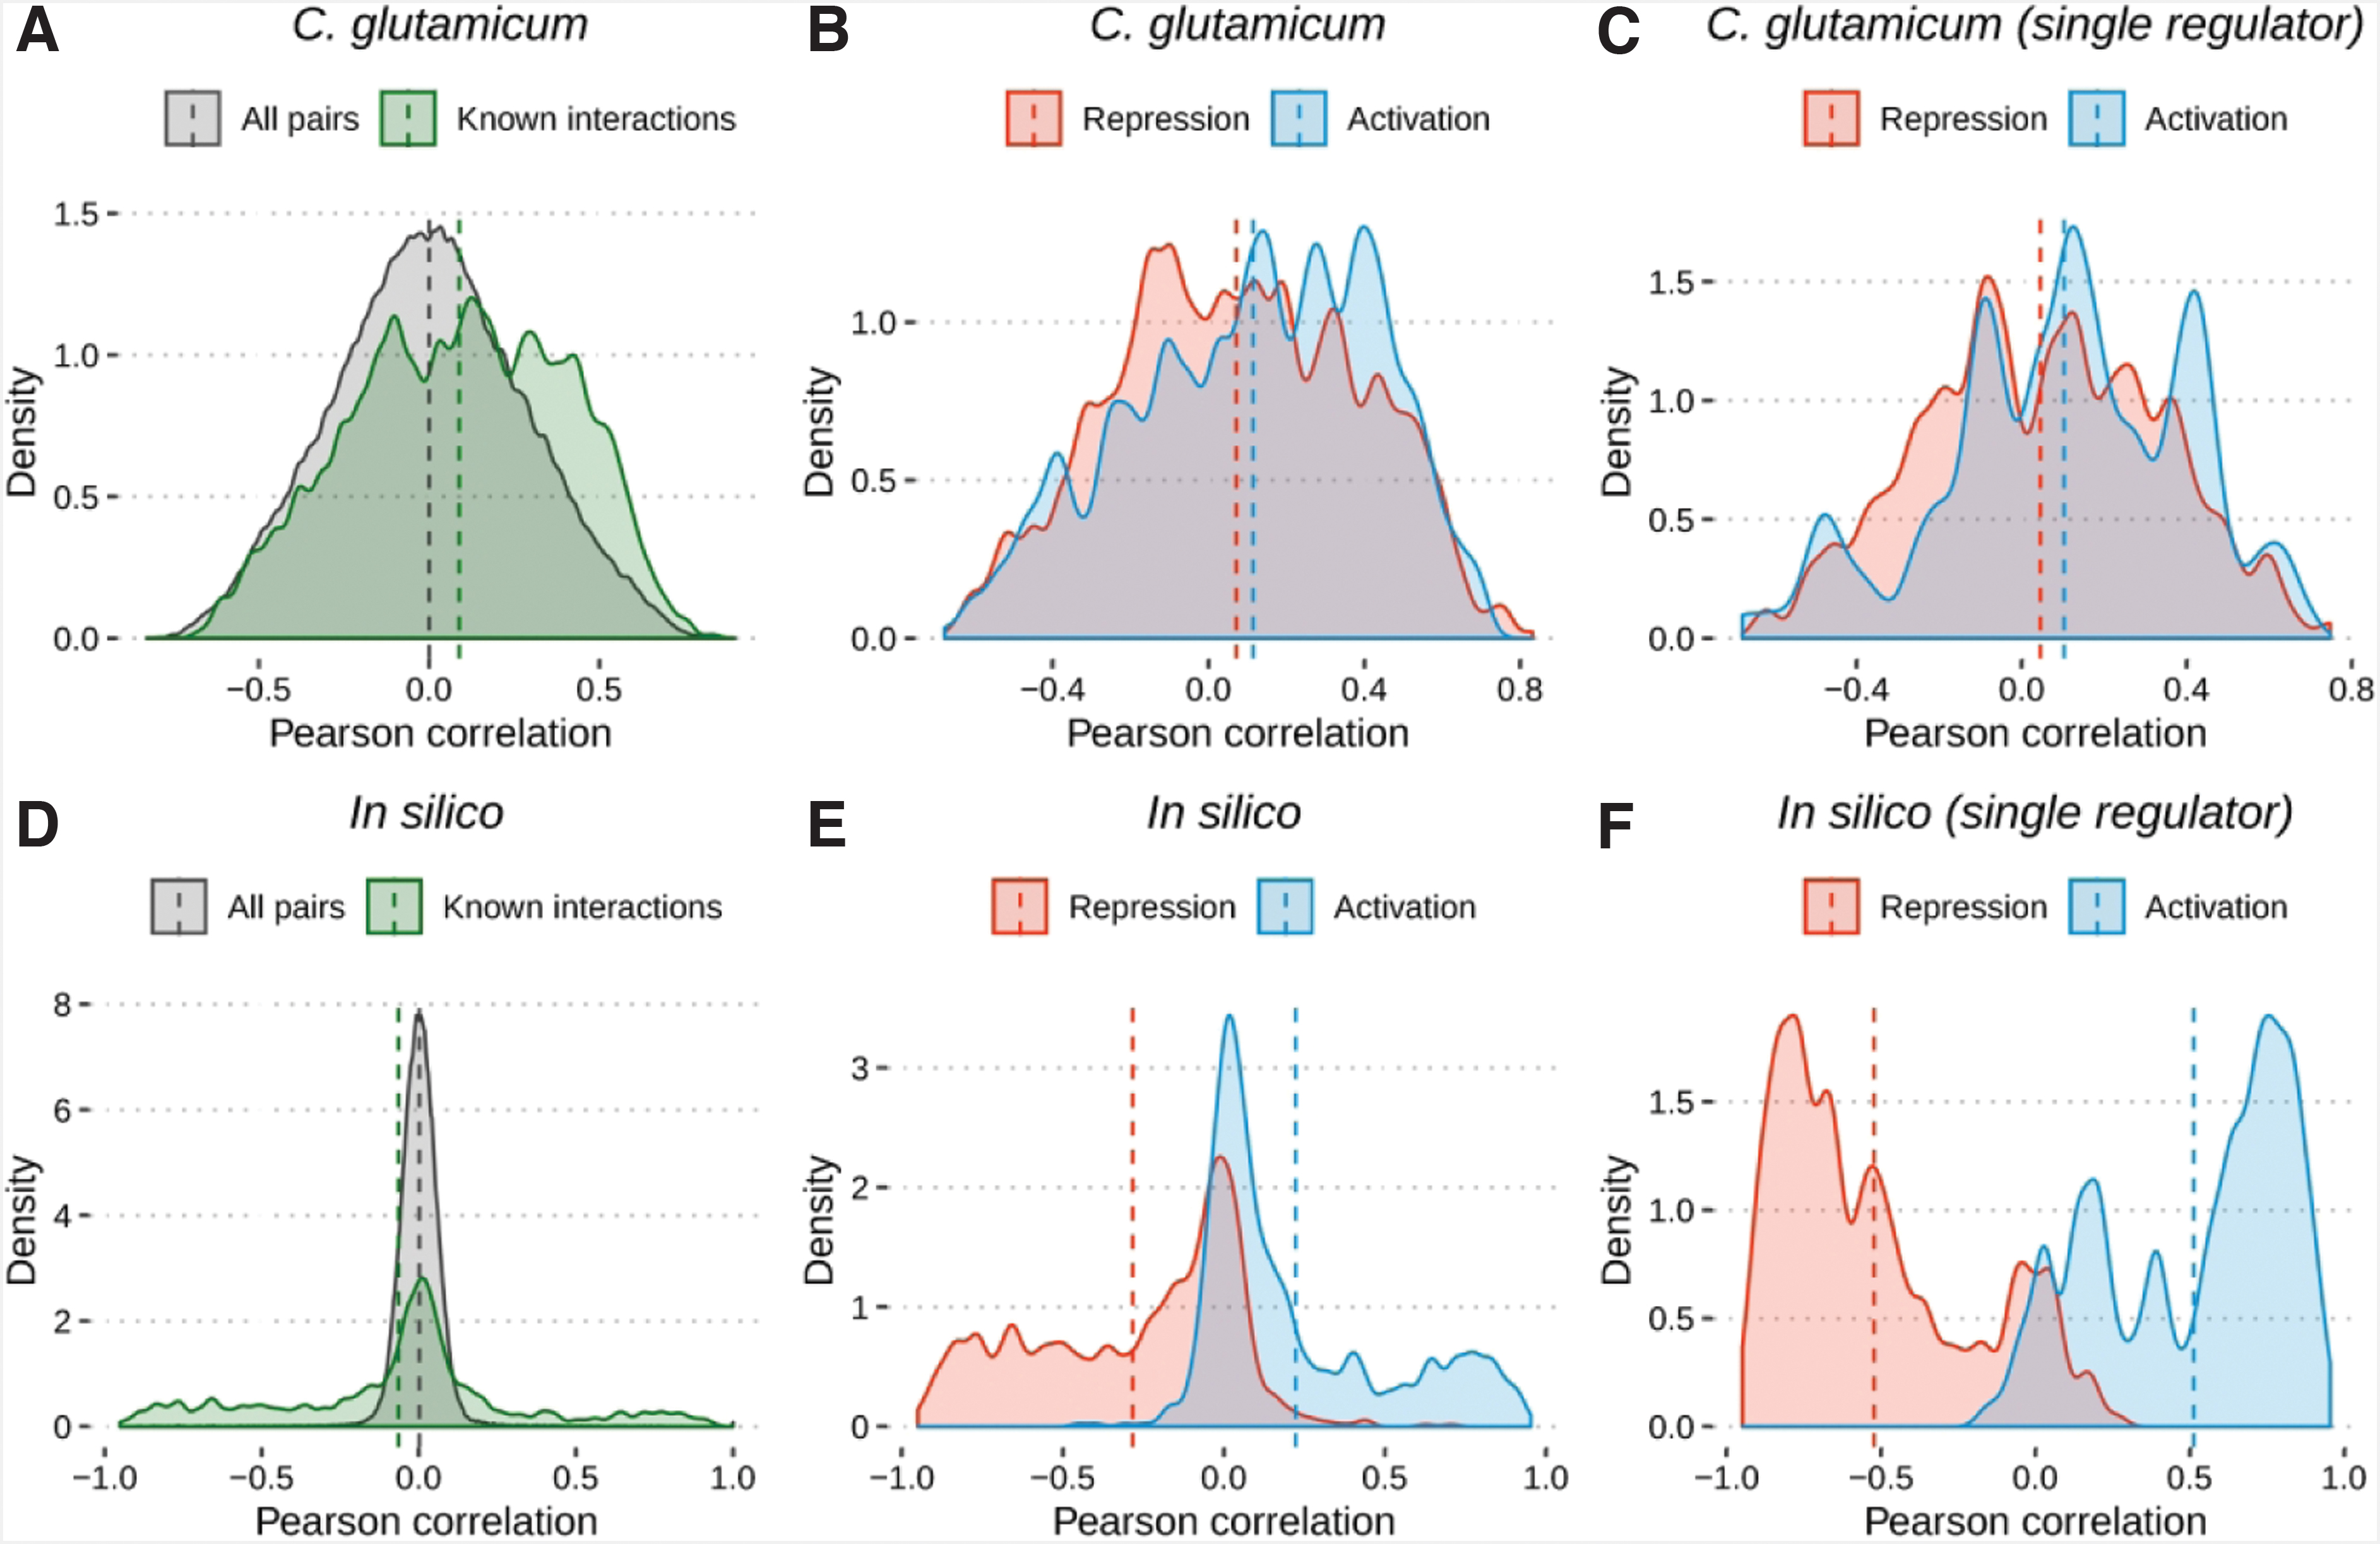
Distribution of Pearson correlation for TF and TG/operon pairs. Comparison between the correlation of all possible TF–TG pairs and all known TF–TG pairs. [
The same process was repeated using an in silico network and gene expression data to demonstrate the extent of the correlations expected from a GRN that is consistent with the observed expression data. The in silico data were generated based on the C. glutamicum GRN using GeneNetWeaver. 35
The mean correlation of known interactions was −0.06 and the mean correlation of all possible TF–TG pairs was 0.002 (Fig. 1D). The correlation of the interactions (Fig. 1E) separated by the interaction role presented a distinct partition between them: the mean correlation was 0.22 and −0.28 for activation and repression interactions, respectively (Fig. 1E). Upon analyzing only the single regulators, an even stronger separation between them was noticed: mean 0.51 and −0.52 for activation and repression interactions, respectively (Fig. 1F).
Consistency assessment between the regulatory networks and the expression profiles
To assess the consistency between the GRN and gene expression, the model we applied makes use of a threshold. Our threshold considers any changes in the expression data (upregulation, downregulation, or unchanged) and assumes ∼50% of the contrasts to be up- or downregulated, as previously explained by Larsen et al. 30 This resulted in a threshold of ±0.25 for the experimental data and ±0.82 for the in silico data. We compared the global inconsistency load of the experimental and in silico GRNs against randomly perturbed GRNs and expression profiles. The global inconsistency load (Fig. 2A) of the experimental network (31,922 inconsistencies) was higher than the mean of the perturbed data (31,030.30 and 31,733.00 inconsistencies in swapped edges and swapped expression profiles, respectively). These numbers indicate that the consistency between the experimental network and the expression data are not more significant than the consistency in the random networks. In contrast, the original in silico network (Fig. 2D) had fewer inconsistencies (20,538) than the mean of the perturbed data (34,133.40 and 33,180.00 in swapped edges and swapped expression profiles, respectively).

Evaluation of the inconsistency load in the GRN and perturbed GRN models. Comparison among the global inconsistency load (total number of inconsistent cases) in the GRNs with two random GRN models. The experiments were repeated 200 times for the random models [
Analyzing the edge inconsistencies separated by the interaction role revealed that the number of inconsistencies was larger for repressions (mean 64.8) than for activations (mean 49.7; Fig. 2B). The analysis of single regulators presented similar results, but slightly larger means (mean 66.1 and 51.3 for repressions and activations, respectively) in both cases (Fig. 2C). For the in silico data, the inconsistencies separated by the interaction role (Fig. 2E) presented similar numbers in both cases (mean of 49.5 and 53.4 for repressions and activations, respectively). The results for single regulators (Fig. 2F) were smaller and even more similar (mean 37.7 and 37 for repressions and activations, respectively).
Association between inconsistency load in contrast with and without perturbation
To check if perturbed experiments result in a higher level of inconsistencies, we analyzed the inconsistency load across the cases in each experiment, resulting in 239 contrasts. It resulted in a range from 5 to 306 inconsistencies with a mean of 133.56 (Fig. 3A). The number of inconsistencies was slightly more substantial in the contrasts with perturbed conditions than with the unperturbed ones (means of 145.31 and 127.88, respectively; Fig. 3B). Perturbed conditions in the experimental gene expression profiles include stress, overexpressed genes, knockout, and double-knockout genes. Genes considered to be up- or downregulated are associated with a higher level of inconsistencies in the network (Fig. 3C). Finally, a higher number of genes on average were considered up- or downregulated within the perturbed contrasts (Fig. 3D).

Evaluation of the inconsistency load of Corynebacterium glutamicum across contrasts. Distribution of the number of inconsistencies across the 239 contrasts
Discussion
In this work, we applied microarray and RNA-seq data to investigate the widely accepted assumption in which changes in the expression of gene regulators affect the expression of their TGs. The regulation type (activation or repression) determines the effect of expression changes. Of interest, our results show that this is not the case for C. glutamicum, particularly at the transcriptional level. We found a positive mean correlation between the TFs and the TGs, even for repression interactions, which are supposed to have a negative correlation. When multiple TFs regulate the same TG, we cannot expect all regulations to be consistent. However, when analyzing the TGs that are regulated by a single regulator, a positive mean correlation between the TFs and the TGs was also observed. Larsen et al. found a similar behavior in the E. coli GRN 30 ; considering it is more complete than C. glutamicum GRN, 37 it is not surprising that C. glutamicum GRN is also not consistent with its expression data. Pearson's correlation analysis may not identify nonlinear relationships between the expression of TFs and TGs. We, thus, also applied Spearman's rank correlation (Supplementary Fig. S2) and observed a slightly positive interaction when analyzing, first, all known interactions at once (mean correlation of 0.09), then those split by interaction role (activations and repressions, mean correlation of 0.12 and 0.08, respectively) and, finally, for single regulators (mean correlation of 0.11 and 0.05 for activations and repressions, respectively). It demonstrates that nonlinearity does not affect our results.
The analysis of the global inconsistency load (Fig. 2A) shows that the experimental network is slightly more inconsistent than the perturbed ones. This may imply that the experimental GRN is not explained by the expression data retrieved from the GEO database. Because the chosen threshold could have influenced these results, we repeated the analysis using thresholds that consider ∼33% and ∼66% of the contrasts as up- or downregulated, as previously suggested by Larsen et al., 30 with no noticeable effect on the inconsistency between the GRN and the gene expression data (Supplementary Figs. S3–S6). Supplementary Figures S7–S9 demonstrate that network perturbation increases the global inconsistency of the in silico network while it has little effect on C. glutamicum GRN.
The high inconsistency between the C. glutamicum network and the expression data may be owing to technical or biological reasons. For example, the methods used to generate the GRNs from the experimental data may have performed poorly.10,11,21,22 Another explanation may be the unavailability of adequate time-series experimental data, which would reveal regulatory interactions at different time points. 38 In addition, other regulatory mechanisms such as post-translational modifications,39,40 inactive conformation of the TFs and metabolites 23 are neither identified by microarrays nor by RNA-seq data. Moreover, a low correlation between transcriptome and proteome data exists.41,42
Conclusion
Our results corroborate previous studies that analyzed the consistency between E. coli GRN and gene expression data, and further showed that, when considering the static GRN, the networks are inconsistent.23,25,30 These results suggest that the traditional methods to reconstruct GRNs may not be able to fully represent the complexity of gene expression regulation. In the case of C. glutamicum, an accurate and consistent GRN is essential for the development of various robust strains that are required to meet its industrial demand in the production of biomolecules, such as amino acids. 43 Although the accurate construction of C. glutamicum GRNs may provide an understanding of possible biosynthetic routes for these molecules, the inconsistency of GRNs and gene expression data suggest that extra caution should still prevail when using GRNs to elucidate probable amino acid biosynthetic routes in the biotechnology industry.
In our view, the incorporation of multi-omics time-series data and robust statistical approaches, as well as the performance of multiple perturbations within biological systems, are necessary to model the GRNs accurately. Moreover, a single GRN may not be adequate to capture the regulatory landscape across all possible conditions, requiring the development of condition-specific and dynamic GRNs in the future.
Footnotes
Authors’ Contributions
Disclaimer
The article has been submitted solely to this Journal and is not published, in press, or submitted elsewhere.
Availability of Data and Materials
All data used in this work are publicly available on the GEO database (https://www.ncbi.nlm.nih.gov/geo). See Supplementary Table S1 in ![]() for more details.
for more details.
Author Disclosure Statement
No competing financial interests exist.
Funding Information
J.B. is grateful for support from H2020 grant RepoTrial (No. 777111) and his VILLUM Young Investigator grant (No. 13154). D.P. received support from CAPES (No. 88887.364607/2019-00) and M.T.D.P. from CNPq (No. 201336/2018-9), for their work at TUM in Germany. M.T.D.P.'s work was also supported by the German Research Foundation (under SFB924). ![]() . is grateful for support from his CNPq Research Productivity grant (No. 305093/2015-0), CNPq Universal grant (No. 405233/2016-7) and FAPEMIG grant (No. APQ 02600-17). This study was financed in part by the Coordenação de Aperfeiçoamento de Pessoal de Nível Superior—Brasil (CAPES)—Finance Code 001.
. is grateful for support from his CNPq Research Productivity grant (No. 305093/2015-0), CNPq Universal grant (No. 405233/2016-7) and FAPEMIG grant (No. APQ 02600-17). This study was financed in part by the Coordenação de Aperfeiçoamento de Pessoal de Nível Superior—Brasil (CAPES)—Finance Code 001.
Abbreviations Used
References
Supplementary Material
Please find the following supplemental material available below.
For Open Access articles published under a Creative Commons License, all supplemental material carries the same license as the article it is associated with.
For non-Open Access articles published, all supplemental material carries a non-exclusive license, and permission requests for re-use of supplemental material or any part of supplemental material shall be sent directly to the copyright owner as specified in the copyright notice associated with the article.