
Abstract
Circulating biomarkers might improve the prediction of outcomes in patients with traumatic brain injury (TBI) beyond current approaches. Robust and up-to-date evidence is required to support their clinical utility and integration into medical practice to guide decision-making. Our objective was to critically appraise the existing evidence for six core blood-based TBI biomarkers (S100 calcium-binding protein B, glial fibrillary acidic protein [GFAP], neuron-specific enolase, ubiquitin C-terminal hydrolase-L1 [UCH-L1], tau and neurofilament proteins), in predicting outcome after TBI. Electronic databases, including Medline and Embase, were searched for articles published from their inception to October 2023. Studies were included if they evaluated the accuracy of blood biomarker concentrations at hospital presentation for outcome prediction in adult patients with TBI. Outcomes assessed were mortality, Glasgow Outcome Scale (GOS)/GOS extended (GOS-E), or the Rivermead Post-Concussion Symptoms Questionnaire (RPQ). Study selection, data extraction, and quality assessment using the modified Quality Assessment of Prognostic Accuracy Studies tool were performed by two authors independently, with disagreements being resolved through discussion or arbitration. If appropriate, a meta-analysis was conducted by calculating the weighted summary area under the curve (AUC) and using a bivariate regression model. Of 12,792 retrieved records, 32 articles, including 7481 patients with TBI, were selected as relevant. Two biomarkers showed strong associations with in-hospital and 6-month mortality: GFAP (unadjusted pooled AUC 0.81 [95% confidence interval [CI] 0.75–0.87] and 0.82 [0.80–0.85], respectively) and UCH-L1 (0.80 [0.74–0.85] and 0.83 [0.77–0.88]). Their addition to models that included established risk factors consistently improved the predictive value, though models and performance varied substantially across studies. In four studies measuring both markers, UCH-L1 outperformed GFAP in improving risk stratification when added to established prediction models. At ∼1.5 ng/mL (five studies), the summary sensitivity of GFAP for predicting mortality was 78% (95% CI 67–85%), and the summary specificity was 79% (95% CI 64–89%). The other assessed biomarkers had fair to good performance in mortality prediction with unclear added benefits. Neurofilament light (NfL) (three studies) demonstrated the strongest association in predicting a 6-month poor outcome (GOS-E ≤4; GOS ≤3) (unadjusted pooled AUC 0.81 [95% CI 0.75–0.87]), whereas the other assessed biomarkers had a fair performance with unclear or irrelevant added value. All core biomarkers had only marginal or no association with incomplete recovery and post-concussion symptoms/syndrome, as assessed by RPQ. Serious problems were found in the design and analysis of many of the studies. We conclude that admission measurements of core blood TBI biomarkers, in particular GFAP and UCH-L1, are strongly associated with mortality. There remains little evidence that any of these markers are ready for clinical implementation for prognostic purposes. Future work focused on the intended use and applying unbiased rigorous analysis methods is necessary to demonstrate that the biomarker test results are “prognostically actionable.”
Introduction
Traumatic brain injury (TBI) is a leading cause of death and disability worldwide, 1 –4 with more than 69 million new cases estimated to occur annually. 5,6 Despite recent improvements in clinical management, up to 40% of patients with severe TBI (Glasgow Coma Scale [GCS] 3–8) and up to 8% of those with mild TBI (GCS 13–15) will die. 7 –9 Epidemiological evidence shows that most survivors face physical, psychiatric, emotional, or cognitive disabilities, which may persist lifelong with no therapeutic options disrupting their lives and with wide-ranging consequences for families, health care systems, and society. 6,10 Moreover, an increased long-term mortality risk, accelerated brain atrophy, and neurodegenerative diseases have been linked to TBI. 11 –14
Accurate and timely identification of individuals at high risk for adverse outcomes would be of paramount importance in clinical practice to inform patients and their relatives, to improve personalized care, and to optimize the design of clinical trials. 15 While prognostic models exist, they explain only 35% of outcome variance in moderate-to-severe TBI and perform poorly for mild TBI. 16 –20 These drawbacks could be addressed by the use of sensitive and specific blood-based biomarkers yielding complementary prognostic information and providing insight into the pathobiology of TBI.
During the past 15 years, six core blood-based TBI biomarkers, namely S100 calcium-binding protein B (S100B), glial fibrillary acidic protein (GFAP), neuron-specific enolase (NSE), ubiquitin C-terminal hydrolase-L1 (UCH-L1), tau and neurofilament proteins (NFs), have emerged as potential strong diagnostic candidates, 21,22 also showing promise in reflecting distinct types of damage and pathophysiological mechanisms. 23 –28 However, it is currently unknown how to best leverage these markers to improve the prediction of outcomes after TBI in clinical practice, especially for milder outcomes.
This review, part of the Collaborative European NeuroTrauma Effectiveness Research (CENTER-TBI) project (www.center-tbi.eu), systematically appraises the evidence on the prognostic value of these protein biomarkers and aims to provide a comprehensive, robust, and updated summary to inform the development of clinically actionable recommendations. It also presents a solid framework upon which to base future primary prognostic factor research in TBI, maximizing our chances for success in identifying clinically useful prognostic markers or biomarker combinations capable of improving medical decision-making beyond current approaches.
Methods
Design
Our research question was developed based on the Population, Index intervention, Comparison, Outcome, Timing, and Setting (PICOTS) research framework (Box 1). This review was carried out following a predefined protocol (PROSPERO CRD42016048189), and the study design adheres to the methodological guidelines of the PROGnosis RESearch Strategy (PROGRESS) Framework (prognostic factor research) 15,29 with reporting based on preferred reporting items for systematic reviews and meta-analyses (PRISMA) and reporting recommendations for tumor marker prognostic studies (REMARK) recommendations. 30,31 As a living systematic review (LSR), we will monitor new TBI biomarker research on an ongoing basis and will update the LSR periodically as new relevant evidence becomes available. 32,33 Updates may occur up to years from the date of original publication and significant changes in evidence will be highlighted for readers in the most updated version. This novel approach is part of a collaborative effort between CENTER-TBI and the Journal of Neurotrauma.
PICOTS framework applied to the research question “Predictive value of blood–brain injury biomarkers for prognosis in adult patients with TBI”
There is currently insufficient evidence to support the clinical utility of protein biomarkers as prognostic factors in the clinical management of patients with TBI.
Clinical interpretation of biomarker studies is hindered by poor design, analysis, and reporting. Moreover, data-driven approaches together with the fact that superiority over standard risk factors is usually not demonstrated convey overoptimistic impressions of prognostic values.
Large, international multicenter studies generating high-quality data suitable for evidence-to-decision procedures are needed to assess the benefits of using biomarkers in clinical practice and to serve clinical decision-making.
Investigators conducting and reporting primary studies
Study design must thoroughly match the clinical question with a focus on the intended use and demonstrate the clinical utility of the biomarkers beyond the existing standard of care-based prognostic factors and models.
Publication of study protocols and prespecified statistical analytic protocols will improve the quality of prognostic biomarker research and prevent biases in the study results.
Analytical aspects of the biomarker assays to establish the performance of the methods used should be properly reported. In particular, details on the precision (e.g., intra-run, inter-run, and lot-to-lot variability), accuracy (e.g., linearity), limits of quantification, dynamic range, and stability data should be made available.
Both significant and non-significant results should be presented with adjustments for a standard of care-based prognostic factors and models to assess incremental value.
Data-driven selection of cutoff values is prone to overestimation of the prognostic value of a biomarker. Biomarkers should be assessed as quantitative continuous measurements rather than categorized.
Effective collaboration between international research groups is required to conduct studies in large TBI populations and to achieve consistency and harmonization in study conduct and reporting (i.e., analytical approaches, cutoff levels, outcome assessment, and adjustment factors). This is fundamental to establishing how existing markers can be most effectively used in real-world settings.
Prospective rigorous validation in independent populations and also in minority groups, addressing reproducibility is needed before clinical implementation.
Patient involvement in study conceptualization is advisable. After the demonstration of the biomarker’s clinical effectiveness, economic evaluation (implementation costs) and evaluation of likely psychosocial impact are required.
A taxonomy of prognostic biomarker research enabling indexing (“tagged”) facilitating the identification of prognostic biomarker studies should be implemented and the creation of a prognostic biomarker study registry is advisable.
Reviewers should require unadjusted and adjusted biomarker associations to be estimated and reported. A predefined list of prognostic adjustment factors/models that are routinely used for the outcome of interest should be identified and serve as the reference for comparing prognostic biomarker values.
Further reviewers’ requirements should include standardization of the estimates (i.e., same scale and direction), details of handling missing data and attrition (loss to follow-up), the analyses and reasons for dropout, thorough information on the analytical and statistical analysis methods and the final prognostic model(s).
Editors should encourage transparent reporting, also of so-called “negative” studies to counteract publication bias.
Central repositories for individual patient data (IPD) or federated data ecosystems adopting standard methods for biomarker data formatting, definition, and collection enabling prospective harmonization and IPD meta-analyses should be created.
Search strategy
We searched Ovid MEDLINE®, OVID Embase, OVID Evidence-Based Medicine Reviews, and Cochrane Library from their inception dates to October 2023 for relevant studies. In collaboration with a search specialist, we developed search strategies specific to each database using validated combinations of terms for TBI studies and broad keywords and indexing terms for biomarkers (see Supplementary Appendix A1).
For possible ongoing trials and studies, we also searched the WHO International Clinical Trials Registry Platform and ClinicalTrials.gov registry and examined reference lists of all relevant publications including narratives and systematic reviews, and abstracts from scientific meetings.
Study selection
Citations were managed with Endnote (version X9, Thomson Reuters, Toronto, Canada) and uploaded into a web-based systematic review program (Covidence, Australia) (http://www.covidence.org/).
Two reviewers (K.A. and S.M.) independently screened titles and abstracts, followed by a full-text review of retained articles. Disagreements were resolved through discussion, or where necessary, arbitration by a third party (E.C.).
We included prospective observational studies and randomized controlled trials that investigated the prognostic value of the circulating biomarkers of interest—S100B, GFAP, NSE, UCH-L1, tau, and NFs—at hospital presentation in adult patients with TBI. Eligible studies had to report at least one outcome of interest (mortality, Glasgow outcome score [Glasgow Outcome Scale [GOS], or extended GOS [GOS-E], or post-concussion symptoms/syndrome as assessed by the Rivermead Post-Concussion Symptoms Questionnaire [RPQ] 34 ), biomarker measurement in blood on admission, and relevant prognostic analyses.
We excluded studies containing exclusively or primarily pediatric patients and those using non-quantitative methods to assess biomarker concentrations (e.g., Western blot or explorative proteomics). No restrictions were applied based on geographic location and language of publication, but we excluded articles reporting no or not sufficiently detailed methodological information (for instance, abstracts, letters to editors, and conference proceedings) or when essential information was missing and could not be obtained from the authors. Studies on cohorts with fewer than 50 participants, resulting, thereby, in few total events, and imprecise effect estimates (‘‘small-study effects’’) were also excluded. 35,36 To avoid double counting, in the case of publications reporting results from the same cohort or studies with overlapping samples, we selected the most complete article and those presenting complementary results (for instance, if they reported measurement of different biomarkers or outcomes).
Data extraction
Two reviewers (K.A. and S.M.) independently extracted data using a standardized and piloted data abstraction form with analysis domain from the checklist for critical appraisal and data extraction for systematic reviews of prediction modeling studies—prognostic factor. 15 All extracted data were checked for accuracy by a third researcher (E.C.), and discrepancies were resolved. We collected relevant information on the publication, study design and funding, patient characteristics (demographic and clinical data), biomarker testing (analytical aspects, sampling time and type, concentrations, cutoffs, estimated prognostic effect measures and their precision), comparator prognostic factors and models, and clinical outcomes of interest (outcome type and timing of assessment). If biomarkers were assessed at multiple time points, we used the first measurement after the injury for analysis.
Our primary outcomes were all-cause mortality (at discharge and late mortality [up to 6/12 months]), unfavorable outcome/incomplete recovery as assessed by GOS or GOS-E (up to 6/12 months), and occurrence of persisting (after 1 month) post-concussion syndrome/symptoms, as assessed by the RPQ. When the outcome was dichotomized by the authors, we retained their definition of outcome (see Table 1). Otherwise, when the entire spectrum of the scores was provided, we dichotomized the scores to define unfavorable outcomes as GOS ≤3 or GOS-E ≤4, and incomplete recovery as GOS-E <8.
Characteristics of Included Studies
Assessment of methodological quality and risk of bias
The methodological quality of the included studies was evaluated using a modified version of the Quality Assessment of Prognostic Accuracy Studies (QUAPAS) 67 supplemented with additional items from the Quality in Prognostic Studies 68 and REMARK tools. 31 The QUAPAS tool includes five domains: participants, index test, outcome, flow and timing, and analysis. Each domain is judged in terms of risk of bias, with the first four domains also considered in terms of concerns about the applicability of the study findings to the review question. The detailed components of each domain can be found in Supplementary Appendix A2. Assessment of the different aspects of study quality was independently performed by two reviewers (K.A. and S.M.). Discrepancies were resolved through discussion or arbitration by a third reviewer (E.C.).
Data synthesis and statistical analysis
The analysis includes a structured narrative synthesis. We constructed evidentiary tables identifying study characteristics, results pertinent to the review questions—prognostic capabilities of the biomarkers of interest, and quality ratings for all the included studies. We performed separate analyses for each biomarker and each outcome type and timing. There are no accepted/validated prognostic thresholds, and sensitivity and specificity were not consistently reported (Supplementary Table S2). Therefore, we calculated the weighted summary area under the ROC curve (AUC) under the random effects model as a summary measure for associations with outcome. 69 This model accounts for between-study variability allowing for heterogeneity in threshold and accuracy. Where data were available, we plotted estimates of sensitivity and specificity from each study on forest plots and in receiver operating characteristic (ROC) space. For studies that reported data at a common cutoff value, we calculated the pooled estimates of sensitivity and specificity in a random-effects bivariate regression approach. 70 We used Cook’s distance to identify particularly influential studies and checked for outliers using scatter plots of the standardized predicted random effects. We explored heterogeneity through visual examination of the forest plots of sensitivities and specificities and the I 2 statistic. 71 Due to the limited number of studies, subgroup and sensitivity analyses based on a priori-specified hypotheses were not undertaken. For all tests and confidence intervals, we used a two-tailed alpha of 5%. Data processing and statistical analyses were conducted using Review Manager (RevMan) version 5.3 (Cochrane Collaboration, Copenhagen, Denmark), MedCalc® Statistical Software version 22.021 (MedCalc Software Ltd, Ostend, Belgium; 2024), and STATA version 18.0 (StataCorp, 2023, College Station, Texas, USA) including the user-written commands METANDI and MIDAS.
Results
The total number of unique records identified by our searches up to October 2023 was 12,792, of which 480 full-text articles were assessed for eligibility. Thirty-two of them fulfilled our inclusion criteria and were included (Fig. 1). The main study characteristics are reported in Table 1, additional details are provided in Table 2 and Supplementary Tables S1 and S2.
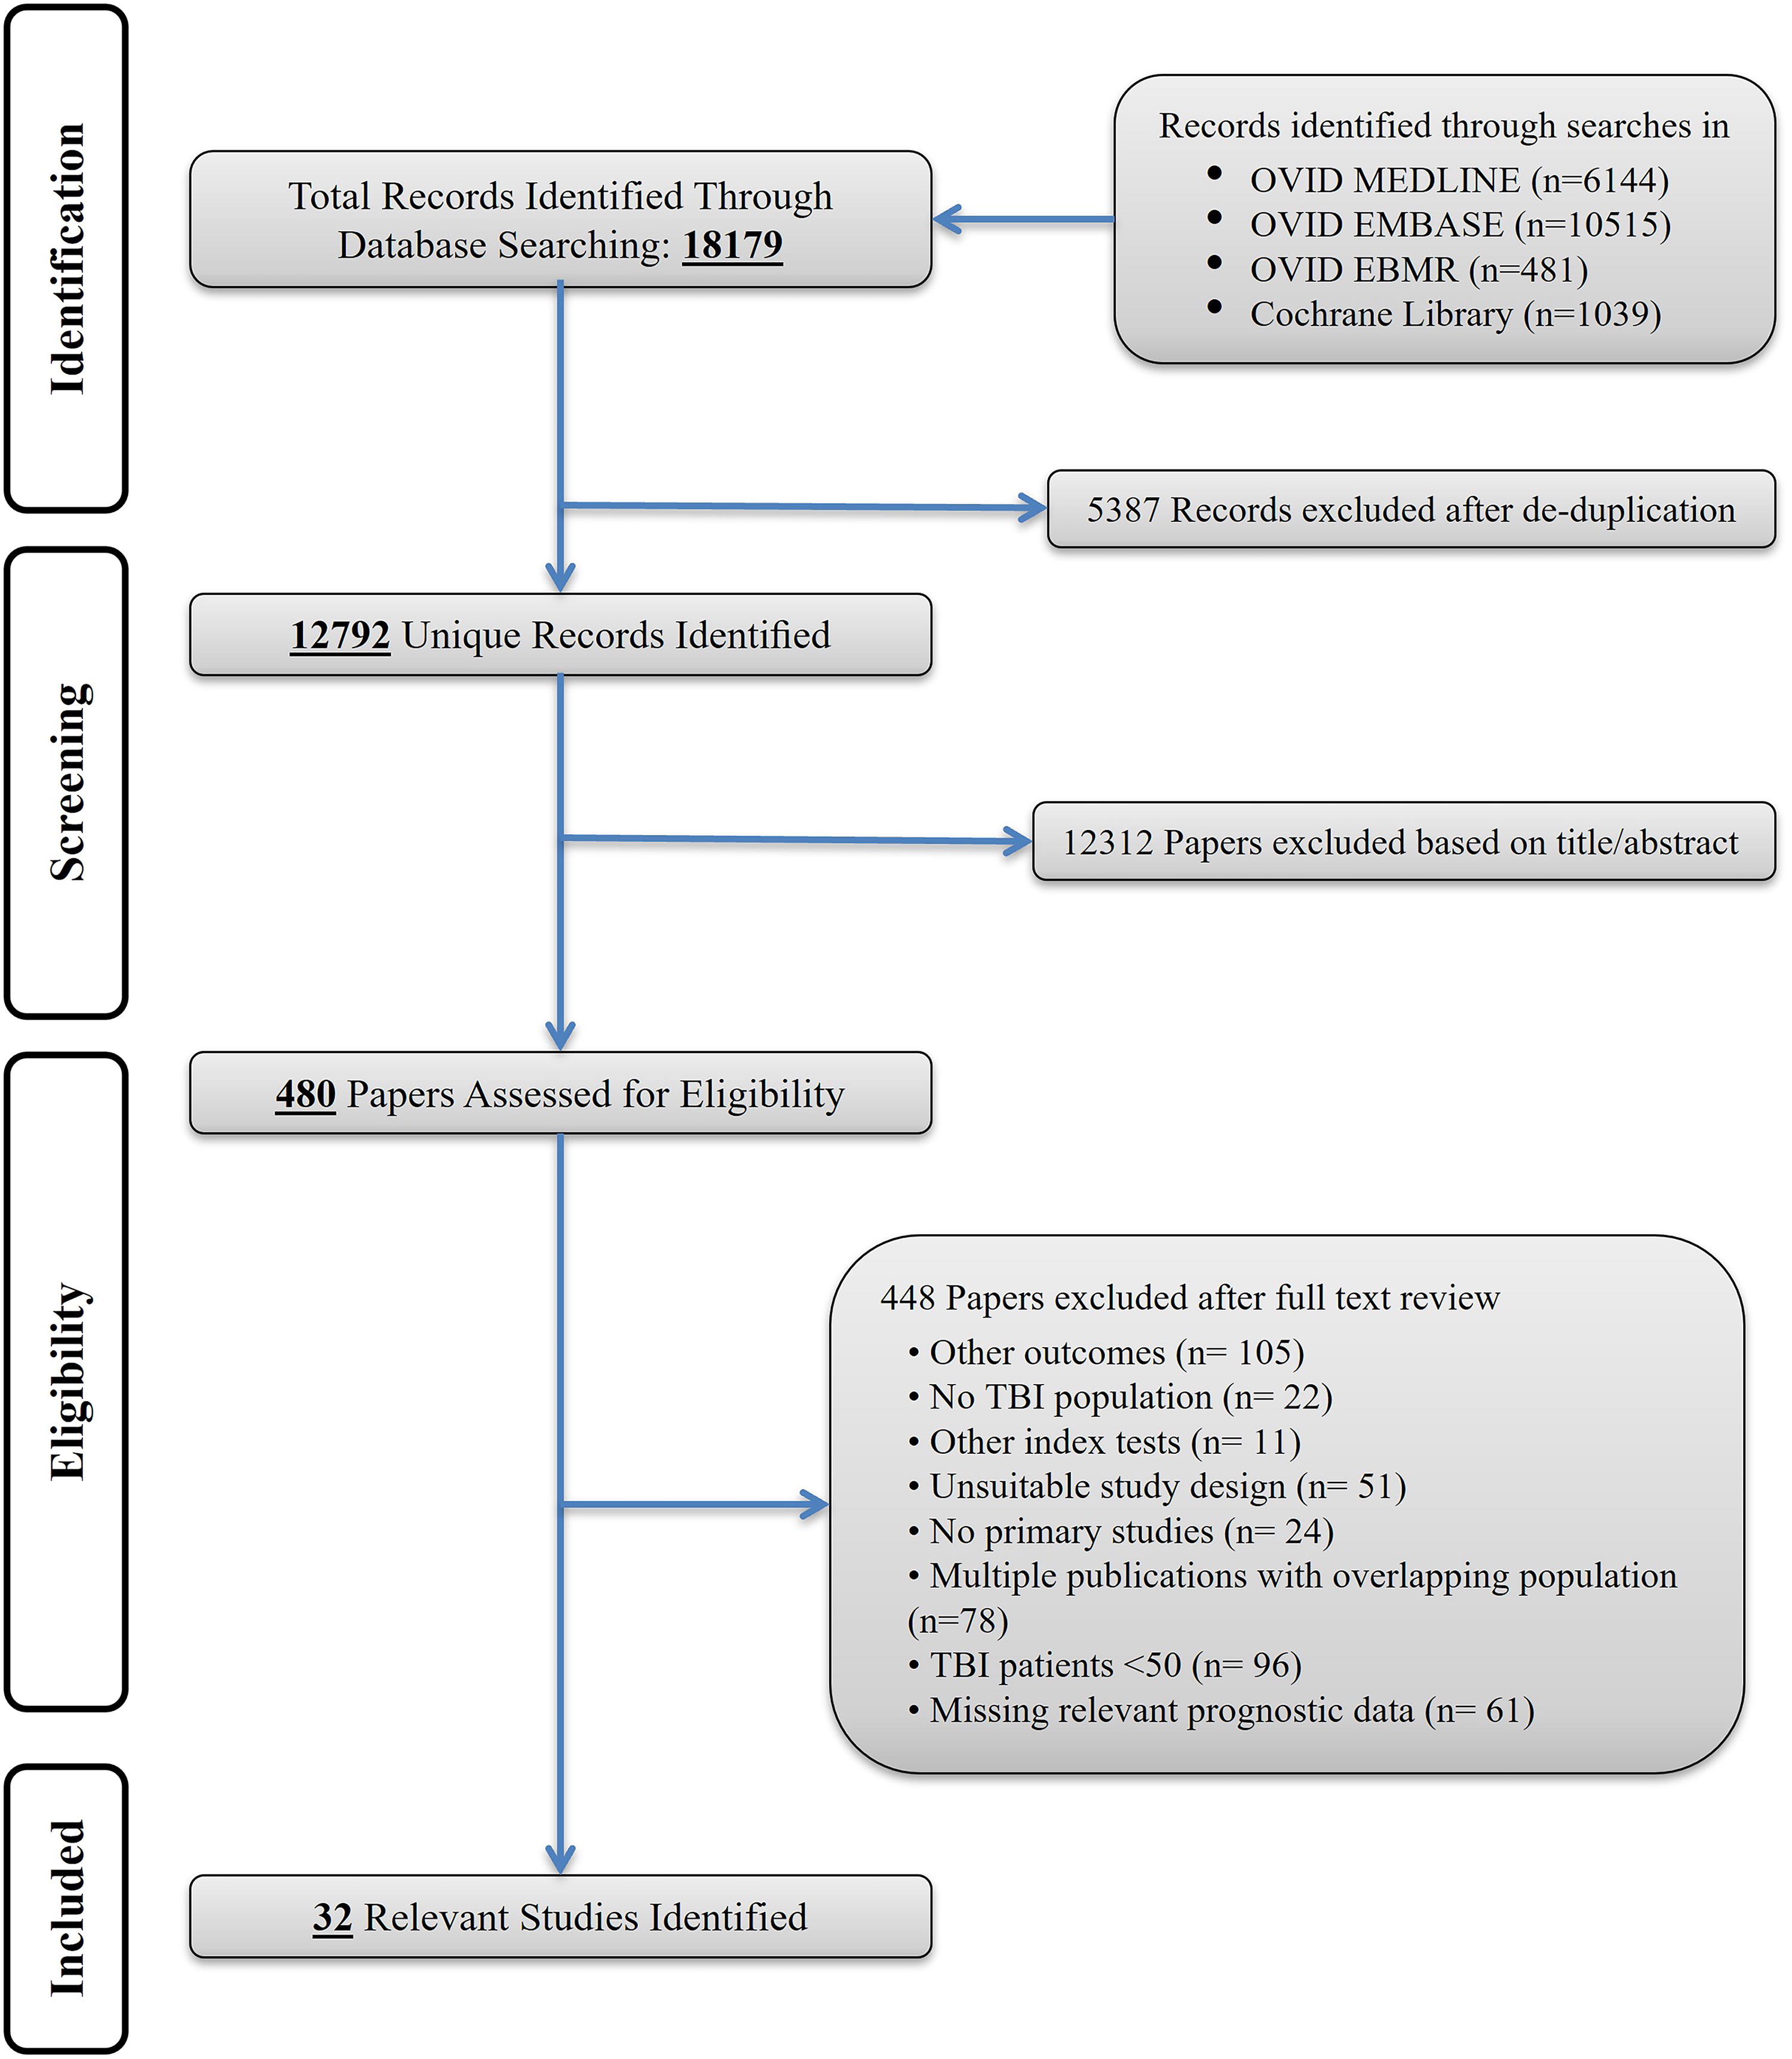
Study flow diagram.
Markers—Definition and Method for Measurement of Prognostic Factors
AUC, area under the curve; CI, confidence interval; CMIA, chemiluminescent microparticle immunoassay; ECLIA, electrochemiluminescence immunoassay; EIMAF, enhanced immunoassay using multi-arrayed fiberoptics; ELISA, enzyme-linked immunosorbent assay; GFAP, glial fibrillary acidic protein; GOS, Glasgow Outcome Scale; GOS-E, GOS extended; ILMA, immunoluminometric assay; NfL, neurofilament light; NSE, neuron-specific enolase; RIA, Radioimmunoassay; S100B, calcium-binding protein B; SIMOA, single-molecule array technology; UCH-L1, ubiquitin C-terminal hydrolase-L1.
Most studies (n = 20, 63%) were published in the last decade (between 2014 and October 2023), and the remaining were published from 2000 to 2011. Twenty-nine studies were observational cohort studies and three were randomized controlled trials 37,43,56 (Table 1). In total, 4 of the 32 included articles reported results from the ongoing multicenter study Transforming Research and Clinical Knowledge in Traumatic Brain Injury, 41,50,51,59 two reported results from the TBIcare project, 47,72 and two from the European multicenter, longitudinal, observational cohort study CENTER-TBI. 46,53 Twelve studies referred to a study protocol, 23,37,41,43,46,47,50,51,53,56,59,72 though one was not publicly accessible. 23 No studies referred to a statistical analysis protocol. Most of the studies were conducted in the United States (7/32) and European region (19/32), three studies were conducted in China, one in India, one in Canada, and one in Iran (Fig. 2). The total number of patients with TBI in the included studies was 7481, with sample sizes ranging from 57 49 to 2283. 51 The reported mean or median age ranged from 30 54 to 63.1 years. 49 Older adults appeared to be underrepresented, as only three studies included participants with a mean/median age of 50 years or above. Males represented 69% of all subjects (the proportion of men ranged from 47% 49 to 85% 56 ). Data on race or ethnicity were reported in six studies, with the proportion of white individuals ranging from 75% 43 to 97%, 46 while Asian and Black individuals were considerably underrepresented. The severity of the injury was variable across studies. Most studies (n = 13, 41%) enrolled patients with severe or moderate-to-severe TBI, eight studies (25%) included patients classified as having mild TBI, and nine (28%) enrolled the full spectrum of injury severity (GCS 3–15). This information was not available in two studies (Table 1). Six studies included participants with isolated head trauma, 40,42,45,54,58,66 but no study reported including penetrating brain injury. The participants were primarily recruited from the emergency department (n = 17) and ICUs (n = 7), while eight studies did not report details of the health care setting (Table 1). The most common blood sample matrix was serum (75%). Twenty-seven studies defined a specific sampling time window as an inclusion criterion, which ranged from 2 h 37,45 to 48 h. 64 Most of the samples were drawn within 24 h of injury, with study means/medians ranging from 61 min 37 to 28 h, 47 but the time was reported inconsistently (20 out of 32) (Table 2).
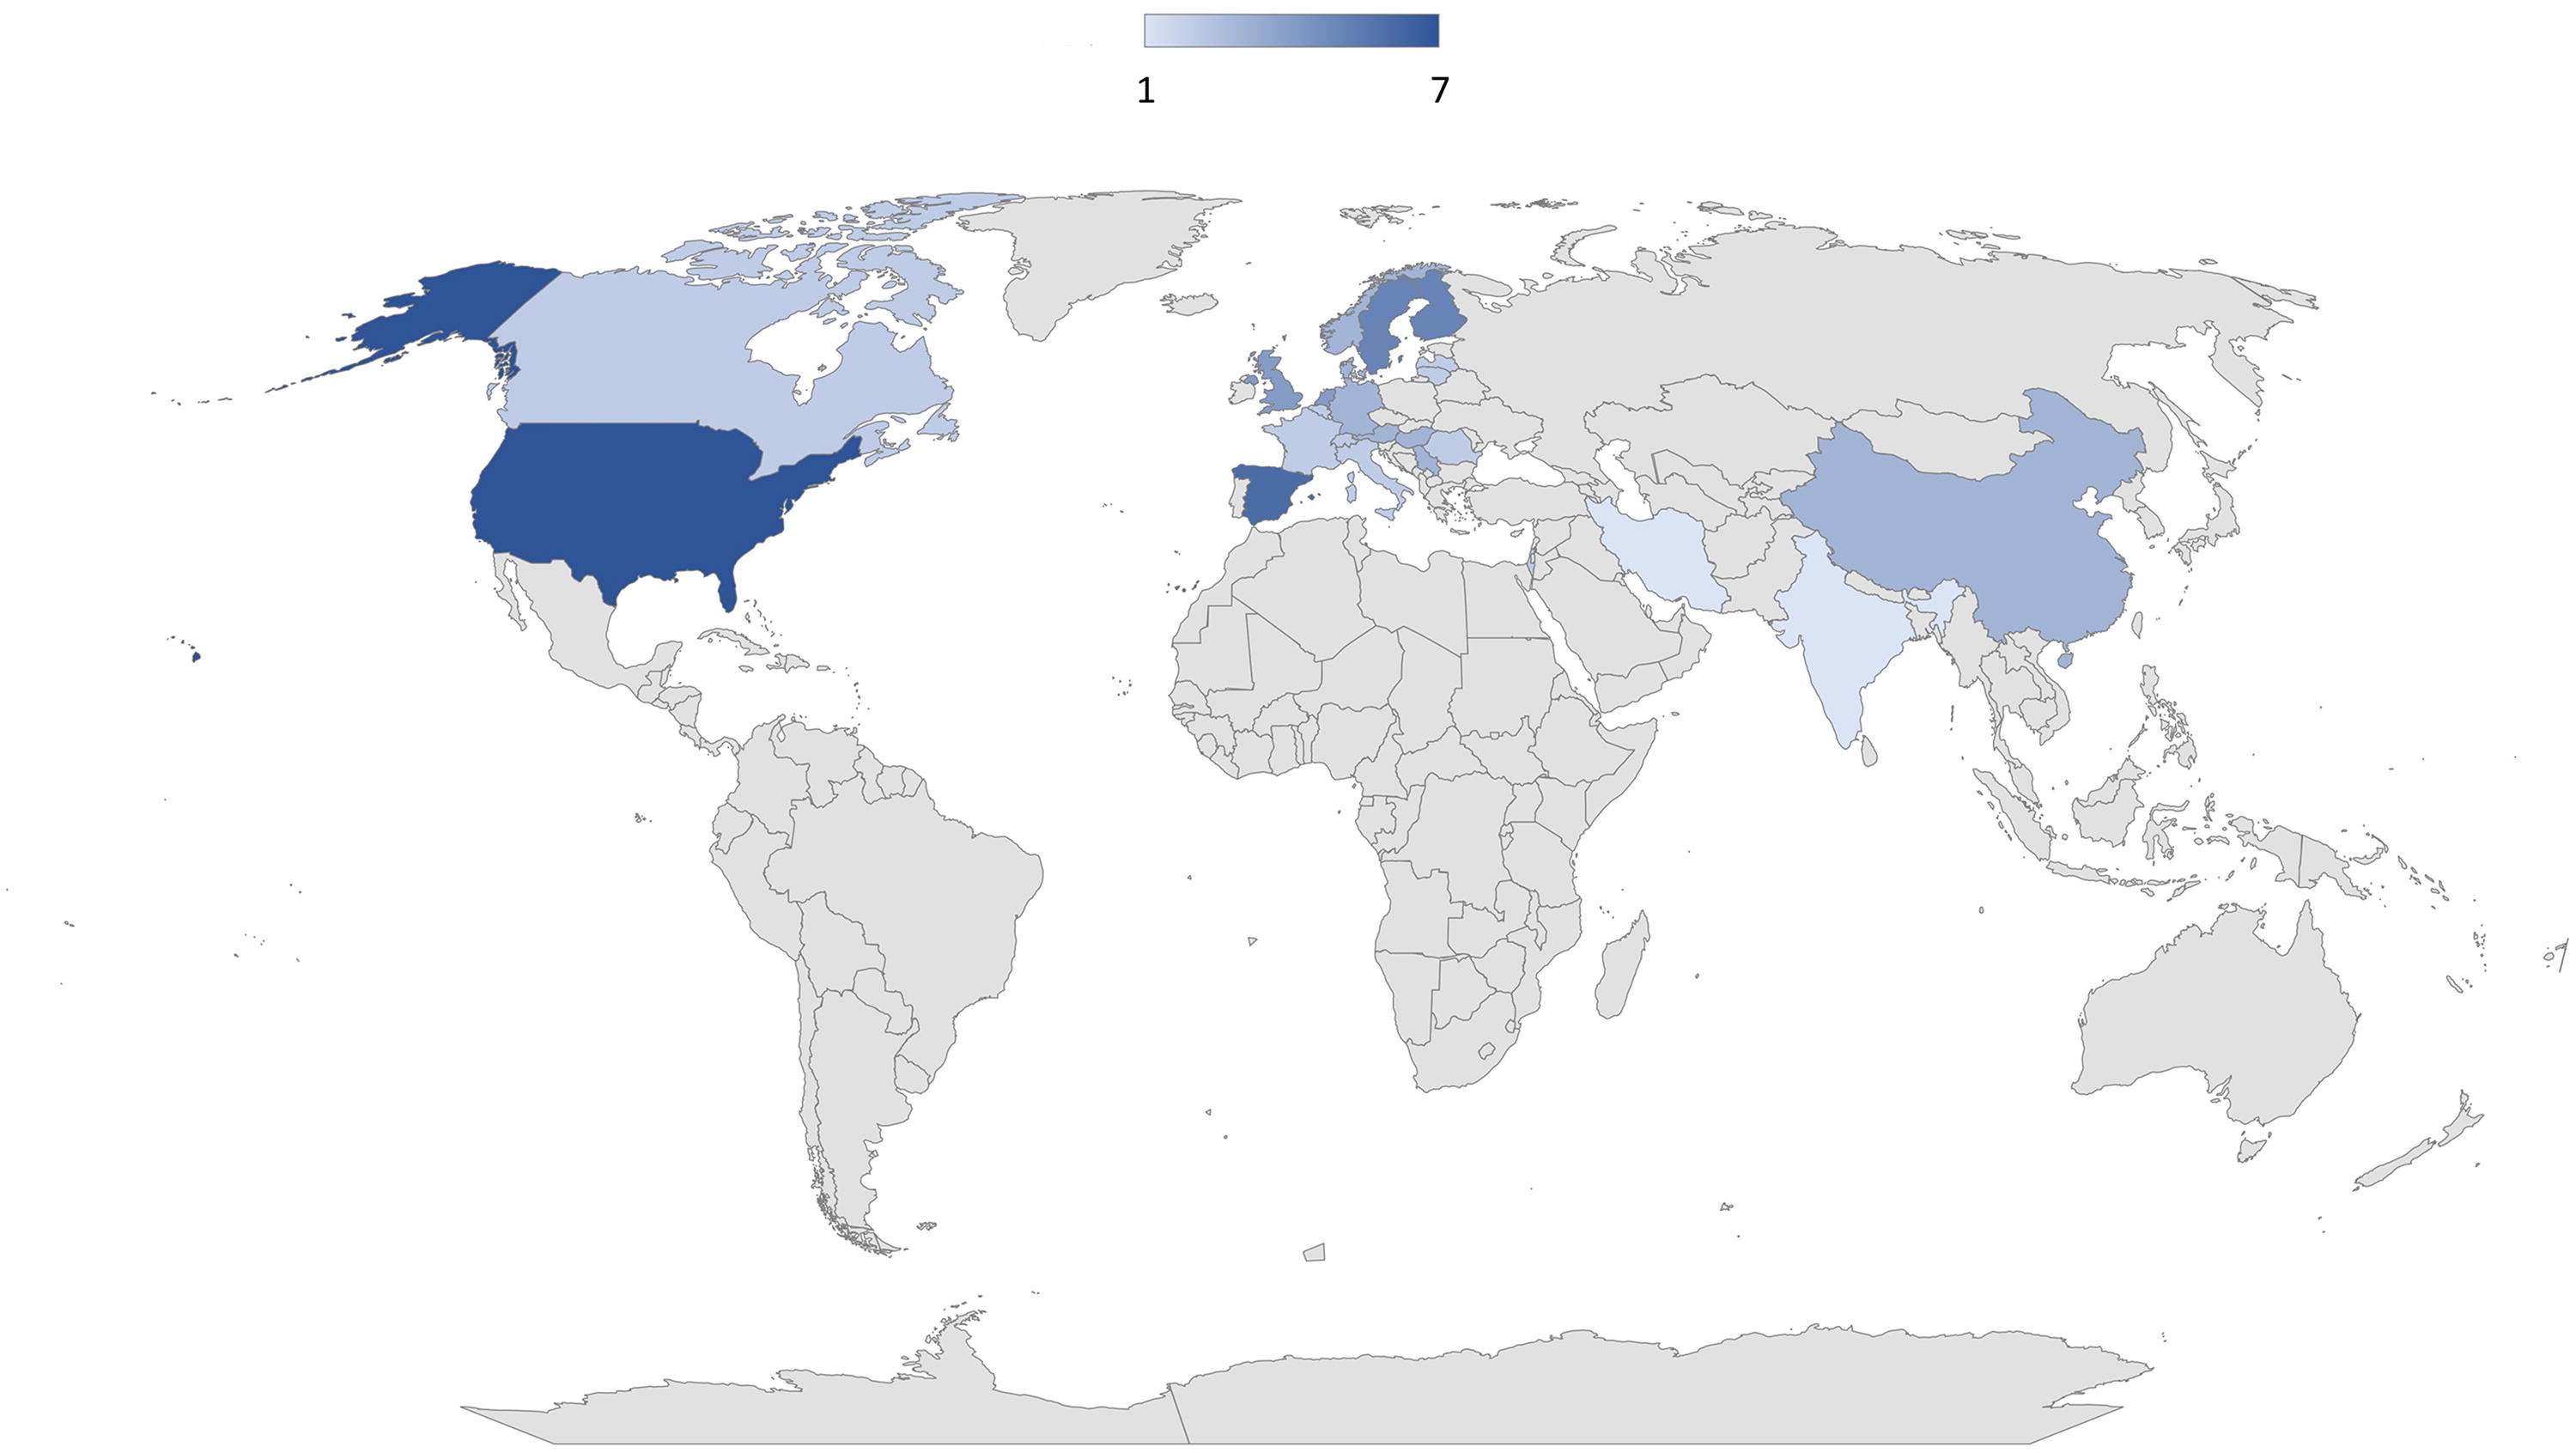
Geographical distribution of where studies were conducted.
Mortality, GOS/GOS-E with varying dichotomizations, and post-concussive symptoms/post-concussion syndrome outcomes were reported in 16 (50%), 21 (66%), and 7 (22%) studies, respectively. The outcome was most frequently assessed at 6 months post-injury, with—depending on case-mix—mortality ranging from 3.8% 72 to 45.45%,23 unfavorable outcomes (GOS ≤3 to GOS-E ≤4) ranging from 12.7% 63 to 58.8%, 40 and, incomplete recovery (GOS-E <8) ranging from 24% 63 to 68%. 41 The occurrence of post-concussion symptoms or post-concussion syndrome was assessed between 1 month and 12 months and ranged from 22% 60 to 62% 50 (Table 2). Eighteen studies (56%) did not report loss to follow-up, as the outcome assessment was an inclusion criterion (Table 2).
The majority (n = 21) of studies evaluated S100B; 17 GFAP, 10 UCH-L1, 9 NSE, 7 tau, and 5 neurofilament proteins. Twenty studies reported cutoff values. However, the threshold was prespecified in only three studies 45,48,65 ; in the remaining, the optimal cutoffs were determined from ROC analyses or using reference limits established on study participants, which may lead to accuracy overestimation (Supplementary Table S2).
Methodological quality of included studies
Twenty-nine studies were at high risk of bias (Fig. 3). Methodological concerns were primarily driven by patient selection criteria and lack of consecutive/random patient enrollment (n = 24), lack of technical reliability (i.e., inter-assay coefficient of variation [CV] >15%, and intra-assay CV >10%), lack of prespecified thresholds with data-driven selection of optimal cutoff values (n = 17), and inadequate analysis methods or control for confounding (n = 19). In particular, the indication for CT scanning or exclusion of patients without outcome assessment may inflate the performance estimates. In ∼65% of the studies, participant characteristics and sampling procedures did not appropriately match the clinically relevant question, raising concerns about the applicability of the findings to clinical practice.
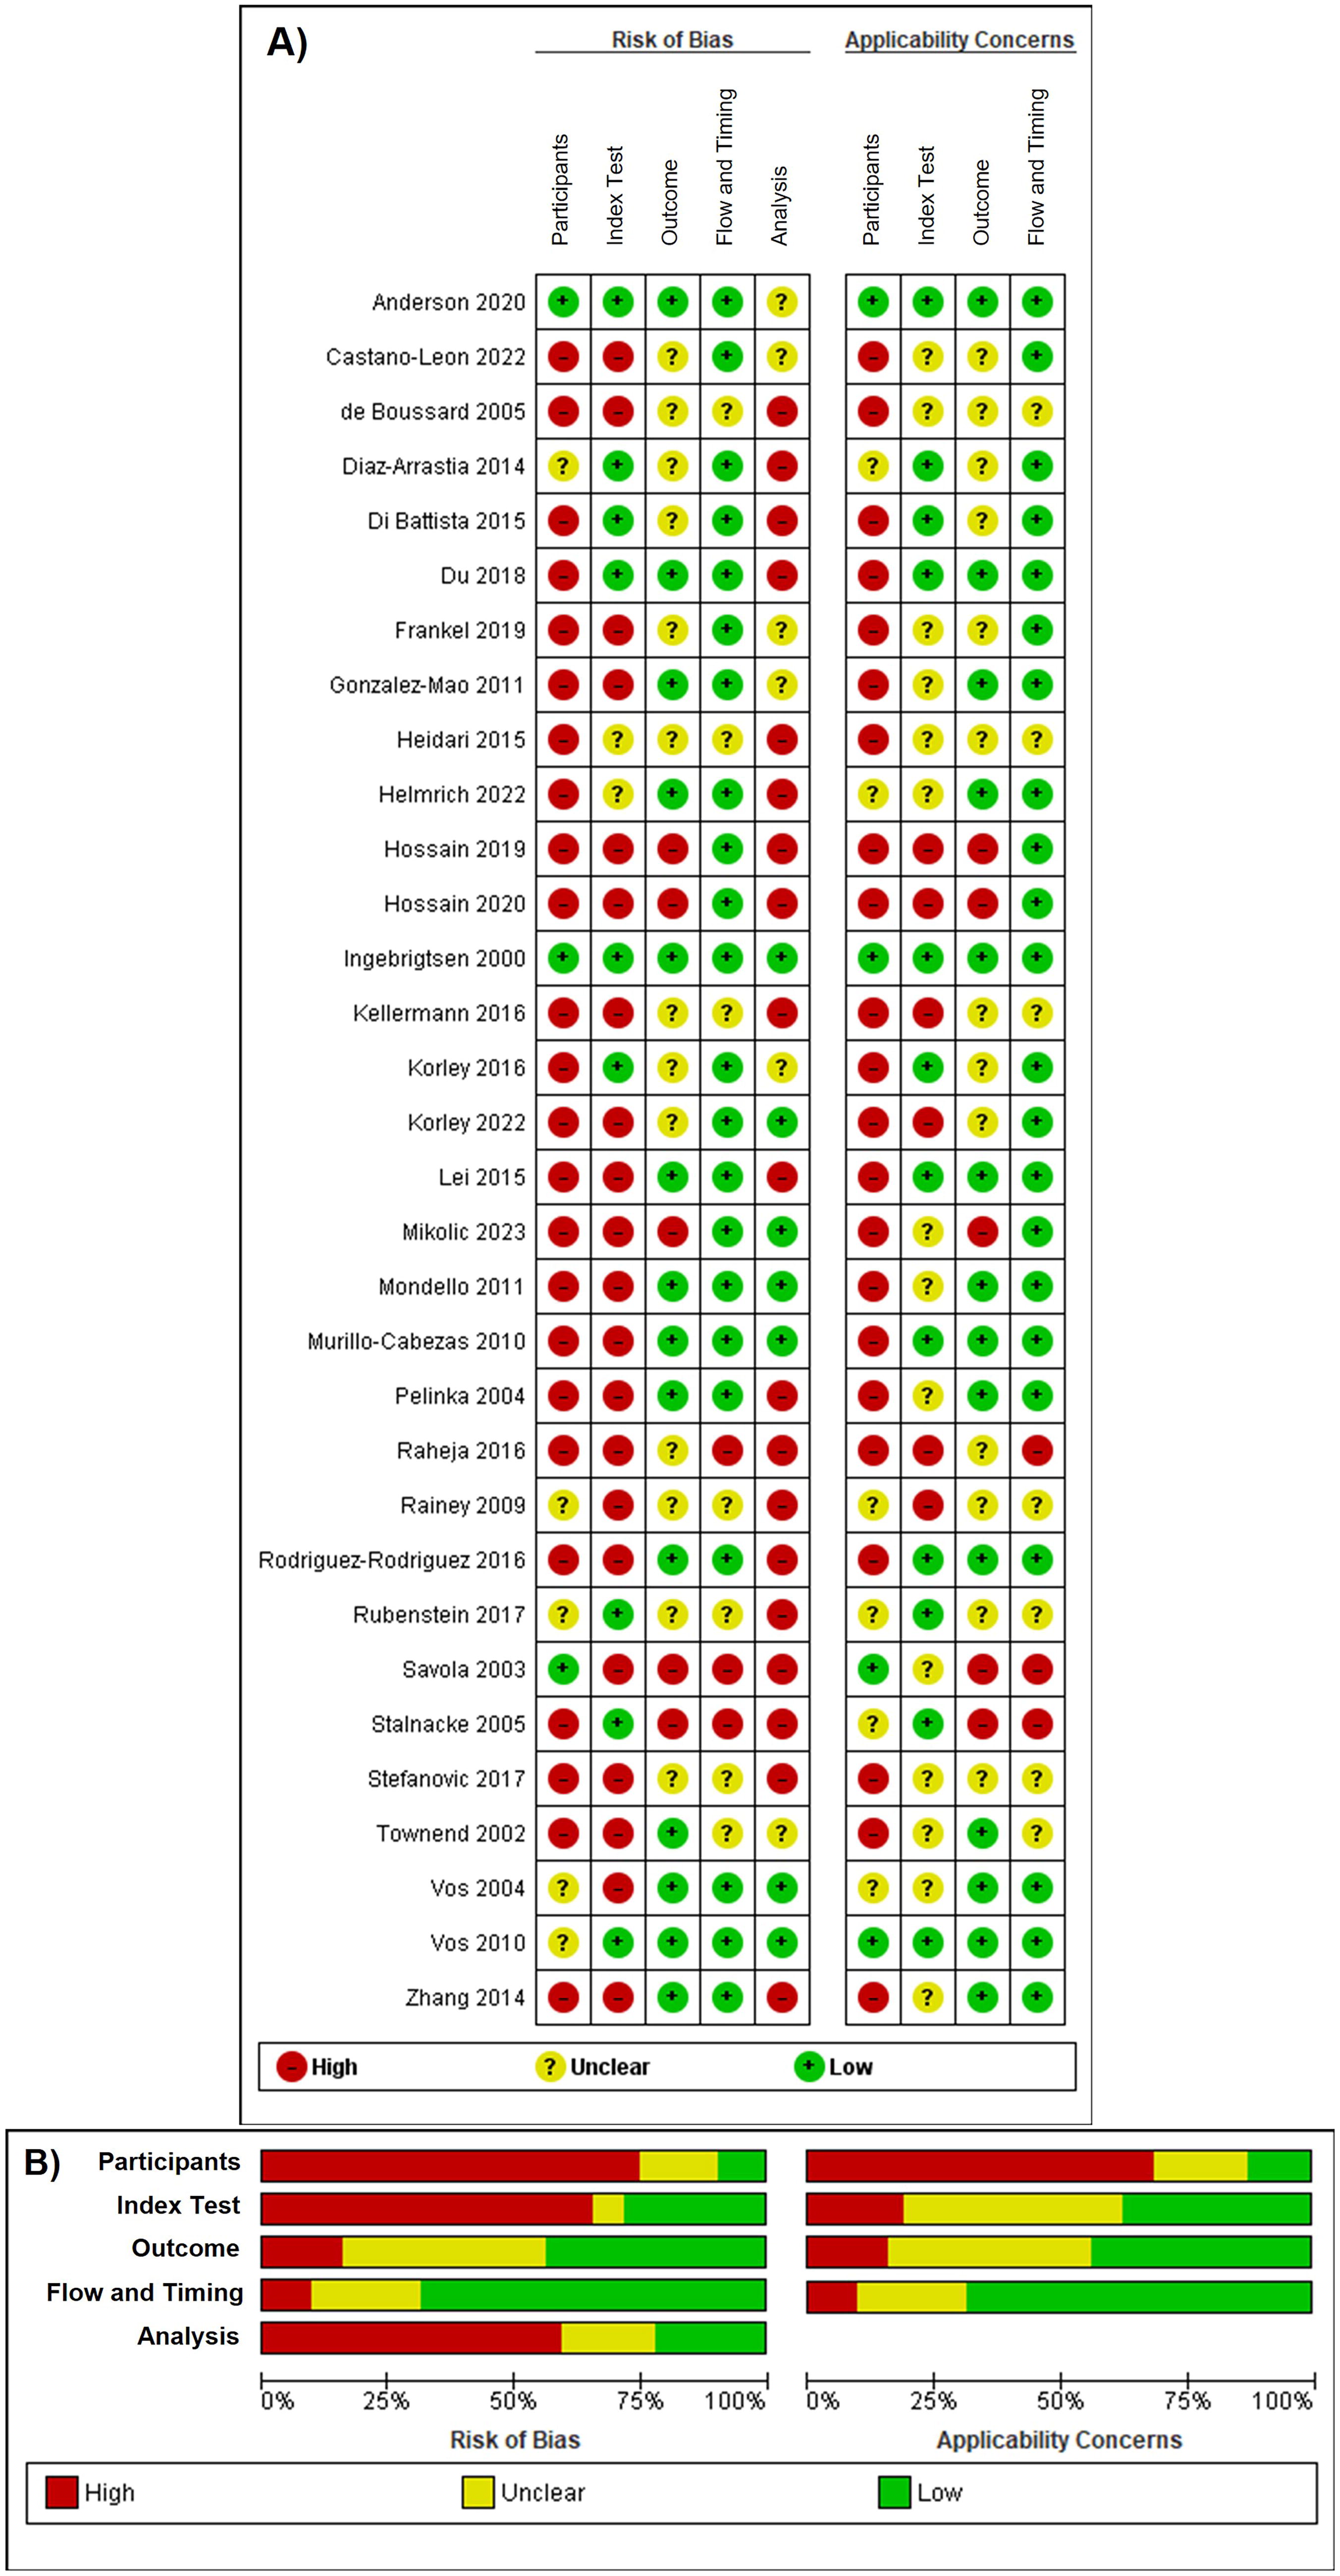
Methodological quality assessment of included studies.
Mortality
S100 calcium-binding protein B
The performance of S100B for predicting mortality was evaluated in 13 studies including 3682 patients with TBI.
In-hospital (early) mortality
The study-specific AUCs and 95% CI for each of the four studies 42,44,58,62 (484 patients with TBI), that evaluated in-hospital mortality are shown in Figure 4. The AUC values were between 0.74 and 0.81. Pooling the results produced a summary estimate of 0.80 (Table 3). Three studies 44,58,62 reported thresholds ranging from 0.568 μg/L to 1.5 μg/L (ng/mL), with sensitivities between 73% and 87%, and specificities between 60% and 76% (Supplementary Table S2 and Supplementary Fig. S2).
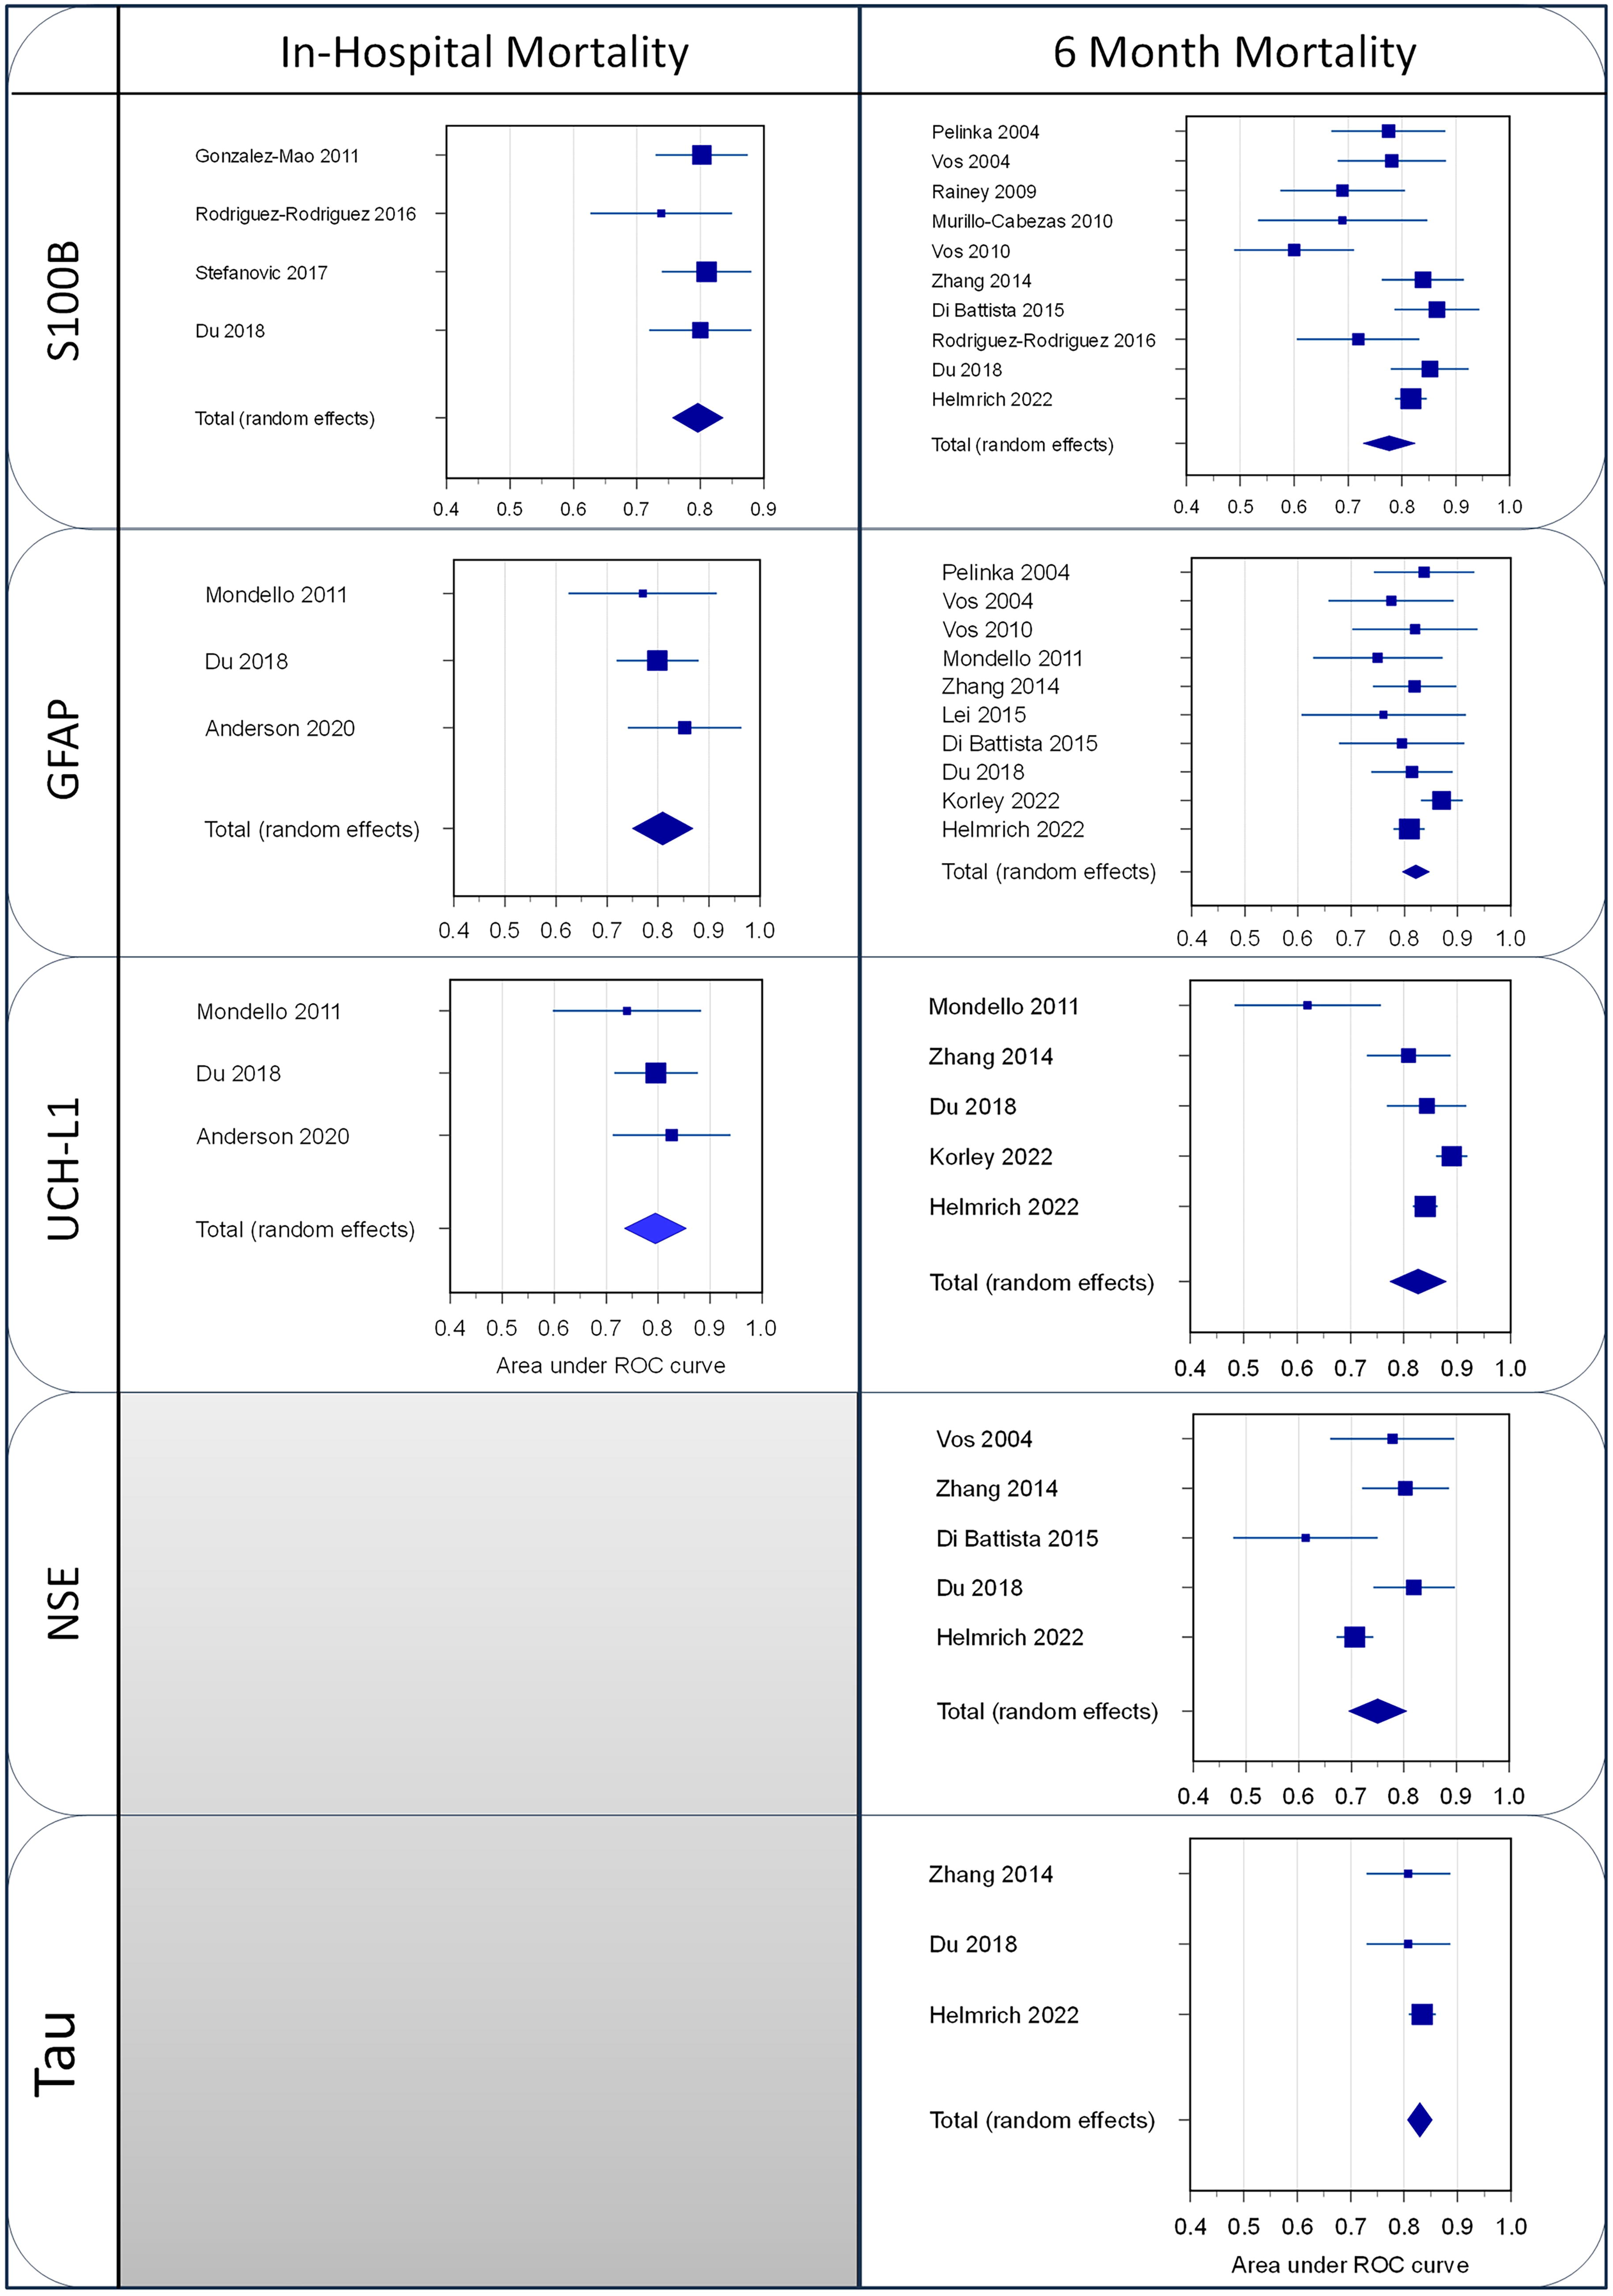
Forest plots of the AUC for mortality of the different studies and the weighted summary AUC with 95% CI under the random effects model. AUC, area under the curve; CI, confidence interval.
Head-to-Head Prognostic Performance as Assessed by Unadjusted Pooled AUC (95% CI) for Biomarkers Across Outcomes
The number of the included studies and patients used in the analysis are indicated.
AUC value interpretation.
0.9–1.0: Excellent discrimination capability.
0.8–0.9: Good discrimination capability.
0.7–0.8: Fair discrimination capability.
0.6–0.7: Poor discrimination capability.
AUC, area under the curve; CI, confidence interval; GFAP, glial fibrillary acidic protein; GOS, Glasgow Outcome Scale; GOS-E, GOS extended; NfL, neurofilament light; NSE, neuron-specific enolase; S100B, calcium-binding protein B; UCH-L1, ubiquitin C-terminal hydrolase-L1.
Only one study 44 adjusted for all the clinical variables assessed and concluded that S100B on admission was not an independent predictor of early mortality.
Late mortality
A total of 11 studies 40,42,46,54 –58,64 –66 (3198 patients with TBI) evaluated the accuracy of S100B for predicting late mortality. The AUC values were between 0.60 and 0.87 (Fig. 4), though in one study, 56 S100B was not found to be a predictor of death. Pooling the results produced a summary estimate of 0.77 (Table 3) with considerable heterogeneity (I 2 = 68). Seven studies 54,55,57,58,64 –66 report a threshold value ranging from 0.48 μg/L to 2.15 μg/L (ng/mL), with sensitivities between 25% and 100%, and specificities between 41% and 94% (Supplementary Table S2 and Supplementary Fig. S2).
Six studies 46,54,56,64 –66 evaluated the added benefit or adjusted for one or more prognostic factors, including demographic, clinical, and radiological characteristics and established prognostic models. The set of adjustments varied substantially across studies. One large-scale study 46 demonstrated an additive benefit, the magnitude of which, notably, differed depending on the model (i.e., IMPACT core and CRASH basic).
Glial fibrillary acidic protein
The accuracy of GFAP for predicting mortality was evaluated in 12 studies including 5005 patients with TBI.
In-hospital (early) mortality
Only three studies 23,37,42 (430 cases) evaluated the prognostic value of GFAP for in-hospital mortality. The study-specific AUCs and 95% CI are shown in Figure 4. The AUCs ranged from 0.77 to 0.85. Pooling the results produced a summary estimate of 0.81 (Table 3). One study 23 reported a threshold of 1.44 ng/mL yielding a sensitivity of 67% and a specificity of 86% (Supplementary Table S2).
One study 37 demonstrated added benefit after adjusting for prehospital (PH) predictor variables (i.e., GCS score, age, sex), while one study 23 identified GFAP as a stronger predictor of early mortality compared to patient characteristics (age, sex) and TBI characteristics (CT findings, GCS).
Late mortality
The accuracy of GFAP for late mortality was evaluated in 11 studies 23,40,42,46,51,52,55,56,64 –66 (4762 patients with TBI). The AUCs were between 0.75 and 0.87, with a summary estimate of 0.82 (Fig. 4, Table 3). One study 56 did not find GFAP on admission as an independent predictor of death. Thresholds determined in five studies were between 0.012 ng/mL and 1.69 ng/mL. The sensitivities were between 71% and 85% while the specificities were between 52% and 93% (Supplementary Table S2 and Supplementary Fig. S2).
Seven studies 23,46,51,56,64 –66 evaluated the added benefit or adjusted for one or more prognostic factors. The set of adjustment factors varied substantially across studies and included demographic, clinical, and radiological characteristics and established prognostic models (i.e., IMPACT core and CRASH basic, UPFRONT). Five studies 23,46,51,64 –66 demonstrated an additive value. 46
Prognostic performance of GFAP for predicting mortality at ∼1.5 ng/mL cutoff value
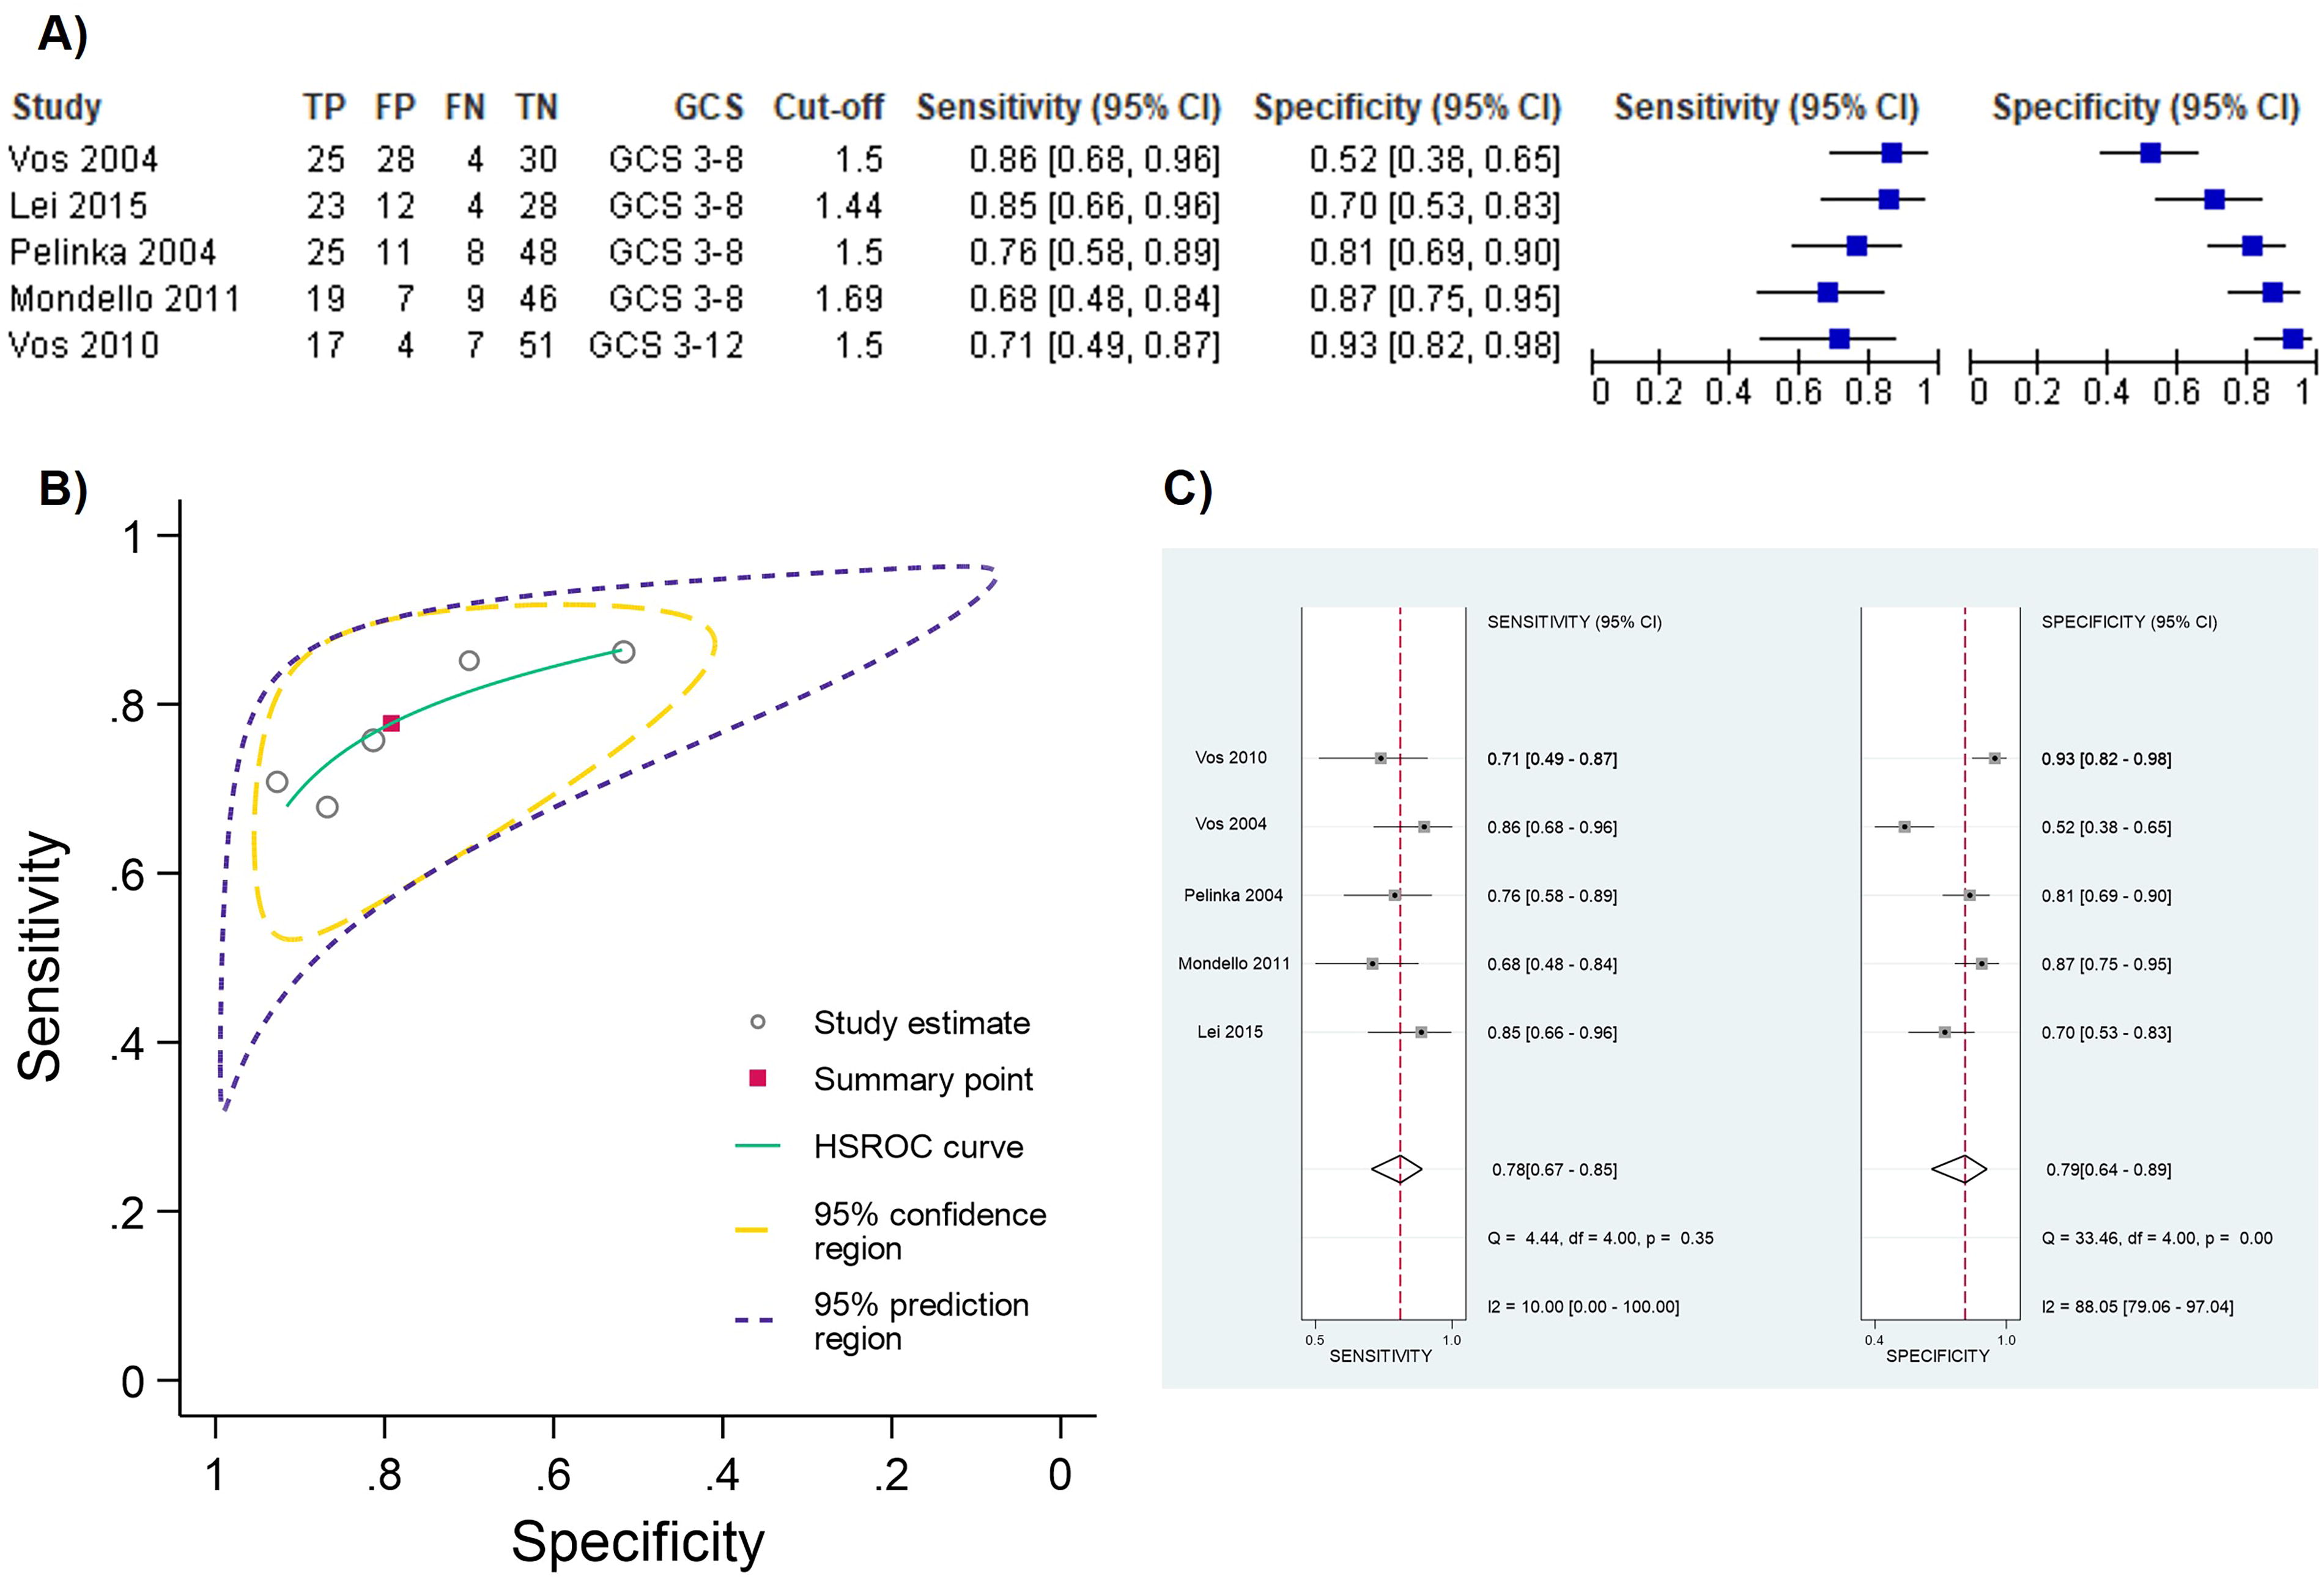
Four studies 23,55,64,66 reported independently a cutoff value at presentation of ∼1.5 ng/mL (1.44–1.69 ng/mL) for mortality prediction. This value was also validated in an independent cohort. 65 We pooled the results from these five studies to obtain summary estimates of sensitivity and specificity. The target condition was severe TBI (GCS 3–8) in four studies and severe to moderate TBI (3–12) in one study; the outcome was early mortality in one study and late mortality in the remaining four studies. Figure 5A shows a forest plot of the coupled sensitivity and specificity with 95% confidence intervals for each study included in this meta-analysis. Pooling the results produced the following summary estimates: sensitivity 77.7% (95% CI 67.4% to 85.4%) and specificity 79.1% (95% CI 63.9% to 89%) The summary ROC plot (Fig. 5B) shows the summary sensitivity and specificity (the solid red square) and the 95% confidence and prediction regions (the inner and outer ellipses, respectively). As shown in Figure 5A and C, a significant level of heterogeneity was apparent in the results, greater in specificity than in sensitivity. This could be explained by the fact that one study included patients with different injury severity (i.e., GCS 3–12) and the shortest time to sample collection. 65 After refitting the model and leaving this study out, we observed a modest increased sensitivity (77.7% vs. 79.4%) while specificity decreased from 79.1% to 74.1%.
Ubiquitin C-terminal hydrolase-L1
The accuracy of UCH-L1 for predicting mortality was evaluated in five studies (4511 patients with TBI).
In-hospital (early) mortality
Only three studies 23,37,42 (430 cases) evaluated the performance of UCH-L1 for early mortality. The individual AUC values, ranging between 0.74 and 0.83, are shown in Figure 4. Pooling the results produced a summary estimate of 0.80 (Table 3). One study 23 reported a threshold of 1.89 ng/mL, with a sensitivity of 52% and a specificity of 96% (Supplementary Table S2).
Two studies investigated the adjusted prognostic value of UCH-L1, one 23 demonstrating that UCH-L1 was the only independent predictor after adjusting for patient/TBI characteristics, and the other 37 showing that UCH-L1 improved prediction of 28-day mortality compared with PH variables alone.
Late mortality
The accuracy of UCH-L1 for late mortality was evaluated in five studies (4268 patients with TBI). Pooling the results produced a summary estimate of 0.83 (Table 3) with individual AUCs between 0.62 and 0.89 (Fig. 4). There was a substantial heterogeneity (I 2 = 79.6). One study 66 reported a threshold value of 2039.9 pg/mL, with a sensitivity of 69% and a specificity of 83.6% (Supplementary Table S2).
Four studies 23,46,51,66 investigated the added benefit/independent contribution of UCH-L1 to the probability of being deceased 6 months post-injury showing a consistent incremental prognostic value, though the set of prognostic factors was variable across studies. Importantly, in all four studies 23,46,51,66 also measuring GFAP, this latter was consistently outperformed by UCH-L1.
Neuron-specific enolase
The accuracy of NSE for predicting mortality was evaluated in eight studies (2976 patients).
In-hospital (early) mortality
Three studies (335 patients with TBI) evaluated the accuracy of NSE, two showing a poor to good accuracy (AUCs 0.675 [95% CI 0.59–0.75] 62 and 0.820 [95% CI 0.733–0.887] 58 ) and one 42 reporting no association between circulating NSE concentrations on admission and in-hospital mortality.
Late mortality
The accuracy of GFAP for late mortality was evaluated in seven studies (2846 TBI cases). Two studies 56,58 reported no association between NSE on admission and 6-month mortality; in the remaining, the AUCs were between 0.6 and 0.82, with a summary estimate of 0.72 (Fig. 4, Table 3). Thresholds were determined in two studies 64,66 and ranged from 17.6 to 21.7 ng/mL. The sensitivities were between 85% and 93.1% while the specificities were between 48% and 61.6%.
In the three studies 46,64,66 investigating the added benefit of NSE to one or more prognostic factors, a limited/non-significant incremental value was observed.
Tau
Only three studies 42,46,66 including 2491 patients with TBIevaluated the accuracy of total-tau (t-tau) for predicting 6-month mortality. The individual AUC values ranged between 0.81 and 0.83 (Fig. 4) with a summary estimate of 0.83 (Table 3). One study 66 reported a threshold of 303.2 pg/mL, with a sensitivity of 79.3% and a specificity of 79.3% (Supplementary Table S2). One study 46 reported a discriminative ability (C-statistic) and R 2 of t-tau adjusted for demographic, clinical, and radiology parameters to predict mortality of 0.011% and 3.9%, respectively.
Neurofilament
Three studies 42,46,66 including 2491 patients with TBI evaluated the accuracy of neurofilament proteins for predicting 6-month mortality, two studies assessing phospho-NFH (p-NFH) (208 patients) 42,66 and one study neurofilament light (NfL; 2283 patients). 46 The individual AUC values were 0.82 for p-NFH and 0.81 for NfL. One study 66 reported a threshold value of 940.4 pg/mL for p-NFH, with a sensitivity of 79.3% and a specificity of 79.3% (Supplementary Table S2). One study 46 reported a limited discriminative ability (C-statistic) and R 2 of NfL after adjusting for demographic, clinical, and radiology parameters (0.005% and 1.5%, respectively).
GOS-E/GOS
S100 calcium-binding protein B
The value of S100B for predicting clinical outcome as assessed by GOS/GOS-E was evaluated in 12 studies (3784 TBI cases).
Unfavorable outcome (GOS-E ≤4, GOS ≤3)
The performance of S100B for predicting unfavorable outcomes was evaluated in 12 studies 40,42,43,46,49,54,56,57,63 –66 (3784 patients with TBI) with individual AUCs ranging from 0.75 and 0.87. One study 56 did not find S100B as an independent predictor of an unfavorable outcome, while one study 49 estimated an OR of 7.6. The summary AUC estimate is shown in Figure 6 (Table 3), but heterogeneity (I 2 = 78.64) was considerable. Eight studies 43,49,54,57,63 –66 reported a threshold value (range 0.2–2.15 μg/L), and six reported sensitivities and specificities ranging between 25% and 93%, and between 42% and 95%, respectively (Supplementary Table S2 and Supplementary Fig. S2).
Among the seven studies 43,46,54,56,64 –66 that adjusted for different conventional risk factors or employed established prognostic models (i.e., IMPACT core, and CRASH basic), the added value of S100B was limited or not significant.
Incomplete recovery (GOS-E ≤8)
Only one study 46 (2283 patients) evaluated the accuracy of S100B for predicting incomplete recovery at 6 months post-injury. The AUC was 0.69, and the incremental value when added to demographic, clinical, and radiology parameters was extremely limited (0.007 C-statistic and 1.6% R 2).
Glial fibrillary acidic protein
The value of GFAP for predicting clinical outcomes as assessed by GOS–GOS-E was evaluated in 14 studies, including 5798 patients with TBI.
Unfavorable outcome (GOS-E ≤4, GOS ≤3)
Among the 14 studies assessing the value of GFAP for predicting unfavorable outcomes, circulating levels on admission were not found to be associated with long-term GOS-E/GOS in one study. 56 The individual AUCs and the pooled AUC estimate of the remaining 13 studies 37,38,40 –43,46,51,52,56,64 –66,72 (5712 cases) from the random effects model are shown in Figure 6 (see also Table 3). There was marked heterogeneity, with an I 2 of 66.64%. Six studies 43,52,64 –66,72 reported a threshold value ranging from 0.01 to 12.19 ng/mL. Five of these studies reported sensitivities and specificities ranging between 47% and 86%, and between 69% and 95%, respectively (Supplementary Table S2 and Supplementary Fig. S2).
The nine studies 37,38,43,46,51,64 –66,72 exploring the independent prognostic value of GFAP over and above different sets of prognostic factors and models (i.e., IMPACT core and CRASH basic, UPFRONT), reported inconsistent findings, with several showing no substantial independent contribution, and four studies 46,51,64,65 reporting a potential added value.
Incomplete recovery (GOS-E ≤8)
Four studies (4292 patients) evaluated the accuracy of GFAP concentrations on admission for predicting incomplete recovery at 6 months post-injury. The pooled AUC was poor (0.65) (Table 3) with individual values between 0.6 and 0.73 (Figure 6). One study reported a threshold value of 204 pg/mL (Supplementary Table S2). The three studies 46,51,72 adjusting for established prognostic factors and models, found no substantial independent contribution or extremely limited changes in discriminative ability.
Ubiquitin C-terminal hydrolase-L1
The value of UCH-L1 for predicting clinical outcome as assessed by GOS-GOS-E was evaluated in eight studies, including 5289 patients with TBI.
Unfavorable outcome (GOS-E ≤4, GOS ≤3)
The individual AUCs of the eight studies 37,38,41 –43,46,51,66 ranged from 0.66 to 0.86 with a pooled AUC of 0.78 (Fig. 6 and Table 5). There was a substantial heterogeneity (I 2 = 83.66%). Two studies 43,66 defined a threshold which varied widely (from 2.27 ng/mL to 5.12 ng/mL).
Among the six studies 37,38,43,46,51,66 adjusting for different sets of prognostic factors, three studies demonstrated changes in discriminative ability. 37,46,51
Incomplete recovery (GOS-E ≤8)
Three studies 41,46,51 (4292 patients) evaluated the performance of UCH-L1 for predicting incomplete recovery at 6 months post-injury. The pooled AUC was poor (0.64) (Table 3) with substantial heterogeneity (I 2 = 96.88%). Individual AUC values were between 0.51 and 0.74 (Figure 6).
The two studies 46,51 that adjusted for established prognostic factors and models, irrespective of adjustment, found extremely limited changes in discriminative ability.
Neuron-specific enolase
The accuracy of NSE for predicting clinical outcomes as assessed by GOS-E/GOS was evaluated in six studies (2747 patients).
Unfavorable outcome (GOS-E ≤4, GOS ≤3)
One study 56 did not report the independent prognostic value of NSE on admission for poor outcome (GOS-E ≤4, GOS ≤3) at 6 months after TBI, the AUC estimates for each of the remaining five studies 40,42,46,64,66 (2661 cases) are shown in Figure 6. AUC values ranged from 51% to 90% with a pooled estimate of 0.73 (Figure 6 and Table 3). The heterogeneity was remarkable (I2 = 81.84%). Two studies 64,66 defined thresholds of 16.4 ng/mL and 21.7 ng/mL, with sensitivities of 93.1% and 80%, and specificities of 61.6% and 55%, respectively.
Three studies 46,64,66 adjusted for one or more conventional prognostic factors, demonstrating no substantial independent contribution.
Incomplete recovery (GOS-E ≤8)
Only one study 46 assessed the value of NSE on admission for predicting incomplete recovery at 6 months after TBI demonstrating no changes in discriminative ability.
Tau
The performance of t-tau for predicting clinical outcomes as assessed by GOS-E/GOS was evaluated in six studies (2881 patients).
Unfavorable outcome (GOS-E ≤4, GOS ≤3)
Two studies 56,59 did not find t-tau as a predictor of poor outcome. The individual AUC values 38,42,46,59,66 ranged between 0.52 and 0.83 (Figure 6) with a summary estimate of 0.76 (Table 3), though, the heterogeneity was remarkable (I 2 = 78.96%). Only two studies 38,66 defined thresholds, 282.9 pg/mL and 6.2 pg/mL, with a sensitivity of 81.2% and 63.3%, and specificities of 72.2% and 94.1% (Supplementary Table S2).
Three studies adjusted for one or more different prognostic factors and found no substantial independent contribution 38,66 or limited changes in discriminative ability. 46
The accuracy of plasma p-tau231 was evaluated in only one study. 59 The AUC was 77.1% (95% CI 67.8–86.4) indicating that this marker might be a fair predictor of poor outcome.
Incomplete recovery (GOS-E ≤8)
Only two studies 46,47 assessed the value of circulating t-tau level on admission for predicting incomplete recovery at 6 months after TBI. Both studies found a non-substantial prognostic value.
Neurofilament
The prognostic value of neurofilament for clinical outcome as assessed by GOS-E/GOS was evaluated in five studies (2685 patients). In particular, three studies 38,46,72 including 2477 patients assessed NfL, while two studies 42,66 including 208 patients assessed p-NFH.
Unfavorable outcome (GOS-E ≤4, GOS ≤3)
The individual AUC estimates of the three studies 38,46,72 assessing NfL are shown in Figure 6. They ranged between 82% and 83%, with a pooled AUC of 0.83 (Figure 6, Table 3). Two studies 38,72 defined thresholds, which varied from 53.6 pg/mL to 89.9 pg/mL, with sensitivities of 67% and 63.3%, and specificities of 90% and 94.1%, respectively (Supplementary Table S2).
The two studies 38,46 adjusting for established prognostic factors and models, irrespective of adjustment, found that NfL provided an independent contribution and changes in discriminative ability.
The accuracy of the circulating p-NFH for poor outcomes was evaluated in two studies. 46,49 The AUCs were between 76% and 82%. One study 66 defined a threshold of 833.3 pg/mL with a sensitivity of 83.3% and a specificity of 61.1%, though no independent prognostic value was demonstrated when compared to GCS.
Incomplete recovery (GOS-E ≤8)
Only two studies 46,72 including 2390 evaluated the accuracy of NfL for incomplete recovery. The AUC values ranged from 0.67 to 0.75. A threshold of 833.3 pg/mL was defined in one study. While one study 72 found an independent prognostic value of NfL, the other showed a very limited change in discriminative ability. 46
Post-concussion symptoms/syndrome
Seven studies including 2497 TBI cases evaluated the biomarker prognostic value for predicting post-concussion symptoms/syndrome.
Among the six studies reporting the accuracy of S100B, the majority (n = 5) of studies 39,45,48,53,61 did not find associations with post-concussion symptoms/syndrome. On the other hand, one study 60 assessing post-concussion symptoms 1 month after injury and adopting a modified RPQ reported fair discrimination (AUC 0.75) with independent prognostic value.
The prognostic accuracy of GFAP for post-concussion symptoms/syndrome was assessed in two studies, which found poor discriminative ability and limited improvement in conventional model performance. 46,50
The three studies, 46,50,61 which explored UCH-L1, NSE, tau, and neurofilament did not find an association with post-concussion symptoms/syndrome or improvement in other conventional prognostic models.
Discussion
This study provides the most comprehensive assessment and meta-analysis summary of the prognostic performance of TBI protein biomarkers, also comparing their prognostic ability across outcomes and beyond canonical existing prognostic factors. The literature shows unequivocally that mortality is strongly associated with blood levels of core biomarkers, in particular GFAP and UCH-L1. Furthermore, a 6-month poor outcome (GOS-E ≤4, GOS ≤3) is strongly associated with blood levels of NfL, and to a lesser extent with the other markers. However, there is currently limited evidence to judge their prognostic value when added to patient characteristics and other established risk factors. Furthermore, our review shows that many of the studies contain serious limitations, including unfocused design, univariate analyses, biased reporting, and having mainly been conducted in selected patient cohorts with relatively small sample sizes. Over 90% of studies (29/32) were considered at high risk of bias. These issues preclude firm conclusions and limit study finding generalizability across medically relevant patient subgroups, settings, and clinical scenarios, therefore, hindering the ability to establish their role to aid decision-making in clinical practice.
Predicting mortality
We found a better prognostic performance for predicting mortality compared to the other outcomes (Table 5), with results remarkably consistent across all biomarkers. A plausible explanation for this observation is that catastrophic structural damage is likely to be a common cause of mortality and is directly related to a rapid massive biomarker release into the blood, while for other outcomes other components (i.e., neuronal networks, rehabilitation strategies, emotional disorders, pre-existing problems, and extracranial injuries, among others) can play a substantial role. 20,73 –75 Comparing the two most studied markers, GFAP was found to outperform S100B, which also showed substantial heterogeneity in the prognostic performance of mortality and a wide range of sensitivity and specificity values (Fig. 4 and Supplementary Fig. S2). Most probably, this is related to the half-life and dynamics of S100B, which makes this marker concentration less stable as well as the extracranial injury influence which affects S100B concentrations. 76 This interpretation is also supported by the adjusted or incremental value of S100B which was independent and outperformed the other markers only when added to the IMPACT core model 46 which does not account for major extracranial injury. Hence, we suggest that distinct biomarkers or biomarker combinations should be integrated into the different prognostic models. This speculation is further in agreement with the observation that in all studies assessing the independent prognostic value of both GFAP and UCH-L1 over and above other prognostic factors, 23,46,51,66 this latter consistently outperformed GFAP in improving prognostic model performance. They are therefore not duplicative biomarkers but provide independent information as indicative of different pathological damages and pathomechanisms as well as due to the diverse associated biomarker temporal profile and dynamics. 28,77,78 Understanding these aspects is crucial for clinically applicable interpretation and effective integration of biomarkers into established prognostic models of TBI.
Interestingly, though less often studied, t-tau showed promising performance for mortality prediction both alone and when adjusted for other prognostic factors, deserving future evaluation.
Predicting outcome as assessed by GOS/GOS-E
For the unfavorable long-term outcome as assessed by GOS/GOS-E (GOS ≤3, GOS-E ≤4), the discrimination accuracy was less pronounced than for mortality. GFAP and UCH-L1 outperformed S100B, and also demonstrated independent contribution, increasing the discriminative ability of established models (i.e., IMPACT core and CRASH basic). 46,51 However, these findings should be interpreted with caution, owing to the substantial heterogeneity and variation in the quality of the articles. Although less often studied (three studies including 2477 patients with TBI) NfL showed the best pooled AUC (i.e., 0.83), suggesting that axonal destruction triggered by the injury can play a prominent role in the pathophysiological mechanisms underlying many of the long-term clinical sequelae. 79 In contrast, NfL has very little impact on predicting incomplete recovery. Moreover, although the information available is limited, there is no study indicating that the other assessed biomarkers are useful in predicting incomplete recovery.
Predicting post-concussion symptom/syndrome
With the exception of one study 60 adopting a modified RPQ, none of the studies reviewed were successful in showing the clear usefulness of biomarkers for predicting post-concussion symptoms or post-concussion syndrome. However, these studies were plagued by specific problems including a lack of clear, standardized definition, cutoff time (i.e., symptom duration), and consistent diagnostic criteria for diagnosing persistent post-concussion symptoms/syndrome, 80 which may have substantially impacted patient selection/classification and, therefore, diagnostic accuracy, validity, and reproducibility. Despite the important efforts undertaken, still no definitive, uniform and globally accepted consensus exists on the definition and diagnosis of persisting post-concussion symptoms, 80 –83 limiting the conclusions that can be drawn on the prognostic value of biomarkers in this clinical context.
Thresholds for prognostication
There are currently no generally accepted thresholds of biomarker levels for prognostication. The most important reason for this is that none of the biomarkers studied has been standardized through the use of certified reference materials, value-assigned by a certified reference method, and most are research-grade assays. 84 Hence, different laboratories and analytical platforms for the same analyte may give different absolute concentrations. 85,86 Standardization work is ongoing for NfL and tau proteins 87 but remains pending for the other markers. In the meantime, kit vendors or laboratories may develop assay-specific cut-points, if they ascertain longitudinal stability of the assay across kit lots. Among the included studies, 20 reporting cutoff values, the majority were marked by wide variations, possibly due to laboratory and assay variability, 84 but also due to a data-driven selection of the optimal cutoff value, which is known to lead to overly optimistic estimates of sensitivity and specificity. 88 Nonetheless, it is worth noting that several studies 23,55,64,66 independently derived from distinct cohorts and using different assays reported a GFAP cutoff of ∼1.5 ng/mL (1.44–1.69 ng/mL) for mortality prediction. This value was also validated in an independent cohort. 65 Results in relation to this level were, therefore, meta-analyzed to attempt an interpretation of data using the same cutoff. Pooling all independent data (256 patients with TBI) for ∼1.5 ng/mL cutoff produced a summary sensitivity of 78% (95% CI 67% to 85%) and a specificity of 79% (95% CI 64% to 89%). This means that if the pre-test probability is 36% (the median prevalence of mortality across the studies), then 36 of 100 tested patients will die; of them, between 24 and 31 will test positive (true positives) and between 5 and 12 will test negative (false negatives). Of the 64 without the target condition, between 41 and 57 will test negative (true negatives), and between 7 and 23 will test positive (false positives). However, those results should be interpreted with caution, in particular considering the heterogeneity of the specificities (Fig. 5C). The prognostic performance of the identified cutoff point will depend on which patients are considered for testing (i.e., injury severity and consequent pre-test probability of the relevant outcome), as well as the intended use including the time window for testing. Notably, Vos et al. 65 found the highest specificity (93%) and Positive Predictive Value (PPV) (81%). We speculate that this finding could be related, besides the less severe population enrolled (GCS 3–12), to the time between TBI and blood sampling (median 61 min after injury). It is pathobiologically plausible that a critical injury causes massive destruction of brain tissue, thus resulting in a rapid release and earlier appearance of high GFAP concentrations (above the cutoff point) in the serum in patients who died.
However, we need to acknowledge that while the ease of interpretation resulting from the dichotomization of continuous biomarkers is medically appealing, the cutoff approach comes to a significant cost, including considerable loss of prognostic information and clinical insights, the use of a single variable to define the risk groups and loss of statistical efficiency. 89 In addition, the biomarker categorization choice and cutoff definition should be guided by a biological rationale, clear knowledge of the analytical platform and assay, and study design. Future strategies should combine the two approaches, always taking into account the use of biomarker values and analyzing them continuously.
Design of future prognostic biomarkers studies
Taken together, these observations point out the need to optimize the design of future prognostic biomarkers to understand how best these tests can be utilized in the clinical practice, with a focus on the medical utility, clearly defining indication for use (e.g., rule in), settings and “how-to-use” instructions (e.g., prognostication time window), and the targeted patient population. It is essential to consider biomarkers together with clinical characteristics (e.g., the GCS and pupillary reactivity), imaging (CT abnormalities), and risk modifiers (specifically age). We found that most studies had a high risk of bias for the participant selection domains (Fig. 3), with the included patients judged relatively representative of the target population for the biomarkers test. Specifically, the inclusion of isolated TBI or limited GCS ranges reflects patient subgroups. It may explain some of the heterogeneity in prognostic performance between studies. Moreover, the exclusion of subjects with no indication for CT scanning or without outcome assessment may convey an overly optimistic picture of the value of biomarkers.
Previous studies suggested the possible susceptibility of TBI biomarker concentrations to physiological variability across age, sex, and race. 90 –94 Therefore, it may be necessary to account for these potential confounding factors in the definition of pathological levels for prognostication in real-world settings. However, the included studies have mainly been conducted in selected patient cohorts of predominantly young males (only three studies included participants with a mean/median age of 50 years or above). Even more strikingly, only six studies reported race data, also demonstrating underrepresentation of Black and Asian patients and subjects from other minority groups. Hence, we were unable to investigate the biomarker prognostic accuracy within clinically important subgroups, such as females, older patients, and those with obesity or other comorbidities and neurodegenerative conditions. These groups are increasingly prevalent among patients with TBI. 1,3,95,96 Future work must address the effect of patient characteristics, including racial groups, on biomarker values and performance, and their implications for interpretability in clinical practice.
Importantly, the published reports were from a limited number of countries predominantly from high-income regions (Fig. 2). This, while limiting external generalizability and precluding universal applicability implementation, further highlights the disparities that exist around the world in terms of health care systems and research. This observation is of particular concern, as the highest incidence and overall burden related to TBIs is observed in lower-middle-income countries. 6,97,98 Moreover, these underserved and austere environments with limited facilities and access to medical care can immensely benefit from easy inexpensive prognostic blood-based tests with a potential major health impact. It is therefore essential that studies are performed in these countries and in the process of developing future recommendations and evidence-based guidelines, the specific characteristics and needs of low-income settings are taken into account. Transforming disparities and inequities into an enrichment of our knowledge and medical practice.
We also noted that most often, studies failed to have prespecified protocols and statistical analytic plans with poor documentation of the handling of missing data, multivariable prognostic models, and variable selection. These are not trivial problems. In order to be integrated into medical practice, a critical point that needs to be addressed by prognostic biomarker studies is the incremental value over and above established risk factors and models. It was evident from our review that many studies did not make any attempt to adjust for the associations of these variables. If adjusted, different sets of factors and models were used. 51 The resulting kaleidoscope of findings precluded comparisons and firm conclusions about the magnitude and independence of the association between TBI biomarker tests and the investigated outcomes. Hence, we emphasize that it is necessary to define a clear approach to adjustment (e.g., a core set of established prognostic factors routinely used for prognostication in the clinical population of interest) 15 that can ultimately demonstrate that biomarker results provide information that contributes to and improves patient management (“actionable” biomarkers).
Limitations
We acknowledge several further limitations. First, there was a lack of a uniform definition of TBI across the included studies. As a result, diagnostic adjudication has inherent uncertainty and variability, which may, partly, explain the heterogeneity we observed in prognostic performance. Second, we were unable to investigate the effect of patient characteristics such as age and comorbidities, that are known to influence biomarker concentrations and potentially affect prognostic performance. 99 Such analysis would have required IPD. However, while IPD meta-analysis is desirable, allowing for more robust analysis and higher levels of evidence, 100 and also supported by the U.S. National Institutes of Health and European Commission with their data-sharing mandate to adhere to the findable, accessible, interoperable, and reusable principles, 101 it was beyond the scope of this review. In addition, legal, regulatory, and ethical challenges in gaining access to 102 and harmonizing IPD remain and are substantial. Despite concerted, collaborative efforts to share TBI research, 103 –106 future work is needed to develop standards and tools to harmonize biomarker measures from distinct data sets, ensuring their comparability and meaningful integration across studies. Third, there was considerable variability in the target population and clinical context, including prognostication time window and clinical setting (Supplementary Table S3), precluding the analysis of subgroups and limiting the interpretability of findings and clinical translation with specific intended use. Finally, potential between-lab, inter-assay, and lot-to-lot variability, less established and validated assays, and the use of different sample types (serum vs. plasma) can represent a major source of heterogeneity. However, due to the limited number of studies and the wide variations in the analytical methods used (Table 2), we were not able to perform any sensitivity analyses, hence our results will have to be interpreted with caution. As previously discussed, international standardization efforts are currently ongoing to establish quality control programs to monitor measurement variability for different assays/platforms, define standardized operating procedures, and develop certified reference materials and reference methods as well as novel approaches for harmonization of readouts across platforms (e.g., through the development of method-specific correction algorithms). This extensive standardization at different levels (preanalytical, analytical) is of utmost importance for the achievement of valid, reproducible, and comparable biomarker measures that can be clinically implemented worldwide and facilitate the successful adoption of a new TBI classification on the basis of biomarker profiles (https://www.ninds.nih.gov/news-events/events/ninds-tbi-classification-and-nomenclature-workshop).
Conclusions
Admission concentrations of blood-based TBI biomarkers are strongly associated with mortality and to a lesser extent with 6-month poor outcome (GOS-E ≤4, GOS ≤3). Currently, there is insufficient evidence to determine an improvement in risk stratification when these biomarkers are added to established risk prediction factors and models and to define specific contexts of use. Large-scale collaborative studies using unbiased analysis methods and rigorous designs are needed to demonstrate the clinical utility of biomarkers beyond the standard-of-care-based prognostic factors, paving the way to transform medical practice.
Transparency, Rigor, and Reproducibility
The study design adheres to the methodological guidelines of the PROGRESS Framework (prognostic factor research) and is reported in accordance with PRISMA and REMARK recommendations. The protocol was prospectively registered on a public registry (https://www.crd.york.ac.uk/prospero/) (PROSPERO CRD42016048189). For more details related to transparency, rigor, and reproducibility, please refer to the “Methods” section.
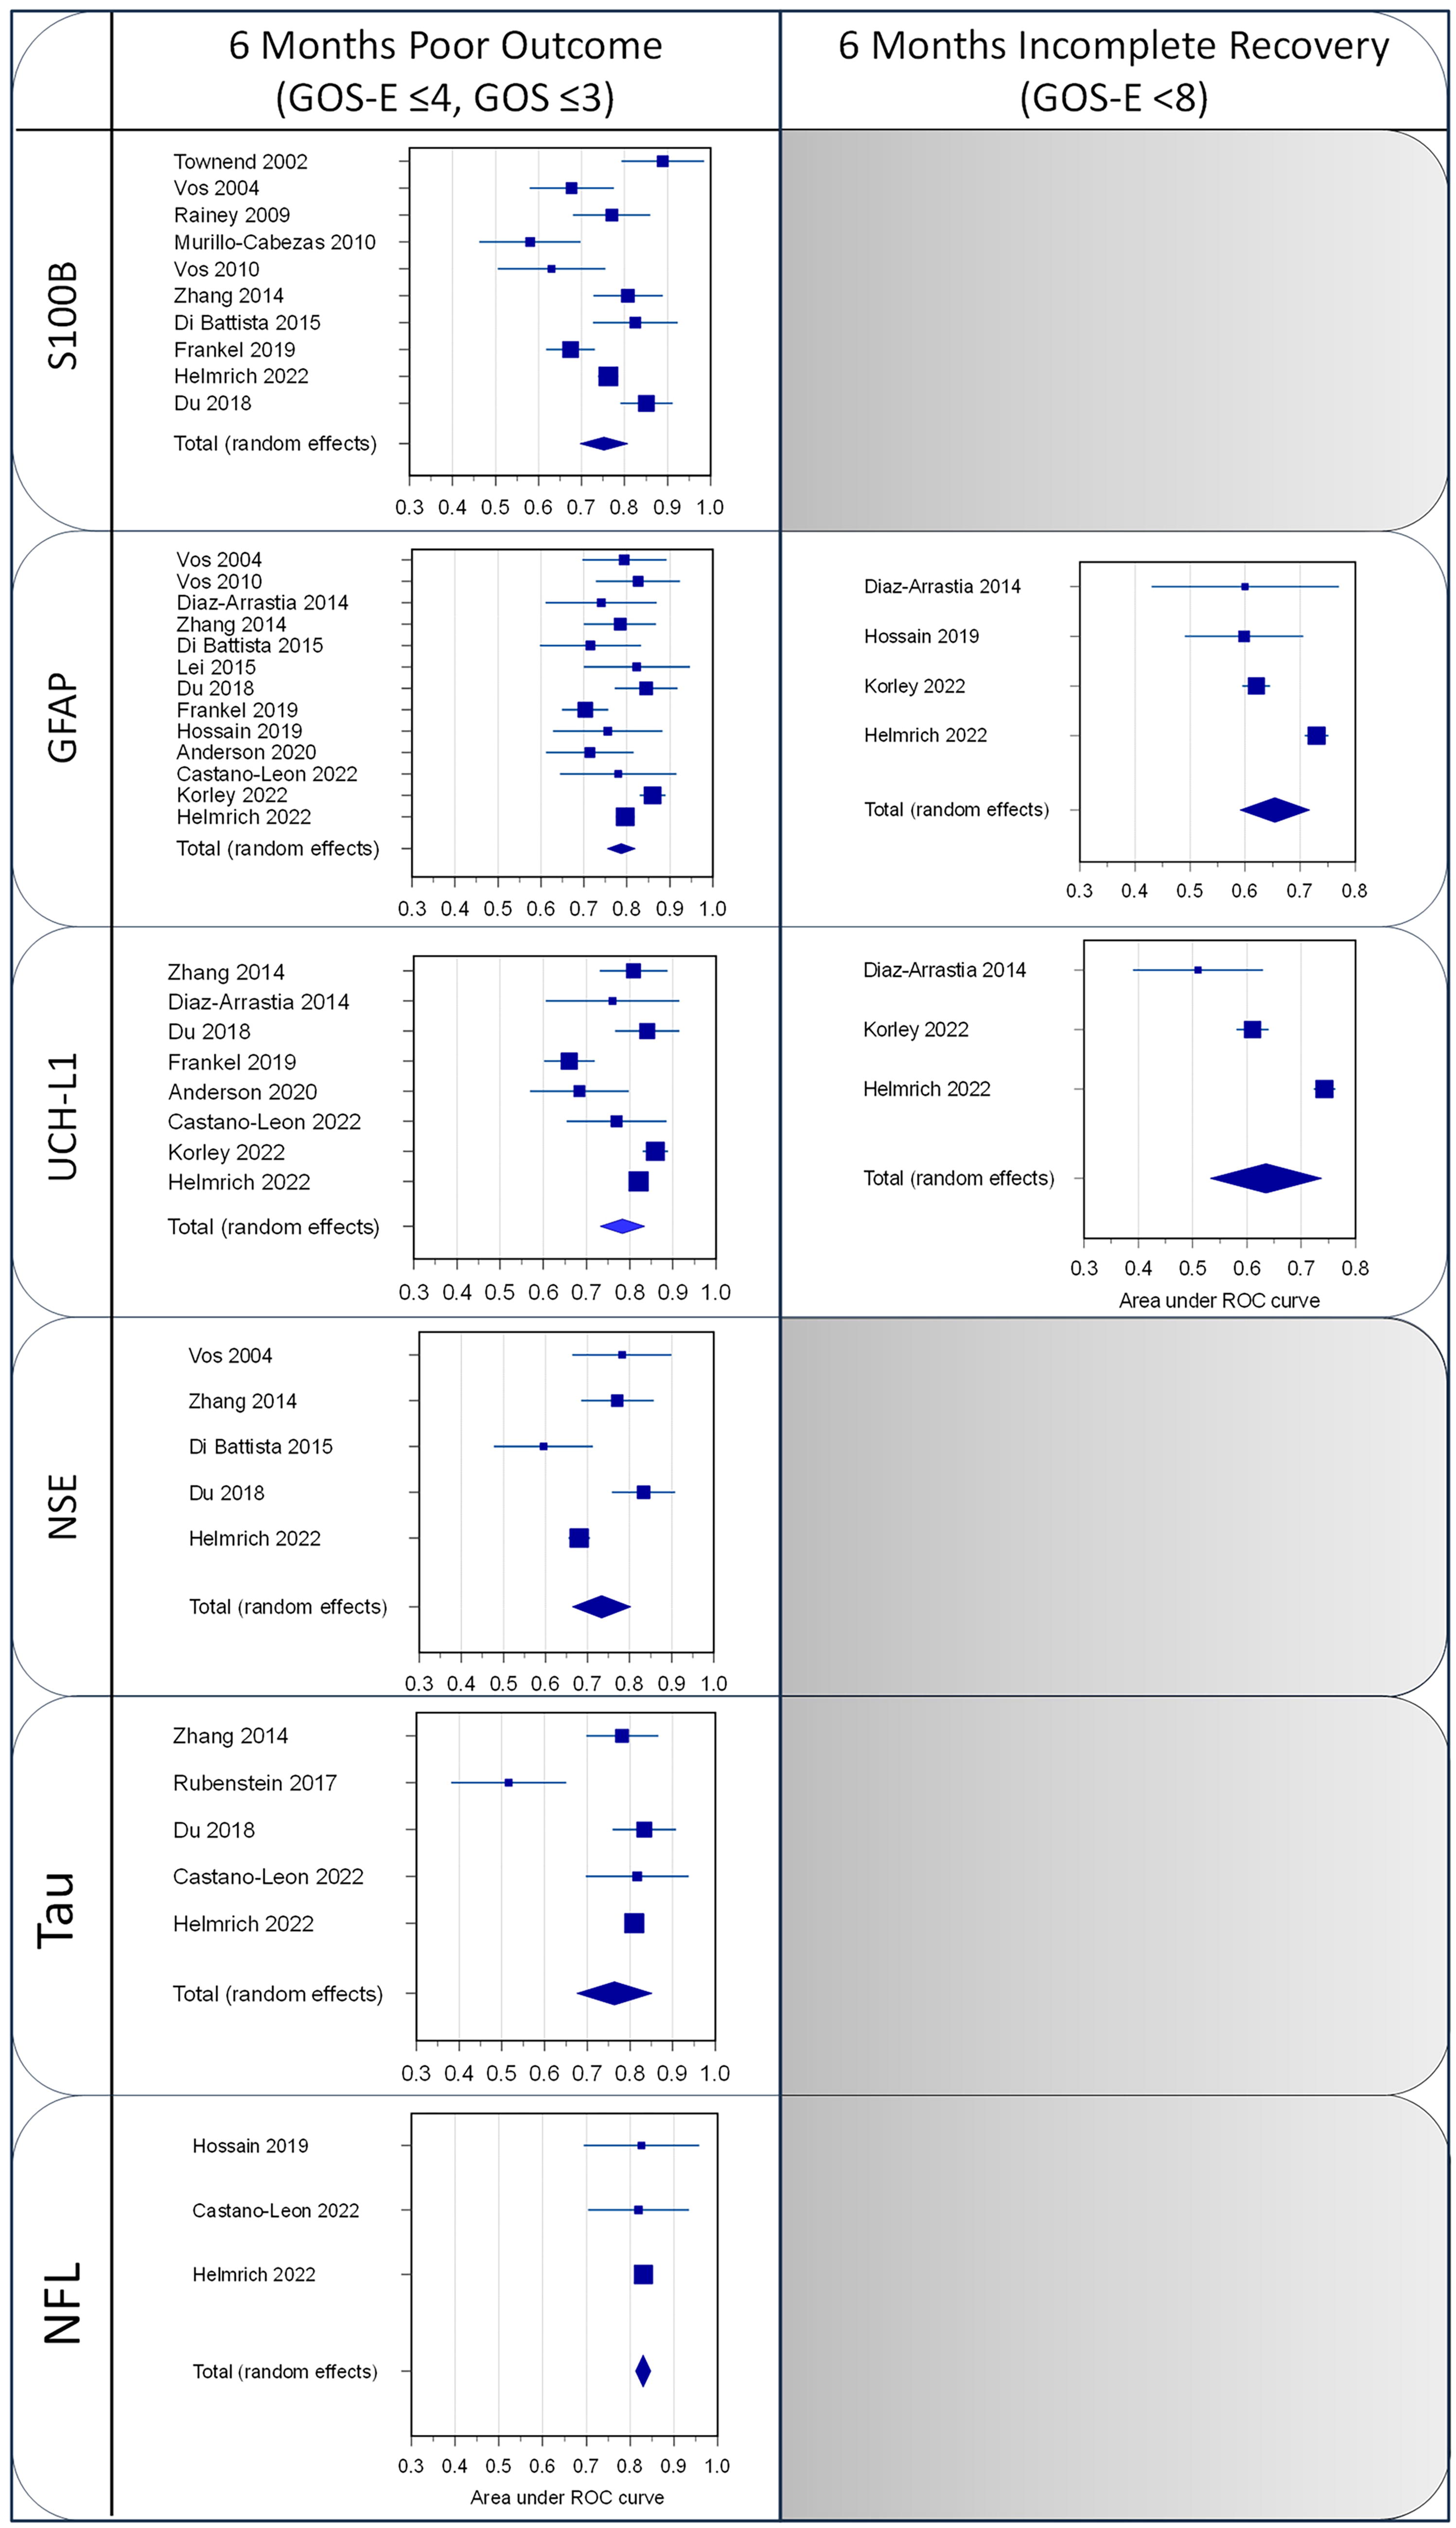
Forest plots of the AUC for the outcome of the different studies and the weighted summary AUC with 95% CI under the random effects model. AUC, area under the curve; CI, confidence interval.
Footnotes
Authors’ Contributions
S.M., A.B., and A.I.R.M. were responsible for the conception and design of the study. S.M., E.C., K.A., and A.B. drafted the protocol. S.M., E.C., and K.A. developed the search strategy and did the electronic searches. S.M., K.A., and E.C. determined the eligibility of search results, extracted data from included studies, and carried out methodological quality assessment. S.M. and E.S. performed and reviewed the analyses. S.M. and A.I.R.M. drafted the article. All authors participated in the interpretation of the data, the critical review of the article for important intellectual content, and approved the final version. S.M. and A.I.R.M. are guarantors.
Author Disclosure Statement
No competing conflict of interest is declared.
Funding Information
This work was supported by the European Union FP 7th Framework program (CENTER-TBI; Grant number: grant 602150).
Supplementary Material
Supplementary Appendix A1
Supplementary Appendix A2
Supplementary Figure S1
Supplementary Figure S2
Supplementary Table S1
Supplementary Table S2
Supplementary Table S3
References
Supplementary Material
Please find the following supplemental material available below.
For Open Access articles published under a Creative Commons License, all supplemental material carries the same license as the article it is associated with.
For non-Open Access articles published, all supplemental material carries a non-exclusive license, and permission requests for re-use of supplemental material or any part of supplemental material shall be sent directly to the copyright owner as specified in the copyright notice associated with the article.