
Abstract
The purpose of this study was to differentiate clinically meaningful improvement or deterioration from normal fluctuations in patients with disorders of consciousness (DoC) following severe brain injury. We computed indices of responsiveness for the Coma Recovery Scale-Revised (CRS-R) using data from a clinical trial of 180 participants with DoC. We used CRS-R scores from baseline (enrollment in a clinical trial) and a 4-week follow-up assessment period for these calculations. To improve precision, we transformed ordinal CRS-R total scores (0–23 points) to equal-interval measures on a 0–100 unit scale using Rasch Measurement theory. Using the 0–100 unit total Rasch measures, we calculated distribution-based 0.5 standard deviation (SD) minimal clinically important difference, minimal detectable change using 95% confidence intervals, and conditional minimal detectable change using 95% confidence intervals. The distribution-based minimal clinically important difference evaluates group-level changes, whereas the minimal detectable change values evaluate individual-level changes. The minimal clinically important difference and minimal detectable change are derived using the overall variability across total measures at baseline and 4 weeks. The conditional minimal detectable change is generated for each possible pair of CRS-R Rasch person measures and accounts for variation in standard error across the scale. We applied these indices to determine the proportions of participants who made a change beyond measurement error within each of the two subgroups, based on treatment arm (amantadine hydrochloride or placebo) or categorization of baseline Rasch person measure to states of consciousness (i.e., unresponsive wakefulness syndrome and minimally conscious state). We compared the proportion of participants in each treatment arm who made a change according to the minimal detectable change and determined whether they also changed to another state of consciousness. CRS-R indices of responsiveness (using the 0–100 transformed scale) were as follows: 0.5SD minimal clinically important difference = 9 units, minimal detectable change = 11 units, and the conditional minimal detectable change ranged from 11 to 42 units. For the amantadine and placebo groups, 70% and 58% of participants showed change beyond measurement error using the minimal detectable change, respectively. For the unresponsive wakefulness syndrome and minimally conscious state groups, 54% and 69% of participants changed beyond measurement error using the minimal detectable change, respectively. Among 115 participants (64% of the total sample) who made a change beyond measurement error, 29 participants (25%) did not change state of consciousness. CRS-R indices of responsiveness can support clinicians and researchers in discerning when behavioral changes in patients with DoC exceed measurement error. Notably, the minimal detectable change can support the detection of patients who make a “true” change within or across states of consciousness. Our findings highlight that the continued use of ordinal scores may result in incorrect inferences about the degree and relevance of a change score.
Introduction
Accurate assessment of neurobehavioral function is critical to ensuring that individuals with disorders of consciousness (DoC) have access to appropriate rehabilitative care. 1,2 Individuals with DoC can present in one of three clinical states: comatose, unresponsive wakefulness syndrome (UWS), and minimally conscious state (MCS). Individuals in UWS do not exhibit signs of self or environmental awareness whereas those in a MCS do so inconsistently. 1 Emergence from MCS (eMCS) is signaled by recovery of functional object use or functional communication. 3 Consistently following a command has also been proposed as an eMCS criterion. 4,5 Clinical behaviors (i.e., localization to sound or functional object use) are aligned to each state of consciousness (i.e., UWS, MCS, and eMCS) and are known as the Aspen consensus criteria. 6 Assessing state of consciousness and treatment effectiveness is uniquely challenging as fluctuation in behavioral response to stimuli is common in DoC 7 and small day-to-day changes may be within measurement error. Given these challenges, the 2018 clinical practice guidelines recommend the use of standardized neurobehavioral assessments that can produce reliable and valid scores that are sensitive to change. 1 A systematic review identified a critical gap in DoC measurement related to the need to detect change beyond measurement error. 8
To the best of our knowledge, only two standardized behavioral assessments for individuals in DoC—the Disorders of Consciousness Scale and Coma/Near-Coma Scale—have established traditional indices of responsiveness. 9 –11 A third assessment, the Coma Recovery Scale-Revised 12 (CRS-R), has identified probabilistic values for minimal clinically important difference where CRS-R total scores were utilized to determine how likely a change in the CRS-R total score was associated with a change in Aspen-derived state of consciousness (i.e., UWS to MCS). 13 However, the use of a single probabilistic minimal clinically important difference across the range of total scores is not recommended. 13 Consequently, the CRS-R, which serves as the reference standard in DoC assessment, lacks a responsiveness index that can be used along the continuum of the CRS-R total score, which can guide interpretation of change scores at the individual and group levels. 8 As a result, assessors are limited to examining individual change between behavioral states of consciousness. Changes in the CRS-R total raw score or subscale scores that are within behavioral states may be missed. Furthermore, changes across behavioral states may not exceed measurement error and may be misinterpreted.
Prior work applied Rasch Measurement theory to the CRS-R. 4 The Rasch Measurement theory is distinct from classical test theory, which is traditionally how rehabilitation assessments were developed. 14 The Rasch Measurement theory purports that assessment items must form a hierarchy that reflects an underlying latent trait, such as neurobehavioral function. This conceptual hierarchy is described by the rating scale categories which generates ordinal total raw scores. The ordinal total raw scores are transformedinto equal-interval Rasch person measures (akin to total scores). A significant limitation in using change scores from ordinal assessments is that they are often misinterpreted in clinical practice, 15 particularly at the ends of the score range. 16 Changes from ordinal scores may support inferences about whether a patient improved or declined but changes across the assessment’s total raw score range are not comparable. Unlike ordinal scores, a one-unit change on a Rasch-transformed person measure is comparable at any point along the assessment. For example, a four-unit change represents twice the progress of a two-unit change on an equal-interval assessment, but not on an ordinal assessment. Thus, Rasch-transformed CRS-R person measures may be used to generate more precise indices of responsiveness.
Establishing indices of responsiveness for the CRS-R is critical to differentiate true improvement or deterioration from normal fluctuations in DoC. Indices of responsiveness include the minimal clinically important difference and minimal detectable change. These two types of indices of responsiveness can be computed when a dataset includes participants who were assessed at two comparable time points (e.g., 4 weeks apart). However, the calculations utilized for the indices of responsiveness impact whether they should be applied to group means or individual change scores.
We describe the distribution-based minimal clinically important difference, which sets thresholds for minimally important change but should only be applied to group comparisons because they are based on the magnitude of variation in clinical groups. 17 Anchor-based minimal clinically important difference estimates align the patient’s change in assessment to an external criterion that is considered important to family or clinicians. 18,19 To date, our research team is unaware of an external criterion that is available for use with the family of individuals in DoC, limiting the ability to leverage the anchor-based approach.
We also describe two approaches for calculating the minimal detectable change, which leverages the assessment’s person separation reliability (akin to Cronbach’s alpha). The CRS-R Wright’s person separation reliability indicates the assessment is precise for making consistently reliable individual-level decisions. 4 Both approaches enable CRS-R assessors (i.e., researchers and clinicians) to determine whether change between any two assessment points for an individual is “true change” exceeding measurement error. The traditional minimal detectable change values can vary based on the preferred confidence around the score. We also describe a contemporary approach called the conditional minimal detectable change. 16 This approach produces a unique minimal detectable change based on the pooled standard error for each possible pair of Rasch person measures. In contrast to the traditional minimal detectable change, the conditional minimal detectable change does not assume that measurement error is constant across the scale range of the CRS-R. For clinicians, evaluating individual-level change is important to understand whether a patient is showing meaningful change. Hospital administrators or rehabilitation managers may use group-level change for program evaluation. For researchers, indices of responsiveness are one approach for evaluating group-level changes to determine the efficacy or effectiveness of specific treatments (e.g., amantadine hydrochloride [HCl] 20 or familiar auditory sensory training 21 ).
Materials and Methods
Objectives
The primary objective of this study was to differentiate clinically meaningful changes (i.e., improvement or deterioration) from normal fluctuations in participants with DoC following a severe brain injury. We aimed to establish CRS-R indices of responsiveness using Rasch person measures (0–100 unit scale) from baseline CRS-R assessment (pre-treatment) to Week 4 (post-treatment) for individuals who were enrolled in a clinical trial. 20 First, we evaluated the magnitude of change from baseline to Week 4 by calculating the effect size and standardized response mean. Second, we calculated three types of indices of responsiveness: (1) distribution-based minimal clinically important differences, which are appropriate for evaluating group-level differences/changes; (2) minimal detectable change, which is suitable for evaluating individual-level change; and (3) conditional minimal detectable change for each possible pair of CRS-R Rasch person measures. Third, we applied the indices of responsiveness to the dataset to demonstrate the utility of these indices for interpreting change.
Study design and participants
This secondary analysis of data included participants from the “Placebo-Controlled Trial of Amantadine for Severe Traumatic Brain Injury” (ClinicalTrials.gov number, NCT00970944). 20 Participants for the clinical trial were recruited from 11 clinical sites across 3 countries. All participants were between 16 and 65 years of age, sustained a traumatic brain injury 4–16 weeks before enrollment, and were either in the UWS or MCS (defined by a score greater than 11 on the Disability Rating Scale and an inability to consistently follow commands and communicate reliably as assessed by the CRS-R). Participants were randomly assigned to either the experimental group (i.e., received amantadine HCl) or to the placebo group. All participants received standard-of-care inpatient rehabilitation services throughout the trial. The CRS-R was administered at Baseline, Week 4 (after treatment), and Week 6 (after a 2-week drug washout period). 20 We analyzed data from the CRS-R at two time points: Baseline (i.e., study enrollment) and Week 4 (post-treatment). The dataset contains one CRS-R record per participant for each time point. Previous research suggests that administering the CRS-R multiple times may improve diagnostic accuracy. 22 However, our work focuses on quantifying variation across CRS-R administrations; therefore, utilizing single CRS-R records is appropriate for our study design. Ethics approval for this secondary data analysis was obtained from Colorado State University.
Coma recovery Scale-Revised
The CRS-R has six subscales: auditory, visual, motor, oromotor/verbal, communication, and arousal. Each subscale is arranged hierarchically and results in a raw subscale score. 23 The raw scores from each of the six subscales are summed to generate a total raw score that ranges from 0 to 23 points. In previous work, we transformed the CRS-R ordinal raw scores into equal interval measures ranging from −6.52 to 5.85 log-odds units (also called logits; Rasch model units). 4 For ease of interpretation, we transformed the logits to 0–100 units (Table 1). Throughout the article, the term “points” reflects a CRS-R raw score on the 0 to 23 scale, and the term “units” reflects a CRS-R Rasch person measure (akin to a total score) on the 0–100 transformed scale. Our prior work determined that Wright’s person separation reliability was 0.95, indicating the CRS-R is consistently reliable for supporting individual-level clinical decisions. 4 Wright’s person separation reliability identifies how well the assessment discriminates levels of person ability across the sample. A person separation reliability index of more than 0.90 typically equates to delineating into three or four groups within the sample. 24 We used this reliability index to calculate the standard error of measurement.
Transformation Table to Convert CRS-R Total Raw Scores to Rasch Person Measures Using a 100-Point Equal-Interval Scale
CRS-R, Coma Recovery Scale-Revised.
For these analyses, we utilized well-established criteria for DoC states of consciousness to classify records. 1,25 Diagnostic criteria for states of consciousness based on CRS-R items have been established using consensus-based clinical criteria developed by the Aspen Workgroup. 6 To classify a CRS-R record as reflecting eMCS, the participant needed to achieve either a raw score of 2 on the communication or 6 on the motor (i.e., functional communication or object use) subscales. To classify a CRS-R record as reflecting MCS, the participant needed to achieve either a 1 on communication (i.e., intentional but nonfunctional yes/no communication), a 3 or higher on the auditory subscale (command-following), a 2 or higher on the visual subscale (visual fixation or better), a 3 or higher on the motor subscale (localization to noxious stimulation, or better), or a 3 on the oromotor/verbal subscale (intelligible verbalization). If none of these criteria was met, the CRS-R record was classified as reflecting UWS.
Data analyses
We conducted analyses on 180 participants, which is sufficiently robust for developing recommendations about measurement error. 26 Figure 1 provides a schematic for the analysis process. For all participants, we computed the CRS-R’s indices of responsiveness using transformed Rasch person measures, which range from 0 to 100 Rasch units, at Baseline and Week 4. 20 To apply the indices of responsiveness, we utilized the following two methods of delineating participants: (1) treatment arm assignment (i.e., amantadine HCl or placebo) and (2) participant’s alignment with Aspen criteria at baseline (i.e., MCS or UWS). Only one participant was classified as eMCS at baseline. Rather than omitting this participant’s CRS-R record, we included them in the MCS group because their Rasch person measure was only 69 units, while other participants’ CRS-R records categorized as MCS were as high as 77 units. We hypothesized that the effect size and proportion of participants who improved beyond measurement error would be greater for the amantadine HCl group compared with the placebo group. Based on previous literature, we also hypothesized that the proportion of participants who improved beyond measurement error would be greater for participants classified as MCS compared with UWS. 27 –30
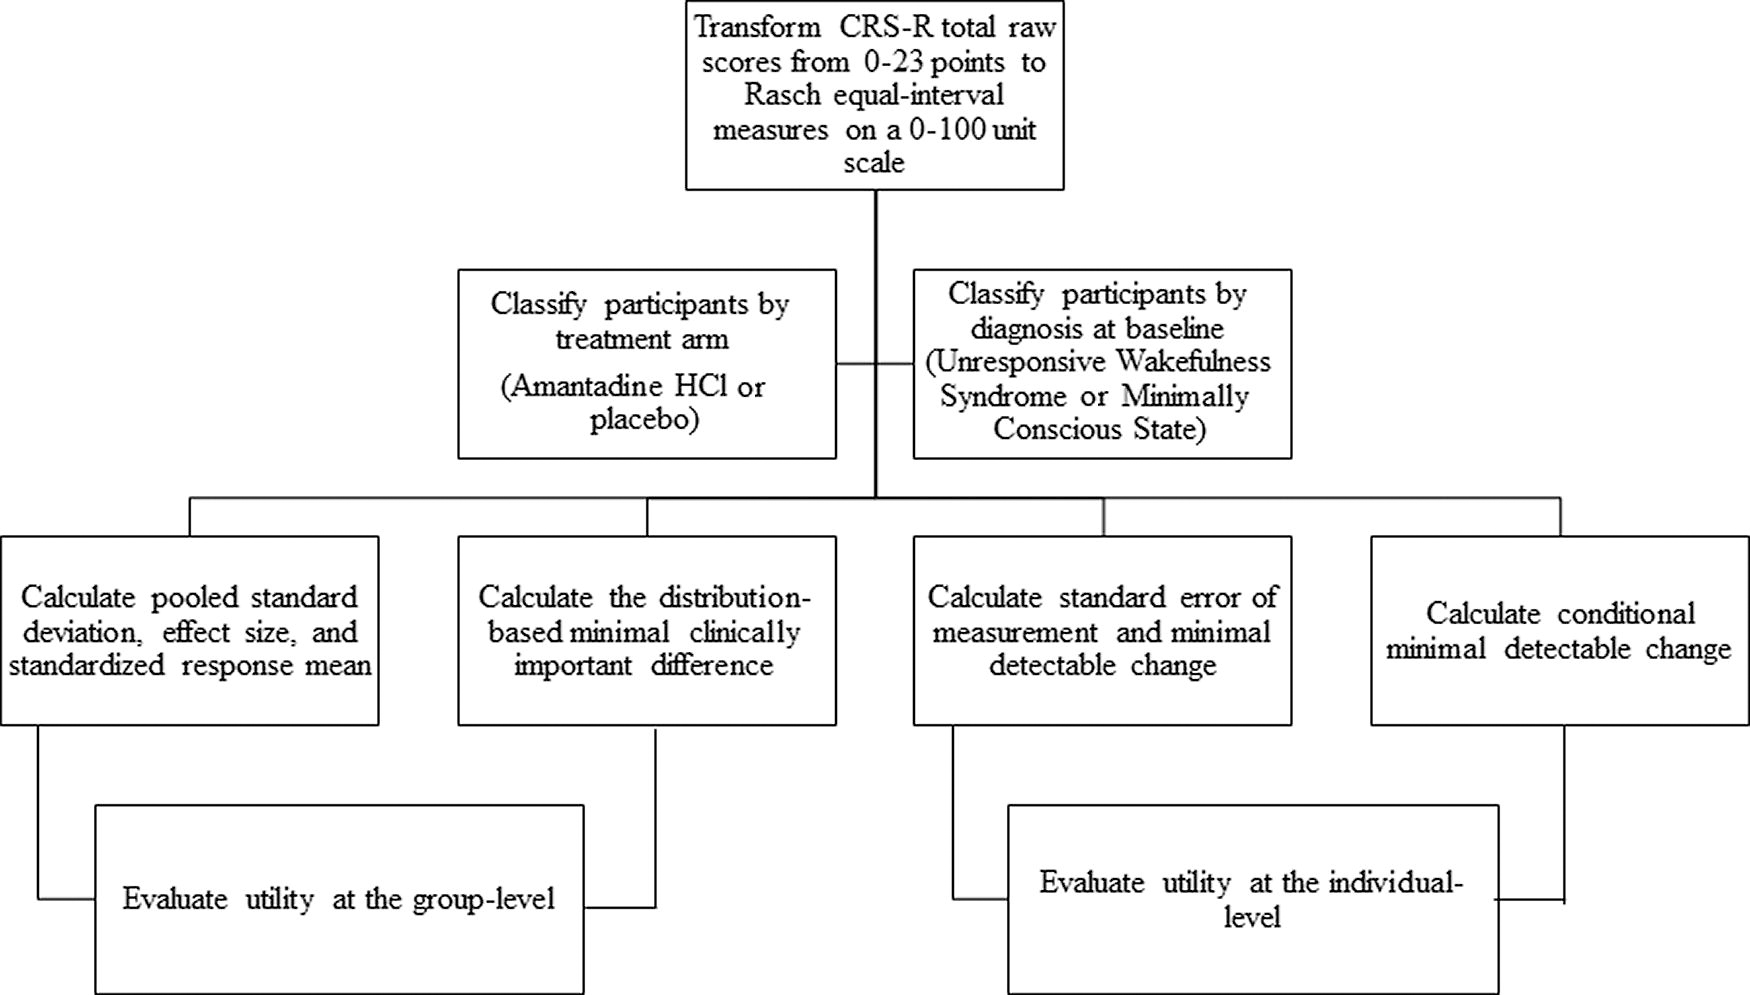
Analysis process.
Magnitude of change across time points
The Rasch person measures (0–100 units) provided equal interval–level data; therefore, we calculated pooled standard deviation (SDpooled), effect size (Cohen’s d), and the standardized response mean for all participants, by treatment arm, and by Aspen-based state of consciousness using MedCalc version 17.6. 31 Effect size is not generally impacted by sample size but may vary among cohorts when the variability at baseline is not comparable. 32 Effect size was calculated by dividing the difference between the mean Rasch person measures at each time point (i.e., Baseline and Week 4) by the SDpooled. Standardized response mean is the average difference divided by the standard deviation of paired differences and thus, may vary due to treatment effectiveness. 32 Both the effect size and standardized response mean provide information about the magnitude and directionality of change. Effect size and standardized response mean at 0.20, 0.50, and 0.80 were interpreted as small, moderate, and large responsiveness, respectively. 33
Indices of responsiveness for interpreting group-level change
We calculated the distribution-based minimal clinically important differences using the SDpooled for the baseline and 4-week measures. We calculated three minimal clinically important differences based on thresholds described by Eton: .20SDpooled (small), .33SDpooled (minimally important), and .50SDpooled (moderate). 34,35 Because the minimal clinically important difference estimates are known to vary by baseline severity, we also calculated separate distribution-based minimal clinically important differences for participants classified as UWS or MCS at baseline. 36
Indices of responsiveness for interpreting change in an individual
We calculated the standard error of measurement using the following formula: Standard Error of Measurement = SDpooled (
Traditional minimal detectable change calculations assume that error is constant across the scale. However, in the Rasch model, each possible Rasch person measure across the scale is associated with its own standard error. To account for this variation, we calculated conditional minimal detectable change for each pair of Rasch person measures on the 0–100 unit scale using a 95% confidence interval.
16
Conditional Minimal Detectable Change95 = ([Standard Error Measure1 + Standard Error Measure2]/2) × 1.96 ×
Application of indices of responsiveness
We applied the indices of responsiveness to two participant subgroups defined by treatment arm (amantadine HCl or placebo) or alignment with Aspen-based state of consciousness at baseline (MCS or UWS). We evaluated the proportion of participants within each group who improved beyond CRS-R measurement error from Baseline to Week 4, using both the minimal detectable change95 and the conditional minimal detectable change95. For each of the two subgroups (i.e., treatment arm and baseline state), we conducted 2 × 2 chi-squared tests to examine the difference between the independent variable (i.e., treatment arm or baseline state) and improver status (i.e., improvers vs. non-improvers based on the minimal detectable change95 and conditional minimal detectable change95). Finally, we calculated (1) the number of participants who demonstrated a change beyond measurement error and a change in state of consciousness based on the Aspen criteria, and (2) the number of participants who did not demonstrate a change beyond measurement error but did make a change in state of consciousness. These analyses allowed us to evaluate the number of participants whose improvement may have been missed or misinterpreted if only relying on change into another state of consciousness.
Results
Participants
Table 2 describes the 180 participants, subdivided by treatment arm and alignment with Aspen criteria at baseline assessment. The MCS group had a significantly shorter length of stay than the UWS group [mean difference = 6.5 days, t(179) = 2.3, p = 0.02]; however, days post-injury at baseline assessment did not differ between the two groups.
Demographic Information about Participants
Reported percentages may not equal 100% due to rounding.
The MCS group had a significantly shorter stay in acute care than the UWS group, (t = 2.3, p = 0.02).
Motor Vehicle Accident includes single and multiple vehicle accidents, motorcycle accidents, and accidents in which pedestrians were struck by vehicles.
Falls include falls from standing height, falls from greater than standing height, and falls down the stairs.
Other causes of injury in this dataset included bicycle accidents, blunt assault, sports-related injury, other causes, and unknown causes.
MCS, minimally conscious state; eMCS, emerged from minimally conscious state; UWS, unresponsive wakefulness syndrome; SD, standard deviation.
Magnitude of change across time points
For all participants (n = 180), the CRS-R total Rasch person measure increased from Baseline to Week 4 by a mean of 18.6 units on the transformed 0–100 scale, yielding a Cohen’s d effect size of 1.1 [95% confidence interval 0.9–1.2] (Table 3). The standardized response mean was 1.1, confirming a large positive effect regardless of within-sample variability.
Descriptive CRS-R Statistics
MCS, minimally conscious state; UWS, unresponsive wakefulness syndrome.
Indices of responsiveness for interpreting group-level change
The distribution-based minimal clinically important differences values ranged from 4 (.20SD) to 9 (.50SD) Rasch units (Table 4). Across all participants (n = 180), the CRS-R mean Rasch person measure increase from Baseline to Week 4 of 18.6 units would be considered more than a moderate improvement based on the .50SD minimal clinically important difference. Supplementary Table S1 displays minimal clinically important difference values based on the alignment of the first record with states of consciousness at baseline.
Indices of Responsiveness to Evaluate Group-Level Changes Using the 0–100 CRS-R Person Measures
SD, standard deviation; MCID, minimal clinically important difference.
Indices of responsiveness for interpreting change in an individual
Our analyses of the total sample yielded a standard error of measurement of 6 or 8 units using the 90% and 95% confidence, respectively (Table 5). The traditional standard error of measurement indicates the range within which there is a 68% chanve that the patient's true CRS-R Rasch person measures exists (±4 units of their observed Rasch person measures). To be more certain of the true measure range, the standard error of measurement95 (8 units) indicates that the patient's true CRS-R Rasch person measures are between ±8 units of their observed Rasch person measures 95% of the time. The minimal detectable change was 9 or 11 units using 90% and 95% confidence, respectively (Table 5). The more conservative conditional minimal detectable change (Fig. 2) accounted for variation in standard errors across the equal interval transformed 0–100 unit measures. The conditional minimal detectable change values ranged from 11 for change measures near the middle of the scale to 42 units for change measures at the far ends of the scale. Supplementary Figure S1 provides a clinical look-up table to determine the conditional minimal detectable change95 for any pair of raw scores or Rasch person measures and visualizes whether the difference score/measure represents change beyond measurement error.
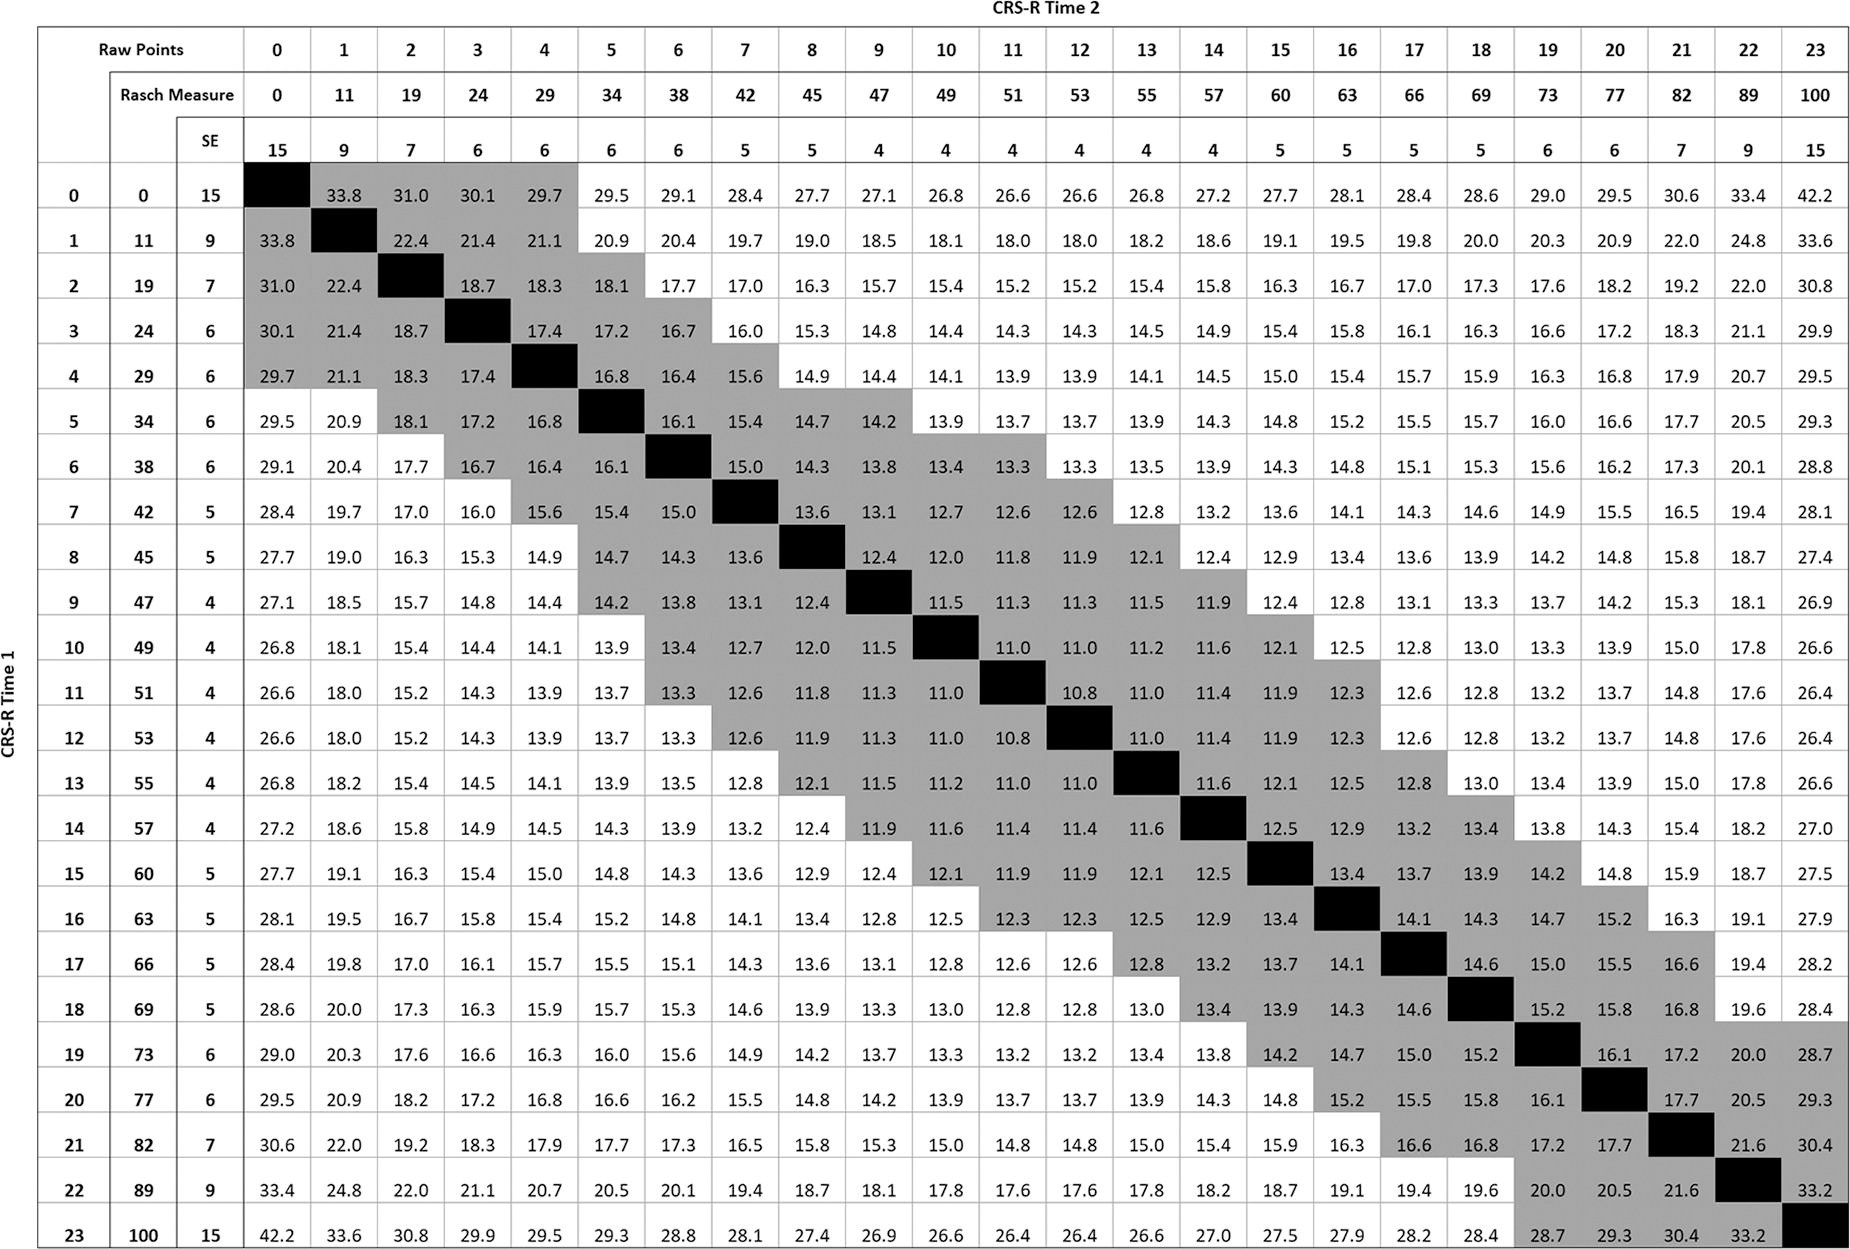
Conditional minimal detectable change values with a 95% confidence interval for pairs of CRS-R measures (0–100 units). Black indicates no change; gray indicates change within measurement error; measures in the upper right triangle indicate positive change (i.e., improvement); measures in the lower left triangle indicate negative change (i.e., decline). cMDC; CRS-R, Coma Recovery Scale-Revised.
Indices of Responsiveness to Apply at the Individual Level Using the 0–100 CRS-R Person Measures
The SEM reported is based on 1 standard deviation.
SEM, standard error of measurement; MDC95, minimal detectable change using 95% confidence interval; MDC90, minimal detectable change using 90% confidence interval.
Application of indices of responsiveness: Comparisons between participant groups
Treatment arm
Table 3 provides CRS-R means at Baseline and Week 4 for the amantadine and placebo groups. For both groups, there was a large, statistically significant positive change to the mean Rasch person measures indicating increased neurobehavioral function (amantadine HCl = 20.4 units, effect size = 1.2 [95% CI: 1.0–1.4]; placebo = 16.8 units, effect size = 0.9 [95% CI: 0.7–1.1]). Standardized response means confirmed the effect size interpretations. Mean change measures for each group exceeded the moderate (.50SD) minimal clinically important difference value of 9 units, suggesting each group demonstrated clinically meaningful change over 4 weeks. The difference between the amantadine HCl and placebo mean CRS-R change Rasch person measures was 3.6 units, approximating the 4-unit .20SD minimal clinically important difference, indicating a small difference between groups that was not statistically significant (p = 0.341).
In the amantadine HCl and placebo groups, 70% and 58%, respectively, demonstrated a positive change in their Rasch person measure that met or exceeded the 11-unit minimal detectable change95. The more conservative conditional minimal detectable change values yielded a smaller proportion of participants who improved beyond measurement error at 58% and 47% for the amantadine HCl and placebo groups, respectively. As hypothesized, the amantadine HCl group had greater effect size and larger proportion of participants who changed beyond measurement error compared with the placebo group. Both groups had three or fewer participants that declined beyond measurement error based on both minimal detectable change approaches (Table 6). There was not a significant difference between treatment arm assignment and improver status based on the minimal detectable change95, [χ2 (1, n = 180) = 1.71, p = 0.19] or the conditional minimal detectable change95, [χ2 (1, n = 180) = 2.19, p = 0.14].
Proportion of Participants with Change Beyond Measurement Error
MDC95, minimal detectable change with 95% confidence interval; cMDC95, conditional minimal detectable change with 95% confidence interval.
Alignment with aspen criteria at baseline
There was a large, statistically significant improvement to the mean Rasch person measures for the MCS and UWS groups representing increased neurobehavioral function across groups (MCS = 21 units, effect size = 1.4 [95% CI: 1.1–1.6]; UWS = 14.1 units, effect size = 1.1 [95% CI: 0.8–1.3]) (Table 3). Overlapping confidence intervals indicate the groups made a similar amount of change. Standardized response means confirmed the effect size interpretations (MCS = 1.1; UWS = 0.9). Mean change Rasch person measures for both groups exceeded the moderate (.50SD) minimally clinically important difference value (9 units), suggesting that both groups demonstrated clinically meaningful change across 4 weeks. The difference between the MCS and UWS mean CRS-R change Rasch person measures was 5.9 units, reflecting a difference that approximated the 6-unit 0.33SD minimally clinically important difference threshold for a minimally important change.
A greater percentage of participants in the MCS group improved beyond the 11-unit minimal detectable change95 compared with the UWS group (MCS = 69%, UWS = 54%) (Table 6). When applying the more conservative conditional minimal detectable change95 values, there was still a higher proportion of participants classified as MCS compared with those classified as UWS that made change beyond measurement error (59% and 39%, respectively). As hypothesized, participants classified as MCS had a larger effect size and a higher proportion of participants improved beyond measurement error compared with those classified as UWS. In both groups, there were three or fewer participants that declined beyond measurement error (Table 6). The chi-square test did not reveal significant differences between baseline state of consciousness and improver status based on the minimal detectable change95, χ 2(1, n = 180) = 3.83, p = .05. However, the MCS group was associated with a statistically significant higher likelihood of improvement based on the conditional minimal detectable change95, χ 2(1, n = 180) = 6.13, p = .01.
Evaluating change in state of consciousness
Table 6 also displays the comparisons between participants who demonstrated change beyond measurement error and change in state of consciousness by applying the Aspen criteria to baseline and Week 4 records. Across all participants, 115 participants demonstrated change beyond measurement error using the minimal detectable change95; 86 of these participants recovered to a higher state of consciousness (i.e., UWS to MCS or MCS to eMCS). Notably, 29 participants demonstrated change beyond measurement error within the same state of consciousness. There were 9 participants who did not make a change beyond measurement error but did change their state of consciousness. Table 6 provides additional information.
Discussion
This study is the first to report indices of responsiveness (minimal clinically important differences, minimal detectable change using 95% and 90% confidence intervals, and conditional minimal detectable change95) using the Rasch transformed CRS-R Rasch person measure. This study addresses a critical need in the field to support interpretation of change in neurobehavioral function among people with DoC. 8 The values from the .50SD distribution-based minimal clinically important difference and the minimal detectable change90 are comparable, suggesting that a clinically relevant difference at this group-level threshold exceeds individual-level measurement error only when less conservative confidence intervals are applied. If serial CRS-R assessments are being performed and results are being used to support high-stakes clinical decisions, then the minimal detectable change95 or conditional minimal detectable change95 should be applied to evaluate true progress or decline. The conditional minimal detectable change is a contemporary approach 16 for evaluating change between two time points because it accounts for the variability in the standard error that exists across the assessment’s total possible Rasch person measures. Thus, a patient’s change can now be examined using these indices to support interpretation when monitoring progress to inform clinical decision-making.
The information gained from this study has practical translational potential for clinicians and researchers. Clinicians can use the standard error of measurement, minimal detectable change values, or conditional minimal detectable change values to interpret CRS-R Rasch person measures. The standard error of measurement can be utilized to interpret the true Rasch person measure range of a single observed person measure. For example, if a patient had a CRS-R Rasch person measure of 51 units at admission, then the patient’s true Rasch person measure range would be found within the interval defined by their original CRS-R Rasch person measure (51 units) ± the standard error of measurement95 (8 units). This means that the true CRS-R Rasch person range is between 43 and 59 units at admission 95% of the time. The minimal detectable change and conditional minimal detectable change can be utilized to understand the margin of error when interpreting the difference between two assessment time points. For example, using the previous admission Rasch person measure of 51 units, this patient would be considered to make a change beyond measurement error with 95% confidence if their subsequent Rasch person measure was 11 units higher or lower than the Rasch person measure at admission (51 ± 11 units). Thus, if the patient’s subsequent CRS-R Rasch person measure is 40 units or lower, then it indicates a true decline in neurobehavioral function and warrants further investigation (e.g., was a new medication initiated or is a brain scan warranted to evaluate the possibility of hydrocephalus). Conversely, if the patient’s subsequent CRS-R Rasch person measure is 62 units or higher, then it indicates a true improvement in neurobehavioral function supporting the current treatment program. If the clinician wants to allow for slightly less confidence, the 9-unit value from the minimal detectable change90 can be utilized.
The conditional minimal detectable change95 provides a more stringent approach to determining indices of responsiveness. This index addresses the shortfall of traditional indices. Traditional indices of responsiveness assume that standard error is equivalent across the scale when it is not. The conditional minimal detectable change, conversely, accounts for the variability in standard error across the scale. 16 When applying the patient’s Rasch person measure of 51 units at admission, a subsequent decline to 34 units or improvement to 63 units could be considered a change beyond measurement error (Fig. 2). While the conditional minimal detectable change may be more precise, this method is more complicated to apply in practice because minimal detectable change value varies based on the CRS-R Rasch person measure. To support clinical implementation, we provide a look-up table in Supplementary Fig. S1 that may be used by clinicians to quickly determine whether the change between two Rasch person measures represents an improvement or decline beyond measurement error using the conditional minimal detectable change. This look-up table could serve as the basis for an algorithm to be built within an electronic health care record to inform clinicians when change is beyond measurement error. Evaluating change in the context of the conditional minimal detectable change index can support treatment decisions about whether an intervention is supporting or hindering the patient’s neurobehavioral function.
Using the conditional minimal detectable change95, we found that the pairs of CRS-R Rasch person measures that were beyond measurement were equivalent to a difference of 4–6 points using the CRS-R raw score (0 to 23 points) (Fig. S1). A previous article defined a large change score as 6 or more points across a 4-week period using the original CRS. 37 More recently, a study identified that a 3-point change on the CRS-R total raw score (0–23 points) was associated with a change in DoC state of consciousness 90% of the time when participants were initially in UWS or MCS minus (a transitional state often described in the literature by UWS behaviors with some non-reflexive movements, e.g., visual pursuit). 13,38 Depending on the baseline CRS-R raw score, this 3-point raw score change may or may not exceed the minimal detectable change95 (11 units on the 0–100 transformed scale). For example, a 1-point change from a 0 (0 units) to 1 (11 units) on the CRS-R raw score reflects a change beyond measurement error using the 11-unit minimal detectable change95; this indicates that the 3-point raw score change is too stringent. On the other hand, a patient with a CRS-R raw score of 6 (38 units) who changes to a 9 (47 units) does not reflect a change beyond measurement error using the 11-unit minimal detectable change95; this indicated that the 3-point raw score change is too lenient (Table 1). Thus, there are inherent risks of using ordinal raw scores and a single minimal detectable change value that does not account for differences in measure precision across the scale to interpret change. Patients with true change may be missed, while others may appear to make a change when they have not.
We applied the distribution-based minimal clinically important difference to the clinical trial data in two important ways: by treatment arm and by Aspen-based state of consciousness. Both the amantadine HCl and placebo groups demonstrated a large, statistically significant positive mean change in CRS-R Rasch person measure change from baseline to Week 4. The amantadine HCl and placebo groups both had large Cohen’s d effect sizes and SRMs using the CRS-R over the 4-week treatment period, which is similar to the finding based on the Disability Rating Scale study outcome. 10 The amantadine HCl group’s change in mean Rasch person measure was 3.6 units greater than the placebo group’s change in mean Rasch person measure, which is comparable to the 0.20SD minimal clinically important difference (4 units), indicating that the amantadine HCl group may have made a small detectable difference in average improvement compared with the placebo group. 34 Further supporting amantadine HCl, the proportion of participants who made a true improvement was greater in the amantadine versus placebo group; however, this finding did not reach statistical significance based on the chi-square test.
We also delineated participants in the clinical trial based on the alignment of their baseline CRS-R record to Aspen criteria (i.e., MCS or UWS) and found that both groups had large effect sizes and standardized response means, indicating that regardless of group there was a large, positive CRS-R Rasch person measure change. For participants categorized as MCS, the magnitude of change and the proportion of participants who made a true improvement were greater than those categorized as UWS. This is consistent with previous literature suggesting that patients in MCS tend to experience better recovery than those in UWS. 27 –30 However, large and overlapping effect sizes suggest that participants who were diagnosed at baseline as either UWS or MCS made notable progress when receiving inpatient rehabilitation and either amantadine HCl or the placebo.
Finally, we compared participants who changed using the minimal detectable change95, the conditional minimal detectable change95, and those who changed in state of consciousness using the Aspen criteria. Across all participants, we found that 29 (16% of the total sample) participants made a change beyond measurement error (minimal detectable change95) while remaining within their state of consciousness. On the other hand, 9 (5%) participants demonstrated a change in their state of consciousness according to their CRS-R measure but the change was not beyond measurement error. In this case, it might be appropriate to ensure the patient demonstrates consistency being measured in this new state when the change is within measurement error. This finding substantiates concerns with using ordinal scores to evaluate change; clinicians risk misclassifying patients as having made a ‘true’ change when it could be within measurement error. Thus, it may be important to substantiate a change from UWS to MCS with a subsequent CRS-R person measure that is greater than the minimal detectable change.
Study limitations
These indices of responsiveness were generated from data collected during a randomized clinical trial that included participants who were classified as UWS and MCS receiving inpatient rehabilitation within two months of injury. Validation of these indices of responsiveness on participants in the very acute (e.g., intensive care unit) and later subacute and chronic DoC phases is needed to support the generalizability of these indices. Additionally, the sample did not include participants in a comatose state. We did not delineate between MCS and eMCS at baseline because only one participant was classified as eMCS using the Aspen criteria, and this participant’s scores did not exceed the highest score in the MCS group despite reaching behavioral milestones associated with emergence. Another limitation is that, while we classified participants into states of consciousness based on their baseline record’s alignment with Aspen criteria, we only utilized one CRS-R record to do so. Indices of responsiveness are traditionally generated using one record per participant at each of the two time points, as we have done in this study. However, in the DoC literature, it has been recommended that state of consciousness should be confirmed using five serial CRS-R assessments captured over 2 weeks. 22
The minimal clinically important differences and minimal detectable change values reported in this study account for variation across a 4-week time period (i.e., pooled standard deviation). It is possible that a shorter time frame may yield less variability and smaller indices, but we may also find a similar degree of measurement error. Therefore, our indices may be conservative for shorter rehabilitation time frames. Importantly, we have also included the conditional minimal detectable change95 values, which do not rely upon time between assessments and may be useful for evaluating change in patients with shorter rehabilitation stays. A more rigorous anchor-based minimal clinically important difference can be computed when there is an external criterion identified as important by the clinician, family, or patient. 22,23 For example, the family may identify object localization as important, which could become a meaningful criterion. Thus, future research should establish anchor-based minimal clinically important difference indices for comparison to the distribution-based minimal clinically important difference and minimal detectable change values reported in our study.
Conclusion
Our evidence supports the clinical and research utility of the CRS-R Rasch person measure by establishing indices of responsiveness. We utilize Rasch person measures to provide more precise evidence for clinicians and researchers to ascertain whether their patient made a ‘true change’ beyond measurement error when comparing CRS-R Rasch person measures from two time points. The effect size, standardized response mean, and distribution-based minimal clinically important differences can be utilized to examine change at the group level. The minimal detectable change and conditional minimal detectable change are suitable for interpreting change for an individual patient. Participants within two months of injury that were diagnosed as MCS or UWS using their baseline CRS-R assessment had a large improvement in neurobehavioral function while receiving inpatient rehabilitation services, regardless of assignment to amantadine HCl or a placebo intervention. We demonstrated that Rasch person measures can provide more precise evidence for clinicians and researchers to ascertain whether their patient made a ‘true change’ beyond measurement error when comparing CRS-R person measures from two discrete time points. Ultimately, our findings highlight that continued use of ordinal scores may result in incorrect inferences about the degree and relevance of a change score.
Transparency, Rigor, and Reproducibility Statement
This study was not formally registered because it was deemed as Not Human Subjects Research. We utilized secondary data from the Amantadine trial, which was previously registered (ClinicalTrials.gov number, NCT00970944). The analysis plan was not formally pre-registered, but author J.A.W., who held primary responsibility for the analysis, certifies that the analysis plan was pre-specified. A sample size of 180 subjects was planned based on availability of data in the Amantadine trial and requirement for more than 100 subjects. We included all participants in the Amantadine trial dataset who had both baseline and 4-week CRS-R records; further information about inclusion/exclusion criteria can be found in Giacino and colleagues’ (2012) publication. We used de-identified data to conduct all analyses; therefore, blinding was not relevant to the present study. All software used to perform analyses are widely available from StataCorp 39 and MedCalc. 31 Statistical analyses were performed by J.A.W., A.M.C., P.G.D., and J.T.G. who have relevant statistical training to conduct and interpret the results of these analyses. Coauthors T.M., S.A., P.F., T.K., Y.G.B., T.L.B.P. supported interpretations of analyses. An external validation study by the study group is ongoing. Data can be obtained by reaching out to J.T.G. The analytic code used to conduct the analyses presented in this study is not available in a public repository. The analytic code may be available by emailing the corresponding author. The authors agree to provide the full content of the article on request by contacting Jennifer A Weaver, the corresponding author.
Footnotes
Authors’ Contributions
J.A.W.: Conceptualization (lead); Methodology (lead); Data curation (lead); Formal analysis (lead); Project administration (lead); Software (lead); Writing original draft (lead); and Writing—reviewing and editing (lead). A.M.C.: Conceptualization (supporting); Formal analysis (supporting); and Writing—reviewing and editing (supporting). A.J.K.: Methodology (supporting); Formal analysis (supporting); and Writing—reviewing and editing (supporting). P.G.D.: Methodology (supporting); Data curation (supporting); Formal analysis (supporting); Writing original draft (supporting); and Writing—reviewing and editing (supporting). K.A.O.: Resources (supporting); and Writing—reviewing and editing (supporting). Y.G.B.: Resources (supporting); Formal analysis (supporting); and Writing—reviewing and editing (supporting). J.G.: Conceptualization (supporting); Resources (lead); and Writing—reviewing and editing (supporting). S.A.: Formal analysis (supporting); and Writing—reviewing and editing (supporting). P.F.: Formal analysis (supporting); and Writing—reviewing and editing (supporting). T.K.: Formal analysis (supporting); and Writing—reviewing and editing (supporting). T.L.B.P.: Formal analysis (supporting); and Writing—reviewing and editing (supporting). T.M.: Conceptualization (supporting); Formal analysis (supporting); and Writing—reviewing and editing (supporting). J.T.G.: Conceptualization (supporting); Formal analysis (supporting); and Writing—reviewing and editing (supporting).
Author Disclosure Statement
No competing financial interests exist.
Funding Information
This study was funded by a U.S. Department of Defense grant W81XWH2210925 issued to authors J.A.W., A.M.C., K.A.O., J.G., S.A., P.F., T.K., T.M., and J.T.G. This study was also funded by a U.S. Department of Defense (Grant number: JW150040, W81XWH-14-1-0568) to T.B.P. and T.M.
Supplementary Material
Supplementary Figure S1
Supplementary Table S1
References
Supplementary Material
Please find the following supplemental material available below.
For Open Access articles published under a Creative Commons License, all supplemental material carries the same license as the article it is associated with.
For non-Open Access articles published, all supplemental material carries a non-exclusive license, and permission requests for re-use of supplemental material or any part of supplemental material shall be sent directly to the copyright owner as specified in the copyright notice associated with the article.