
Abstract
Traumatic axonal injury (TAI) is a common finding on magnetic resonance imaging (MRI) in patients with moderate–severe traumatic brain injury (TBI), and the burden of TAI is associated with outcome in this patient group. Lesion mapping offers a way to combine imaging findings from numerous individual patients into common lesion maps where the findings from a whole patient cohort can be assessed. The aim of this study was to evaluate the spatial distribution of TAI lesions on different MRI sequences and its associations to outcome with use of lesion mapping. Included prospectively were 269 patients (8–70 years) with moderate or severe TBI and MRI within six weeks after injury. The TAI lesions were evaluated and manually segmented on fluid-attenuated inversed recovery (FLAIR), diffusion weighted imaging (DWI), and either T2* gradient echo (T2*GRE) or susceptibility weighted imaging (SWI). The segmentations were registered to the Montreal Neurological Institute space and combined to lesion frequency distribution maps. Outcome was assessed with Glasgow Outcome Scale Extended (GOSE) score at 12 months. The frequency and distribution of TAI was assessed qualitatively by visual reading. Univariable associations to outcome were assessed qualitatively by visual reading and also quantitatively with use of voxel-based lesion-symptom mapping (VLSM). The highest frequency of TAI was found in the posterior half of corpus callosum. The frequency of TAI was higher in the frontal and temporal lobes than in the parietal and occipital lobes, and in the upper parts of the brainstem than in the lower. At the group level, all voxels in mesencephalon had TAI on FLAIR. The patients with poorest outcome (GOSE scores ≤4) had higher frequencies of TAI. On VLSM, poor outcome was associated with TAI lesions bilaterally in the splenium, the right side of tectum, tegmental mesencephalon, and pons. In conclusion, we found higher frequency of TAI in posterior corpus callosum, and TAI in splenium, mesencephalon, and pons were associated with poor outcome. If lesion frequency distribution maps containing outcome information based on imaging findings from numerous patients in the future can be compared with the imaging findings from individual patients, it would offer a new tool in the clinical workup and outcome prediction of the patient with TBI.
Introduction
Traumatic brain injury (TBI) is among the leading causes of death and disability among young adults worldwide. 1 Rotational acceleration-deceleration forces on the brain during the trauma may cause damage to the axonal skeleton, 2 traumatic axonal injury (TAI), a hallmark injury type in TBI. Histopathologically, TAI is found typically in predilection sites in the white matter of the hemispheres, in corpus callosum, and in the brainstem. 3
Magnetic resonance imaging (MRI) is far better than computed tomography (CT) in the detection of TAI. 4 With MRI, we can reveal indirect signs of TAI due to edema, so-called non-hemorrhagic TAI lesions, detected as increased signal intensity on fluid-attenuated inversion recovery (FLAIR) images or on diffusion weighted imaging (DWI) trace images. With T2* gradient echo (T2*GRE) or susceptibility weighted imaging (SWI), we can also detect traumatic microhemorrhages as indirect signs of TAI, visible as signal drops because of blood degradation products.
Signs of TAI on MRI are found in a majority of the patients with moderate and severe TBI. 5,6 The burden and location of the lesions are important to outcome. 7,8 Bilateral lesions in the brainstem and thalamus especially have been shown to be strongly associated with unfavorable outcomes, and they have therefore been assigned the worst grades in a recently proposed grading system of TAI on MRI. 9
Lesion mapping is a widely used method to study the spatial distribution of neuroimaging findings. 10 Here, individually segmented lesions from numerous patients are registered to a common space providing lesion frequency distribution maps that enable qualitative assessment by visual reading of the imaging findings from a whole patient cohort combined into one volume. By stratifying patients into groups based on clinical variables, such as outcome, evaluation of univariable associations to imaging findings is possible.
The maps can also be used for voxel-based lesion-symptom mapping (VLSM), which allows for a quantitative assessment of univariable associations between symptoms and lesions at the voxel-level. 11 In this way, lesion mapping offers a new way of studying both the distribution and frequency of TAI as well as associations between imaging findings and outcome.
Lesion mapping and VLSM have been used in MRI studies of different other brain pathologies, like stroke, 12 white matter hyperintensities, 13 and glioblastoma, 14 but not in studies of TAI. Hence, our primary aim was to generate and qualitatively assess lesion frequency distribution maps of TAI on different MRI sequences. Our secondary aim was to study the univariable associations between outcome and TAI, both qualitatively and quantitatively, with VLSM.
Methods
Ethics
The study was approved by the Regional Committee for Medical Research Ethics (2009/2328, 2017/1214, 2019/519). Consent was obtained from the patients, or when incapacitated or below 16 years, from their next of kin.
Study setting and study population
This study included 324 patients (8–70 years) from two separate prospective cohorts (2004–2017) with early MRI (Fig. 1): the Trondheim Moderate and Severe TBI cohort 6 and the Oslo Severe TBI cohort. 15 Moderate TBI was defined by admission Glasgow Coma Scale (GCS) scores 9–13 or scores 14–15 and loss of consciousness >5 min (6 patients, only 3 of them with TAI) and severe TBI by scores ≤8 before intubation/sedation or at admission (Trondheim cohort) or at some time point within the first 24h (Oslo cohort).
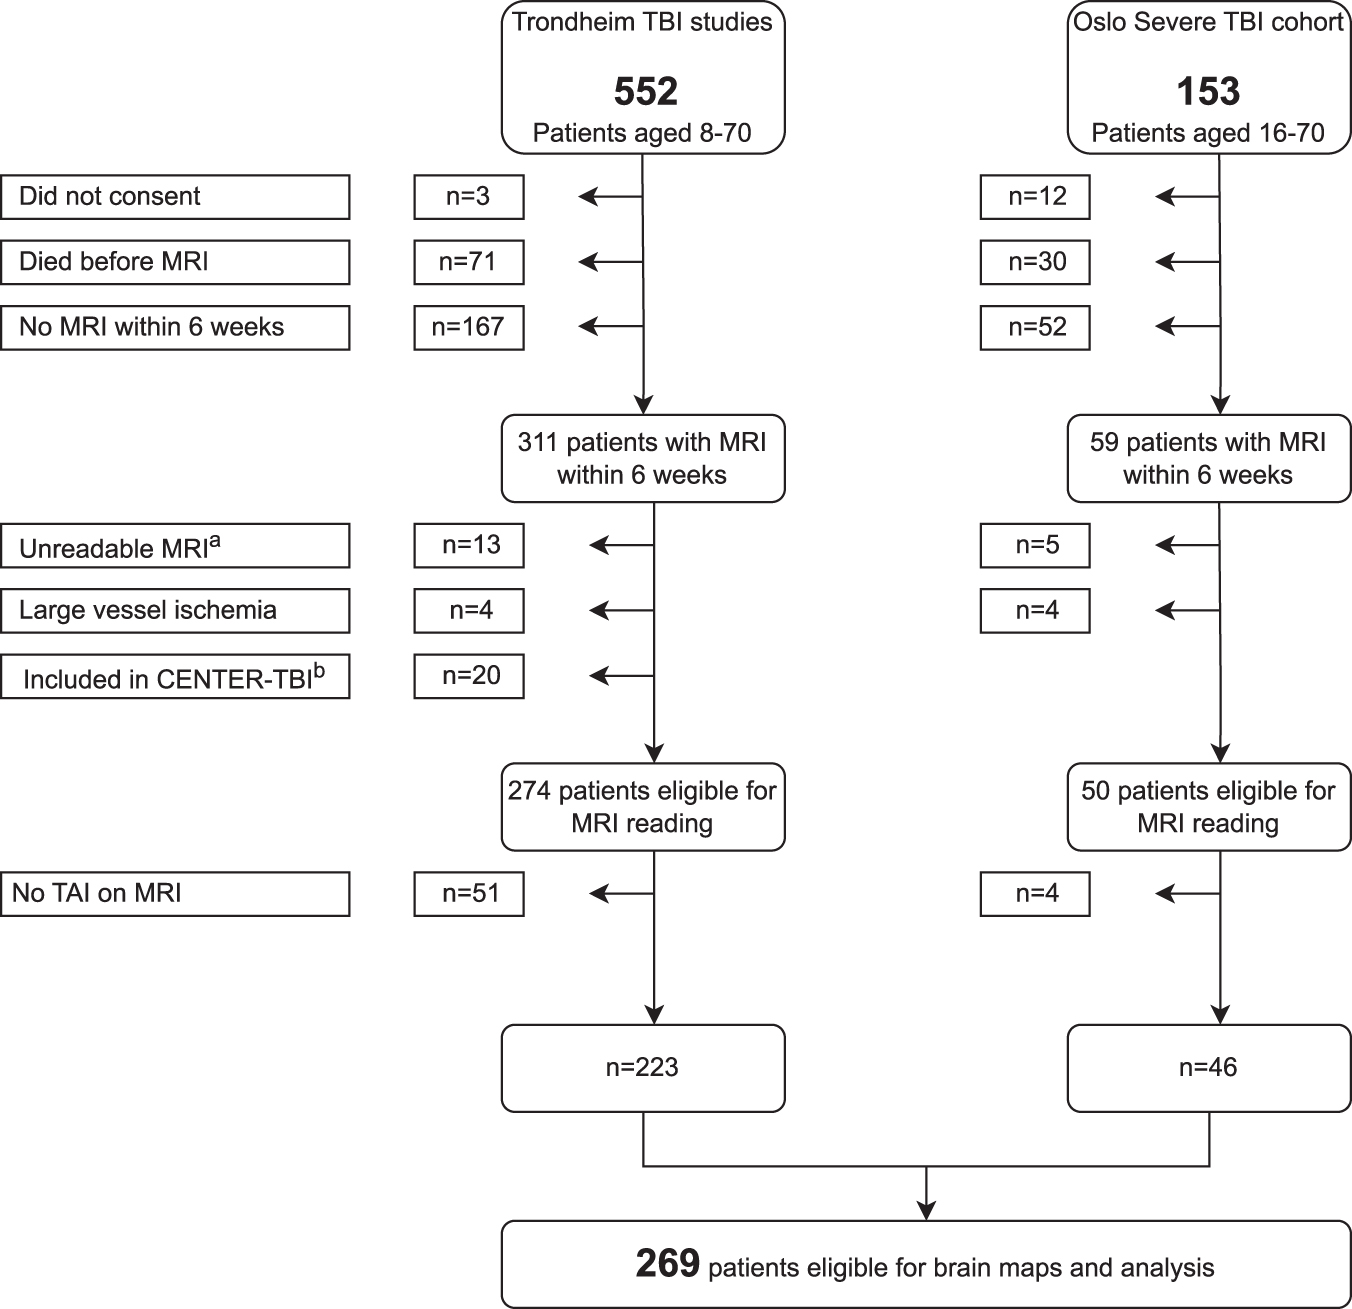
Flowchart of the 269 included patients. (
Exclusion criteria were age ≥70 years, age <8 years, MRI not obtained within six weeks after the injury, unreadable MRI because of large artefacts or missing sequences, and inclusion in the CENTER-TBI project. For more details on the patient cohorts and inclusion and exclusion criteria, please see Figure 1 and the Supplementary Methods.
Neuroimaging, reading and segmentation of TAI lesions
The MRI scans (field strength 1.5T [n = 250], 3T [n = 13], or 1.0T [n = 6]) were obtained within six weeks after injury at Trondheim University Hospital, Oslo University Hospital, or one of the referring local hospitals. All MRI protocols included FLAIR, DWI, and T2*GRE/SWI sequences. Details on the different MRI scanners and the harmonized protocols are summarized in Supplementary Table 1 and have also been reported in a previous study from our research group. 16
Patient Characteristics and Neuroimaging Findings in the Traumatic Axonal Injury and Non-Traumatic Axonal Injury Group
TAI, traumatic axonal injury; TBI, traumatic brain injury; Mod/Sev, moderate and severe; No., number; GCS, Glasgow Coma Scale; CT, computed tomography; IQR, interquartile range; MRI, magnetic resonance imaging; NA, not applicable; GOSE, Glasgow Outcome Score Extended.
Moderate TBI: GCS 9–13 or GCS 14–15 and loss of consciousness >5 min. bSevere TBI: GCS ≤8. cComparing included patients with TAI to excluded patients without TAI. dComparing moderate TBI to severe TBI in the included group with TAI. eGOSE score at 12 months, including the imputed values for the patients with missing GOSE scores (n = 15, 7%); see also the Methods section.
Burden of Traumatic Axonal Injury Lesion and Traumatiic Axonal Injury Localization With Relation to Sex and Age
TAI, traumatic axonal injury; n, number; FLAIR, fluid attenuated inversed recovery; p75, 75th percentile; DWI, diffusion weighted imaging; T2*GRE, T2* gradient echo; SWI, susceptibility weighted imaging.
a significant higher proportion of the males than the females had unilateral TAI in thalamus, p = 0.013.
The MRI images were allocated randomly among five senior consultants in radiology (AMHF, KGM, EHS, ØO, and SAB with 7, 8, 18, 12, and 5 years of experience at study start, respectively), evaluated blinded to patient information, and registered according to the TAI-MRI template. 16 If in doubt about imaging findings, it was possible for the readers to consult each other to reach consensus.
Non-hemorrhagic signs of TAI, detected as hyperintense lesions on FLAIR and DWI (trace image), and traumatic microhemorrhages as signs of TAI detected on T2*GRE/SWI were manually segmented with use of the open-source software package 3D Slicer 17,18 (version 4.8.0)—see Figure 2. On FLAIR and DWI, the total volume of the TAI lesion was segmented. Because of “blooming artefacts,” the traumatic microhemorrhages detected on T2*GRE (n = 234 patients) or SWI (n = 41 patients) were assigned one single label per lesion put in a central voxel of the signal dropout.
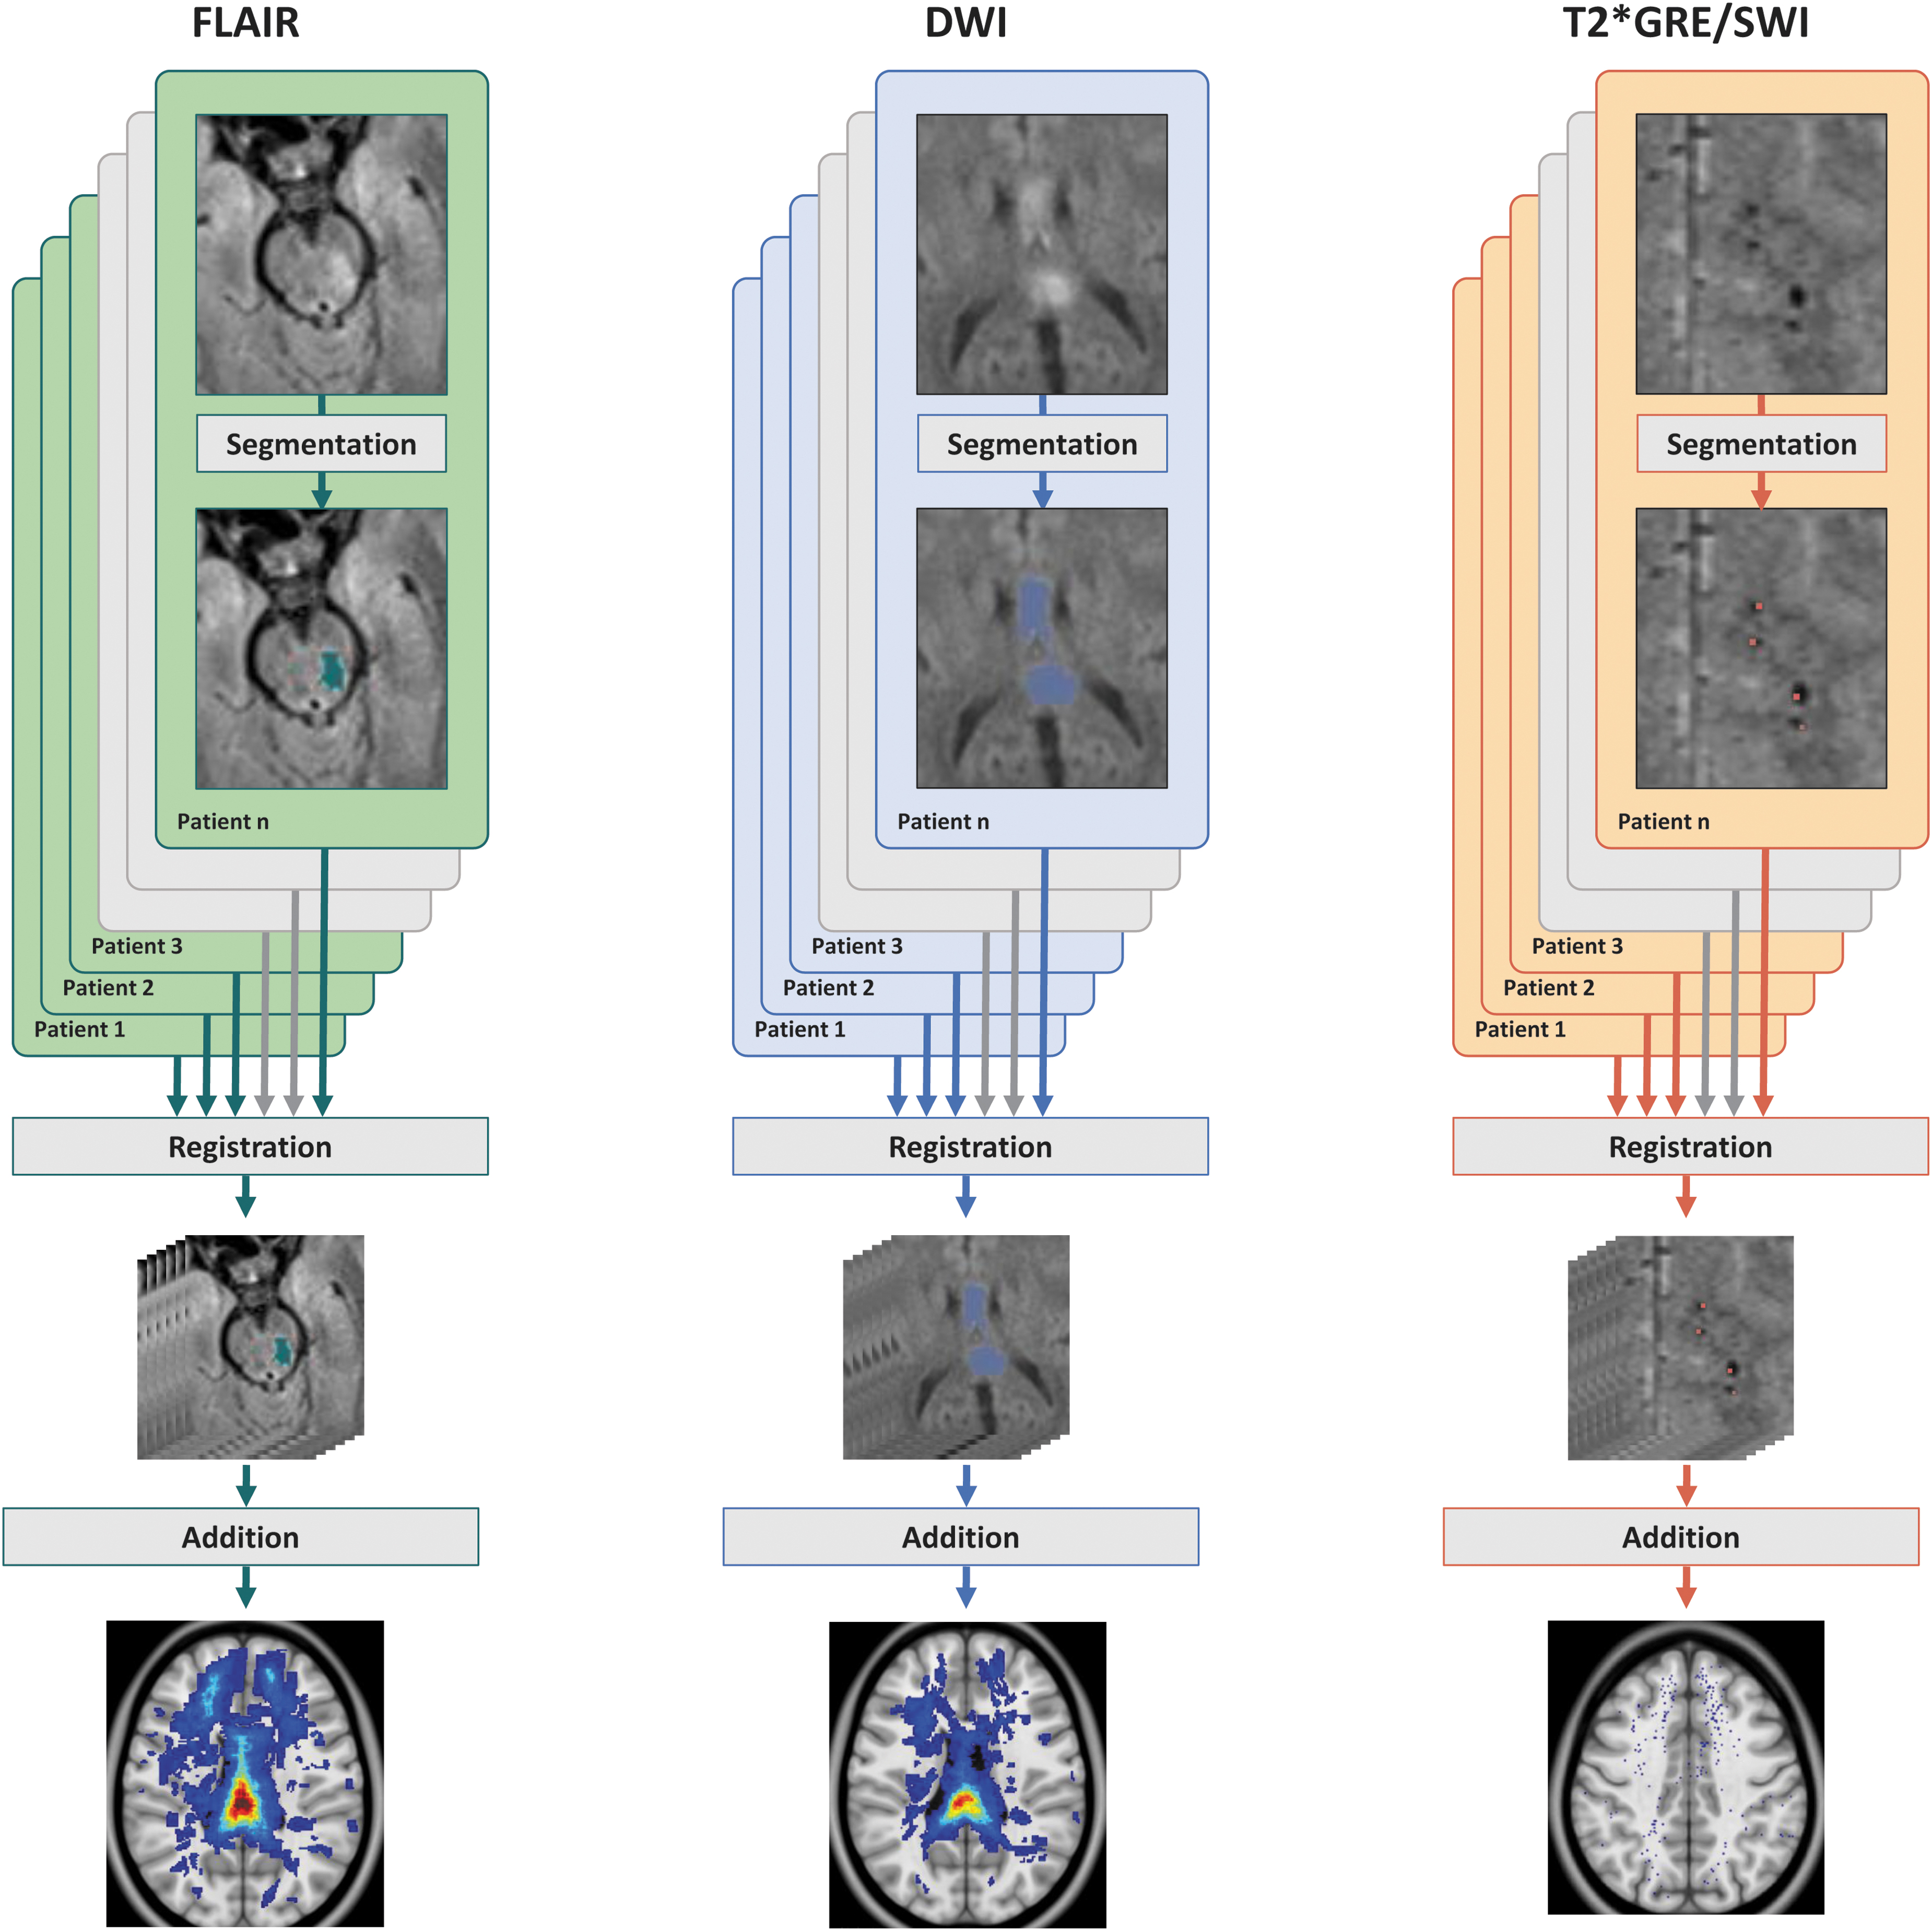
From manual lesion segmentation in individual patients to common lesion frequency distribution maps. This figure illustrates how TAI lesions on different MRI sequences from individual patients were identified, manually segmented, registered to a common space and transformed to lesion frequency distribution maps. The upper row shows the original MRI scan and the manually segmented TAI lesion for the different MRI sequences in individual patients on FLAIR (left column), DWI (middle column), and T2*GRE/SWI (right column). Segmentations from each of the individual patients were registered to a common space (middle row). The registered segmentations from all of the individual patients were then added together into lesion frequency distribution maps (lower row) displaying the spatial distribution of TAI lesions on the different MRI sequences in the whole patient cohort combined. TAI, traumatic axonal injury; MRI, magnetic resonance imaging; FLAIR, fluid attenuated inversed recovery; DWI, diffusion weighted imaging; T2*GRE, T2* gradient echo; SWI, susceptibility weighted imaging.
White matter hyperintensities and microhemorrhages considered not to be signs of TAI, such as periventricular white matter hyperintensities more likely to be part of small vessels disease or demyelinating disease or microhemorrhages more likely to be pre-existing than part of the current trauma, were not segmented. 16
Interrater agreement of TAI on MRI in this patient cohort has been reported in a previous study. 16 A total of 30 MRI scans scored by KGM were randomly selected and rescored by EHS, ØO, and AMHF. The intraclass correlation coefficient was 0.86 and 0.84 for the volumes of TAI on FLAIR and DWI, respectively, and 0.88 for the total numbers of TAI on T2*GRE/SWI.
This study also includes the Marshall CT score 19 from the admission CT scans reviewed by radiologists/residents in radiology in collaboration with neuroradiologists (Trondheim cohort) or by neuroradiologists (Oslo cohort).
Assessment of global outcome
Global outcome was assessed by telephone or personal contact using the structured interview Glasgow Outcome Scale Extended (GOSE). 20,21 The GOSE scores at 12 months were used because this time point is considered to be most optimal for outcome assessment after TBI. 22 The GOSE for adults was adapted to be applicable for evaluation of children, 23 age 8–18 years (n = 41, 14%).
Seven of the patients in the Trondheim cohort had missing 12-month GOSE scores, and the six-month GOSE score was used instead. Fifteen (7%) of the patients in the same cohort had missing GOSE scores at both six and 12 months. For these, a model-based imputation (expectation-maximization) algorithm was used (see Supplementarey Methods).
Registration of segmented TAI lesions to a common space
For each patient, the segmentations from the three MRI sequences were spatially aligned with the Montreal Neurological Institute (MNI) space, defined by the ICBM-152 brain template. 24 First, the individual FLAIR images were pre-processed and non-brain structures were removed using a deep learning model for automatic brain segmentation, which is publicly available through the open-source project Raidionics (version 1.2.0). 25,26 The method is fully automatic, but in 23 cases it failed, resulting in either over- or under-segmentation. In these cases, the segmentations were edited manually.
The FLAIR images were then registered to the MNI space using an intensity-based non-linear registration method from the Advanced Neuroimaging Tools (ANTs) registration toolkit (version 3.0.0.0), 27,28 resulting in a non-linear transform from the MRI scanner space to the MNI space. Because the FLAIR, DWI, and T2*GRE/SWI images were acquired during one single MRI scan with no breaks between the sequences, they were considered coaligned, and the FLAIR-based transform was applied to all the images.
Creation and assessment of the lesion frequency distribution maps
The lesion frequency distribution maps were created with use of a Python script (Python version 3.7.5) 29 adding the individual segmentations from all of the patients in each of the MRI sequences together into one FLAIR map, one DWI map, and one T2*GRE/SWI map, as seen in Figure 2. Voxels with TAI were assigned color with increasing color intensity reflecting increasing number of patients with TAI within the same voxel.
A combined map with segmentations from all the MRI sequences was also created using the open-source software application ITK-SNAP (version 3.8.0). 30,31 Further, we stratified the patients into three outcome groups (GOSE score 1–4, GOSE score 5 − 6, and GOSE score 7 − 8) and created lesion frequency distribution maps for each of the three outcome groups. All of the maps were read visually to identify areas with and without TAI and further to qualitatively assess the frequency of TAI in the different areas with use of the color scale. The reading was performed by AMHF, LE, IR, and KGM.
We also quantified the proportion of voxels with TAI on FLAIR within anatomical subareas of the hemispheres, corpus callosum, and the brainstem with use of the Hammersmith atlas (version 1.0), 32 –34 the JHU DTI-based white-matter atlas 35 –38 and the Brainstem Substructures segmentation method 39 in the FreeSurfer software package (version 6.0.0). 40 No other semi-quantitative grading was performed.
In addition, we created lesion frequency distribution maps allowing for qualitative assessment of univariable associations between outcome and unilateral versus bilateral TAI in the basal ganglia, thalamus, and brainstem—see Supplementary Methods.
Statistics
Data collection was performed in a web-based data collection system administered by the faculty of Medicine and Health Sciences at Norwegian University of Science and Technology (NTNU), Trondheim, Norway. Patient characteristics, injury mechanism, and neuroimaging results are presented as frequencies and percentages or medians with interquartile range. Data not normally distributed were analyzed with the Kruskal-Wallis test, Mann-Whitney U test, chi-square test, and Fisher exact test. Relation of burden and localization of TAI to age was analyzed with Spearman Rank Order Correlation. The software package IBM SPSS Statistics 28 was used. Threshold for significance was set at p < 0.05.
For the VLSM analysis, we used the NiiStat toolbox for Matlab (version 9-October-2016). 41,42 To increase the statistical power, only voxels with lesions in at least three patients were included. The FLAIR map was selected for the VLSM analysis because the possibility of more than one traumatic hemorrhage within the same voxel on the T2*GRE/SWI map was low, and because the occurrence of TAI on FLAIR is less dependent on time from imaging than on DWI. The square root transform included in NiiStat was used to de-skew our data, because they were not normally distributed, and permutation thresholding (2000 permutations) was used to correct for multiple comparisons.
Results
Patient and injury characteristics
Signs of TAI were found in 269 (83%) of the patients (Fig. 1). The patients with TAI were younger, had lower GCS scores, and the injury mechanism was more often road traffic accidents (Table 1a). There were no differences with regard to sex, CT Marshall score, or days from injury to MRI scan between patients with and without TAI. The number of traumatic microhemorrhages was lower with increasing age, and more men than women had unilateral TAI in the thalamus (Table 1b). No other differences in sex and age were found regarding the burden and localization of TAI.
TAI in the hemispheres and the corpus callosum
The qualitative assessment of the lesion frequency distribution maps revealed more voxels with TAI in the frontal and temporal lobes than in the parietal and occipital lobes on all the MRI sequences (Fig. 3). In total, 28% of the voxels in the frontal and temporal lobes compared with 15% of the voxels in the parietal and occipital lobes had TAI on FLAIR.
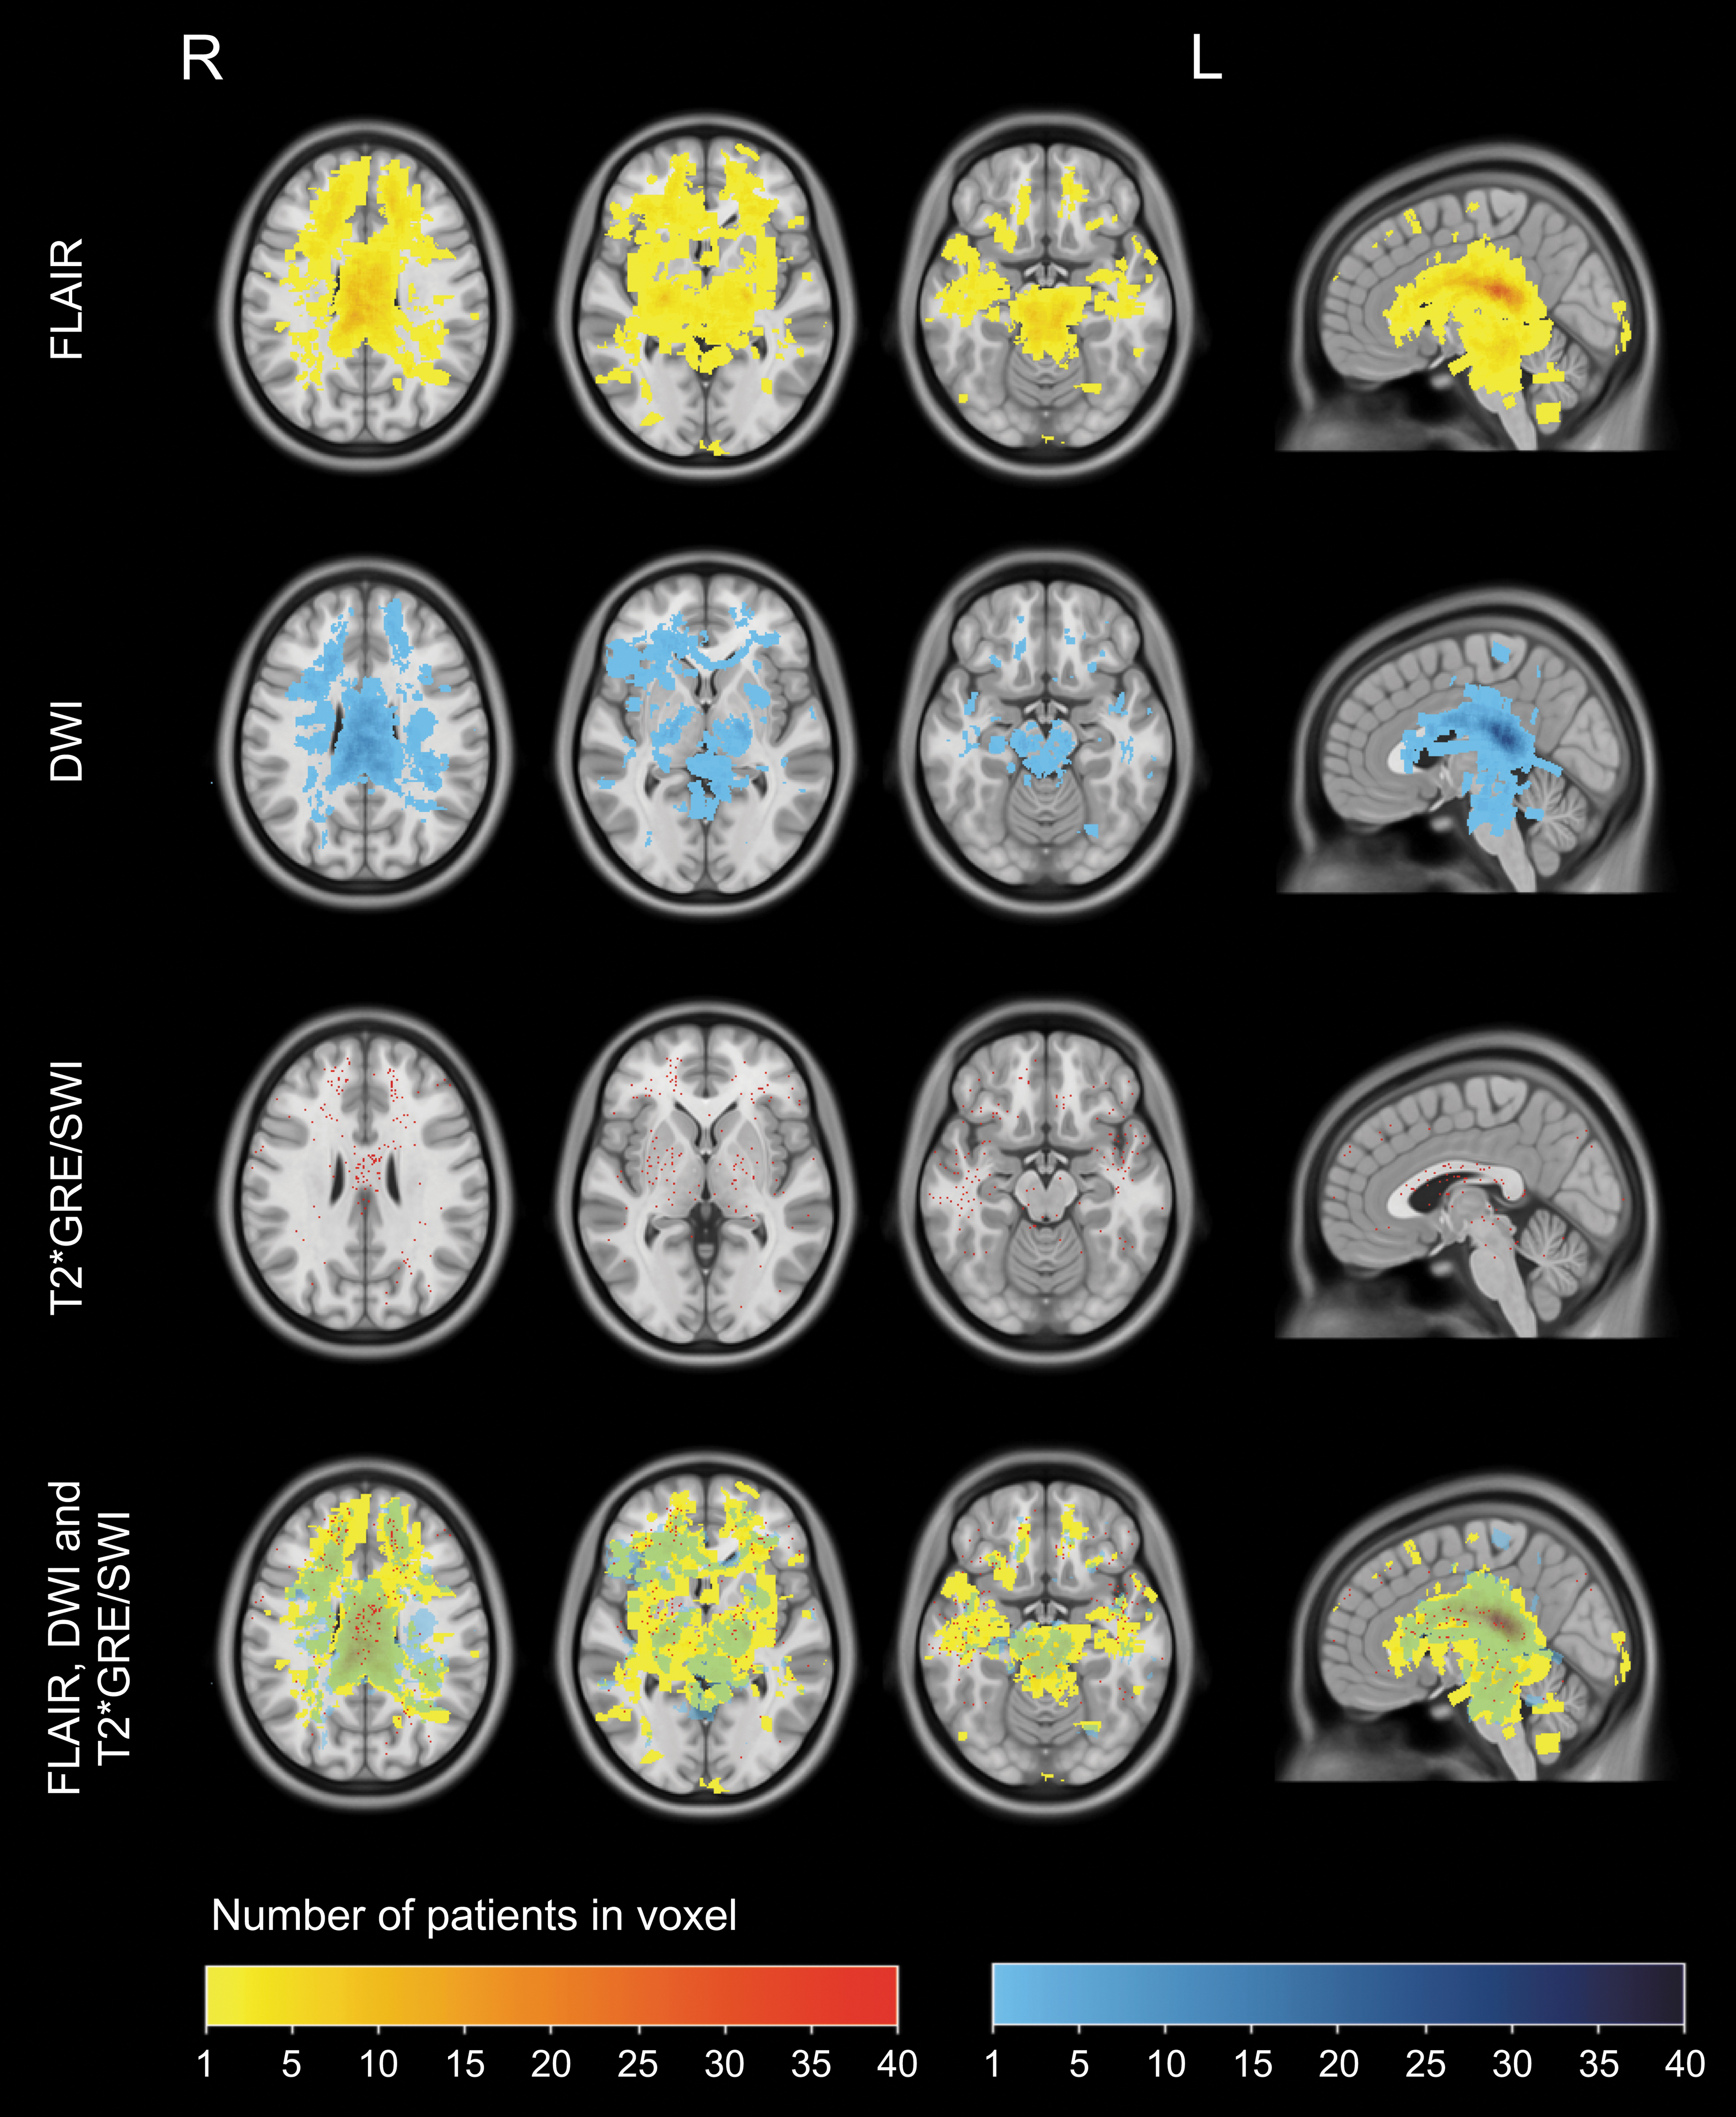
Lesion frequency distribution maps of TAI on FLAIR, DWI, and T2*GRE/SWI. Lesion distribution maps of TAI in three transversal levels (in level with the corona radiata, in level with the basal ganglia/thalamus, and in level with the mesencephalon) and in the midsagittal view on FLAIR, DWIa, T2*GRE/SWI, and combined. TAI, traumatic axonal injury; FLAIR, fluid-attenuated inversion recovery; DWI, diffusion weighted imaging; T2*GRE, T2* gradient echo; SWI, susceptibility weighted imaging. aBecause of artefacts/technical limitations, the DWI acquisition will not include the inferior parts of the medulla oblongata.
The highest frequency of TAI lesions was found in the splenium and the posterior part of truncus in the corpus callosum on the DWI and the FLAIR lesion frequency distribution maps. The highest frequency of lesions within one voxel, n = 41, was found in the truncus in the corpus callosum (FLAIR map). More than 20 lesions per voxel were found in 4.5% of the voxels in truncus and 4.2% of the voxels in the splenium of corpus callosum. In total, 90% and 91% of the voxels in the truncus and the splenium, respectively, compared with 75% of the voxels in the genu had TAI on FLAIR. The lesions on the T2*GRE/SWI map were distributed more evenly in all parts of the corpus callosum.
TAI in the brainstem, thalamus and basal ganglia
There were more voxels with TAI on FLAIR and T2*GRE/SWI in the upper than in the lower part of the brainstem (Fig. 3) with the highest frequency of lesions in the tectum and the tegmentum of the mesencephalon. Below the middle part of pons, there was almost no TAI. On the FLAIR lesion frequency distribution map, 100% of the voxels in mesencephalon had signs of TAI compared with 75% of the voxels in pons and 3% of the voxels in the medulla oblongata (n = 2 patients).
In the thalamus and the basal ganglia, the highest frequency of TAI was found in the lateral nuclei of the thalamus on both FLAIR and DWI. On the T2*GRE/SWI map TAI was distributed evenly throughout the thalamus and the basal ganglia.
TAI co-occurring on FLAIR and DWI
The TAI on both FLAIR and DWI was present in 40% of the voxels; 50% of the voxels had TAI only on FLAIR while 11% of the voxels had TAI only on DWI.
Associations to 12 months outcome
Qualitative assessment of the lesion frequency distribution maps of the three outcome groups ([GOSE 1–4, n = 51, 19%], [GOSE 5–6, n = 104, 39%] and [GOSE 7–8, n = 114, 41%]) revealed that the group with the best outcome had lower frequencies of TAI in general, especially in the basal ganglia, thalamus, and brainstem (Fig. 4). In the corpus callosum, TAI was present in all outcome groups, but in the group with the poorest outcome, the frequency of lesions distributed among unique voxels as well as the total amount of voxels constituting a TAI lesion was higher than in the other groups.
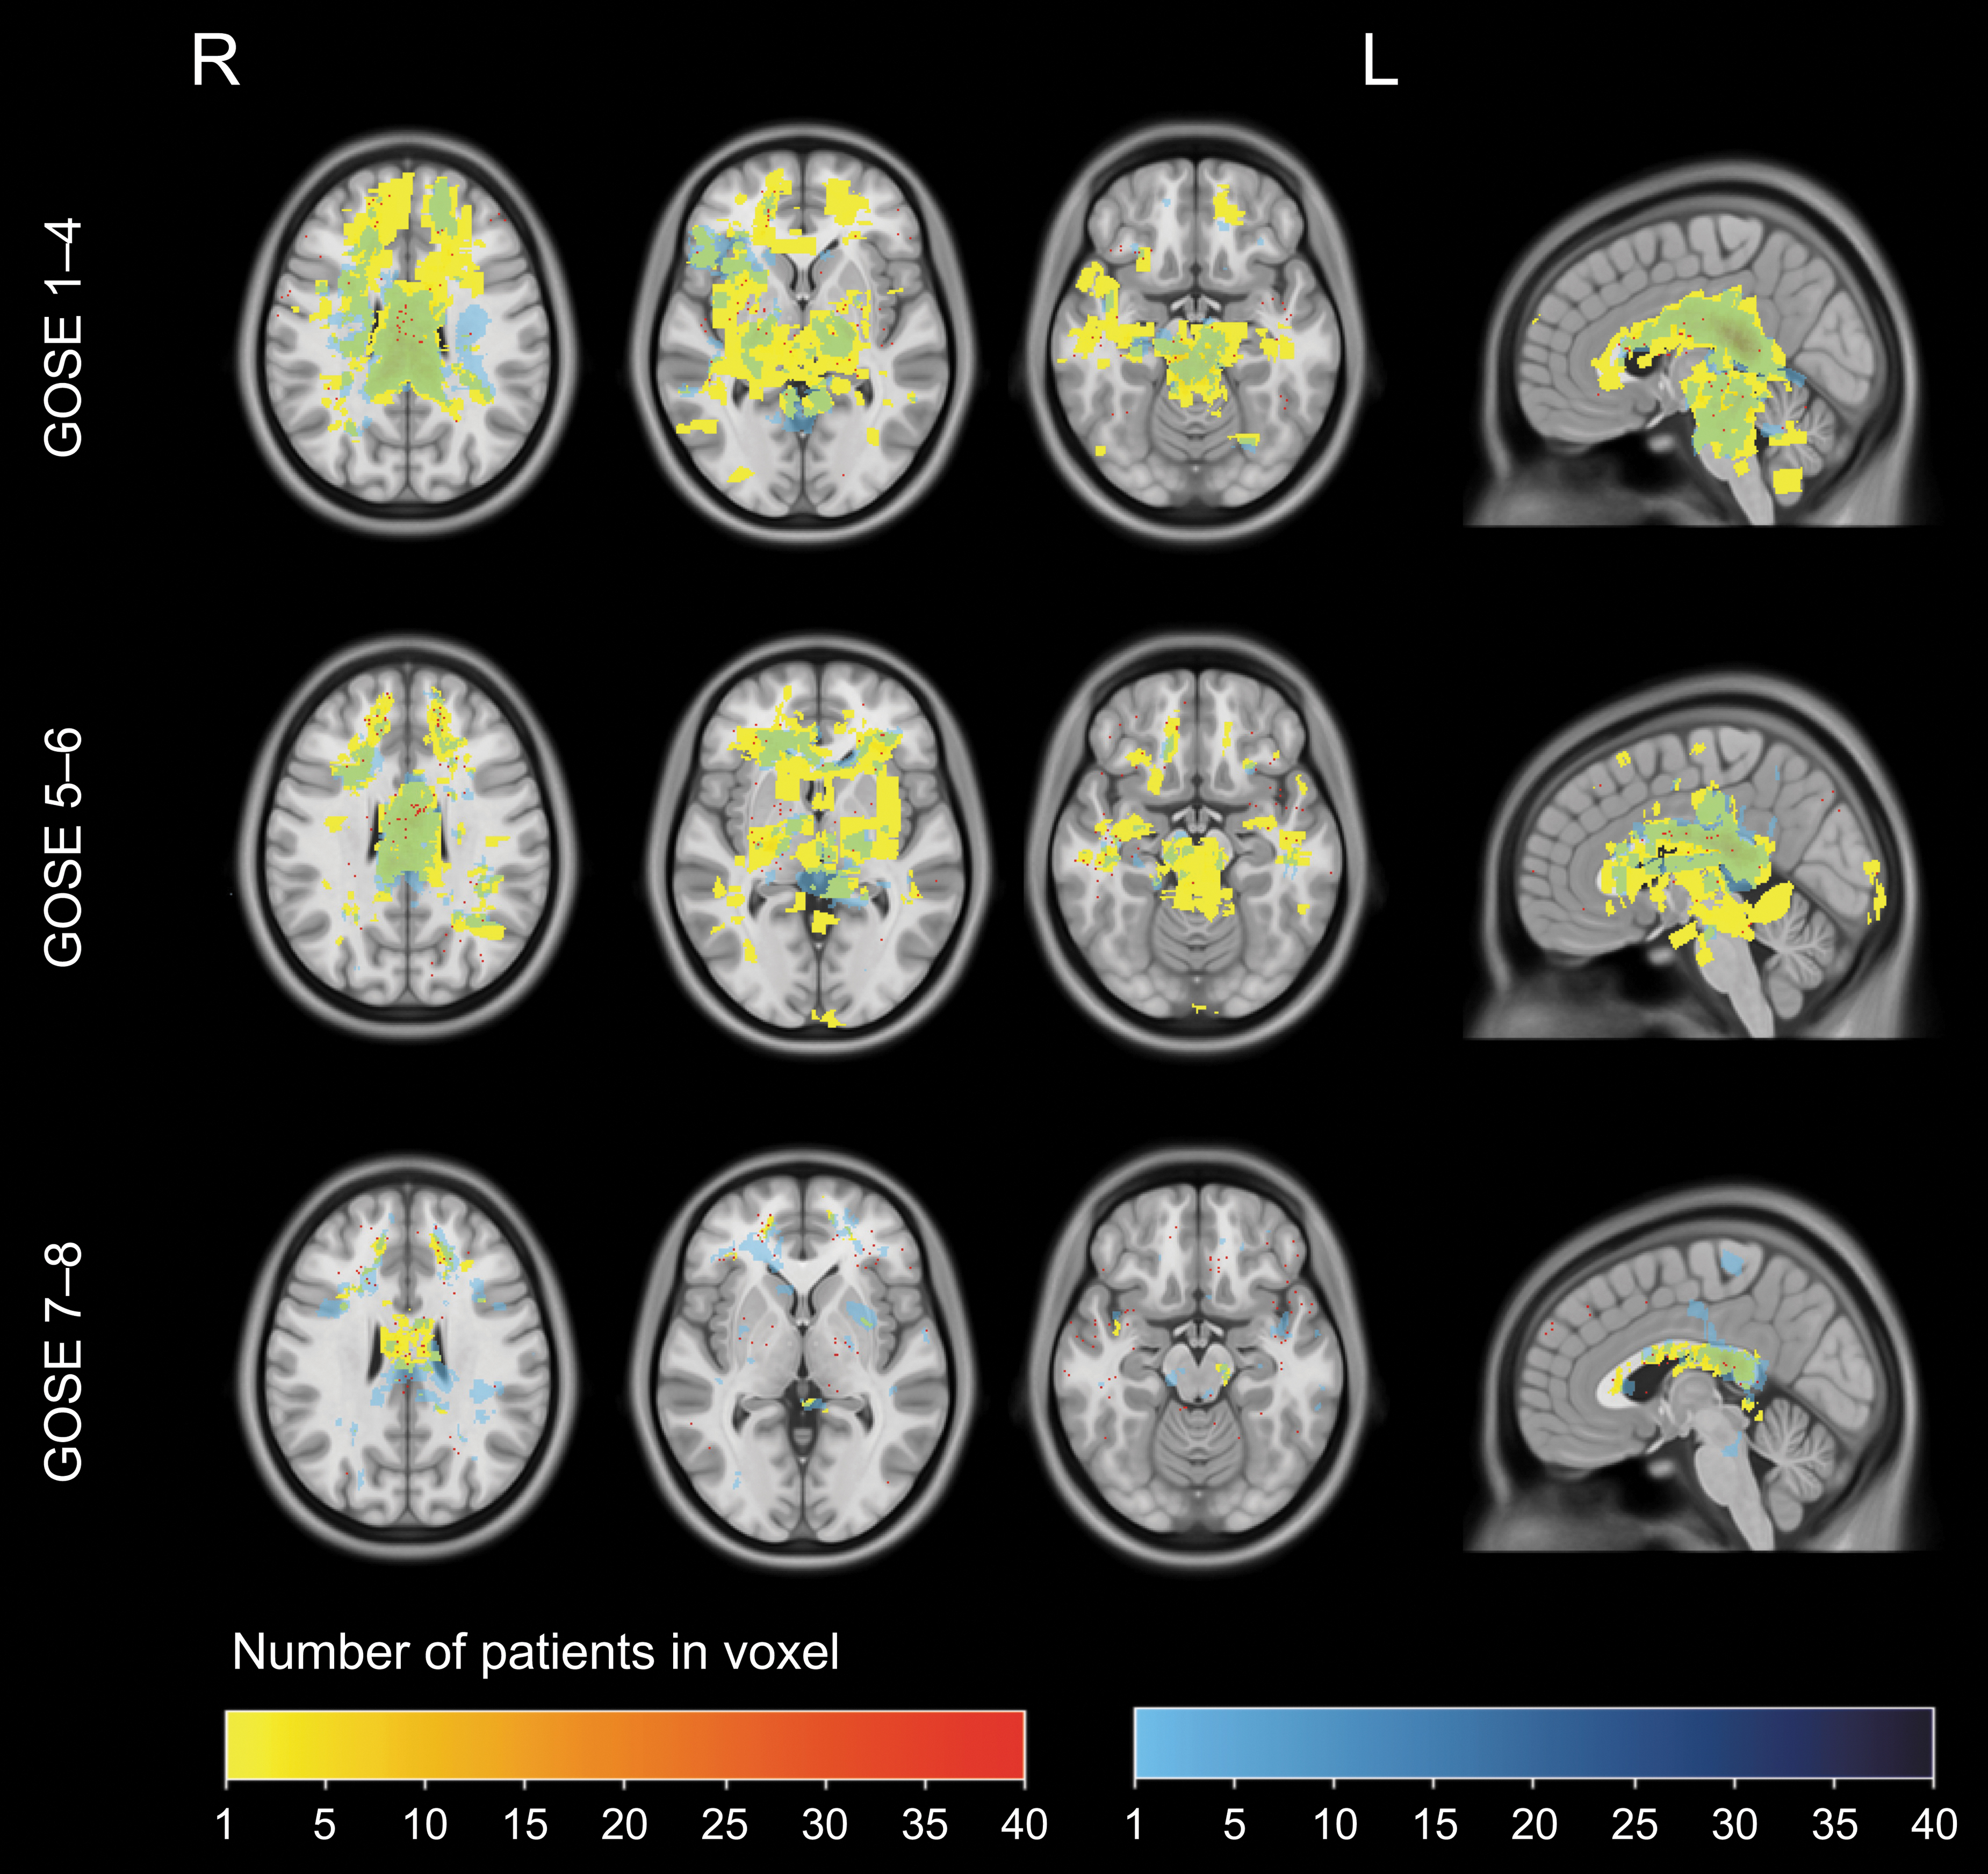
Lesion frequency distribution maps of TAI by outcome. The patient cohort is divided into three outcome groups: GOSE 1-4 (n = 51), GOSE 5-6 (n = 104) and GOSE 7-8 (n = 114). Segmentations of TAI on FLAIR are yellow, DWI blue, and segmentations on both sequences green. Increasing color intensity represents increasing number of lesions per voxel. Segmentations of TAI on T2*/SWI are red dots. TAI, traumatic axonal injury; GOSE, Glasgow Outcome Scale Extended; FLAIR, fluid-attenuated inversion recovery; DWI, diffusion weighted imaging; T2*GRE, T2* gradient echo; SWI, susceptibility weighted imaging.
The VLSM analysis showed areas with a statistically significant univariable association between outcome and TAI in the splenium bilateral, in the right side of the tectum, and in the right side of the dorsal tegmental mesencephalon and pons (Fig. 5).
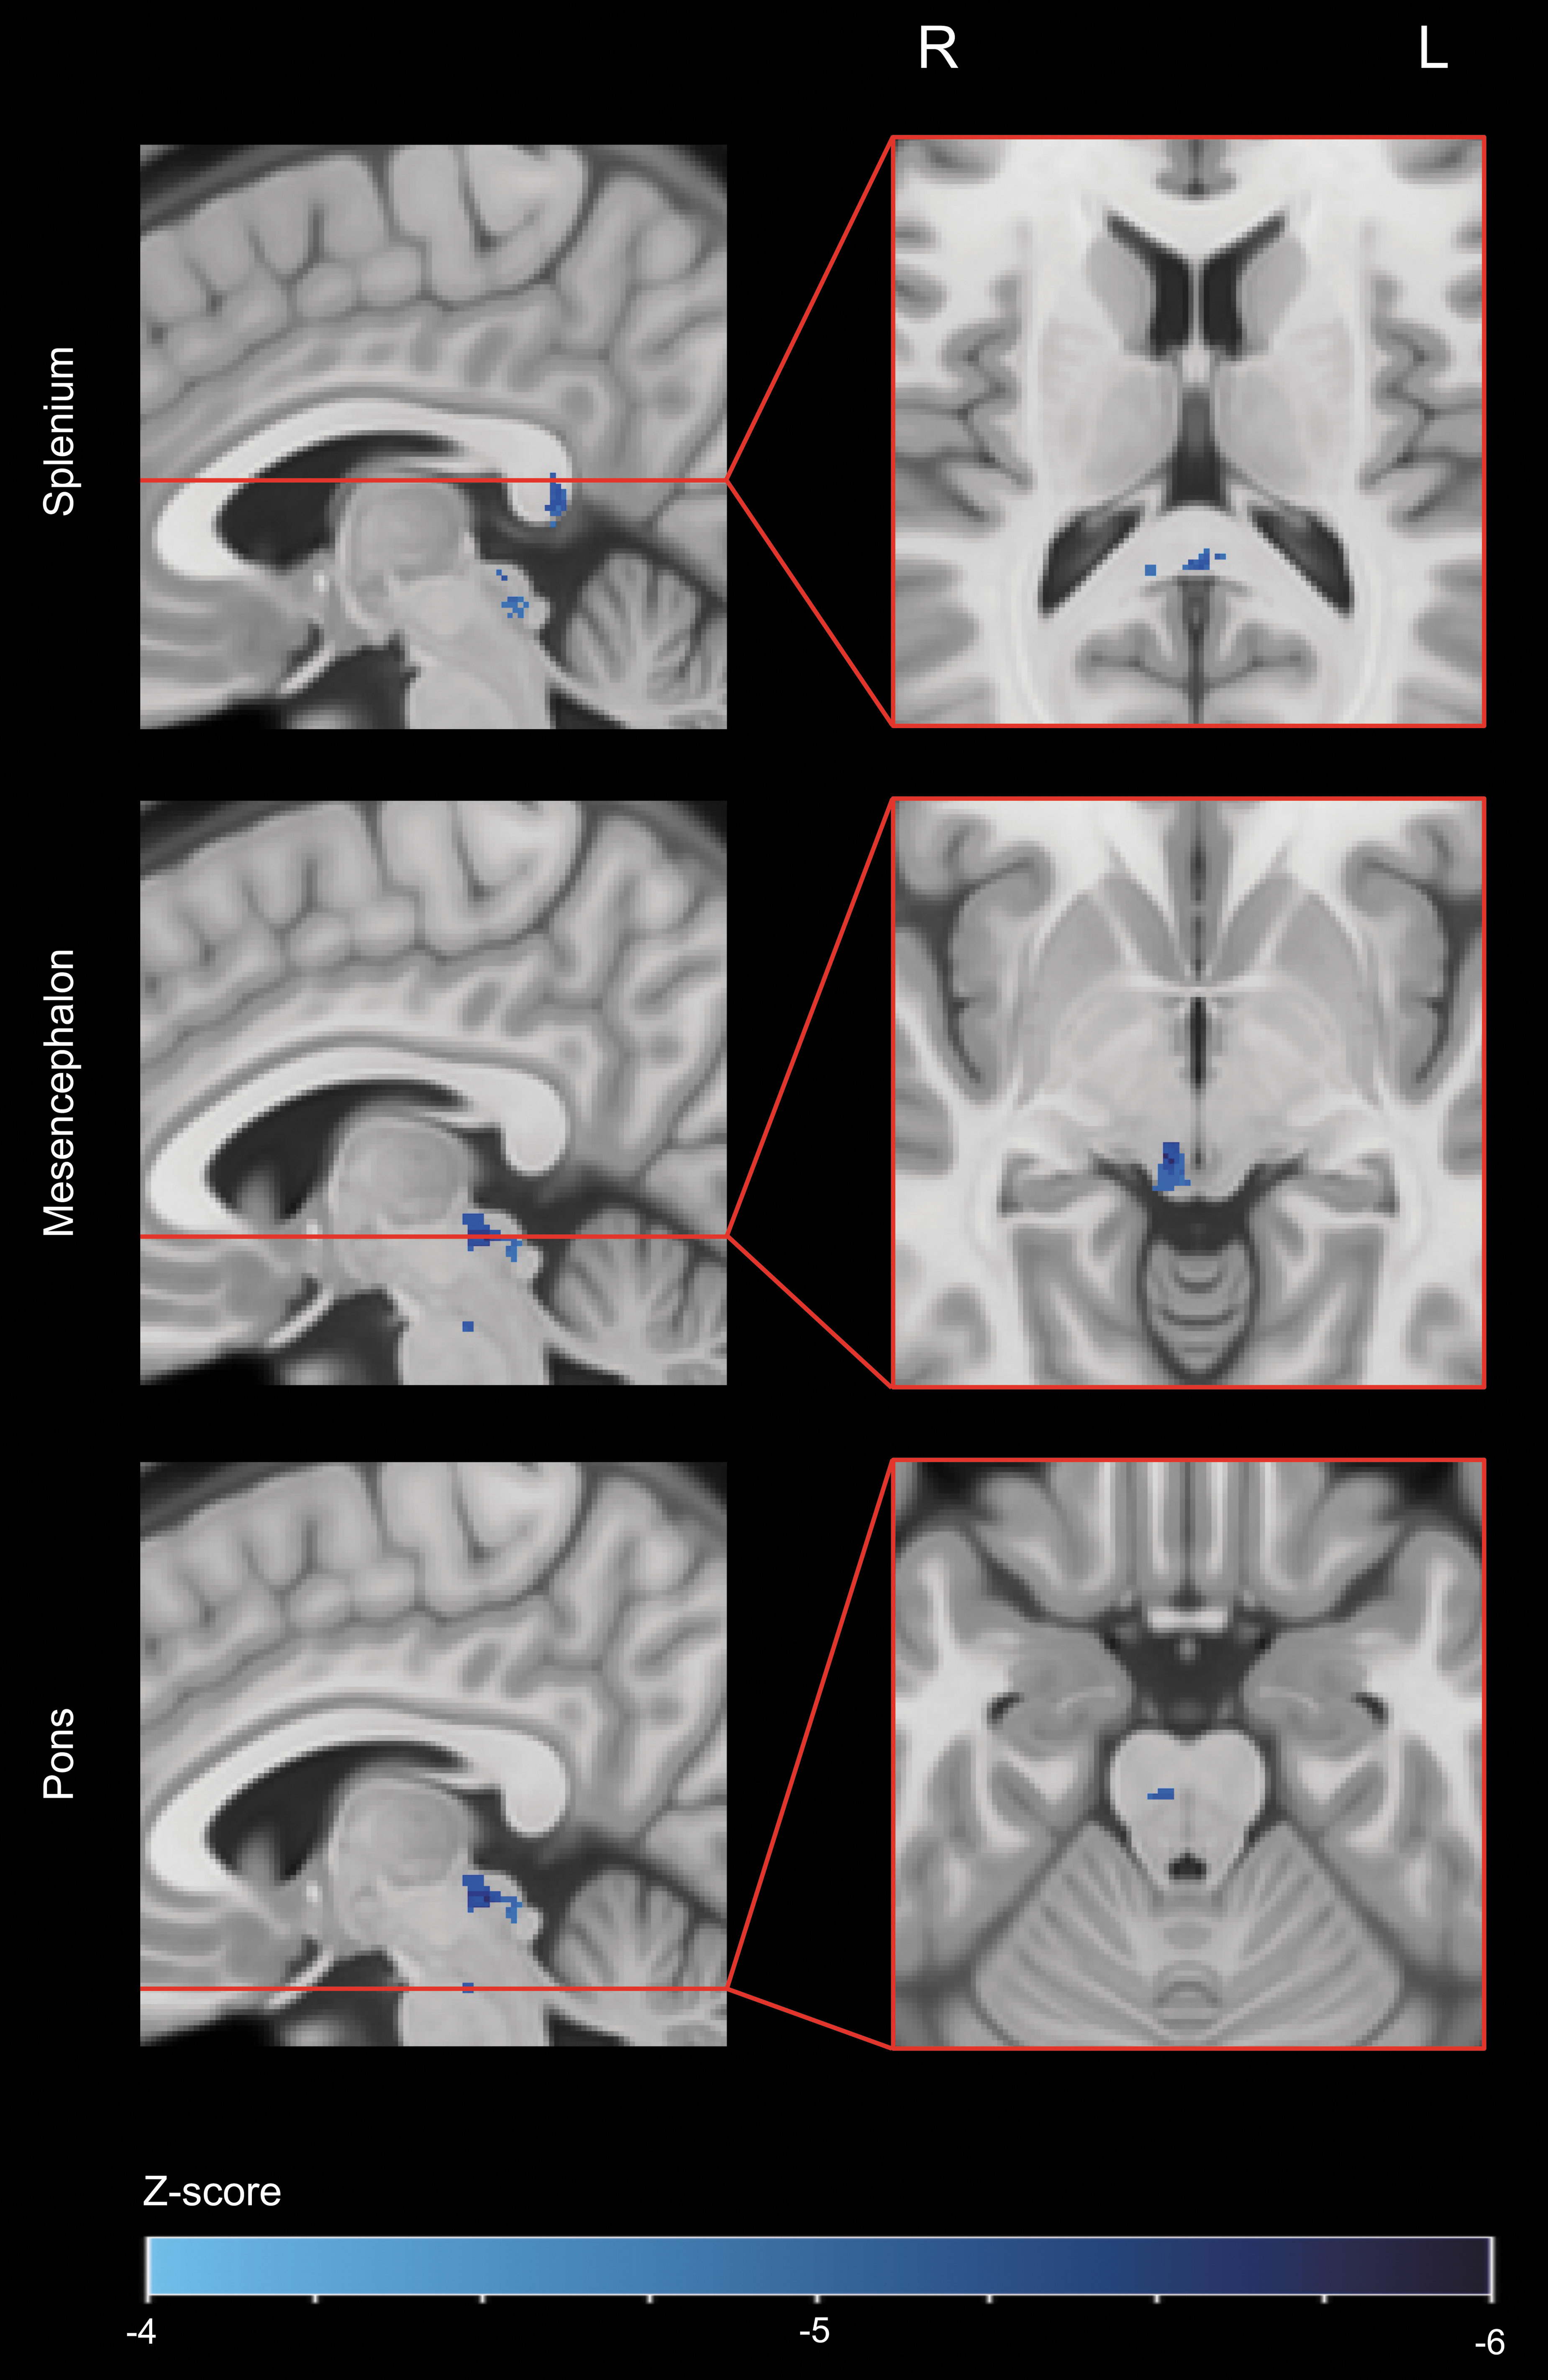
Voxel-based lesion-symptom mapping (VLSM) of TAI on FLAIR.
Additional analyses demonstrated that the patients with the poorest outcome and bilateral TAI in the basal ganglia and/or thalami and/or brainstem had more TAI in the rest of the brain compared with the patients in the same outcome group with unilateral TAI in these areas (Supplementary Fig. 1).
Discussion
In this cohort study of moderate and severe TBI, segmentations of TAI in 269 patients with early MRI were transferred to a common space and combined to lesion frequency distribution maps: one map per MRI sequence (FLAIR, DWI, and T2*GRE/SWI). The overall highest frequency of TAI was found in the splenium and the posterior parts of truncus in the corpus callosum whereas in mesencephalon, TAI was present in all voxels on the FLAIR lesion frequency distribution map. There was a higher frequency of TAI in the frontal and temporal lobes than in the parietal and occipital lobes, and in the upper parts of the brainstem than in the lower. The VLSM revealed statistically significant association to outcome bilaterally in the splenium, in the right side of tectum, and in the right side of the dorsal tegmental parts of the mesencephalon and pons.
The lesion frequency distribution maps revealed more TAI in the frontal and temporal lobes than in the parietal and occipital lobes. This is in accordance with a few studies that have subdivided the hemispheres into their respective lobes, 5,43 but the distribution of TAI within the different hemispheric lobes is often not focused on in imaging studies of TAI.
The applied forces during a trauma have different impact on different parts of the brain. The rotational and angular acceleration or deceleration forces that can lead to TAI tend to be stronger in the anterior lobes than the posterior lobes, which makes the axons in the gray-white junction in the anterior and inferior frontal and temporal lobe particularly vulnerable to injury. 44
Our finding illustrates very well how the visual depiction of TAI using lesion mapping readily displays the diversity of the TAI lesions while eliminating the need of pre-defined subdivision of anatomical areas or regions of interest.
The splenium and the posterior truncus of the corpus callosum had the overall highest frequency of TAI on FLAIR and DWI. The frequent occurrence of TAI in the posterior parts of the corpus callosum is well known from both histopathological and imaging studies. 3,45,46
Corpus callosum is the largest commissural pathway in the brain with a very high density of axons. It is situated inferior to the rigid falx cerebri and is a less mobile structure connecting the more mobile hemispheres. The combination of high axon density and high vulnerability to applied traumatic forces, possibly especially in the posterior parts, might contribute to the high frequency of TAI in these areas on the lesion frequency distribution maps. The replication of acknowledged pathological features adds credibility to lesion mapping as a reliable method both in research and in the clinical approach to TBI.
The TAI was present in the upper half of the brainstem and almost absent in the lower half on all MRI sequences. Similar to the theory for the corpus callosum, a possible explanation for the brainstem findings could be the difference in connection to the surrounding structures. The upper half of the brainstem, including upper parts of pons, is tightly connected to the rest of the brain through pedunculus cerebri and cerebelli while the lower parts of the pons and medulla oblongata are allowed to move more freely.
Another consideration could be that the lower parts of the brainstem comprise life-sustaining structures, and it is possible that patients with lesions here die more often than patients with lesions in the upper parts. The highest frequency in the brainstem overall was found in the tectum and the tegmental parts of mesencephalon, which are known to be predilection sites of TAI. 3,43 TAI was found in the rest of mesencephalon as well, indeed, on group level, we found that all voxels in the mesencephalon were affected by TAI on FLAIR. This global involvement of mesencephalon that also includes its anterior parts has not been discussed in earlier studies.
In the thalamus and the basal ganglia, the highest frequency of TAI was found on FLAIR and DWI in the lateral nuclei of the thalamus. The importance of TAI in the thalamus and the basal ganglia for outcome and level of consciousness has become evident over the last years. 9,16 The complex anatomy of these structures has made agreement on parcellation and nomenclature challenging. 47
Lesion frequency distribution maps consist of accurate location and extent of the depicted pathology in a cohort, and pre-defined parcellation agreements are not needed. This makes direct comparison of patient cohorts less complicated.
Approximately half of the voxels with TAI on the FLAIR map did not have TAI on the DWI map, while approximately one tenth of the voxels with TAI on the DWI map did not have TAI on the FLAIR map. More TAI on FLAIR than on DWI has been reported in one other study, 9 but direct comparison of co-occurrence of TAI on FLAIR and DWI on an individual level has not been performed.
The group with poorest outcome (GOSE 1–4) was the smallest (n = 51, 19%), but had larger areas with higher frequency of TAI than the other outcome groups. Because of more lesions per voxel in the corpus callosum compared with the brainstem, more voxels from the corpus callosum were included in the VLSM analysis. Despite this, tectum and dorsal parts of tegmental mesencephalon and pons showed significant statistical associations to outcome underscoring the particular importance of axonal injury in these areas.
The areas in the mesencephalon and pons with significant associations to outcome were located on the right side. This might be an incidental finding and will have to be confirmed in more and larger studies. We have not found studies discussing the importance of lateralization of TAI lesions in the brainstem to the right side.
In a longitudinal study of brain changes after stroke, the right hemisphere was found to be less resilient to an ipsilateral stroke than the left hemisphere. 48 The majority (65%) of the patients in this study were injured in road traffic accidents. In Norway, we drive on the right side of the road, thus the right hemisphere may be more vulnerable to injury. Another theory could be that injury to the right hemisphere causes other types of functional sequela than injury to the left side, which again could have impact on overall outcome.
The large patient cohort with prospective data and the manual segmentation of TAI lesions on three different MRI sequences by five independent radiologists with high interrater agreement are strengths in this study.
A limitation in this study is the survival bias, because some of the patients died before they got their MRI scan. This might have contributed to the finding that patients with TAI were younger.
The inhomogeneity of the imaging data because of different MRI scanners with different field strengths and pulse sequence protocols is another limitation. The majority of the patients were examined with 1.5T MRI scanners, when the most optimal would have been to have 3T MRI scans of the whole patient cohort. Although the use of 3T MRI scanners is increasing, 1.5T scanners are still commonly used in a clinical setting, and patients with TBI will be examined with either field strength depending on availability at different hospitals.
Also, most of the patients were examined with T2*GRE, when the optimal would have been to have SWI sequences from all the patients, because SWI has a higher sensitivity on detection of microhemorrhages. Lesion maps of TAI on MRI from cohorts with more similar MRI scanners and protocols would be warranted in future studies.
The accuracy of the image registration to the MNI space depends on the quality of the MRI images, which varies somewhat from patient to patient, and therefore is a limitation in this study. Further, we used the ICBM-152 T1 based template to register our FLAIR images. Random samples showed satisfactory coregistration between the images and the template, although a dedicated FLAIR-based template possibly could have improved the accuracy further.
The areas of statistically significant association between outcome and TAI on VLSM in this study are small. The exclusion of voxels with fewer than three patients with TAI contributes to this limitation, but was necessary to assure valid input to the analysis.
If artificial intelligence (AI) becomes a reliable and robust way to generate automatic lesion maps from individual patients, a direct import into clinical tools, such as picture archiving systems (PACS), would enable comparison with lesion frequency distribution maps from large cohorts with outcome information. In this way, lesion mapping could be used in outcome prediction in the clinical workup of patients with TAI. The potential use of AI in lesion mapping of TAI is discussed more in detail in a longer section in the Supplementary Discussion.
Conclusion
We have created and evaluated lesion frequency distribution maps consisting of 269 patients with moderate or severe TBI and TAI on early MRI, a novel method in TAI research. The lesion maps clearly displayed that the highest frequency of TAI was located in the splenium, and that the frequency of TAI was higher in the frontal and temporal lobes than in the parietal and occipital lobes. Importantly, findings on the FLAIR lesion frequency distribution map indicated involvement of all parts of mesencephalon at the group level.
Finally, we found areas with TAI in the right sided brainstem with statistically significant univariable association to outcome. Increasing use and incorporation of AI in clinical imaging tools, such as PACS, are likely to enable less labor-intensive ways to create lesion maps.
The comparison of lesion maps from individual patients to lesion frequency distribution maps from large patient cohorts with emphasis on outcome offers a new tool in the clinical workup of patients with TBI with importance to decision-making and information to patients and their relatives.
Transparency, Rigor, and Reproducibility Summary
This study and the performed analysis plan have not been formally registered, but the team members with primary responsibility, Flusund and Moen (first and last author, respectively), certify that the analysis plan was pre-specified. This is a prospective observational cohort study including patients with moderate and severe traumatic brain injury admitted to two university hospitals between 2004 and 2017. The key inclusion criteria and primary clinical outcome measure (Glasgow Outcome Scale Extended (GOSE)) are established standards. The imaging data consists of magnetic resonance images (MRIs) obtained within six weeks post injury in a clinical setting on different MRI scanners. All protocols included fluid-attenuated inversed recovery (FLAIR), diffusion weighted imaging (DWI) and T2* gradient echo (T2*GRE) / susceptibility weighted imaging (SWI). N = 705 potential participants were screened, imaging data were obtained from n = 370, and successfully analyzed in n = 269 (see figure 1 in the manuscript). The number of subjects in each of the three defined outcome groups (GOSE scores 1-4, 5-6 and 7-8) were n = 51, n = 104 and n = 114 respectively. Five senior consultants in radiology independently and blinded to patient characteristics analyzed the images for signs of traumatic axonal injury (TAI) according to a predefined template. Inter-rater assessment has been performed as part of a related study 16 where Intraclass correlation coefficient was found to be 0.86 and 0.84 for the volumes of traumatic axonal injury on FLAIR and DWI, respectively, and 0.88 for the total numbers of TAI on T2*/SWI. All equipment and software used to perform imaging and post-processing are widely available from commercial sources. Missing data has been handled using imputation as reported in the manuscript and in the Supplement. According to national legislation, data cannot be shared openly. Data can be made available if formal collaboration is established and after appropriate approvals from national legislation. The authors agree to publish the manuscript using the Mary Ann Liebert Inc. “Open Access” option.
Footnotes
Acknowledgments
We thank Elin Saksvoll, Sebastian Abel-Grüner and Øystein Olsen for scoring and segmentation of MRI scans. We would also like to thank Oddrun Sandrød and Torun Farnes for the management of the patient databases and Turid Follestad for support with statistical analyses.
Authors' Contributions
AMHF, LEB, IR, AV and KGM were responsible for the study concept and design. AMHF, LEB, IR and KGM were responsible for the acquisition, analyses and interpretation of data and for the initial draft of the manuscript. All authors critically reviewed the content and approved final version of the manuscript for submission. KGM and IR were responsible for the supervision.
Funding Information
Flusund received funding from the Liaison Committee between the Central Norwegian Regional Health Authority and the Norwegian University of Science and Technology (NTNU, project number 90375700). Moen received funding from the Norwegian University of Science and Technology (NTNU). Flusund and Moen also received funding from the European Union's Horizon 2020 research program, ERA-NET NEURON (grant agreement number 811171) and the Research Council of Norway (TAI-MRI, project number 280282). Bø and Reinertsen received funding from the Liaison Committee between the Central Norwegian Regional Health Authority and the Norwegian University of Science and Technology (NTNU, project number 90375700).
The funders and sponsors had no role in the design and conduct of the study; collection, management, analyses, and interpretation of the data; preparation, review, or approval of the manuscript; and decision to submit the manuscript for publication.
Author Disclosure Statement
The authors report no conflict of interest.
Supplementary Material
Supplementary Methods
Supplementary Discussion
Supplementary Table 1
Supplementary Figure 1
References
Supplementary Material
Please find the following supplemental material available below.
For Open Access articles published under a Creative Commons License, all supplemental material carries the same license as the article it is associated with.
For non-Open Access articles published, all supplemental material carries a non-exclusive license, and permission requests for re-use of supplemental material or any part of supplemental material shall be sent directly to the copyright owner as specified in the copyright notice associated with the article.