
Abstract
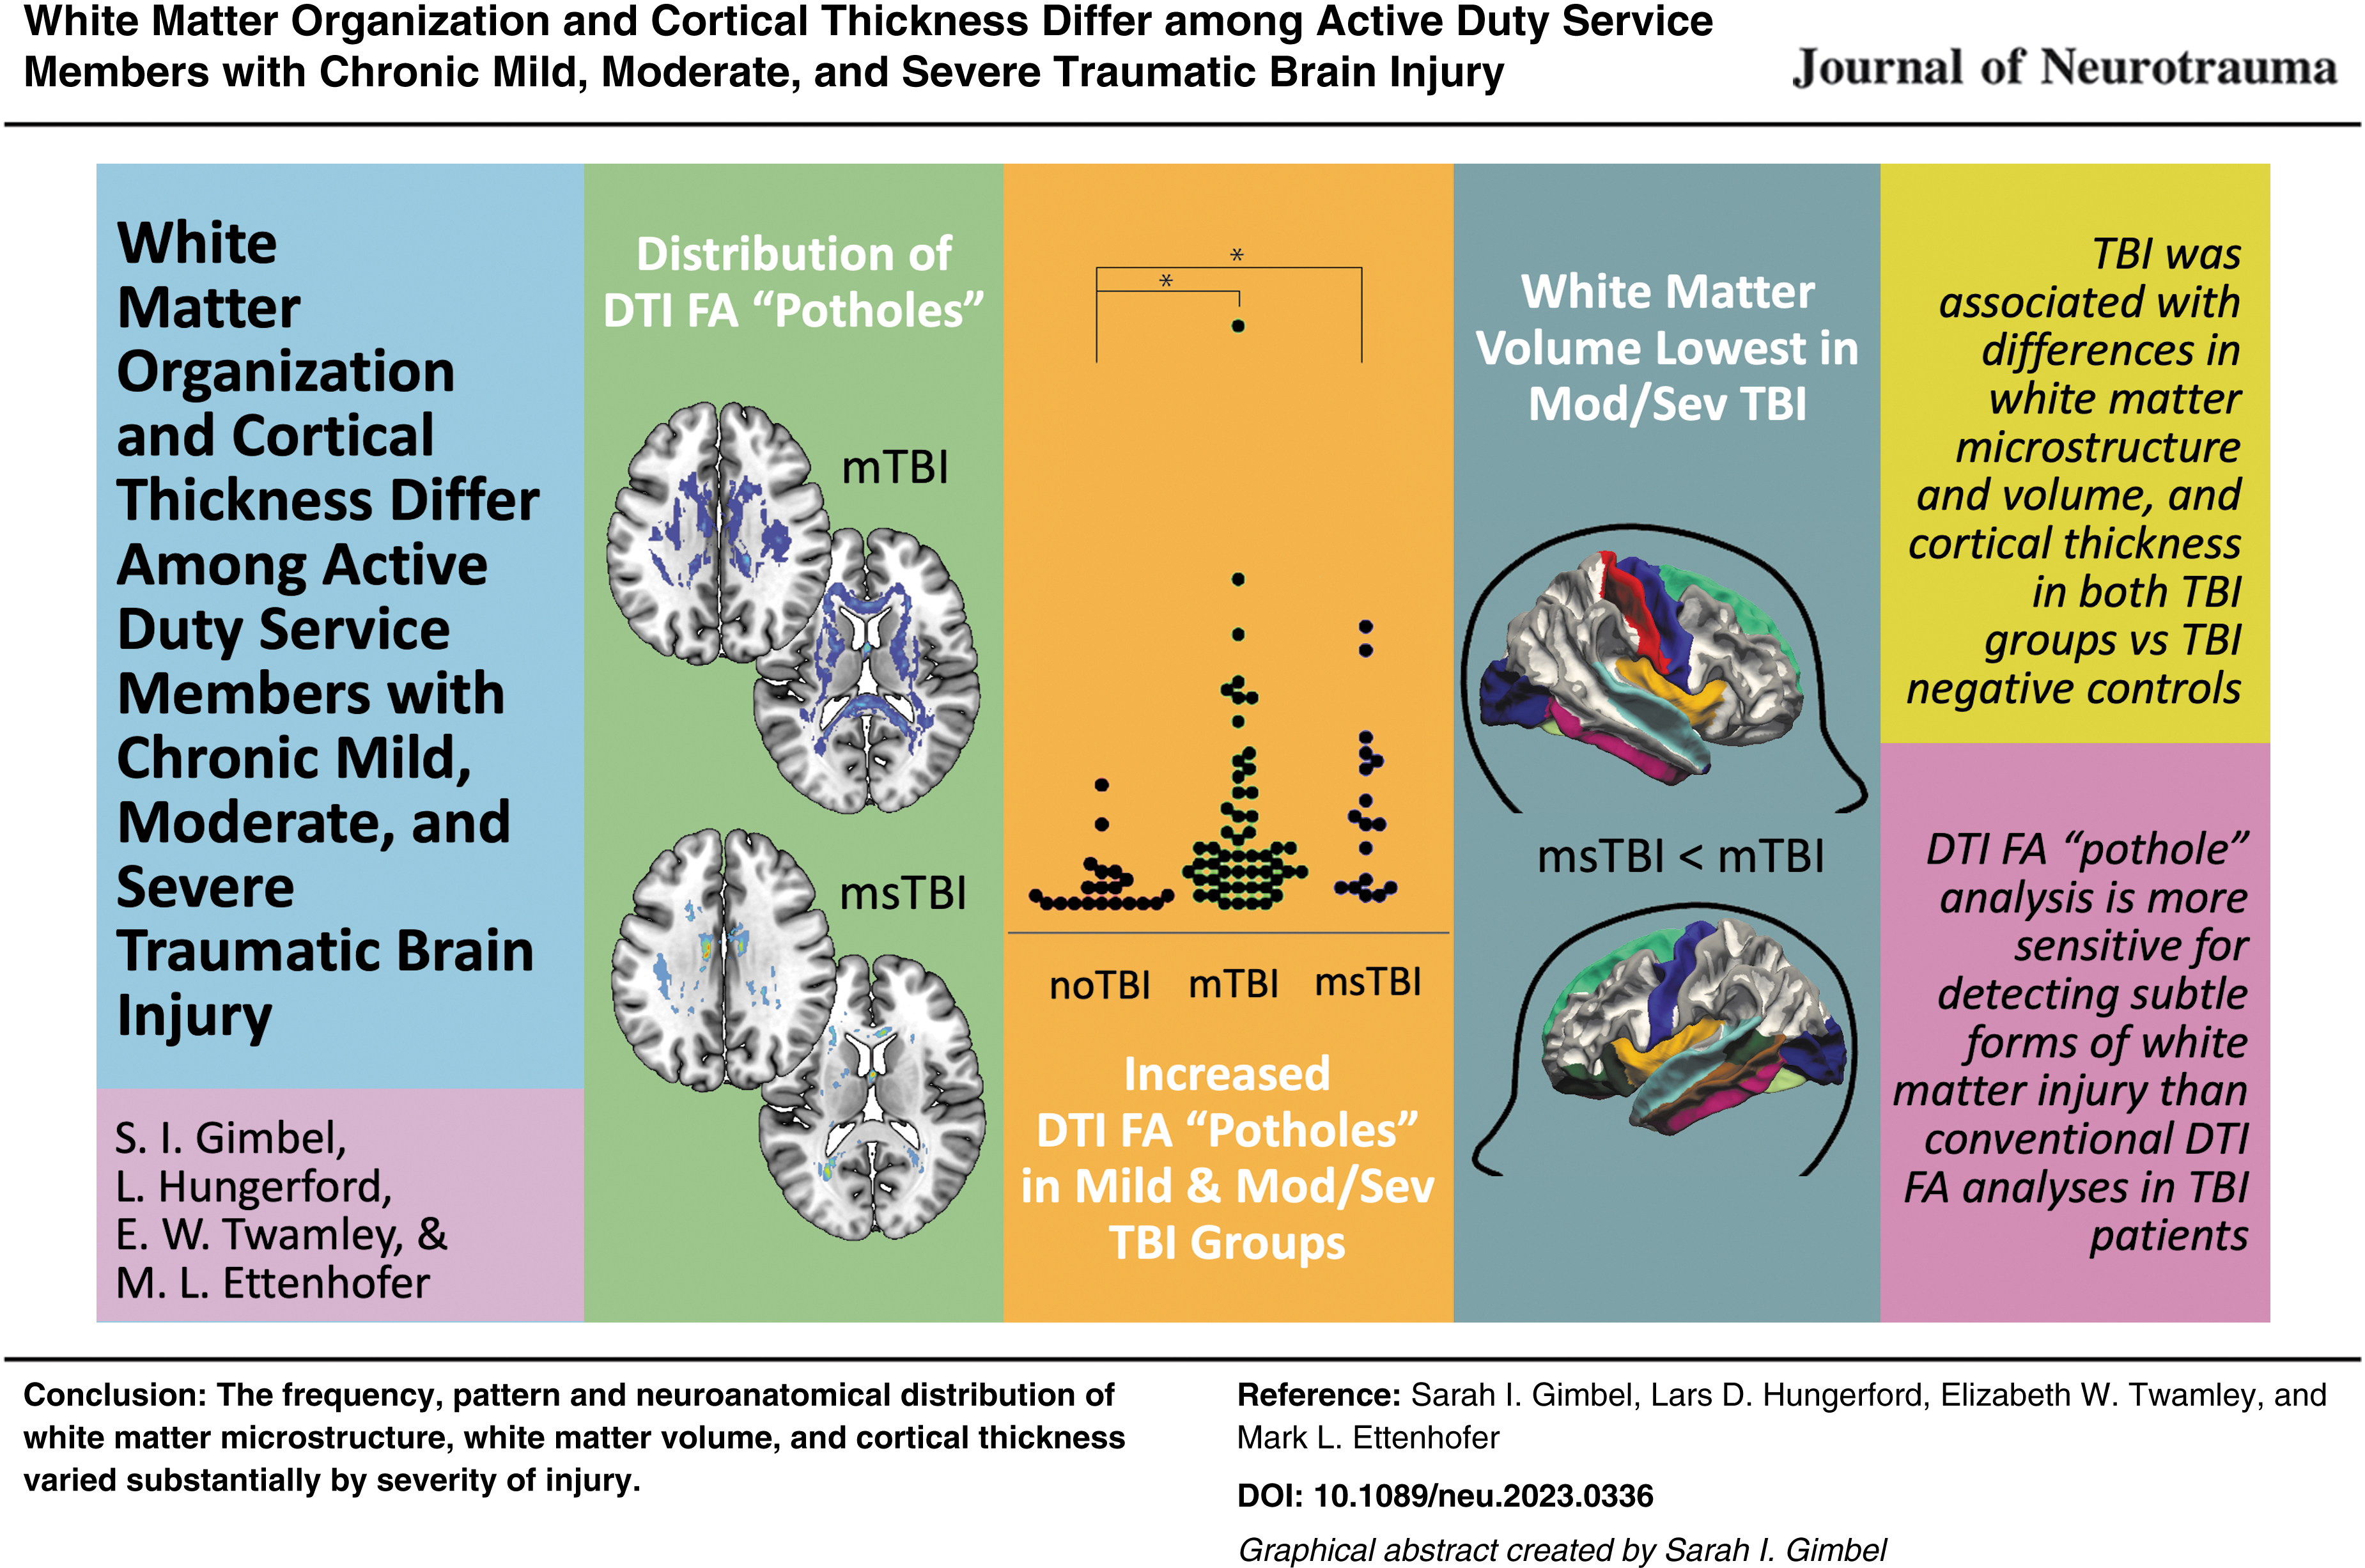
This study compared findings from whole–brain diffusion tensor imaging (DTI) and volumetric magnetic resonance imaging (MRI) among 90 Active Duty Service Members with chronic mild traumatic brain injury (TBI; n = 52), chronic moderate-to-severe TBI (n = 17), and TBI-negative controls (n = 21). Data were collected on a Philips Ingenia 3T MRI with DTI in 32 directions. Results demonstrated that history of TBI was associated with differences in white matter microstructure, white matter volume, and cortical thickness in both mild TBI and moderate-to-severe TBI groups relative to controls. However, the presence, pattern, and distribution of these findings varied substantially depending on the injury severity. Spatially-defined forms of DTI fractional anisotropy (FA) analyses identified altered white matter organization within the chronic moderate-to-severe TBI group, but they did not provide clear evidence of abnormalities within the chronic mild TBI group. In contrast, DTI FA “pothole” analyses identified widely distributed areas of decreased FA throughout the white matter in both the chronic mild TBI and chronic moderate-to-severe TBI groups. Additionally, decreased white matter volume was found in several brain regions for the chronic moderate-to-severe TBI group compared with the other groups. Greater number of DTI FA potholes and reduced cortical thickness were also related to greater severity of self-reported symptoms. In sum, this study expands upon a growing body of literature using advanced imaging techniques to identify potential effects of brain injury in military Service Members. These findings may differ from work in other TBI populations due to varying mechanisms and frequency of injury, as well as a potentially higher level of functioning in the current sample related to the ability to maintain continued Active Duty status after injury. In conclusion, this study provides DTI and volumetric MRI findings across the spectrum of TBI severity. These results provide support for the use of DTI and volumetric MRI to identify differences in white matter microstructure and volume related to TBI. In particular, DTI FA pothole analysis may provide greater sensitivity for detecting subtle forms of white matter injury than conventional DTI FA analyses.
Introduction
More than 473,000 United States Military Service Members have been diagnosed with traumatic brain injury (TBI) since 2000. The majority of these injuries are classified as “mild” (mTBI), with roughly 12% classified as “moderate” or “severe” (msTBI). 1 Brain computed tomography and conventional magnetic resonance imaging (MRI) results are often negative after TBI, especially for those with mTBI. However, based on findings from advanced forms of imaging, cortical thinning and diffuse axonal injury (a shearing injury in which the white matter of the brain is damaged) are common following TBI and are thought to underlie many persistent cognitive impairments. 2 -4 Diffusion tensor imaging (DTI), which is often used to characterize white matter microstructure in the form of fractional anisotropy (FA), has grown in popularity as a method for detecting injury-related abnormalities that may not be visible on commonly used clinical scans such as T1 or T2 imaging. 5 -7 However, given the heterogenous spatial distribution of white matter pathology in TBI, voxel-wise and tractographic methods for examining white matter organization in group data may not have sufficient power to truly reflect the effects of TBI on white matter organization.
In the general population, many studies have examined white matter organization across the spectrum of TBI severity, both in the acute (< 3 month) and chronic (> 3 month) phases of injury. Changes in white matter organization have been documented as early as the day of injury 8,9 and often persist for many years. 10 –14 Midline brain structures such as the corpus callosum are believed to be most susceptible to the shearing and rotational forces of traumatic brain injury. 15 -17 Indeed, a landmark postmortem study reported damaged axons in the corpus callosum and fornix following TBI, providing evidence that these regions are most vulnerable to trauma; 18 subsequent in vivo studies have supported this finding. 11,19 Additionally, other major white matter structures including the internal capsule, 11 superior and inferior longitudinal fasciculi, 19 and cerebellar fibers 20,21 have commonly shown abnormalities following TBI.
A recent meta-analysis of white matter organization following TBI confirmed that DTI findings can differ substantially for mild versus moderate/severe TBI populations. 22 For those who have suffered msTBI, DTI studies reliably reveal decreased FA persisting into the chronic stage of injury, suggesting loss of axonal integrity, specifically in the corpus callosum, internal capsule, and superior longitudinal fasciculus, 11 as well as other long and short white matter fibers. 13 Although variability exists in the tracts demonstrating abnormalities following mTBI, there are some consistent findings as well. Many mTBI studies have demonstrated white matter abnormalities in the acute and subacute stages of injury, 23 but in a subset of individuals, these deficits may persist many years post-injury. 24 -26 Similar to the msTBI group, white matter changes in the mTBI group are most frequently identified in commissural and long coursing fiber tracts, albeit typically to a lesser extent. 11,27 Anterior corona radiata, forceps major, and corpus callosum have shown increased loss of integrity in the chronic stage of mTBI recovery, predicting the persistence of post-concussion syndromes. 28 Thus, certain tracts may provide an objective biomarker for tracking the pathological recovery process following mTBI.
There is, however, less anatomical consistency for injured regions in mTBI compared with the msTBI population, possibly related to differences in mechanisms and type of injury. While one study of chronic stage mTBI found no difference in corpus callosum FA between the mTBI and non-brain injured control groups, 29 a meta-analysis including both acute and chronic studies concluded that the corpus callosum is indeed vulnerable in mTBI, with no significant moderation of this effect based on time since injury. 30
The lack of consistent findings at a sub-regional level in chronic TBI is likely related to the diffuse and heterogeneous spatial distribution of injury in the brain, especially in the mild group. One approach to address this issue, known as “pothole” analysis, identifies heterogeneous areas of decreased FA using voxel-wise comparison of an injured individual's FA to a reference control population. In a study of veterans with mTBI, Jorge and colleagues found no voxel-wise differences between the mTBI group and a healthy control group in FA, but the mTBI group had a greater number of potholes across the brain than the control group. 31 However, relatively few studies to date have used this approach for examining white matter abnormalities, despite consensus that standard practices for examining FA in a heterogeneous group of TBI patients may be inadequate.
While significantly less is known about cortical structure changes following TBI, early understanding comes from animal models, which have showed cortical thickening (likely due to edema) immediately following brain injury, followed by thinning over time. 32 Since most mTBI patients fail to show detectible cortical abnormalities using traditional neuroradiological examinations, more advanced cortical segmentation, with inspection of gray matter thickness, may elucidate connections between cortical findings following TBI and sustained effects of injury. 33
A study of veterans in the chronic stage of mTBI (>3 months post-injury) showed thinning of cortex in the left dorsal superior frontal and superior temporal gyri, signifying early effects of mTBI in the cerebral cortical architecture. 34 In a longitudinal study following patients from acute injury to 3 months post-injury, patients showed significant cortical thinning in the middle temporal gyrus compared with orthopedic-injury controls. 35 An additional study of sports-related mTBI found cortical thinning in the left dorsolateral prefrontal cortex and right inferior parietal cortex compared with uninjured participants. 36 Although many studies have shown a variety of regional changes in cortical thickness, including evidence for frontotemporal vulnerability following TBI, 37 –48 no consistent findings across studies have emerged. Additionally, a number of recent studies have reported no differences in cortical thickness between brain injured and uninjured groups, 49 -51 limiting the generalizability of differences that have been identified in this population.
These changes in white matter organization and cortical thickness following TBI may be understood in the context of previous findings related to cellular neuropathology. TBI is known to trigger the release of pro-inflammatory cytokines and chemokines, which can activate the brain's immune response in both microglia and astrocytes. This can then lead to the release of additional pro-inflammatory molecules, creating a cycle of inflammation that can cause neuronal damage. 52 This response can contribute to neuronal and glial cell death as well as the disruption of the blood–brain barrier, exacerbating inflammation and leading to tissue damage. 53 Damaged fiber tracts and disruption of myelin surrounding neurons can lead to cellular loss, ultimately expressed as volume loss in the brain. 54 In sum, previous findings related to the cellular neuropathology of TBI underscore the need to examine both white matter organization and gray matter thickness when seeking to understand brain markers of injury.
This study was conducted to evaluate structural white matter and gray matter changes in Active Duty Service Members with a history of chronic/symptomatic TBI (mild, moderate, or severe). These participants were compared with a group of healthy control Service Members with no history of brain injury. A goal of this study is to use the same procedures to examine white and gray matter integrity across the TBI severity spectrum, comparing mild, moderate/severe, and uninjured groups all within an Active Duty Service Member population. Mild and moderate/severe injury groups were evaluated separately to identify differential brain structure changes related to injury severity. Moderate and severe TBI groups did not differ in white matter microstructure or gray matter cortical thickness, and thus were grouped together for analysis. Voxel-wise and region of interest (ROI)–based analyses of FA and cortical thickness were performed in conjunction with the more novel pothole analysis approach to increase sensitivity for identifying potential lasting effects of TBI in an Active Duty population.
Methods
Participants
Participants included U.S. Active Duty military volunteers recruited from military treatment facilities in the San Diego area. The TBI groups consisted of adults (>18 years old) with persistent self-reported symptoms related to TBI sustained more than 3 months before study participation; the control group consistent of adults with no history of TBI or other neurological conditions (noTBI). Participants were divided into groups based on VA/DOD guidelines, defining mild TBI as <30 min loss of consciousness, <24 h confusion/disorientation, and/or <24 h post-traumatic amnesia; moderate TBI as 30 min-24 h loss of consciousness, >24 h confusion/disorientation, and/or >24 h post-traumatic amnesia; and severe TBI as >24 h loss of consciousness, GCS 3-8, and/or >7 days post-traumatic amnesia. Ninety participants (n = 21 noTBI, n = 52 mTBI, n = 17 msTBI) met full eligibility requirements and were included in analysis. After determining that there were no significant differences in brain metrics between the two groups, the moderate (n = 12) and severe (n = 5) TBI groups were combined for the purposes of this study. Participants were excluded from this study if they had a neurological condition, psychiatric disorders, contraindications for MRI, or a history of a medical condition that would be expected to affect cognitive or motor abilities.
Experimental procedure
After providing written informed consent, participants provided demographic information and medical history (Table 1). History of TBI was obtained using the Ohio State University TBI Identification Method (OSU TBI-ID) 55,56 and verified using available medical records. Participants completed a brief screening battery of standardized self-reported symptom surveys, including Neurobehavioral Symptom Inventory (NSI), 57 PCL-5 (Post-Traumatic Stress Disorder Checklist for Diagnostic and Statistical Manual of Mental Disorders, Fifth Edition), 58 and Headache Impact Test-6 (HIT6). 59 -61 Participants then completed structural and functional MRI. This research was approved by the Institutional Review Board at Naval Medical Center San Diego.
Demographic Information and Self-Report Scores
Statistical significance of t-test, analysis of variance, or chi-square, as appropriate.
Statistically significant at p < 0.05.
TBI, traumatic brain injury; M, male; F, female; NSI, Neurobehavioral Symptom Inventory; PCL-5, Post-Traumatic Stress Disorder Checklist for Diagnostic and Statistical Manual of Mental Disorders, Fifth Edition; HIT-6, Headache Impact Test-6.
MRI data acquisition
Imaging was performed using a Philips Ingenia 3T MRI running software R5.3.1 with a 16-channel matrix head coil. A T1-weighted high-resolution image was acquired using a 3D T1w Turbo Field Echo (TFE) pulse sequence (TFE factor = 256, repetition time (TR) = 6.7 msec, inversion time (TI) = 890 msec, TE = 3.0 msec, shot interval time = 3000 msec, 218 shots, flip angle = 8°, 256 × 256 matrix, phase encoding direction = y). One hundred and seventy slices covering the entire brain were acquired with a voxel resolution of 0.94 × 0.89 × 1 mm. Total scan time was 10:57. Diffusion tensor images were acquired with a pulsed gradient-spin echo sequence with an echo-planar imaging readout in 32 directions (TR = 6853 msec, TE = 103 msec, acquisition matrix = 112 × 110, slice thickness = 3.00 mm, flip angle = 90°, EPI factor = 55). Forty-eight slices covering the entire brain were acquired with an inplane resolution of 2 × 2.04 × 3 mm. Total scan time was 8:46.
MRI data analysis
Structural MRI analysis
MRI structural images were first analyzed using FSL's fMRI analysis tool, FEAT version 6.0.1 (FMRIB's Software Library
Cortical reconstruction and volumetric segmentation were performed with the FreeSurfer image analysis suite (
Voxel-wise DTI analysis of fractional anisotropy
DTI data were analyzed using FSL's FDT toolbox. Voxel-wise statistical analysis of FA was carried out using Tract-Based Spatial Statistics (TBSS), 82 within FSL. 63 First, FA images were created by fitting a tensor model to the raw diffusion data using FDT, and then brain-extracted using BET. 65 All subjects' FA data were then aligned into a common space using the nonlinear registration tool FNIRT, 66,83 which uses a b-spline representation of the registration warp field. 84 Next, the mean FA image was created and thinned to create a mean FA skeleton with a threshold FA value of 0.2, representing the centers of all tracts common to the group. Each subject's aligned FA data was then projected onto this skeleton and the resulting data were fed into voxel-wise cross-subject statistics. Statistical analysis was performed using the “randomize” command in FSL. The number of permutations was set to 10,000, and correction for multiple comparisons was achieved using threshold-free cluster enhancement with a family-wise error rate of p < 0.05.
Region of interest DTI analysis of fractional anisotropy
To evaluate average FA in pre-defined white matter regions of interest, the brain was separated into 48 white matter regions based on the ICBM-label atlas. 85 -87 Average FA was extracted for each region for each participant using the mean FA image created in the FDT process described above. Following FA value extraction, the three participant groups were compared using an analysis of variance (ANOVA) to determine regions of significant difference.
Pothole DTI analysis
Because of the heterogeneous nature of white matter damage in TBI, additional analyses were implemented examining DTI “potholes.” Potholes represent white matter with FA values that are abnormally low compared with a healthy control group. Pothole analysis has been shown to be sensitive to white matter changes, 88 specifically in mTBI, in previous studies. 31,89,90 To begin, a normative template based on the MNI-registered DTI volumes of the noTBI participants was generated using tools available within FSL. FSL FAST 91 results were used to restrict the calculations to white matter voxels common among noTBI participants. Volumes representing the mean and standard deviation (SD) of each white matter voxel were then calculated via fslmaths. For each TBI participant, their own FAST white matter map was used to restrict their DTI volume to white matter, and a z-score map was generated by subtracting the control group mean volume and dividing by the control group SD volume. The resulting z-maps were thresholded at z = -3, and FSL cluster was used to label contiguous voxels below this threshold. These resulting clusters are considered potholes. These potholes were then thresholded at ≥10 mm3. 90 The sum of pothole clusters for each participant was then used as the measure of reduced white matter organization in further analyses.
Statistical analysis
SPSS 28.0 software (IBM Corp., Armonk, NY, USA) was used for statistical analysis. An independent samples t-test or Mann-Whitney test was used to compare group differences depending on data normality. A one-way ANOVA was used when comparing differences among all 3 groups, with post hoc Bonferroni analysis for significant difference between two-group pairs. Chi-square analyses were used to compare groups on categorical variables. Effect sizes (d) were computed to demonstrate the magnitude of observed differences. Spearman's correlation coefficients were used to examine associations between white matter and gray matter metrics. The significance level was adjusted by using the Bonferroni correction with p < 0.05.
Results
Participant demographic and clinical characteristics
Participant characteristics for the three study groups are detailed in Table 1. The proportion of men and women in the study matched expectations, given the sex breakdown in this military population as a whole. There was no significant difference in the distribution of men and women among the three groups [χ 2 (2,90) = 3.289, p = 0.193]. Age varied significantly among the three groups [F(2,87) = 9.404, p < 0.001, η 2 = 0.178], with msTBI participants being the youngest overall, followed by the noTBI group, with the mTBI participants being the oldest. Age was controlled in all volumetric analyses. Number of lifetime TBIs ranged from one to 13 and differed between the mTBI and msTBI groups [t(67) = 2.953, p = 0.004, d = 0.825]. Sensitivity analyses controlling for repeated injuries were performed, but the results did not meaningfully differ; therefore, this variable is not controlled in further analyses. Time since injury in the mTBI group was significantly greater than in the moderate-severe group [t(67) = 3.413, p < 0.001, d = 0.954]. Causes of participants' most recent TBIs varied, including motor vehicle accidents, military training and deployment, falls and accidents, sports-related injuries, and incidences of assault or abuse. There was a significant overall difference between the mTBI and msTBI groups in cause of injury [χ 2 (4,69) = 10.437, p = 0.034], with greater observed proportions of mTBIs caused by military activity and sports injuries, and a greater proportion of moderate-severe TBIs caused by accidents/falls. The three groups did not differ significantly in race/ethnicity [χ 2 (12,90) = 9.963, p = 0.619]. Average years of education was significantly different among the three groups [F(2,87) = 4.229, p = 0.018, η 2 = 0.089], driven by slightly fewer years of education in the msTBI group. The NSI score differed across the three groups [F(2,87) = 17.443, p < 0.001, η 2 = 0.286], with lowest symptom severity in the noTBI group, followed by the msTBI group and greatest severity of symptoms in the mTBI group. PCL-5 total scores differed among the three groups [F(2,87) = 8.635, p < 0.001, η 2 = 0.174], driven by a post hoc significant difference between the noTBI and mTBI groups. Headache Impact Test (HIT-6) total scores also differed among the 3 groups [F(2,87) = 23.422, p < 0.001, η 2 = 0.364], driven by post hoc significant differences between the mTBI group and both other groups.
Voxel-wise DTI analysis of fractional anisotropy
In a voxel-wise analysis of white matter organization, there were no significant differences in FA between the mTBI group and either the noTBI or msTBI groups (Fig. 1A, 1C). There were, however, many areas in which the msTBI group had lower FA than the noTBI group, including voxels in bilateral anterior and superior corona radiata, bilateral external capsule, bilateral anterior limb of internal capsule, left superior longitudinal fasciculus, left posterior corona radiata, bilateral cingulum, left posterior limb and retrolenticular limb of the internal capsule, left posterior thalamic radiation, left sagittal striatum, the full length of the corpus callosum, and bilateral uncinate fasciculus, cerebral peduncle and corticospinal tract (Fig. 1B, warm colors). For display purposes, non-significant differences between groups (0.25 > p > 0.05) are presented in cool colors.
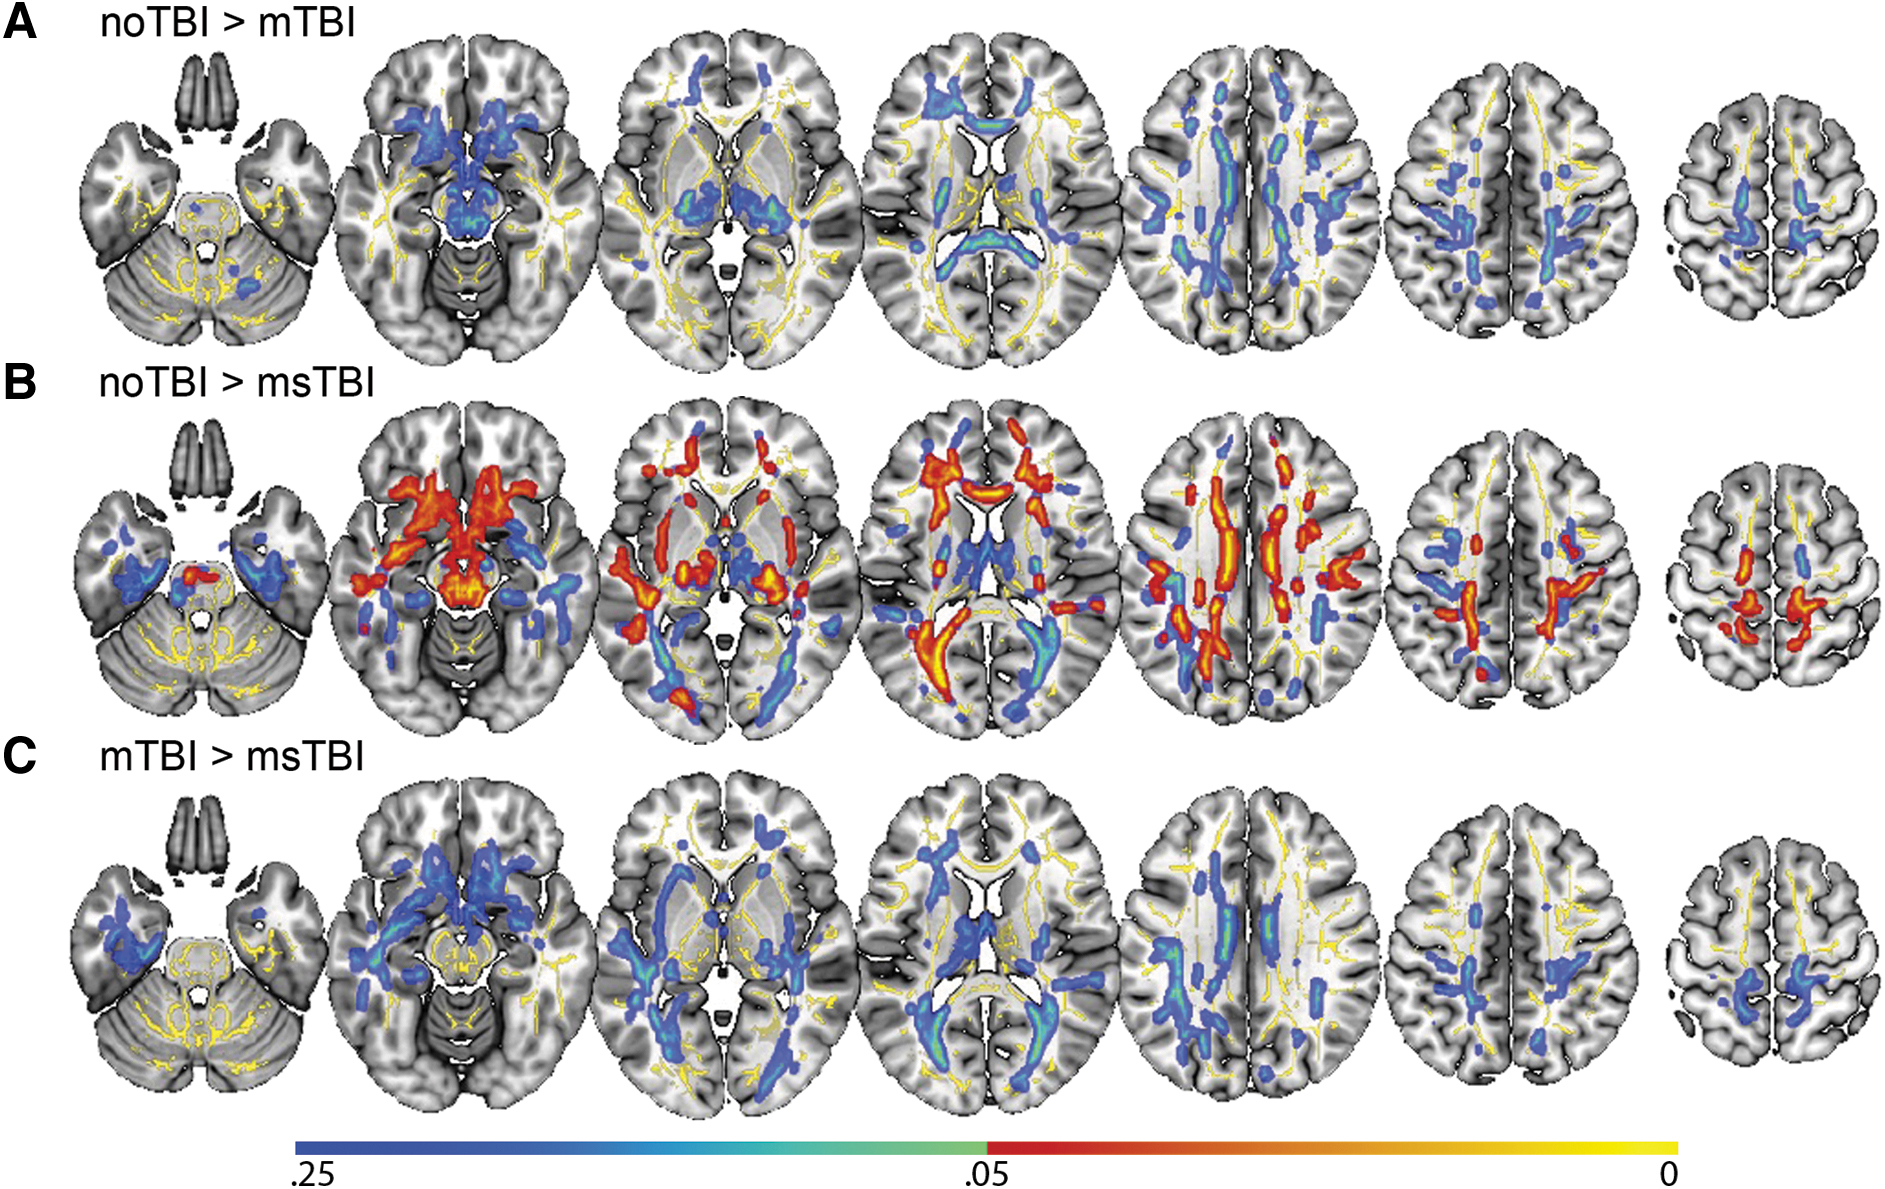
Differences in whole-brain voxel-wise fractional anisotropy (FA) by group. No significant voxel-wise whole brain differences were found between the mild traumatic brain injury (mTBI) group and either of the other two groups.
Region of interest DTI analysis of fractional anisotropy
Separating the brain into 48 white matter regions based on the ICBM-label atlas, two regions were identified where FA values differed significantly among groups. In the middle cerebellar peduncle (Fig. 2, yellow), there was a significant difference among the three groups in regional FA [F(2,87) = 3.562, p = 0.033, η 2 = 0.077], driven by significant post hoc differences in average FA between the noTBI group (0.40 ± 0.06) and the two TBI groups (mTBI: 0.42 ± 0.06; msTBI: 0.43 ± 0.03). In the fornix (Fig. 2, magenta), there was a significant difference among the 3 groups in regional FA [F(2,87) = 3.824, p = .026, η 2 = 0.082], driven by post hoc significant difference in average FA between the noTBI group (0.37 ± 0.05) and the msTBI group (0.31 ± 0.06).
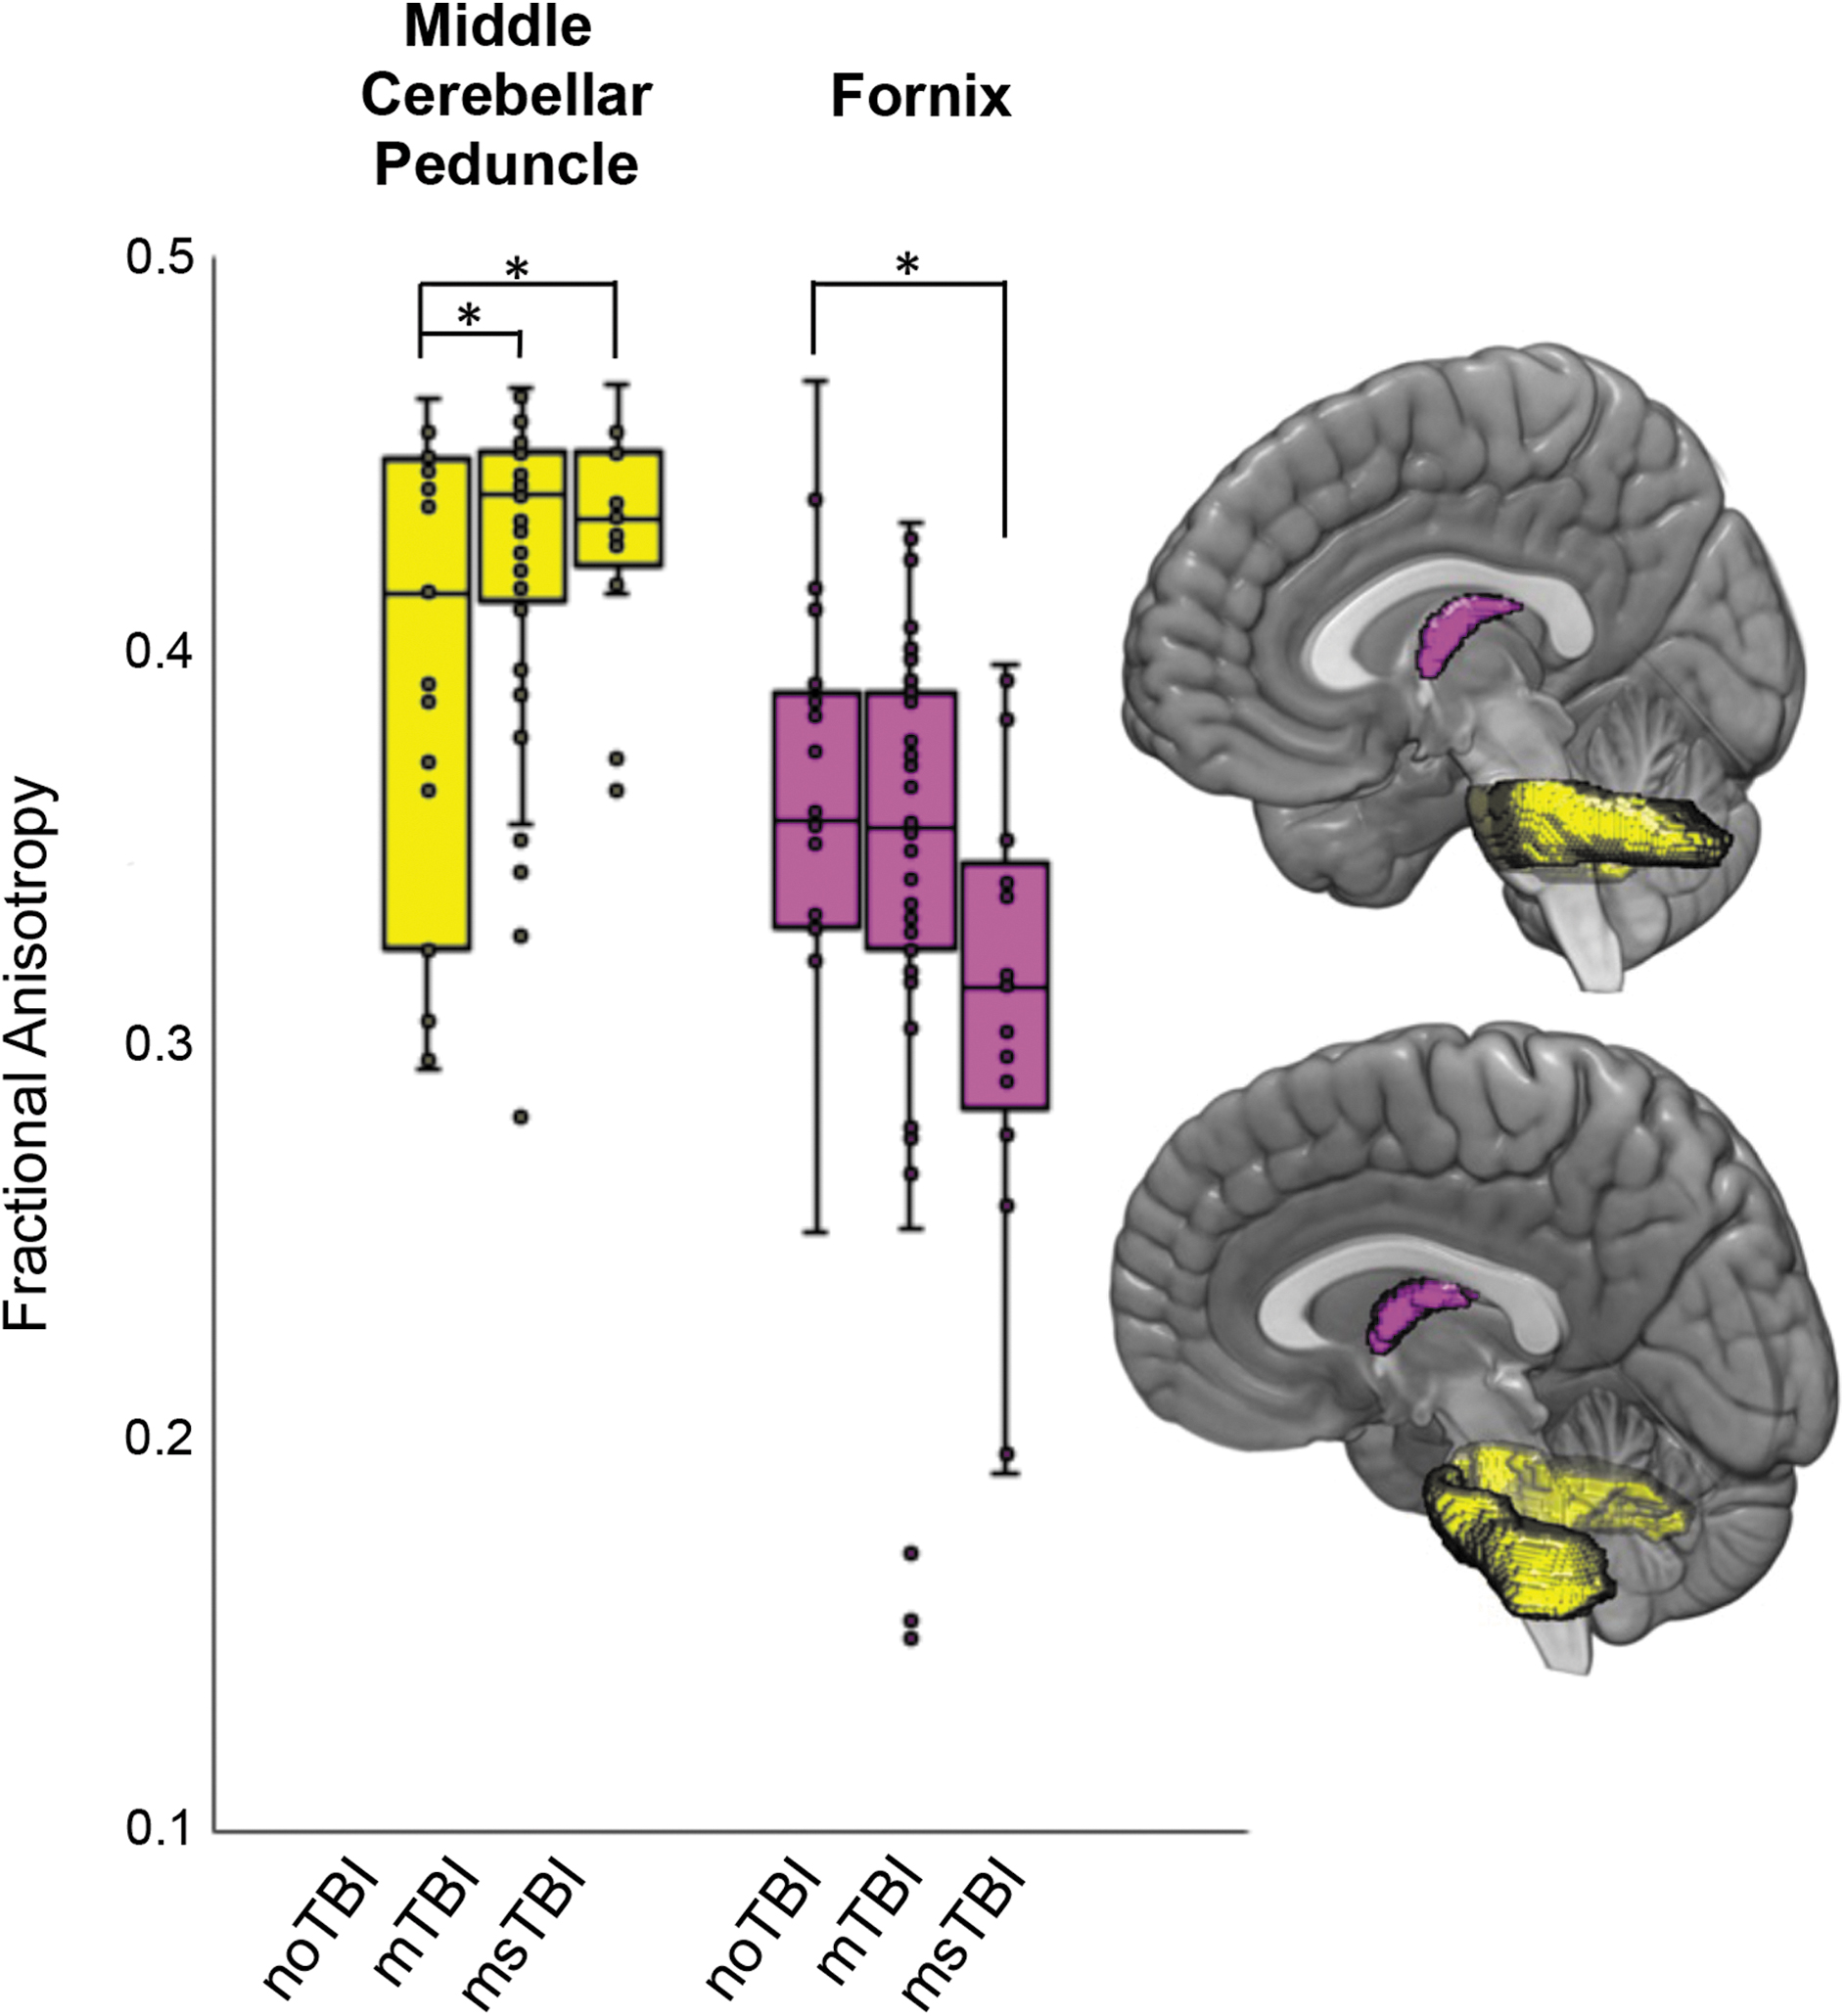
Differences in regional fractional anisotropy (FA) by group. Regions with differential fractional anisotropy among the three groups included the middle cerebellar peduncle (yellow) and the fornix (magenta). Box plots showing the distribution of FA values within each group are presented for the two regions with difference in FA as defined by the ICBM atlas. *post hoc p < 0.05
Pothole DTI analysis
Next, clusters with abnormally reduced FA (DTI “potholes”) were identified for each individual, as defined by FA >3 SD below the noTBI population average. Individual participants in the noTBI control group demonstrated a relatively low frequency and small size of DTI potholes, relative to the broader noTBI group, spread in small clusters across the white matter (Fig. 3A). In the mTBI group, potholes were identified in each segment of white matter in the ICBM atlas, with 35% of the mTBI group demonstrating potholes in each of the fornix, corpus callosum, bilateral superior longitudinal fasciculus, left external capsule, right cerebral peduncle, and bilateral internal capsule (Fig. 3B). Potholes in the msTBI group were located in corpus callosum, bilateral cingulum, superior, anterior, and posterior corona radiata, posterior thalamic radiation, superior longitudinal fasciculus, internal capsule, stria terminalis, left sagittal stratum, superior fronto-occipital fasciculus, external capsule, pontine crossing tract, medial lemniscus, and middle cerebellar peduncle (Fig. 3C). These potholes were less widely distributed than the mTBI group, potentially related to the smaller number of msTBI relative to mTBI participants.
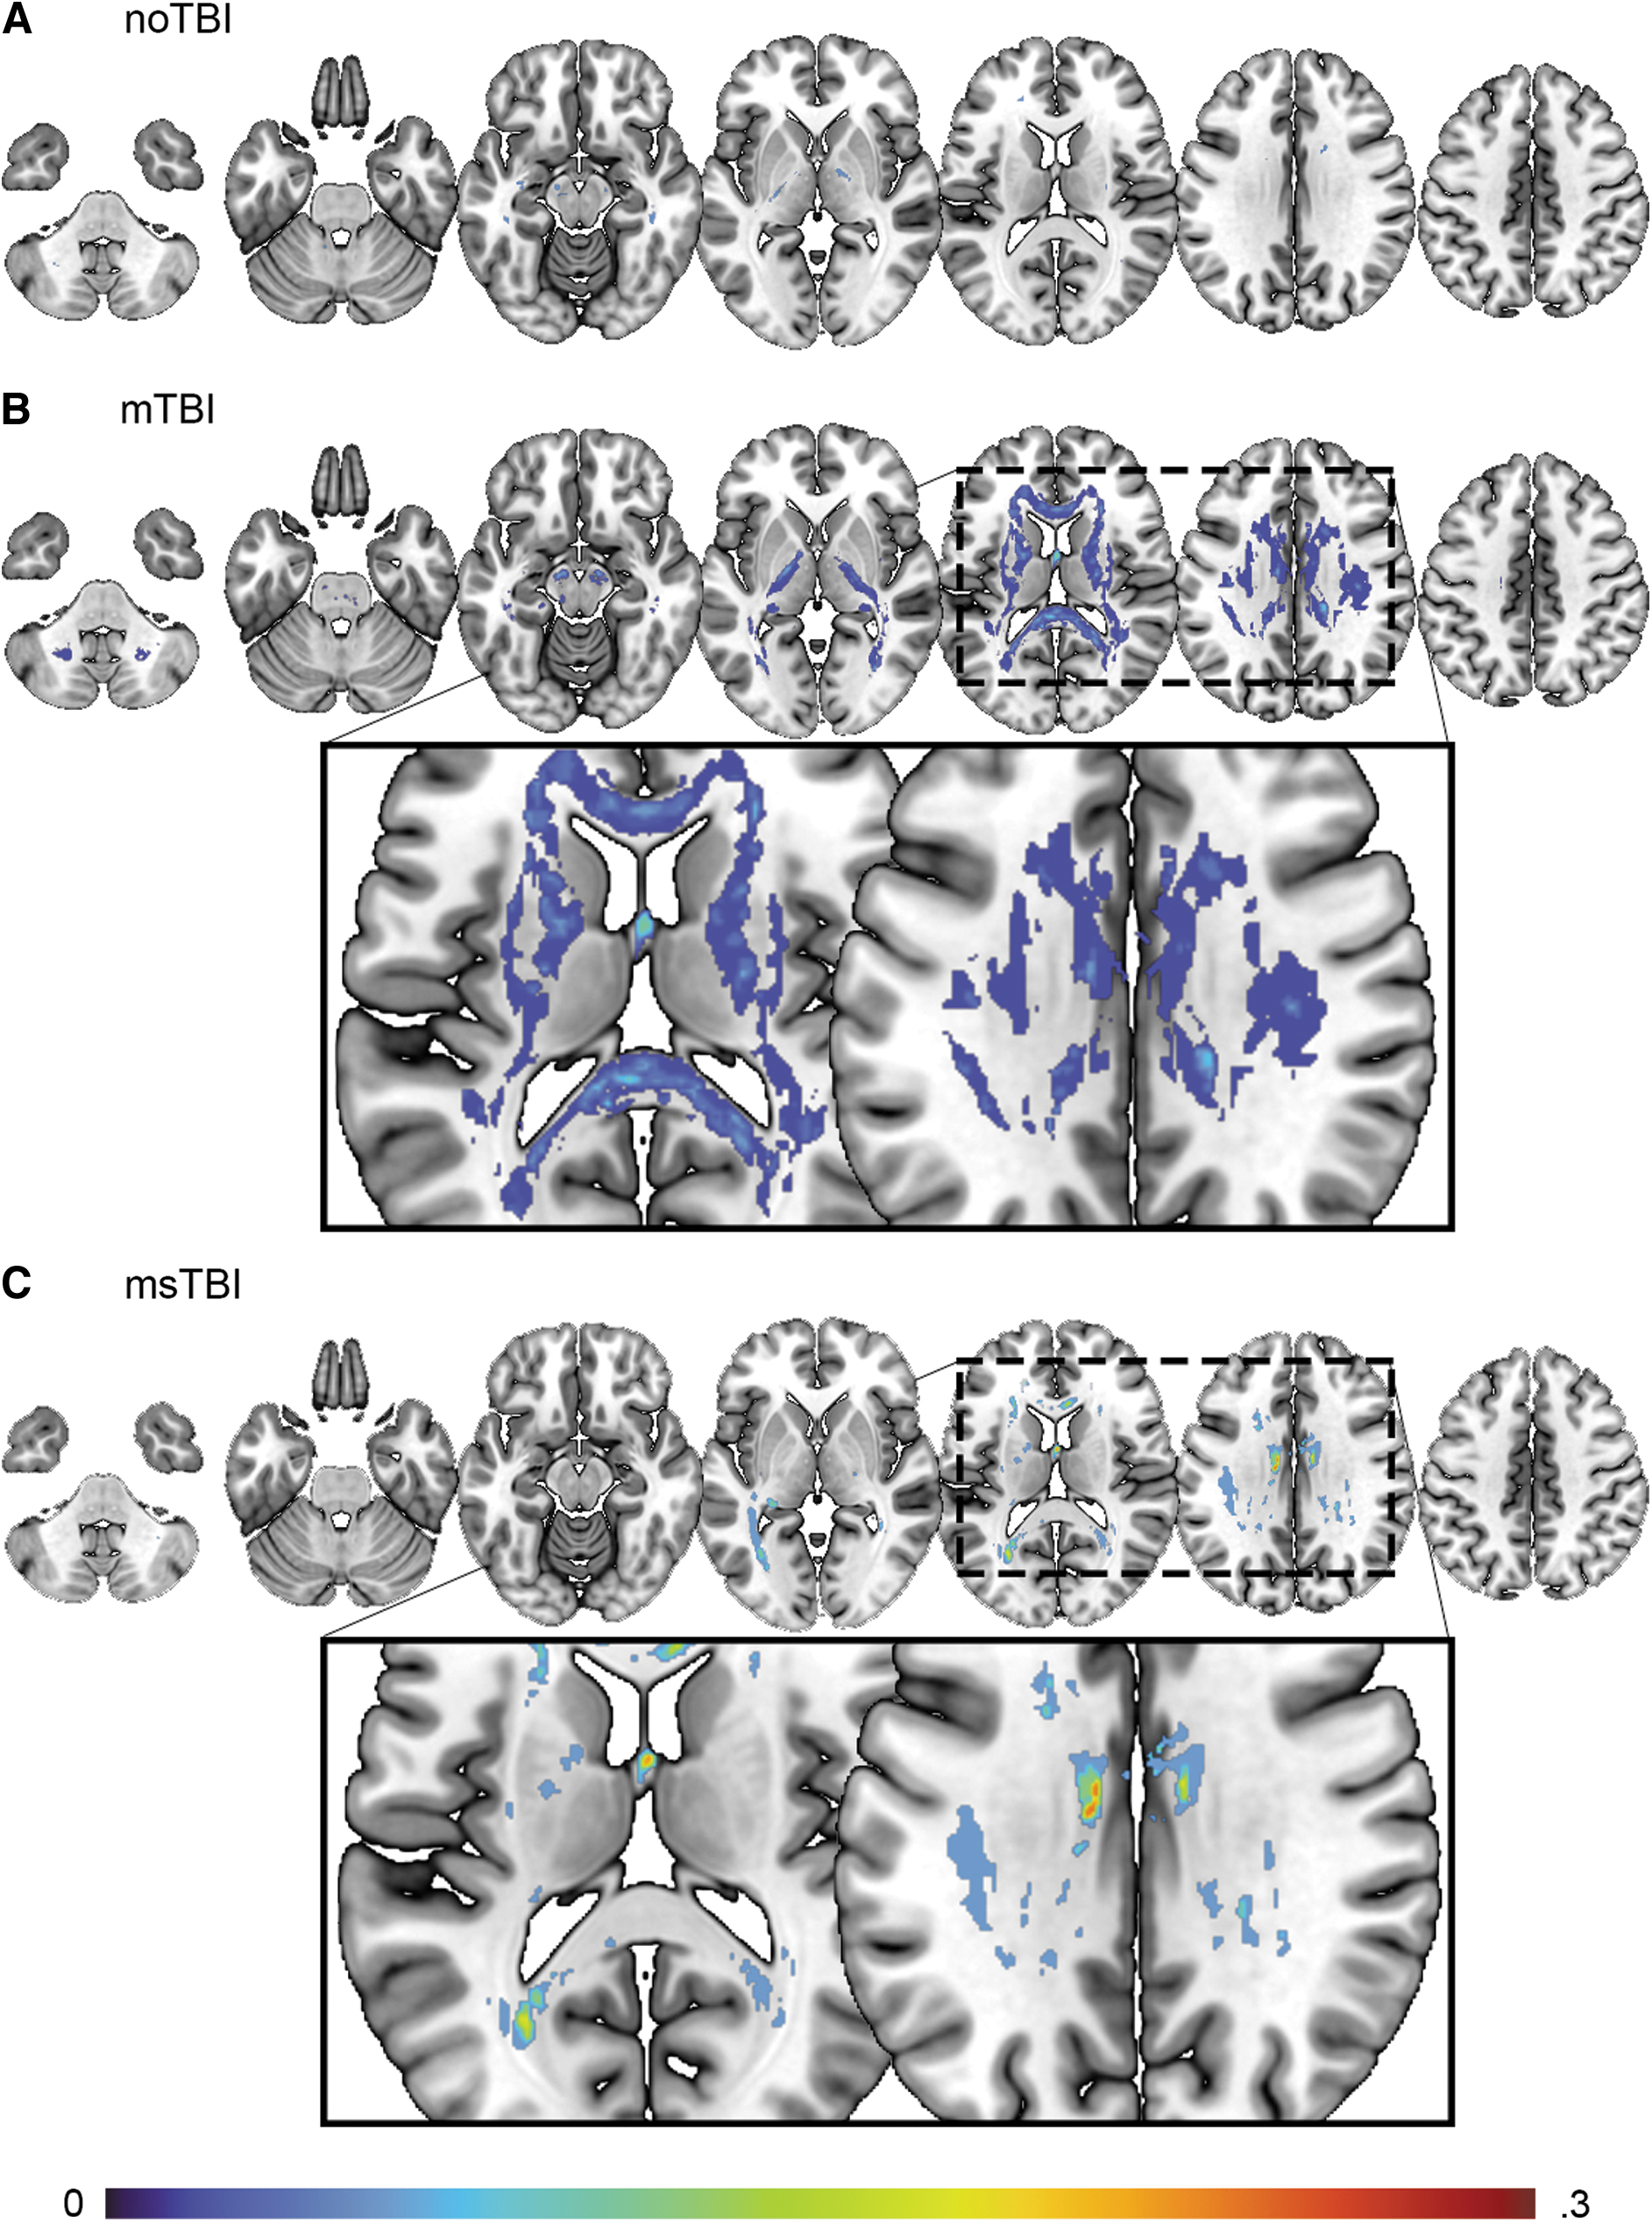
Distribution of potholes for
Global number of potholes across the brain differed significantly by group [F(2,87) = 4.642, p = 0.012, η 2 = 0.097]. Post hoc, this result was driven by significant differences between the noTBI group (2.45 ± 3.87) and both the mTBI group (10.60 ± 12.93, p = 0.019) and the msTBI group (12.00 ± 10.54, p = 0.032; Fig. 4B). Average volume of pothole clusters did not differ between groups (p = 0.513).
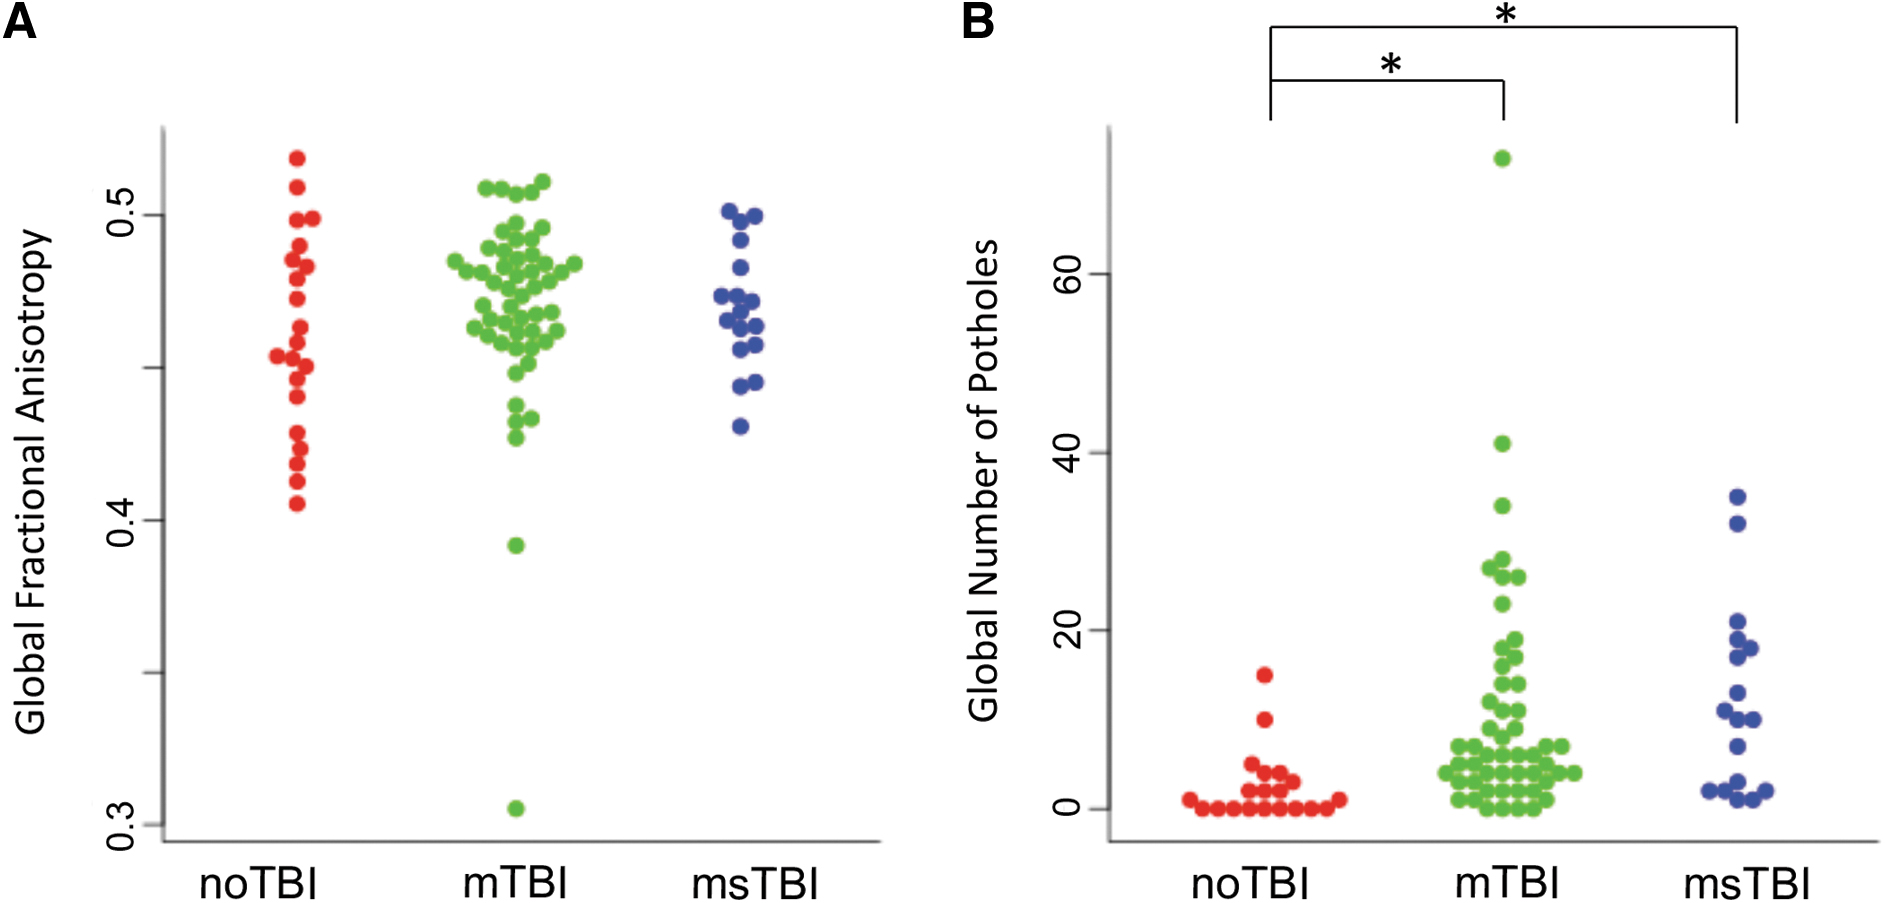
Whole–brain white matter organization.
Cortical segmentation—white matter volume
The msTBI group demonstrated significantly less cerebral white matter volume compared with the other two groups [F(2,87) = 8.602, p < 0.001, η 2 = 0.165]. Many individual segmentations of white matter showed decreased volume in the msTBI group compared with the other two groups, including the left superior temporal sulcus, fusiform, inferior temporal, lateral orbitofrontal, right caudal anterior cingulate, lateral occipital, and bilateral medial orbitofrontal white matter. Compared with the noTBI group, msTBI had smaller volume in left inferior parietal, frontal pole, and right posterior cingulate white matter (Fig. 5A). Compared with the mTBI group, the msTBI group showed decreased volume in left lateral occipital, lingual, middle temporal, paracentral, pars orbitalis, and right fusiform, inferior temporal, postcentral, temporal pole, and bilateral parahippocampal, precentral, superior frontal, superior temporal, and insular white matter (Fig. 5B).
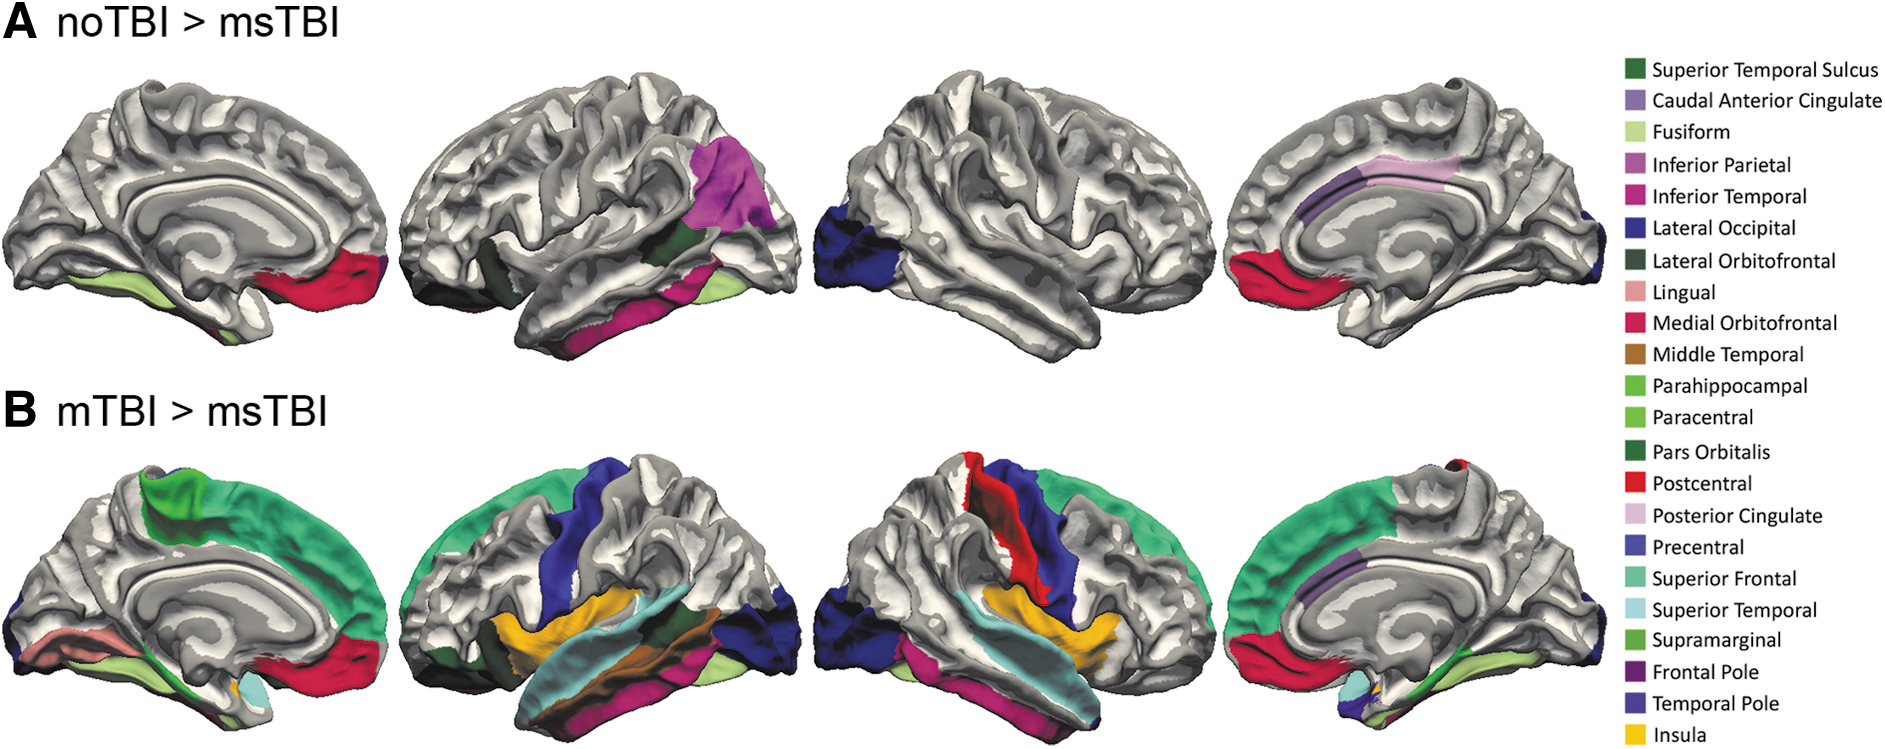
White matter segmentation differences. White matter segmentations with smaller volume in the moderate or severe traumatic brain injury (msTBI) group compared with the
Cortical segmentation—gray matter thickness
Gray matter thickness differed significantly among the three groups (η 2 = 0.069-0.138) in 19 regions, including the left posterior superior temporal sulcus, caudal middle frontal gyrus, middle temporal gyrus, pars orbitalis, pars triangularis, posterior cingulate, rostral anterior cingulate, rostral middle frontal gyrus, right pars opercularis, superior and inferior parietal gyrus, and bilateral lateral occipital gyrus, medial orbitofrontal gyrus, precuneus, and superior frontal gyrus (Fig. 6A). Of these regions, 12 showed post hoc differences between at least two groups driving the overall group significance. The noTBI group had thicker gray matter than the mTBI group in left lateral occipital gyrus, pars triangularis, rostral anterior cingulate, superior frontal gyrus, and right inferior parietal gyrus (Fig. 6B). The noTBI group had thicker gray matter than the msTBI group in left rostral middle frontal gyrus (Fig. 6C). The msTBI group had thicker gray matter than the mTBI group in left caudal middle frontal gyrus, pars orbitalis, posterior cingulate, rostral middle frontal gyrus, inferior parietal gyrus, bilateral superior frontal gyrus, right medial orbitofrontal gyrus, and pars opercularis (Fig. 6D).
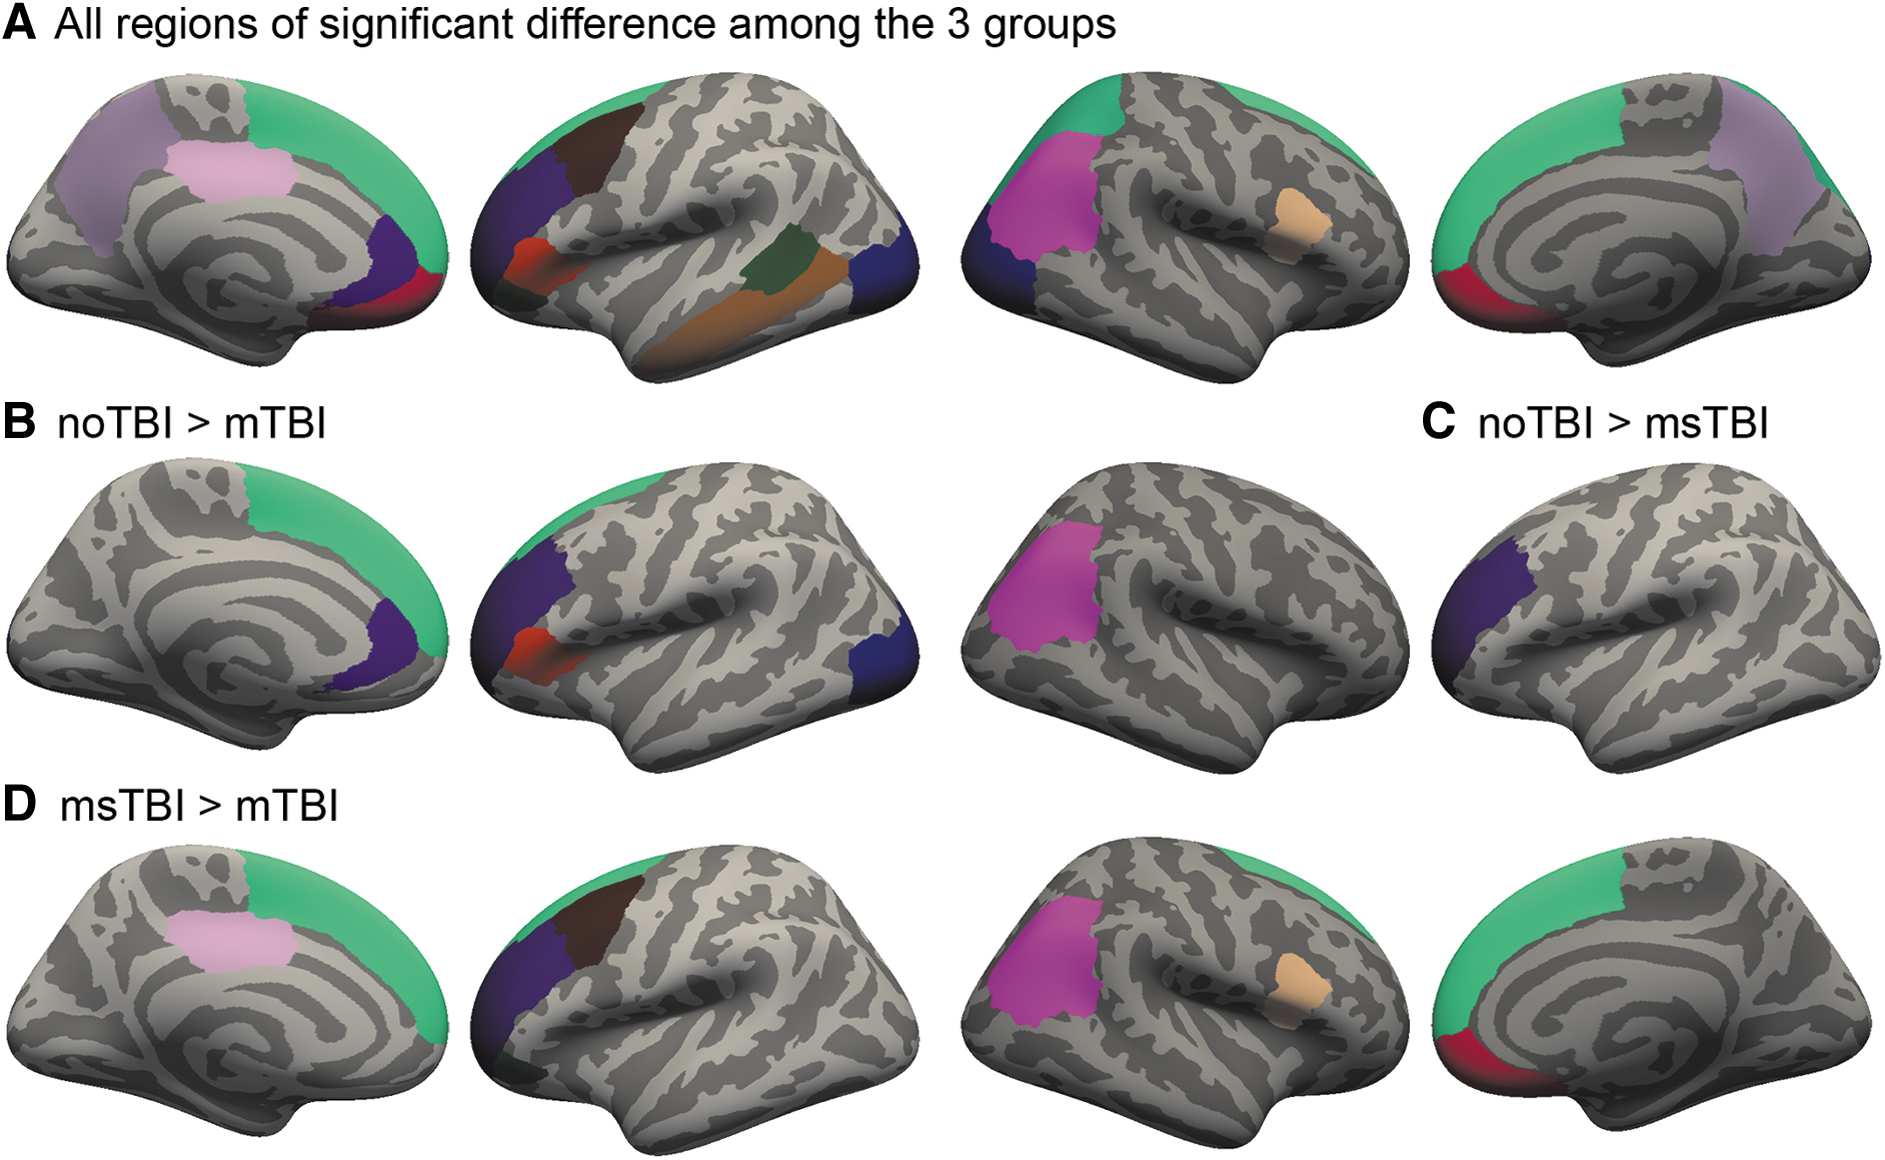
Cortical thickness differences among noTBI, mild traumatic brain injury (mTBI), and moderate or severe TBI (msTBI) groups. FreeSurfer segmentation regions where gray matter thickness differed among noTBI, mTBI, and msTBI groups.
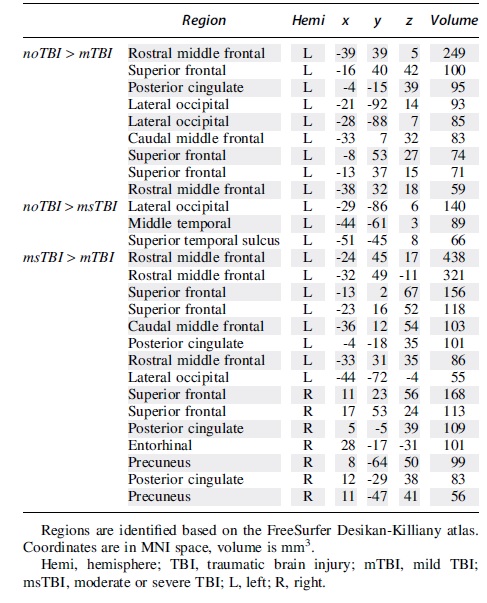
In a whole–brain voxel-wise comparison of gray matter thickness, there were significant clusters of thickness differences between the noTBI and TBI groups (always noTBI > TBI), and also between the two TBI groups (always msTBI > mTBI). These clusters are depicted in Figure 7 and detailed in Table 2.
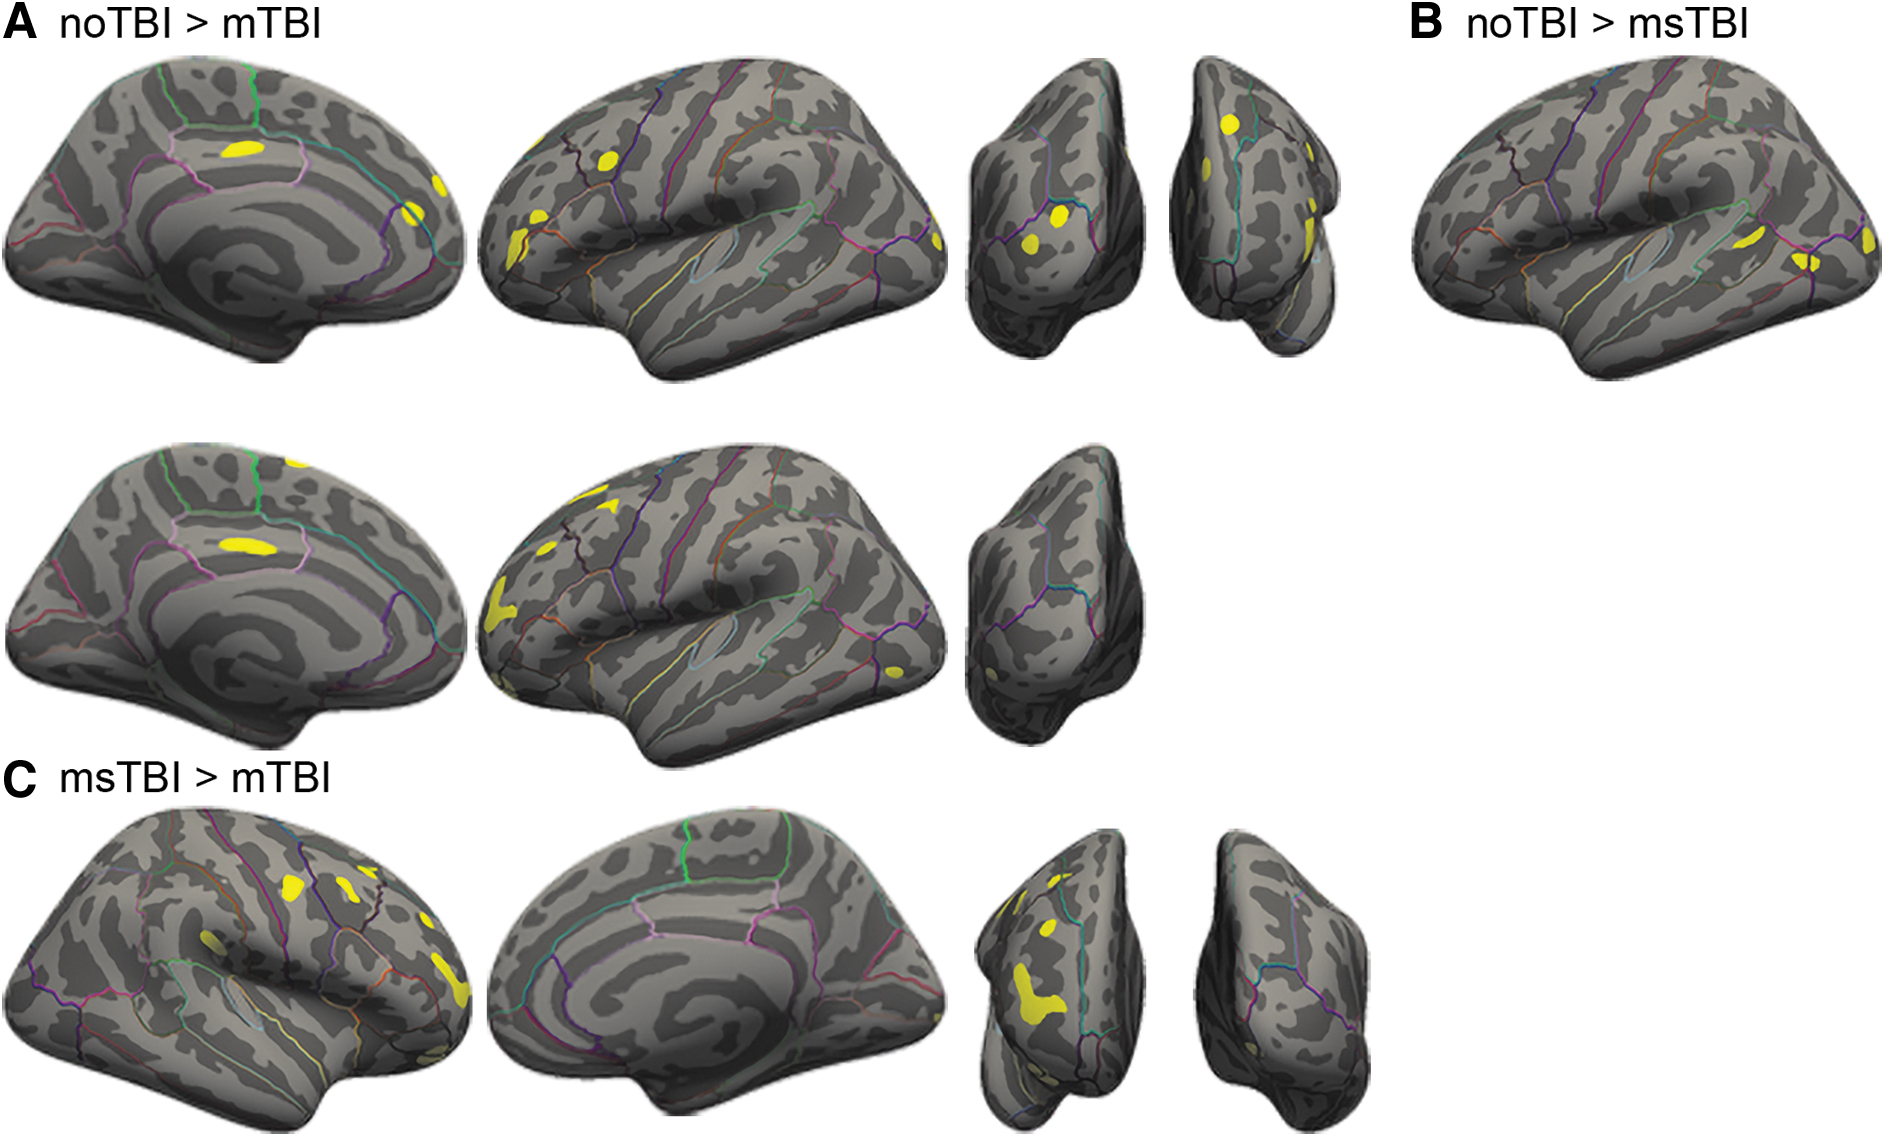
Voxel-wise clusters of gray matter thickness differences.
Clusters of Differential Cortical Gray Matter Thickness Between Groups
Sub-cortical segmentation—gray matter volume
Subcortically, volume differed between groups in left thalamus [F(2,87) = 4.249, p = 0.017, η 2 = 0.089] and bilateral accumbens [L: F(2,87) = 6.582, p = 0.002, η 2 = 0.131; R: F(2,87) = 6.126, p = 0.003, η 2 = 0.123]. In the left thalamus, this finding was driven by greater volume in the msTBI group versus the noTBI group. In the left accumbens, the difference was driven by the msTBI group having smaller volume than both the noTBI and mTBI groups, and right accumbens was driven by smaller volume in the msTBI group compared with the mTBI group.
White and gray matter correlations
Across the full sample, white matter volume was positively correlated with total gray matter volume (r = 0.363, p < 0.001) and global FA (r = 0.301, p = 0.004) and negatively correlated with both number of potholes (r = -0.227, p = 0.009) and global pothole volume (r = -0.243, p = 0.022). Global FA was negatively correlated with both number of potholes (r = -0.484, p < 0.001) and global pothole volume (r = -0.440, p < 0.001).
In the noTBI and mTBI groups, the correlation between cerebral white matter volume and total gray matter volume was maintained (noTBI: r = 0.444, p = 0.044; mTBI: r = 0.420, p = 0.002). In each of the three groups, the correlations between global FA and pothole volume (noTBI: r = -0.862, p < 0.001; mTBI: r = -0.439, p = 0.002; msTBI: r = -0.694, p < 0.001) and number of potholes (noTBI: r = -0.870, p < 0.001; mTBI: r = -0.522, p = 0.002; msTBI: r = -0.713, p < 0.001) were maintained. Additionally, in the msTBI group, cerebral white matter volume was negatively correlated with pothole volume (r = -0.531, p = 0.028) and cluster count (r = -0.488, p = 0.047) and positively correlated with global average FA (r = 0.507, p = 0.038). In this group, total gray matter volume was also correlated with pothole cluster count (r = -0.568, p = 0.017) and global average FA (r = 0.525, p = 0.031).
Symptomatology correlation with white and gray matter thickness
The NSI was used as a measure of symptom severity. In the full sample, total NSI score was positively correlated with number of brain-wide potholes (r = 0.266, p = 0.012) and negatively correlated with global mean gray matter thickness (r = -0.234, p = 0.026), likely driven by the significant correlation in the mTBI group (r = -0.298, p = 0.034). NSI total score was not, however, correlated with average global FA (p = 0.517). Total score for the PCL-5 was negatively correlated with global mean gray matter thickness, (r = -0.254, p = 0.019), likely driven by the significant correlation in the mTBI group (r = -0.369, p = 0.011). PCL-5 total score was also positively correlated with number of brain-wide potholes (r = 0.319, p = 0.003). The total score for the HIT-6 was negatively correlated with global mean gray matter thickness (r = -0.312, p = 0.004), driven in part by the significant correlation in the mTBI group (r = -0.302, p = 0.039). HIT-6 total score was also correlated with global average FA (r = 0.228, p = 0.036).
Discussion
This study compared whole-brain DTI and volumetric MRI among 90 Active Duty Service Members with chronic mild TBI (mTBI), chronic moderate-to-severe TBI (msTBI), and TBI-negative controls (noTBI). Results demonstrated that history of TBI was associated with differences in white matter microstructure, white matter volume, and cortical thickness. These white and gray matter abnormalities were also associated with greater severity of self-reported symptoms. However, the frequency, pattern, and neuroanatomical distribution of these MRI findings varied substantially by severity of injury.
DTI has shown promise as an advanced MRI technique to detect potentially-subtle white matter changes related to TBI; however, results of previous studies have been somewhat inconsistent (especially for chronic mTBI). Lacking consensus regarding its utility for diagnosis, patient characterization, and treatment planning, DTI has not yet achieved widespread use in clinical settings. Examination of white matter FA in this study provides an illustration of the varying sensitivity of this imaging modality across different levels of analysis, from aggregated/global white matter FA, to pre-defined white matter ROIs, post hoc voxelwise clusters, and quantification of subject-specific FA potholes.
In the most aggregated form (average global FA), DTI results did not differ between mTBI, msTBI, and noTBI groups, and no trends were apparent on plots. Global FA was also unrelated to self-reported neurobehavioral symptoms. However, examination of DTI FA within individual, pre-defined white matter ROIs provided evidence of decreased FA within the fornix of the msTBI group relative to controls, and increased FA within the middle cerebellar peduncle for mTBI and msTBI groups relative to controls. Additionally, voxelwise comparison of DTI white matter FA by group demonstrated widely distributed clusters of reduced FA in the msTBI group relative to controls, but no significant voxelwise findings in the mTBI group. While decreased FA is often interpreted as reflecting axonal injury, 28 increases in FA may represent axonal swelling or effects of compensatory neuroplasticity. 92 Collectively, these spatially-defined DTI analyses readily identified altered white matter organization within the msTBI group, but did not provide clear evidence of abnormalities within the mTBI group.
There is reason to believe that white matter organization following TBI may differ between civilian and military populations. This could be due to the mechanism of injury, repeated injury, and the choice of comparison groups. A recent meta-analysis separating studies into civilian, military, and sports-related mTBIs in the acute, subacute, and chronic stages post-injury demonstrated that nine out of 12 studies of civilians with chronic mTBI found reduced FA in white matter tracts throughout the brain. 93 In a military population, however, reduced FA was only found in six out of 15 studies. Regions of lower FA in this military group included the corpus callosum, superior and inferior longitudinal fasciculus, corona radiata, cingulate, inferior fronto-occipital fasciculus, internal capsule, anterior thalamic radiations, forceps minor and major, corticospinal tract, tapetum, middle cerebellar peduncle, uncinate fasciculus, and cingulum. 94 –99 The current study falls into the camp of the 11 studies that did not find voxelwise differences in FA between mTBI and non-injured groups. In our population, this could be due to our mTBI group having more remote injury than our msTBI group, since our msTBI group did not show significant FA decreases in any specific brain areas relative to our noTBI group. Additionally, because individuals with severe or chronic impairment are likely to separate from active duty, it is possible that the mTBI and msTBI groups in the current sample may be less severely impacted than individuals drawn from other populations.
However, in contrast to the results of our more conventional, spatially-defined DTI analyses, identification of spatially heterogeneous areas of decreased FA (i.e., pothole analysis) provided unique evidence regarding white matter organization in the mTBI group. In the current study, DTI FA potholes were widely distributed through the white matter in both the mTBI and msTBI groups, with elevated prevalence relative to controls. These DTI FA potholes were also related to greater severity of self-reported neurobehavioral symptoms and post-traumatic stress. Importantly, the elevated rates of DTI FA potholes were driven by a subset of the mTBI group, as many mTBI participants had few or no FA potholes. This study joins previous work in military populations showing the utility of pothole measures as potentially-sensitive biomarkers of axonal injury at chronic stages of TBI recovery. 90,100 However, it remains unclear whether presence, frequency or distribution of FA potholes may simply provide greater sensitivity to TBI relative to traditional DTI analyses, or whether it may represent a distinct biomarker with unique clinical significance relative to mean FA within a given white matter region.
In addition to examining white matter microstructure, analyses also examined white matter volume, with results demonstrating decreased white matter volume in many brain regions for the msTBI group, compared with the other two groups. Previous work, including studies of in vivo neuroimaging and postmortem brain specimens, has shown that white matter degradation persists for many decades post-injury. Postmortem studies of severe TBI patients compared with matched controls found reactive microglia present up to 18 years post-injury. This inflammatory pathology was accompanied by ongoing white matter degradation, including a 25% reduction in corpus callosum thickness. 101 These results have been replicated in both humans 102,103 and animal models. 104 -106
Examining cortical thickness across the brain, this study found differences among the three groups, along with greater severity of self-reported neurobehavioral symptoms, post-traumatic stress, and headaches among those with greater cortical thinning. Gray matter differences were most prominent within the mTBI group, in frontal and posterior regions, and in msTBI in the middle frontal gyrus. The results of this study are in line with previous findings, with aggregate evidence suggesting that fronto-temporal areas may be most vulnerable to mTBI; 33 specifically, this finding of orbitofrontal thinning fits into previous work noting thinning in this region in the mTBI group. 107,108 Similar to one previous study conducted in a military population, 109 the current study also provided evidence that mTBI can also be associated with alterations in thickness of the cingulate cortex. Since previous studies have confirmed the stability of these volumetric changes over a 5-year post-injury timeframe, 110 cortical thickness may be a viable biomarker for assessing long-term effects of injury.
Volumetric analysis also identified areas in which cortical thickness was greater in the msTBI group relative to the mTBI group. However, it is notable that there were no areas with significantly greater cortical thickness in TBI groups relative to noTBI controls. Additionally, out of 48 total ROIs, one region (middle cerebellar peduncle) demonstrated greater FA in the msTBI group relative to noTBI controls. Considering the total number of comparisons, one or more of these counterintuitive findings may represent Type I statistical error. Alternately, these findings may reflect different trajectories of recovery/adaptation for individual moderate-severe injuries, in comparison to the repetitive injuries that were common in our mTBI group. For example, it is plausible that repetitive mTBI could interfere with some aspects of compensatory neuroplasticity that may be preserved in single-incident msTBI.
This study is among the relatively small number of DTI or volumetric MRI studies of TBI that includes data from the full spectrum of injury severity (mild, moderate, and severe TBI). This design provides a number of important advantages for interpretation of data. First, the inclusion of results from chronic msTBI (a group which might be expected to exhibit clear findings on TBI-relevant metrics) provides a point of comparison for mTBI findings, which might otherwise be difficult to interpret in terms of distinguishing statistical versus clinical significance. Additionally, results from this study showed that on some metrics within this population (such as number of DTI FA potholes), chronic-stage mTBI and msTBI may demonstrate similarities to one another, in contrast to uninjured controls. As discussed above, comparisons between these two populations might also provide clues about mechanisms of injury and recovery that can differ based on injury severity.
There are several limitations inherent to studies of TBI, given the heterogenous nature of the injury and the different populations in which TBIs are most common. This study addresses some of these limitations by separating injury into groups of mild and moderate/severe, and limiting participation to those in the chronic stage of injury (> 3 months). Our sample included many more men than women in all groups, though our ratio of men to women mirrors the breakdown found in this military population. Additionally, statistical controls for intracranial volume and age were used where appropriate to manage this potential confound. Results may also have been influenced by the Active Duty military setting from which participants were obtained. For example, the number of total TBIs in our mTBI group was higher than would be expected in a civilian (non-athlete) population, and since permanent/major disability typically results in a medical discharge from active military service, our msTBI group may represent a higher-functioning group than msTBI samples obtained from other settings.
Additionally, mirroring severity prevalence within the TBI population, our msTBI group was smaller than our mTBI group, and had twice as many moderate as severe TBI participants. The moderate and severe groups were combined in this analysis after determining that differences in brain metrics were non-significant between the two groups. Medication, alcohol, and nicotine use were not controlled for in this study, though certain classes of medication were exclusionary for participation. Blast exposure was not controlled for in this study. Since all participants are from an Active Duty military population, it stands to reason that many participants will have had blast exposure in addition to their TBIs. Blast exposure should be examined more systematically in future studies in this population. The addition of an orthopedic injury control group in future studies may also aid in our understanding of TBI effects on white matter microstructure and gray matter integrity. Finally, the problem of crossing fibers is fundamental in DTI due to FA being artificially suppressed within multi-directional fiber tracts. In future work we hope to acquire scans with increased resolution and directions to resolve crossing fibers and achieve increased sensitivity to potential abnormalities in these white matter tracts.
Conclusions
This study of whole–brain DTI and volumetric MRI in Active Duty Service Members with chronic TBI demonstrated that a history of TBI was associated with differences in white matter microstructure, white matter volume, and cortical thickness in both mild and moderate-to-severe TBI groups relative to uninjured controls. These white and gray matter abnormalities were also associated with greater severity of self-reported symptoms. Further exploration showed that the presence, pattern and neuroanatomical distribution of MRI findings varied substantially by severity of injury. This study expands upon a growing body of literature using advanced imaging techniques to identify potential effects of brain injury in military service members.
Transparency, Rigor, and Reproducibility Summary
This study was not formally registered because it is not a clinical trial. The analysis plan was not formally pre-registered, but the team member with primary responsibility for the analysis (lead author) certifies that the analysis plan was pre-specified. Sample size was 21 healthy controls, 52 mTBI, and 17 msTBI subjects, and the observed effect sizes were moderate. Ninety-eight participants were enrolled in MRI portion of the study and had images collected. Ninety participants had images that passed systematic quality assessments and were analyzed. Imaging quality control decisions and analyses were performed by investigators who were aware of relevant characteristics of the participants. Imaging data were acquired between February 2018 and May 2022 between 12-2 p.m. Imaging data were collecting using a Philips Ingenia 3T MRI running software R5.3.1 with a 16-channel matrix head coil. All imaging was collected using the same scanner. The time required for image acquisition was 48 min. Complete imaging parameters are presented in the methods. All equipment and software used to perform acquisition and analysis are widely available from Philips and FSL. The key inclusion criteria (TBI diagnostic criteria) are established standards in the field. Correction for multiple comparisons was performed within FSL as described in the methods. No replication or external validation studies have been performed or are planned/ongoing at this time to our knowledge. De-identified data from this study are not available in a public archive. De-identified data from this study will be made available (as allowable according to institutional IRB standards) by emailing the corresponding author. Analytic code used to conduct the analyses presented in this study are not available in a public repository. They may be available by emailing the corresponding author. The authors agree to provide the full content of the manuscript on request by contacting the corresponding author.
Footnotes
Acknowledgments
The authors wish to thank L. Falaminiano, HM1 D. Cometa, H. J. Mapa, CAPT D. Hawley, E. Cordero, J. Engall, A. Aguirre, J. Trotta, A. Nunes, M. Schy, J. Wyckoff, and M. Parikh for their contributions to this study.
The views expressed in this manuscript are those of the authors and do not necessarily represent the official policy or position of the Defense Health Agency, Department of Defense, or any other U.S. government agency. This work was prepared under Contract HT0014-22-C-0016 with DHA Contracting Office (CO-NCR) HT0014 and, therefore, is defined as U.S. Government work under Title 17 U.S.C.§101. Per Title 17 U.S.C.§105, copyright protection is not available for any work of the U.S. Government. For more information, please contact dha.
Unclassified.
Authors' Contributions
SIG: Formal analysis, investigation, data Curation, writing—original draft, visualization, project administration. LH: Conceptualization, methodology, writing—review and editing, supervision, project administration. EWT: Conceptualization, methodology, writing—review and editing, supervision, project administration, funding acquisition. MLE: Conceptualization, methodology, resources, writing—review and editing, supervision, project administration, funding acquisition.
Funding Information
This work was prepared under Contract HT0014-22-C-0016 with DHA Contracting Office (CO-NCR) HT0014. Additional support for this research was provided by Congressionally Directed Medical Research Program (CDMRP) Awards W81XWH-13-1-0095 and W81XWH-19-10656, a VA Rehabilitation Research and Development Research Career Scientist Award to ET, and institutional support from the Traumatic Brain Injury Center of Excellence (TBICoE).
Author Disclosure Statement
No competing financial interests exist.