
Abstract
Traumatic brain injury (TBI) is followed by secondary injury mechanisms strongly involving neuroinflammation. To monitor the complex inflammatory cascade in human TBI, we used cerebral microdialysis (MD) and multiplex proximity extension assay (PEA) technology and simultaneously measured levels of 92 protein biomarkers of inflammation in MD samples every three hours for five days in 10 patients with severe TBI under neurointensive care. One μL MD samples were incubated with paired oligonucleotide-conjugated antibodies binding to each protein, allowing quantification by real-time quantitative polymerase chain reaction. Sixty-nine proteins were suitable for statistical analysis. We found five different patterns with either early (<48 h; e.g., CCL20, IL6, LIF, CCL3), mid (48–96 h; e.g., CCL19, CXCL5, CXCL10, MMP1), late (>96 h; e.g., CD40, MCP2, MCP3), biphasic peaks (e.g., CXCL1, CXCL5, IL8) or stable (e.g., CCL4, DNER, VEGFA)/low trends. High protein levels were observed for e.g., CXCL1, CXCL10, MCP1, MCP2, IL8, while e.g., CCL28 and MCP4 were detected at low levels. Several proteins (CCL8, -19, -20, -23, CXCL1, -5, -6, -9, -11, CST5, DNER, Flt3L, and SIRT2) have not been studied previously in human TBI. Cross-correlation analysis revealed that LIF and CXCL5 may play a central role in the inflammatory cascade. This study provides a unique data set with individual temporal trends for potential inflammatory biomarkers in patients with TBI. We conclude that the combination of MD and PEA is a powerful tool to map the complex inflammatory cascade in the injured human brain. The technique offers new possibilities of protein profiling of complex secondary injury pathways.
Introduction
Traumatic brain injury (TBI) is a complex and heterogeneous disorder depending on multiple variable factors, such as initial mechanical forces, comorbidities, age, coagulopathy, time to neurosurgical intervention, and others. The primary injury makes the brain susceptible for additional secondary molecular, chemical, and pathophysiological adverse events that may continue for a considerable time. 1 Among such secondary injury mechanisms, neuroinflammation is thought to be of special importance. 2 Neuroinflammation after trauma involves activation of the peripheral and innate immune systems by complicated triggering and maintainance mechanisms through numerous pathways including cytokines, chemokines, growth factors, receptor activation, and others. 3 Improved possibilities for monitoring neuroinflammation within the brain after TBI are needed greatly.
The development of cerebral microdialysis (MD) catheters with larger cutoff membranes offers possibilities for protein sampling, 4 –6 especially in combination with new molecular analysis tools such as the deoxyribonucleic acid (DNA) assisted proximity ligation assay (PLA) technique. 7 The PLA was introduced as a tool for ultrasensitive measurements of proteins in liquid samples in which each protein is recognized by two different oligonucleotide-conjugated antibodies followed by an enzymatic ligation step and quantitative real-time polymerase chain reaction (qPCR) amplification.
The second generation of this technique, known as proximity extension assay (PEA), 8,9 allows extremely specific and sensitive simultaneous detection of up to 92 proteins and four internal controls in just 1 μl sample volume. The combination of protein sampling with MD followed by sensitive multiplex protein detection may be useful clinically for temporal mapping of complex secondary injury events such as neuroinflammation in patients with TBI in the neurointensive care (NIC) setting. 10
We present a feasibility study on 10 patients with severe TBI by analyzing 92 potential protein biomarkers of inflammation using PEA technology on 3 h MD fractions over the first five days after admission to the Uppsala NIC unit.
Methods
All research procedures described here were approved by the Regional Ethical Review Board at Uppsala University, and informed consent was obtained from the closest relatives of the patients.
Patient population and neurocritical care management
The Department of Neurosurgery at the University Hospital in Uppsala, Sweden, provides neurosurgical care for those in the central part of Sweden; the population is approximately two million persons. Most patients are treated initially at local hospitals according to advanced trauma life support (ATLS) principles and then referred to Uppsala (the most distant local hospital is 382 km away).
For this study we conveniently recruited 10 patients (9 male, 1 female) with severe TBI, defined as a post-resuscitation Glasgow Coma Scale (GCS) score of 8 or below on admission to our NIC unit, with a history of cranial trauma, and a computed tomography (CT) scan consistent with TBI. All patients required NIC treatment including intubation, mechanical ventilation, and monitoring of intracranial pressure (ICP) and MD. The patients were treated according to a standardized brain injury protocol aiming to keep ICP below 20 mm Hg and cerebral perfusion pressure (CPP) above 60 mm Hg. 11
In brief, patients were sedated using continuous intravenous propofol infusion (1–4 mg/kg/h Propofol-Lipuro; B. Braun Melsungen AG, Melsungen, Germany) combined with intermittent intravenous morphine (1–3 mg Morfin Media; Media, Sollentuna, Sweden). Normovolemic circulation and sufficient colloid osmotic pressure were aimed for. Infusion of 20% albumin was used commonly to manage hypovolemia/hypotension. Fever was managed with paracetamol, cooling blanket, or chlorpromazine. Lesions (contusions and extracerebral hematomas) with significant mass effect were evacuated.
In situations of increased ICP despite basic NIC treatment and when no mass lesion was present, cerebrospinal fluid (CSF) was drained. If CSF drainage was not sufficient to reduce ICP, a thiopental infusion was started. Finally, if ICP was still refractory, a decompressive craniectomy was performed. Inotropic agents (dobutamine or norepinephrine) were administered when needed. Plasma glucose was measured frequently and maintained at 5–10 mmol/L. Additional injuries were scored according to the New Injury Severity Score (NISS), ranging from 1 to 75. 12
At approximately six months post-injury, patient outcome was assessed using the extended Glasgow Outcome Scale (GOSE). 13 Patient gender, age, mechanism of injury, presence of coagulopathy, GCS motor score on admission and discharge, length of stay in the NIC unit, MD start time (h after injury), and GOSE are presented in Table 1.
Proteins in the 92-plex Proximity Extension Assay Inflammation Panel
List of the proteins included in the 92-plex proximity extension assay PEA panel used in this study with UniProtKB ID, Full name, Short name, Classification, and Note, indicating the reason for excluding the protein from the final biomarker evaluation. One protein was excluded because of antibody cross-reactivity in the assay (BDNF). Another 22 proteins, according to Figure 2, did not meet our inclusion criterion of being above the limit of detection (LOD) in ≥4 samples in ≥4 patients and were also excluded, leaving 69 proteins for biomarker evaluation.
Radiological analysis and neurosurgical interventions
The CT scans were performed frequently as needed. The placement of the MD catheter in relation to the injury was recorded. The Rotterdam CT score 14 was used for TBI classification in addition to a crude sorting of the patients according to the most dominant cerebral injury visible on CT (Table 2). In cases where several types of injuries were equally present (e.g., traumatic subarachnoid hemorrhage, contusions, subdural hematomas), the term “mixed” brain injury was used.
Patient Characteristics
The table includes characteristics of the 10 individual patients. The age span reaches from 15 years to 73 years. Mechanism of injury was either motor vehicle accident (MVA) or fall. Presence of coagulopathy was noted preoperatively, either known anticoagulative medication (warfarin) or APTT/INR abnormality. The GCS-M (Glasgow Coma Scale-Motor score) was noted at admission and discharge. The length of stay at the neurointensive care (NIC) unit and start of microdialysis (MD) monitoring were recorded as well. The GOSE (Extended Glasgow Outcome Score) was recorded at a follow-up approximately six months after time of injury.
The basal cisterns and the midline shift were measured and calculated on the last CT scan before the surgical procedure. Compression of the basal cisterns was determined by the following scoring system: 0 = normal, 1 = compressed yet visible, 2 = compressed. The midline shift was calculated at the level of the thalami (Table 2). Table 2 also lists data on neurosurgical monitoring and interventions.
Microdialysis procedure
The MD procedure has been described previously in detail. 15 Briefly, the MD catheter was inserted in conjunction with implantation of the ICP monitoring device in the nondominant frontal lobe, 1–2 cm anterior to the coronal suture. The 71 High Cut-Off (100 kDa) Brain MD catheter was used with a membrane length of 10 mm (M Dialysis AB, Stockholm, Sweden). Artificial CSF was used as perfusion fluid, containing NaCl 147 mM, KCl 2.7 mM, CaCl2 1.2 mM, and MgCl2 0.85 mM with the addition of 1.5% human serum albumin, at a perfusion rate of 0.3 μL/min delivered by a 106 Microdialysis pump (M Dialysis).
Sampling was started at least 2 h after insertion of the MD catheter to allow for normalization of changes caused by catheter implantation. The MD vials were changed on an hourly basis according to our routine MD protocol. Samples (∼18 μL) were analyzed at the bedside using an ISCUSflex Microdialysis Analyzer (M Dialysis) for routine low molecular weight biomarkers of energy metabolism (glucose, lactate, pyruvate) and cellular distress (glutamate and glycerol). The Lactate/Pyruvate Ratio (LPR) was calculated. Urea was monitored to control the MD catheter performance. 16 The remaining samples (∼10 μL) were stored at −70°C until protein biomarker analysis.
The ISCUSflex Microdialysis Analyzer was automatically calibrated when started, as well as every 6 h using standard calibration solutions from the manufacturer (M Dialysis). Quality controls at two different concentrations for each substance were performed every weekday. Total imprecision coefficient of variation was <10% for all analytes.
The following cutoff values for the MD routine biomarkers were considered critical based on published data 17 –19 : glucose <0.8 mmol/L; lactate >4 mmol/L; pyruvate <120 μmol/L; LPR >25; glutamate >15 μmol/L; glycerol >100 μmol/L. The MD biomarker concentrations were not corrected for in vivo relative recovery, which is expected to be close to 70%. 20
Protein biomarker analysis
Levels of 92 potential protein biomarkers in brain MD samples were measured simultaneously by multiplex PEA (Olink® Inflammation panel, Olink Proteomics AB, Uppsala, Sweden) as described previously. 21 In brief, 1 μL of liquid sample was incubated with a set of paired antibodies where two oligonucleotide-conjugated antibodies binds to the same protein. The affinity bindings of the antibodies bring the two attached oligonucleotides in proximity, allowing them to be extended using enzymatic DNA polymerization. The resulting double-strand DNAs were subsequently amplified and quantified by real-time qPCR by microfluidic PCR system (Fluidigm, San Francisco, CA).
The raw Ct values were normalized against negative- and spiked-in controls to achieve relative quantification values as NPX (Normalized Protein eXpression). This a unit in log2 scale, which is correlated positively with the protein concentration. An increase of 1 NPX represents a two-fold increase of protein concentration in the sample. Each protein has its own value of lower limit of detection (LOD). Any NPX values below LOD were replaced as LOD.
For all 92 assays included in the PEA inflammation panel, the mean intraassay variation assessed on linearized values was found to have a CV of 7% (range 5–14%) according to the manufacturer. For additional information on the panel performance, see Olink Inflammation–Validation Data (
Characteristics of panel proteins
Table 1 lists the proteins included in the PEA inflammation panel. Additional information including protein function, source, and main current observation is provided in Supplementary Table 1.
Statistical analysis
Among the 92 proteins measured, one protein (BDNF) was excluded because of cross-reactivity in the antibody assay. Another 22 proteins did not meet our inclusion criteria of being above the LOD in ≥4 samples in ≥4 patients and therefore were also excluded, leaving 69 proteins for further statistical evaluation (see Results).
To study temporal dependence between the proteins, the protein expressions were standardized to mean 0 and standard deviation 1 after which cross-correlations were computed. 22 Cross-correlations show the dependence not only between protein measurements taken at the same time, but also between measurements taken at different time points, allowing study of the temporal protein dynamics. The cross-correlations were computed using the Spearman rank correlation coefficient to allow for non-linear monotone relationships. 23 Protein dependencies were visualized as a network.
The statistical analyses were performed using R 3.3.2. 24 Networks for protein cross-correlations were plotted using the igraph package. 25
Results
Characteristics of the patient cohort
For demographic details, radiological findings and neurosurgical interventions, see Tables 2 and 3. Briefly, 10 patients (9 male and 1 female) with a mean age of 39 years (range 15–73 years) with severe TBI were included. The dominant cause of injury was motor vehicle accident (MVA). The median GCS-M score was 5 (range 1–5), and the dominant CT finding was a mixed type of injury with a median Rotterdam CT score of 4 (range 2–5). The mean length of stay in the NIC unit was 22 days (range 5–45).
Summary of Radiological Findings and Neurosurgical Interventions
The computed tomography (CT) finding represents a subjective decision of the most striking intracranial pathology of the initial CT scan of the skull. The Rotterdam CT score of traumatic brain injury is a classification aimed at improving prognostic evaluation of patients admitted with acute traumatic brain injuries. It includes scores for compression of basal cisterns, amount of midline shift, epidural mass lesion, and intraventricular blood or traumatic subarachnoid hemorrhage (SAH). All patients received a microdialysis (MD) catheter as well as ICP (intracranial pressure) monitoring by either a Codman intraparenchymal pressure monitor or an intraventricular device (IVD). Other neurosurgical operative procedures including contusion evacuation, decompressive craniectomy (DC), or barbiturate coma (thiopental) were also indicated. The location of the MD catheter was recorded as being inside the injured part of the brain (injured lobe), in the injured lobe in close proximity to the main part of the brain injury (contusion), or placed in what appears on the CT to be a relatively uninjured part of the brain (normal brain). The basal cisterns compression and midline shift are noted separately but are also included in the Rotterdam CT score. (0 = normal, 1 = partially compressed, 2 = compressed). Midline shift was within the 0–5 mm range for all patients.
Figure 1 shows the CT images of two typical patients, including positioning of the MD catheter in relation to the injury. Systemic blood C-reactive protein (CRP) levels and body temperature during the time of biomarker sampling are presented in Supplementary Table 2. On post-injury day 1, nine patients had P-CRP above the reference limit (<5 mg/L). On days 2–6, all patients had pathological C-CRP, and nine patients had levels >100 mg/L on two to five occasions. Hyperthermia (>38°C) was observed in five of the eight patients with available temperature data.
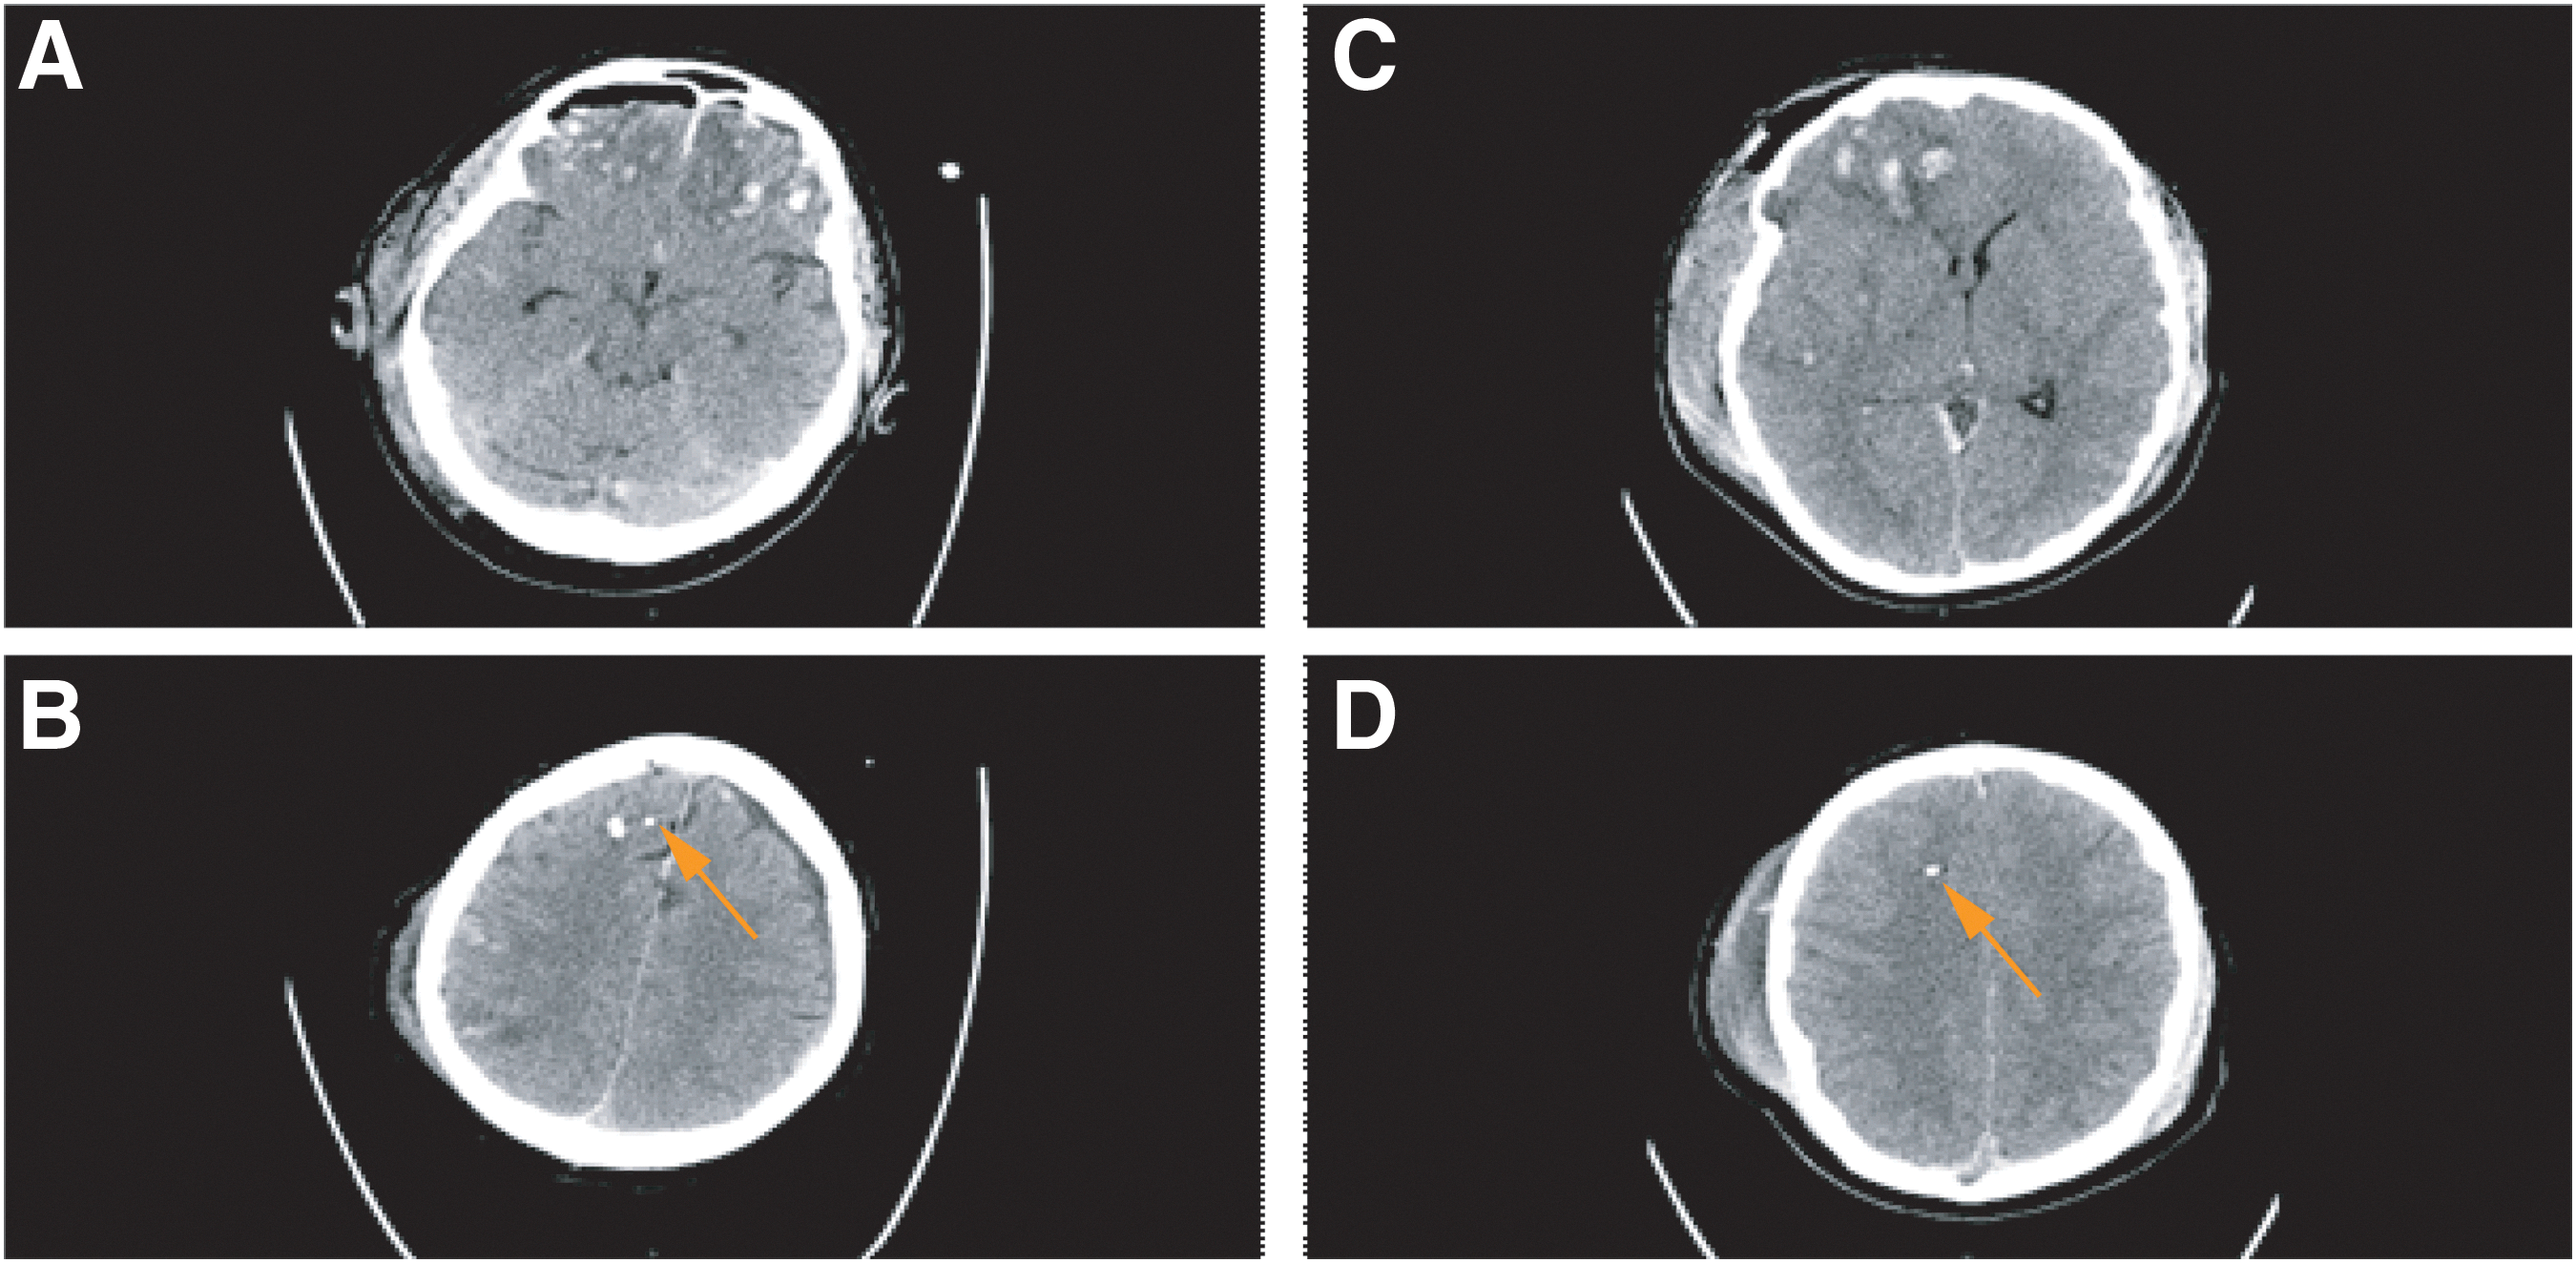
Computed tomography (CT) scans of Patient 2 (A+B) and Patient 4 (C+D) showing the location of the microdialysis (MD) membrane (orange arrows) as well as the type and extension of the brain tissue damage. The MD probe was placed in the vicinity but not within contusions. For further details, see Table 2. Color image is available online.
Local brain energy metabolism and cellular distress status
The routine low molecular weight biomarkers were analyzed bedside and were used to characterize the local burden of energy crisis and cellular distress in the brain tissue sampled with MD. Table 4 shows the estimated percentage of total monitoring time with critical biomarker levels for individual patients. Critical biomarker levels were measured during 10% or more of the monitoring time and were observed for MD-glucose in two patients (#7 and 8), MD-LPR in two patients (#4 and 9), MD-lactate in seven patients (#1, 2, 4, 6, 8–10), MD-pyruvate in seven patients (#1–4, 7, 9, 10), MD-glutamate in three patients (#2, 4, 5), and MD-glycerol in eight patients (#2–4, 6–10).
Local Brain Tissue Characteristics based on Routine Low Molecular Weight Biomarker Data
Percent monitoring time with critical biomarker levels during the five days of microdialysis monitoring for the individual patients are given (
As summarized in Table 5, energy crisis of an ischemic type (high LPR and low pyruvate) occurred in two patients (#4 and 9) without reaching glucose depletion. A more dominating feature was the burden of critically low pyruvate levels observed in five patients without high LPRs, indicative of non-ischemic energy perturbation (#1–3, 7, 10). Signs of excitotoxicity (glutamate elevation) were present in three patients (#2, 4, 5), whereas signs suggestive of membrane phospholipid degradation/oxidative stress (glycerol elevation) were a dominating feature in eight patients (#2–4, 6–10).
Local Brain Tissue Biomarker Patterns during Microdialysis Monitoring
Local brain energy metabolism and cellular distress status suggested by the patterns of critical biomarker levels for the individual patients are given. Ischemia—energy crisis of an ischemic type (high lactate pyruvate ratio [LPR] and low pyruvate); nonischemic energy crisis—critically low pyruvate levels without high LPRs; excitotoxicity—critically high glutamate; membrane degr/ox stress—critically high glycerol levels suggesting membrane phospholipid degradation/oxidative stress.
Inflammation protein profiling
We used multiplex PEA technology to simultaneously measure 92 proteins in 1 μL MD sample aliquots (Table 1). In brief, 23 interleukins, 21 chemokines, 13 growth factors, eight cytokines, and 27 other proteins were analyzed. As mentioned previously, BDNF was excluded because of cross-reactivity in the assay. Figure 2 shows the distribution of the remaining 91 proteins in respect to the detectability in individual patients. For instance, in 32 proteins—e.g., IL8 and VEGF A—protein levels were above in all samples, in all patients, while nine proteins—e.g., IL5 and TNFB—were below LOD in all samples.
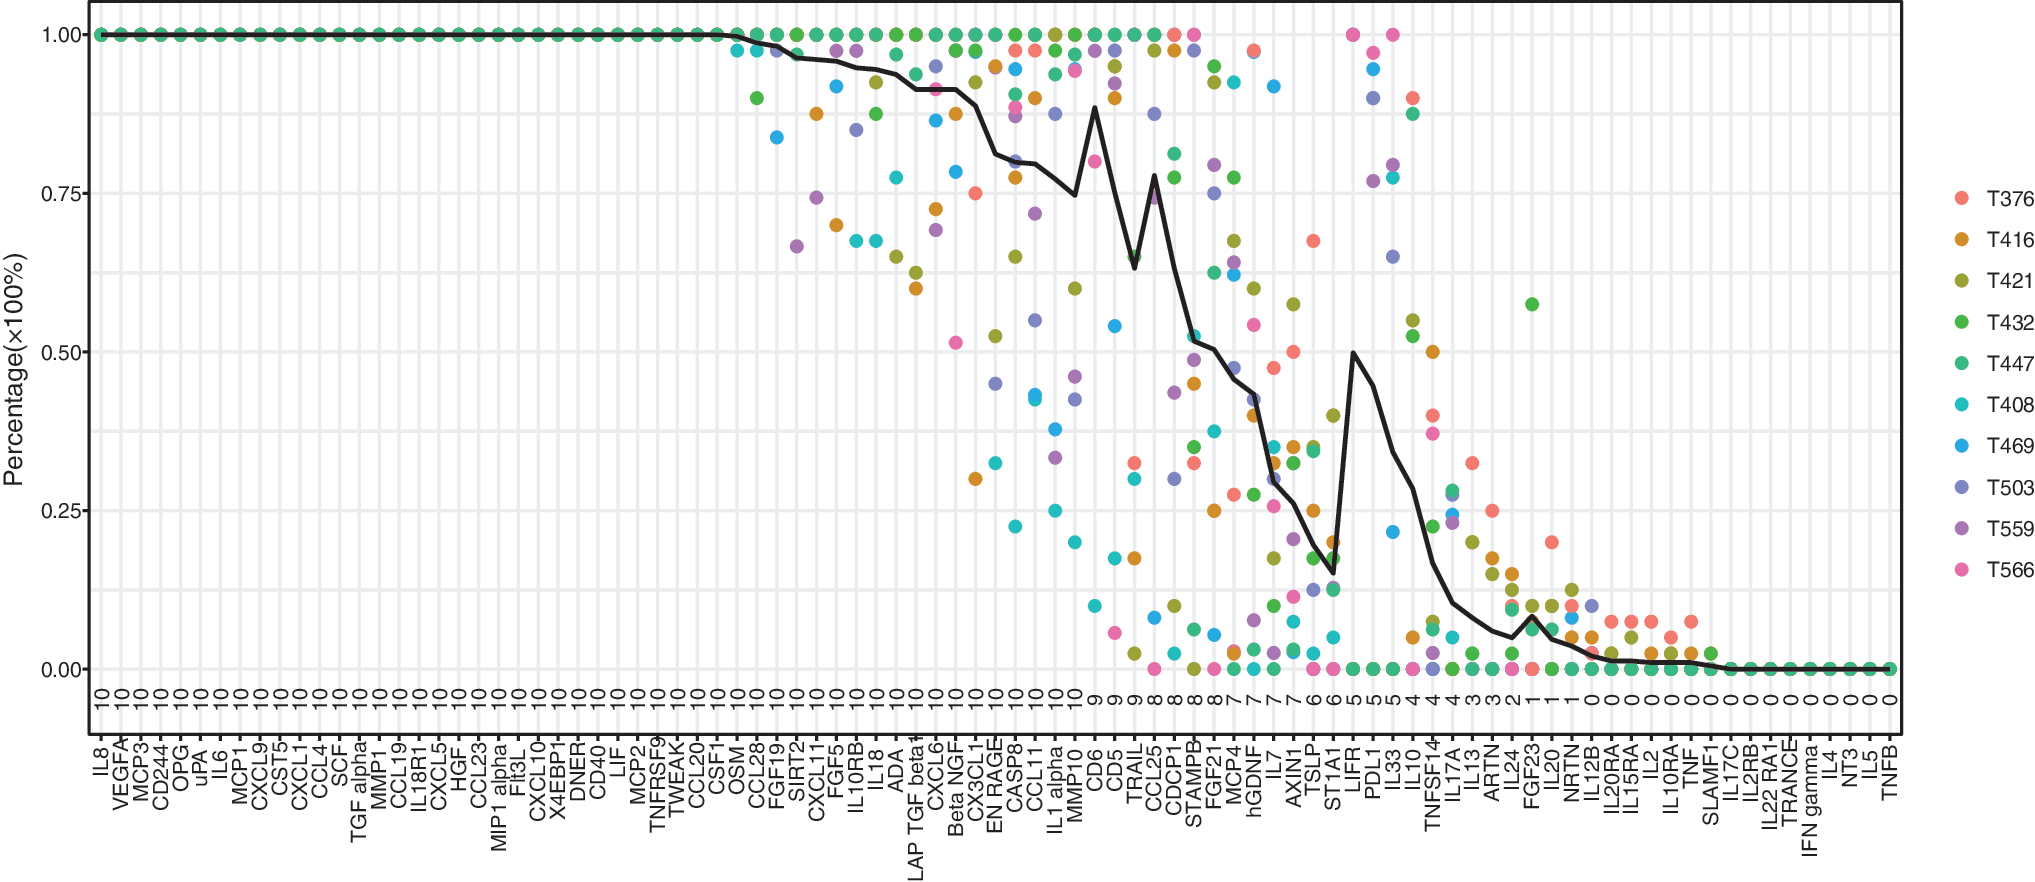
Detectability of the 92 proteins included in the inflammatory proximity extension assay panel for the 10 individual patients with traumatic brain injury. Brain-derived neurotrophic factor (BDNF) was excluded from analysis because of cross-reactivity in the assay. Because of the variation in protein detectability, we introduced an inclusion criterion that protein levels needed to be above the limit of detection in at least four samples (i.e., ≥10%) in at least four patients. This criterion excluded 22 proteins, leaving 69 proteins for further statistical modeling. Color image is available online.
Because of this variation in protein detectability, we defined an inclusion criterion to be fulfilled for further biomarker analysis—i.e., protein levels needed to be above LOD in at least four samples (≥10%) in at least four patients. This criterion excluded 22 proteins (IL13, ARTN, IL24, FGF23, IL20, NRTN, IL12B, IL20RA, IL15RA, IL2, IL10RA, TNF, SLAMF1, IL17C, IL2RB, IL22RA1, TRANCE, INFGamma, IL4, NT3, IL5, and TNFB), leaving 69 proteins for further statistical modeling.
Figure 3 demonstrates how these proteins were distributed according to their median protein level (median NPX value). For instance, MCP4 and CD 5 showed lowest protein NPX levels, whereas MCP1 and IL8 showed the highest levels (Fig. 3). Peak median values also occurred at different time points after trauma (Fig. 4). The earliest peaks were seen for STAMPB, IL10, and CXCL1 levels around one day after injury, whereas other proteins such as uPA, MCP3, and CD40 displayed late peaks, approximately five days after trauma.
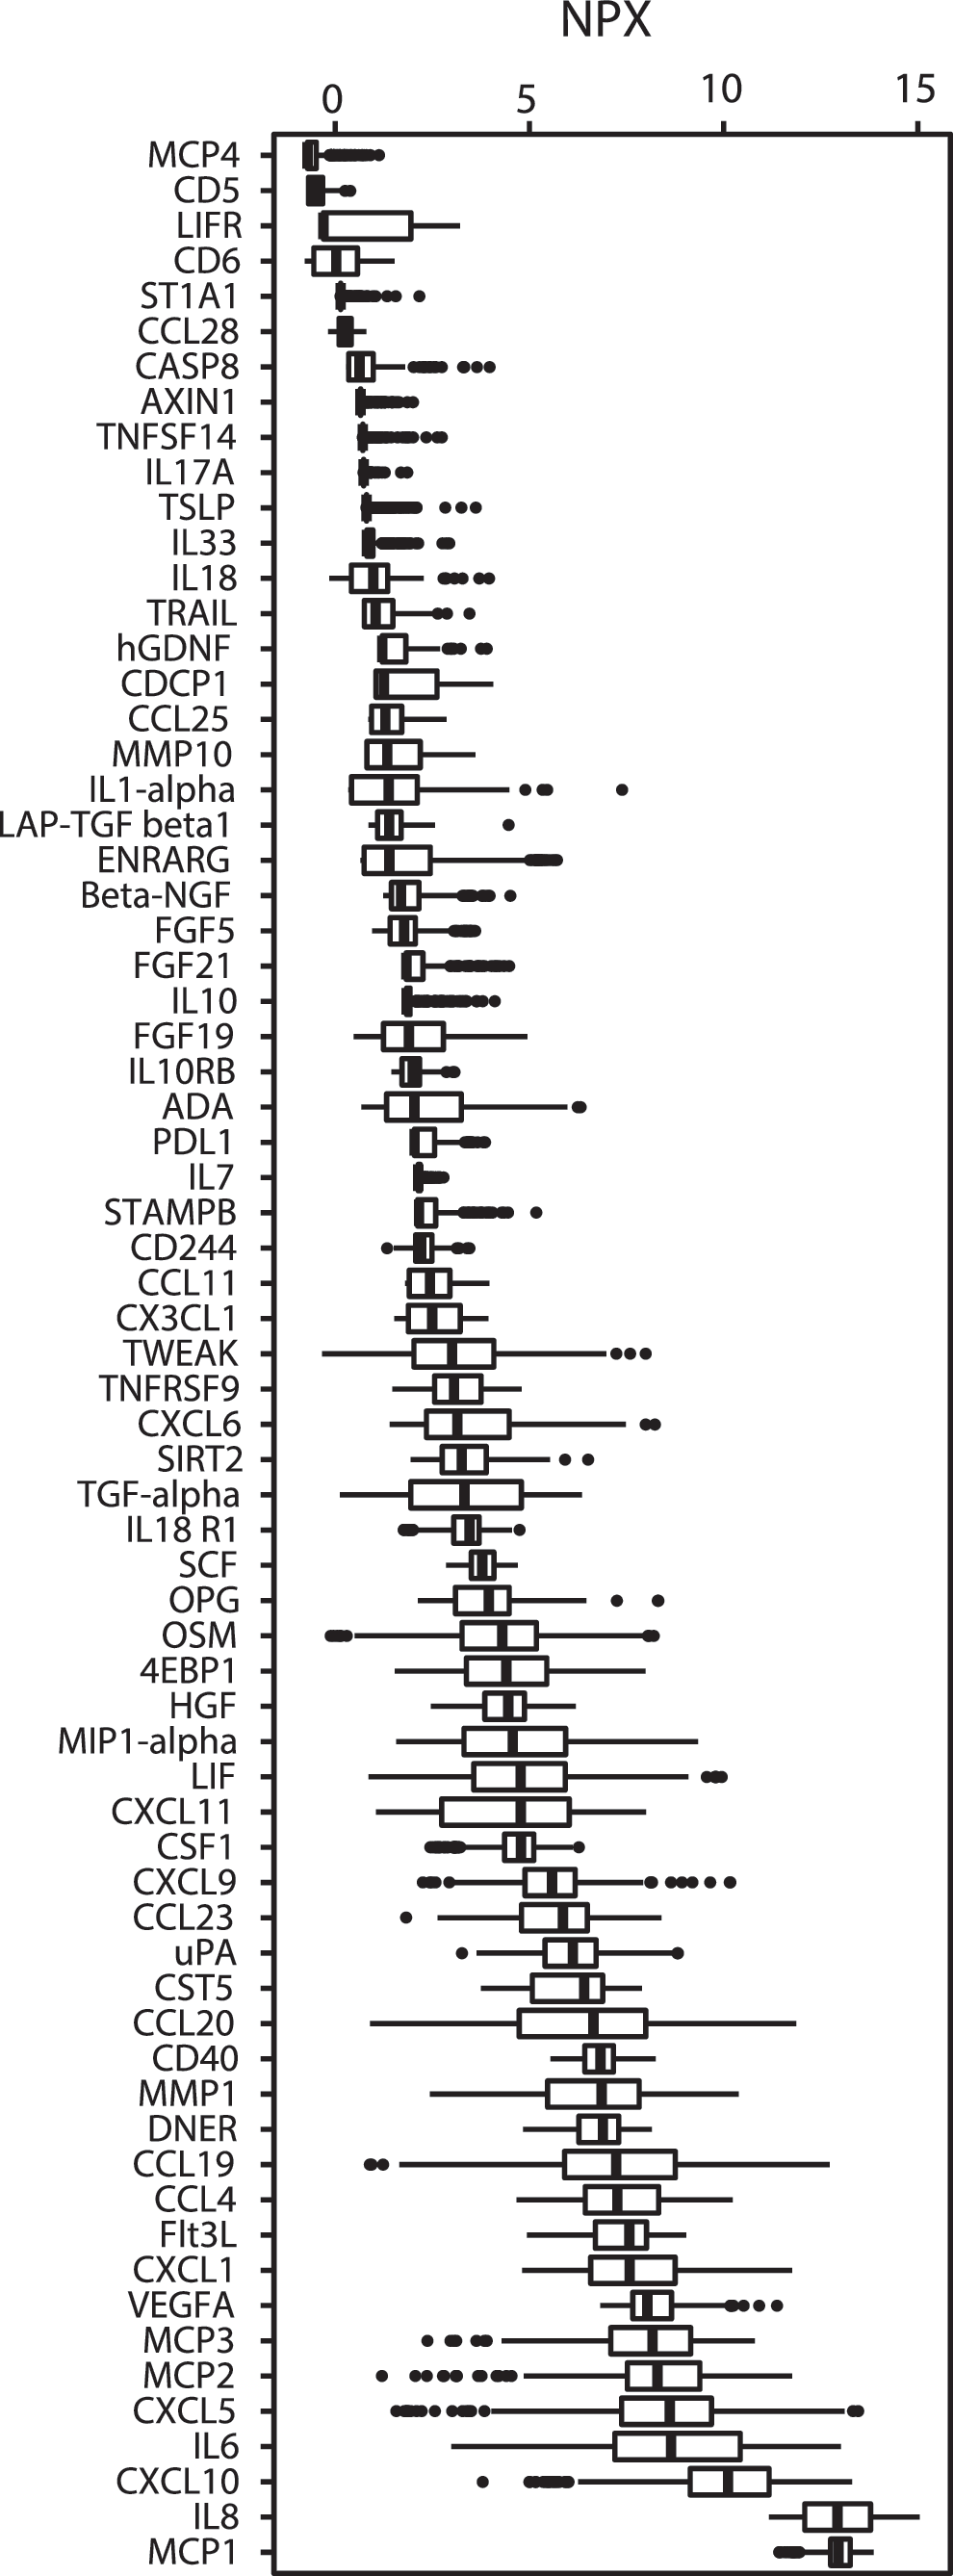
Illustration of how the 69 selected proteins were distributed according to their median protein levels—i.e., NPX (Neutralized Protein eXpression) value. The MCP4 and CD 5 displayed the lowest protein levels, whereas MCP1 and IL8 are presented with the highest levels. The thick black line of the boxplot corresponds to the median values, while each box represents from the first to third quartiles; the dots are the outliers.
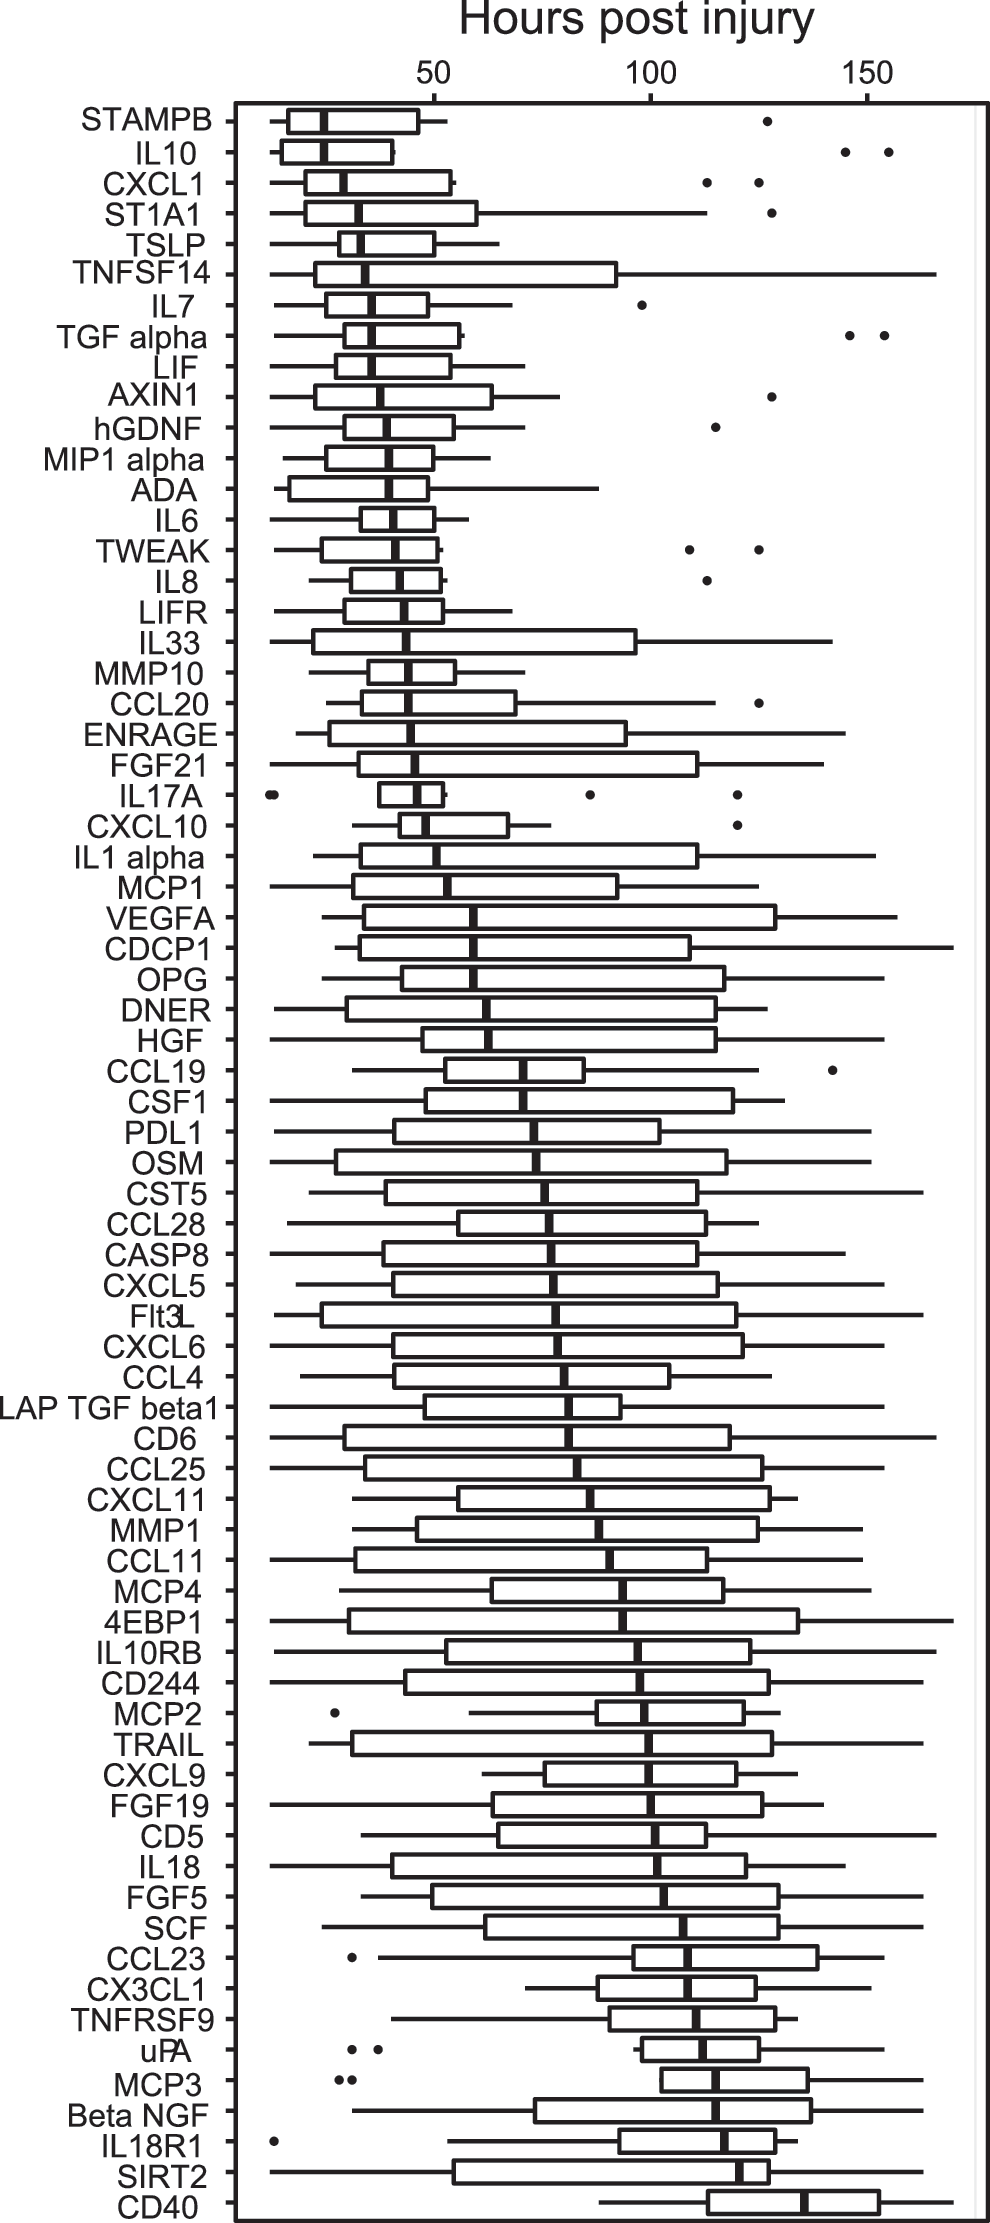
Illustration of the peak values for the 10 patients occurring at different time points after trauma for the individual 69 proteins, providing sequential information about the changes in protein levels. For instance, the earliest peaks were seen in STAMPB, IL10, and CXCL1 approximately one day after injury, whereas proteins such as uPA, MP3, and CD40 peaked late approximately five days post-trauma. The thick black line of the boxplot corresponds to the median time points for the ten patients when the peak occurs, while each box represents from the first to third quartiles; the dots are the outliers.
Figure 5 shows the temporal trends in individual patients (and median NPX values) for CXCL10, CD40, and leukemia inhibitory factor (LIF), illustrating examples of different post-injury patterns. The corresponding graphs for all protein expression levels over time in individual patients are summarized in Supplementary Figure 1. Several proteins exhibited consistent trends of expression in all patients.
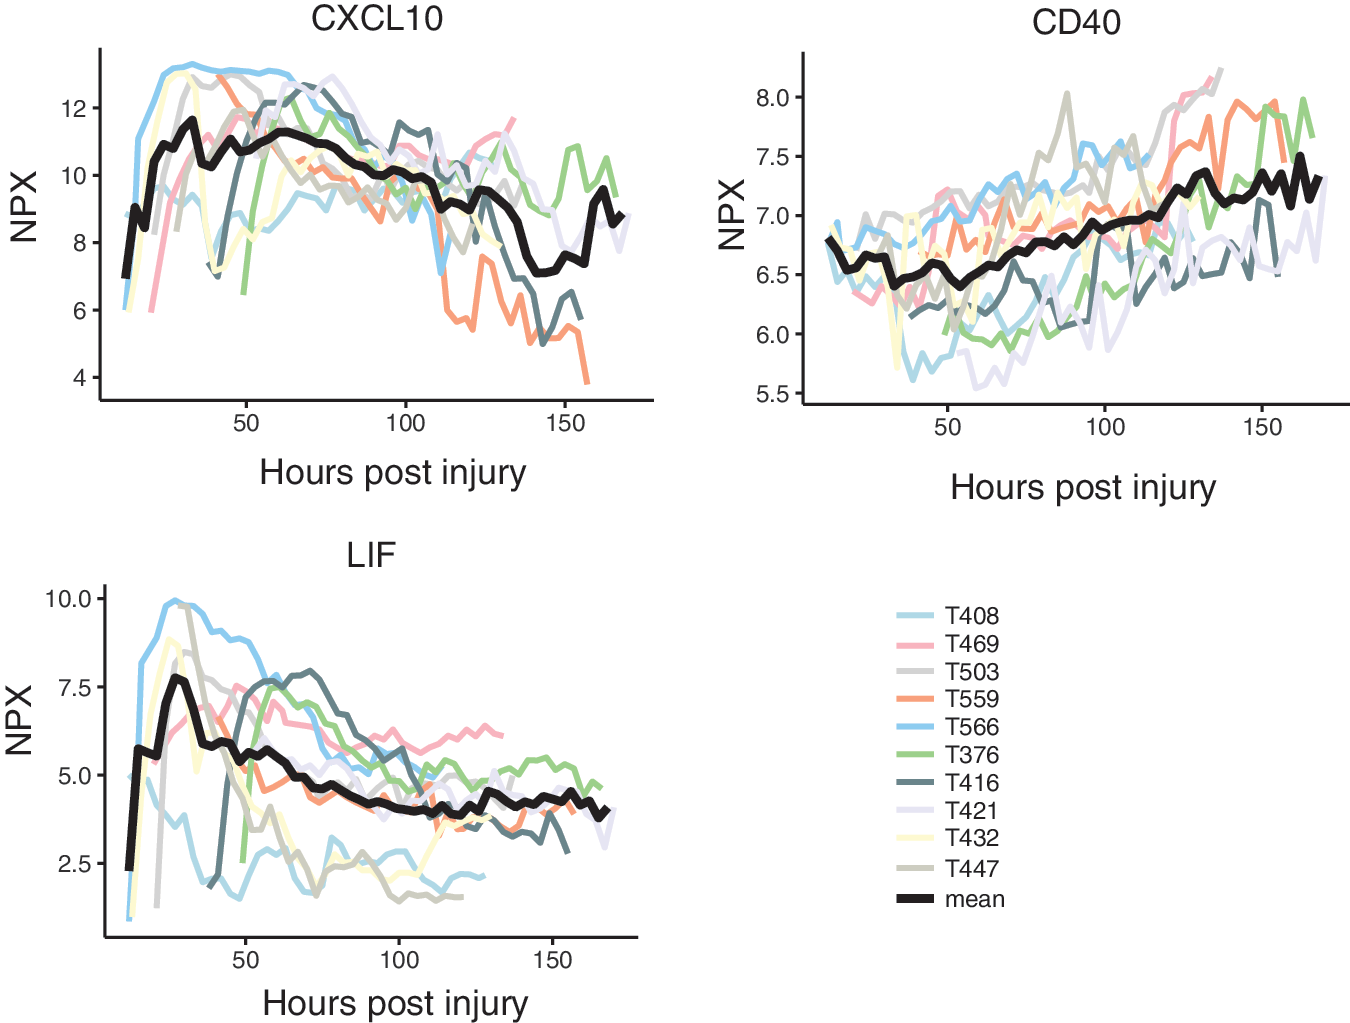
Examples of temporal expression level trends for three inflammatory proteins for the individual patients. The CXCL10 showed a very strong and sustained pattern with a peak at around two to three days with a trend toward a second peak late in the observation period. The CD40 showed a steadily increasing trend over time, whereas leukemia inhibitory factor (LIF) peaked very early, approximately one day after trauma. The black line represents the median expression level (NPX—Neutralized Protein eXpression). Color image is available online.
There were five generalized patterns of expression classified as early-, mid- or late peaking, biphasic (with one early and one late peak) or stable trends. For instance, CXCL10 showed a very strong and sustained pattern with a peak at approximately two to three days and a very late peak in a few patients. The CD40 levels were found to increase steadily over time, while LIF peaked very early around one day after trauma (Fig. 5). Table 6 provides a summary over median protein trends and peaks based on subjective visual inspection of the graphs in Supplementary Figure 1 (see online supplementary material at
Summary of Graphical Trends for Individual Proteins
Early (<48 h after injury)-, mid (48–96 h)-, late (96–150 h) peaks, biphasic (early/late), and stable median trends as well as median peak NPX (Neutralized Protein eXpression) values are given based on visual inspection of the graphs in the order they appear in Supplementary Figure 1. An increase of 1 NPX represents a two-fold increase of protein concentration in the sample.
Visualization of temporal protein dynamics
Because the protein expression levels were monitored over time (hours after TBI), it was possible to study the temporal dependence between different proteins using cross-correlations. One such example is illustrated in Figure 6, where it is demonstrated that the level of IL6 at one time point has a strong positive correlation with the level of LIF at the same time point, meaning that both proteins are highly expressed at the same time. Moreover, the correlation between the current level of IL6 and the level of LIF 30 hours later is strongly negative, meaning that if IL6 currently is highly expressed, LIF will tend to have a low expression level 30 hours later, and vice versa.
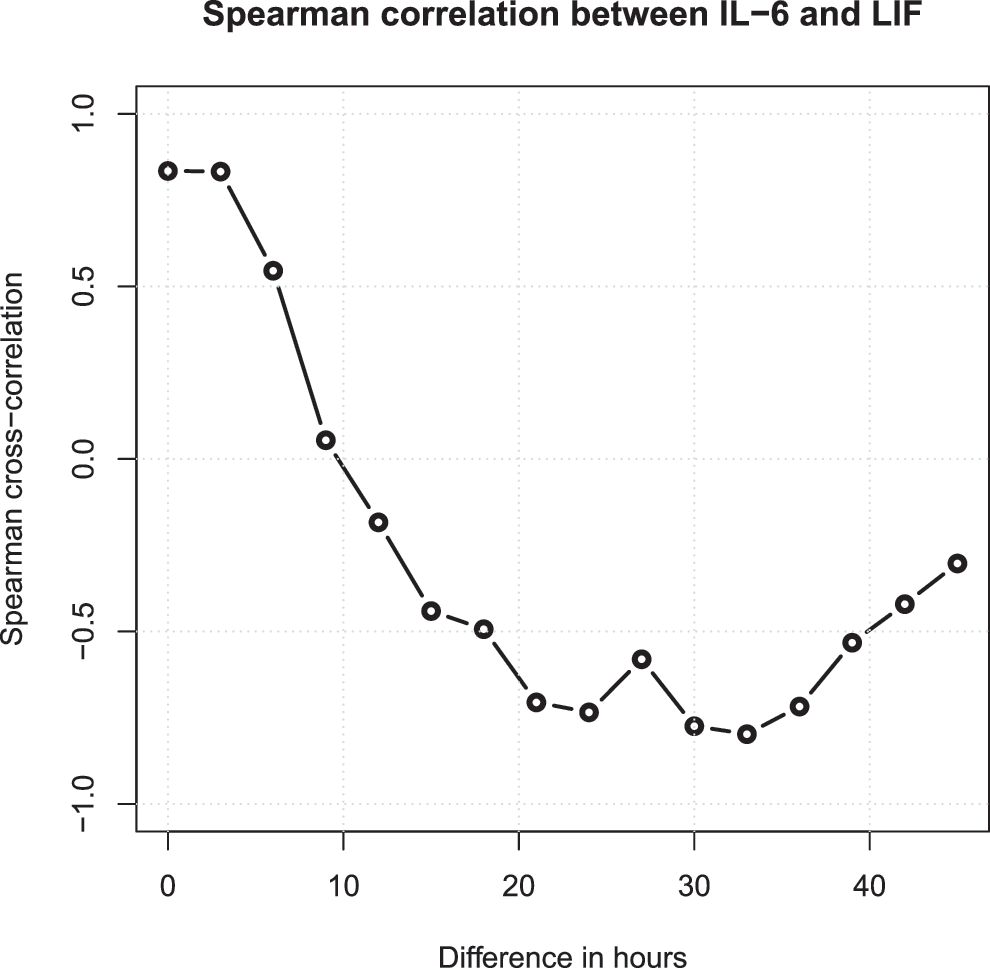
To study the temporal dependence between the individual proteins, cross-correlations were computed 22 using the Spearman rank correlation coefficient. 23 This is one example showing that the level of interleukin (IL)6 at one time point has a strong positive correlation with the level of leukemia inhibitory factor (LIF) at the same time point—i.e., both proteins are highly expressed at the same time. Moreover, the correlation between the current level of IL6 and the level of LIF 30 h later is strongly negative, meaning that if IL6 currently is highly expressed, LIF will be having a low expression level 30 h later, and vice versa, enabling a prediction of the levels of LIF over the course of the next 40 h based on the current IL6 level.
As also seen in Figure 6, the current IL6 level can be used to predict how the levels of LIF will develop over the course of the next 40 h. Similar correlation data for a number of pairs of proteins are listed in Supplementary Figure 2.
To visualize the possibly regulatory relationships found among the proteins in this study, the proteins with the strongest temporal dependencies are shown as a network in Figure 7. The direction of the arrows in the network shows the temporal direction of the dependence between the proteins. For instance, the arrow from FGF19 to CCL4 suggests that the current expression level of FGF19 can be used to predict the future expression levels of CCL4. As seen in Figure 7, the proteins with by far the highest number of connections were LIF and CXCL5 with 13 and 12 connections (arrows), respectively, suggesting that these proteins have a central role in the inflammatory process. Next in line were MMP1 and CCL19 with six connections, followed by IL6, CXCL9, and OPG with five connections each.
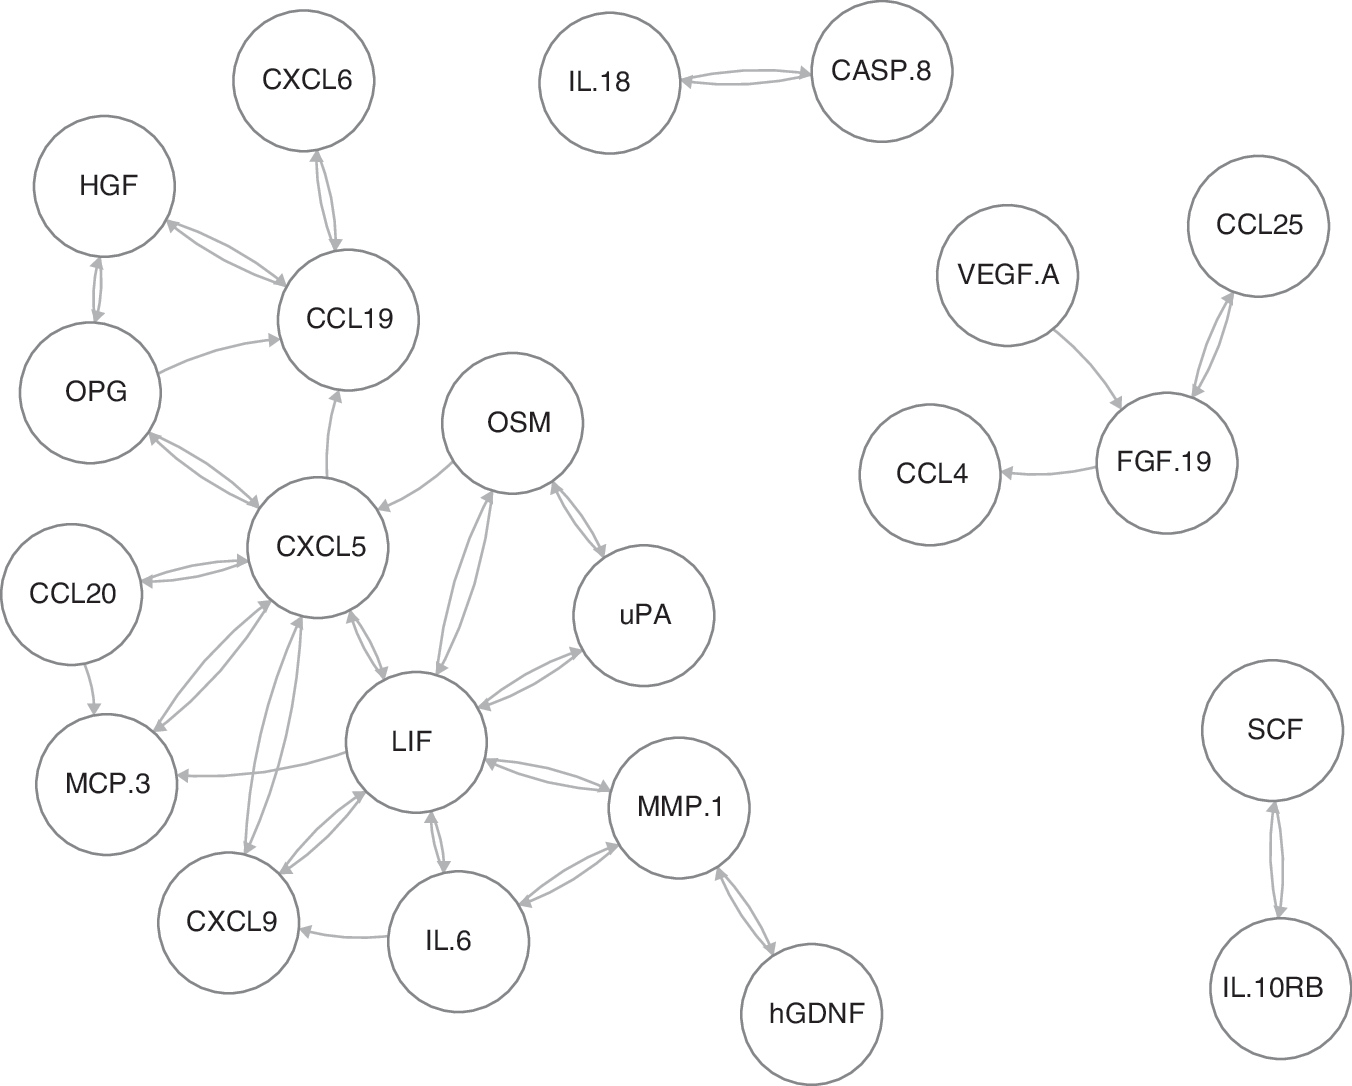
Network of potentially regulatory relationships for the proteins with the strongest temporal dependencies according to the cross-correlation analysis is shown. The direction of the arrows in the network shows the temporal direction of the dependence between the proteins. For instance, the arrow from FGF19 to CCL4 shows that the current expression level of FGF19 can be used to predict the future expression levels of CCL4. The proteins with by far the highest number of connections (arrows) were LIF and CXCL5 (13 and 12, respectively), suggesting that these proteins have a central role in the inflammatory process. Next in line were MMP1 and CCL19 (six connections) and IL6, CXCL9, OPG with five connections each.
Discussion
This is the first report on using highly sensitive multiplex PEA technology in combination with cerebral MD to measure simultaneously a large number of inflammatory proteins in very small sample volumes from brain interstitial fluid (ISF) in NIC patients with severe TBI. The study demonstrates in detail that TBI sets off a complex molecular cascade of proteins regulating inflammation in the injured brain. Some proteins are well known, such as IL6, IL8, MIP1α, whereas others have not been reported previously in human TBI, such as CCL8, -19, -20, -23, CXCL1, -5, -6, -9, -11, CST5, DNER, Flt3L, and SIRT2. Therefore, the study offers new insights in TBI-related neuroinflammation.
Proteins will be discussed in sections below based on detected protein NPX levels. In decreasing order MCP1, IL8, CXCL10, IL6, CXCL5, MCP2, MCP3, VEGFα, CXCL1, Flt3L, CCL4, CCL19, DNER, MMP1, CD40, CCL20, CST5, uPA, CCL23, CXCL9, CSF1, CXCL11, LIF, MIP1a, were observed at high or very expression levels (median NPX >5). Comparing with the article by Helmy and colleagues, 26 their five highest protein levels were seen for MCP1, CXCL10, PDGFα (not included in our panel), IL6, and IL8. Thus, even though the analytical methodology differs, some important core results remain similar, strengthening both studies.
Some of the proteins analyzed in this study previously have been implicated to play a role in the inflammatory response to TBI—i.e., MCP13, IL8, CXCL10, IL6, VEGF, CCL4, MMP1, CD40, uPA, and CSF1. The present study adds important information on the individual temporal profiles of these biomarkers in human TBI.
Cytokines
CC chemokines (CCLs)
Many of the CCLs were regulated strongly in our study. The MCP1 (CCL2) is secreted by inflammatory cells (macrophages, monocytes), known to be involved in human TBI. 26,27 We found very high MCP1 expression levels (hovering at mean NPX ∼13) and fairly sustained but with individual patient variations, supporting a very important role for this protein in human TBI. In line with this notion, Helmy and associates 26 found a 12-fold higher median MCP1 level in MD compared with arterial plasma samples (i.e., a median ISF/plasma ratio of 12). Future studies need to focus on the correlation of MCP1 and outcome.
Regarding other MCPs—i.e., MCP2 (CCL8)—we observed very high levels of the protein that were fairly consistent between patients with a slightly increasing trend during the first 100 h, followed by a decline in some patients, whereas others remained high. To our knowledge, MCP2 has not been reported previously in human TBI. The MCP3 (CCL7) binds to the receptors CCR1, CCR2, and CCR3 and is involved in chemotaxis and inflammatory responses. In the study by Helmy and coworkers, 26 a fivefold higher median level in MD compared with arterial plasma samples (i.e., a median ISF/plasma ratio of ∼5) was reported. We noticed a very strong MCP3 signal that was low initially in several patients, but later increased steadily over the observation period (up to median NPX 10), supporting that MCP3 may have a crucial role in the subacute phase after TBI.
The MCP4 (CCL13) was detected in much lower levels (mean NPX <0) but with individual variations. There seemed to be a peak of MCP4 in some patients at around 100 h. The MIP1α (CCL3) was detected initially at a high concentration (median NPX ∼7), leveling off to fairly stable high levels (median NPX ∼4). The MIP1β (CCL4), produced by e.g. microglia in response to TNFα and IL1β was described by Helmy and associates 26 with a median ISF/plasma ratio of 2–3 and variable MD patterns with 6/12 patients peaking early (<30 h). In our study, we observed high CCL4 levels with a fairly stable trend during the monitoring period (median NPX 7–8). With CCL11, we noticed lower levels (median NPX ∼2.5), with large individual variations and an increasing trend at the end of the observation period.
The CCL19 plays a role in normal lymphocyte recirculation and homing. It binds specifically to chemokine receptor CCR7. We observed very high levels of CCL19 (median NPX ∼7.5) with mid peaks. The CCL20 has been suggested to play a crucial role in autoimmune pathogenesis of the central nervous system—e.g., multiple sclerosis. 28 We observed high initial median levels (NPX ∼7.5), fairly sustained over time with delayed peaks in individual patients.
For CCL23, a chemokine with highly chemotactic activity for resting T cells and monocytes, we observed high levels with large individual differences initially followed by an increasing median trend with less individual variation during the second half of the monitoring period (median NPX 6–7). Increased blood levels of CCL23 have been observed recently in human ischemic stroke. 29 The CCL25 was detected with much lower levels (median NPX ∼1.5) but with an increasing trend over the observation period. With CCL28, we noticed much lower values (fluctuating at NPX ∼0.2), but with clear individual variations. Thus, the CCLs showed a diversity of temporal patterns, suggesting different roles of the members of this protein class in TBI.
CX chemokines (CXCLs)
In the other large chemokine class (CX), we also noticed several interesting patterns of CXCLs not described previously in human TBI. We found a very strong regulation and high median levels of CXCL1, 5, 6, 9, 10, and 11. The CXCL1 and CXCL6 were biphasic with an early peak (within one day) and an increasing trend toward the end of the period at four to five days. The CXCL5, -9, and -11 showed a more prolonged flattened peak, whereas CXCL10 had one peak in the early phase (∼1–3 days) after trauma at a median NPX level of ∼11 with a trend for a late, slightly smaller peak.
To our knowledge, the expression pattern of CXCL1, -5, -6, -9, and -11 has not been reported previously after human TBI. The CXCL1, expressed by macrophages, neurotrophils, and epithelial cells, is involved in the recruitment of neutrophiles. The CXCL6 (GCP2) is also chemotactic for granulocytes with stronger activity compared with CXCL5.
Of great interest is CXCL10 (IP10), expressed by various brain cells (neurons, glial cells, macrophages) and with an important role in initiating neuroinflammation by controlling entry and recruitment of CXCR3+ immune cells (such as CD4+ Th1 and CD8+ T-cells, NK-cells, monocytes, and dendritic cells) into the injured brain. 30,31 We have reported previously evidence of an important proinflammatory role of CXCL10 in a mouse model of focal TBI suggesting that this chemokine may be a potential target for anti-inflammatory intervention. 32,33 Helmy and coworkers 26 also demonstrated the involvement of CXCL10 in human TBI with a peak in MD samples of TBI patients 1–3 days after injury at median ISF/plasma ratios of 10–15, in line with our present human data. The delayed peak of CXCL10 demonstrated in both clinical studies appears attractive in a therapeutic context.
Proteins involved in maintaining inflammatory responses are also of special interest. The CX3CL1/fractalkinem, which is found throughout the brain in neuronal cells and is upregulated by TNFα and IL1β in astrocytes with its receptor on microglia and astrocytes, may have such a role. 34 We measured medium-high levels of CX3CL1 (median NPX ∼2.5) with large variation between patients after trauma. In the study by Helmy and colleagues, 26 CX3CL1 median ISF/plasma ratios of ∼2 with no peaks were reported. Further studies need to elucidate the role of this protein in TBI.
Other cytokines
There were several other interesting proteins affected by the injury. The LIF is involved in neuronal cell differentiation and inflammation by activation of JAK/STAT and MAP kinases. We noticed a high early LIF peak (median NPX 7.5) slowly leveling off to a median NPX level of ∼5, suggesting that LIF is an important mediator of inflammatory reactions elicited by the trauma.
The LIF receptor (LIFR) was detected at much lower levels but with a clear decreasing trend. The highest LIFR values were observed at MD start (median NPX below 2) in five of 10 patients followed by a gradual decline. In five patients, however, LIFR levels were close to LOD for unknown reasons, making interpretation of temporal LIF/LIFR ratios difficult.
OncostatinM (OSM) is related to LIF and regulates production of other cytokines (IL6, GCSF, and MCPs) in endothelial cells. We noticed a biphasic trend for OSM, with a high initial peak followed by a decline and a later peak, median NPX values residing in the 4–6 span.
Stem cell factor (SCF/Kit ligand) is a multi-functional cytokine important for cell survival and proliferation, acting synergistically with other cytokines. We noticed medium high NPX levels (∼ 3.6–4) with individual fluctuations but no clear trend during the observation period. Further studies are needed to demonstrate whether there are any changes in the concentration levels for this protein at later time points.
The CD40 is a member of the TNF-receptor superfamily. It is found on antigen presenting cells where, on binding of its ligand CD40L, stimulates them and induces a broad variety of immune and inflammatory responses. The CD40L has been implicated in human TBI. 35 Helmy and associates 26 showed individual CD40L variation among TBI patients with an early (<40 h) peak in four of 12 patients. We observed high CD40 levels with a steadily increasing temporal trend within the median NPX 6.5–7.5 span.
Interleukins
Many of the interleukins were undetectable or were detected in very low concentrations/low number of samples (i.e., IL2, IL2RB, IL4, IL5, IL10RA, IL12B, IL13, IL15RA, IL17C, IL20, IL20RA, IL22RA1, IL24). We found a strong biphasic regulation of IL8 (CXCL8), however, with a very high early peak (median NPX 15) within the first day post-TBI followed by a decrease and a secondary peak in the end of the observation period at four to five days (median NPX 14).
The IL8 is produced by many cells including macrophages, endothelial cells, or any cells with toll-like receptors and is part of the innate immune response. It is regulated by many factors (e.g., NFκB), and the high levels in our study may imply an important role of this protein in neutrophil recruitment after TBI. The biphasic trend may suggest a first peak involved in chemotaxis and a second peak involved in phagocytosis of injured cells. In the study by Helmy and coworkers, 26 a very high median ISF/plasma ratio of 20 was reported, supporting intrathecal production.
The IL6 is a cytokine with a wide variety of biological functions. It is a potent inducer of the acute phase response and plays an essential role in the final differentiation of B-cells into Ig-secreting cells. Involved in lymphocyte and monocyte differentiation, IL6 acts on B-cells, T-cells, hepatocytes, hematopoietic progenitor cells, and cells of the central nervous system (CNS) and is required for the generation of T(H)17 cells.
The IL6 is a strong inducer of the inflammatory response after TBI, but also has neuroprotective properties. 36,37 In the study by Helmy and colleagues, 26 an early ISF peak was observed in nine of 12 patients with TBI during the first three to four days after injury, but no late peaks were reported. Again, a very high median ISF/plasma ratio of 35 was observed, indicative of a substantial intrathecal IL6 production. In 57 patients with severe TBI, Mellergård and associates 38 reported the highest ISF levels of IL6 in the first 24-h MD sample, then declining levels over the remaining observation period (days 2–7 after injury).
In our study, we found a biphasic median trend with a high flat peak (NPX 10) over the first two days after injury followed by a decline and a second peak (median NPX 9) toward the end of the monitoring period. Based on the previous studies 26,38 showing no secondary IL6 peaks and the fact that half of our patients showed a continued decline over the monitoring period (even though the group median showed a peak), our results suggest that delayed IL6 peaks may only present in a subpopulation of patients with TBI.
The anti-inflammatory IL10 was reported to respond late to human TBI in the study by Helmy and associates. 26 Thus, presenting at a median ISF/Plasma ratio of ∼4, IL10 levels were observed peaking in 5/12 patients with TBI at four to six days post-injury. In our study, IL10 was detectable only in 4/10 patients with an early peak in two patients and a late peak in another two patients starting at four days after injury. This is not in complete agreement with the results in the study by Mellergard and colleagues 38 who reported low stable median ISF levels of IL10 without significant peaks as measured days two to seven in 57 patients with severe TBI.
Proteases
The MMP1 is involved in breakdown of the blood–brain-barrier (BBB) and the development of edema after injury. In a recent MD study in 12 patients with contusions, MMP1 remained fairly stable and at low levels using Luminex technology. 39 In our measurements, MMP1 was detected at high levels with a biphasic peak (median NPX ∼7). The MMP10 levels were observed to have a different trend, with lower values, peaking at one to two days (median NPX 2) and then subsiding. This pattern differed from that in the study by Guilfoyle and coworkers 39 who reported low and stable values of MMP10, suggesting that the PEA method may be more sensitive for detection of MMPs in MD samples compared with Luminex technology.
In another study of eight patients with TBI, Roberts and associates 40 also found early MD peaks of MMP1, but after two days the levels decreased and remained stable at low levels. The studies combined suggest that MMP1 and perhaps MMP10 are involved in pathological events after trauma such as breakdown of BBB and edema formation.
Urokinase (uPA) is a serine protease that activates plasminogen to plasmin. This activation leads to a proteolytic cascade that ultimately is important for the degradation of tissue and thrombolysis. We found a slowly increasing trend at a high expression level (median NPX >5). Interestingly, uPA has been suggested to be involved in progression of contusional bleedings after TBI 41 and delayed intracerebral bleedings after murine closed head TBI. 42
Cystatin D (CST5) is a cysteine proteinase inhibitor found in human saliva and tear fluid and may play a role in controlling proteolytic activity during inflammatory processes. This biomarker was selected as the best biomarker for TBI in the article by Hill and coworkers
43
because it was regulated at very early stages and could discriminate between mild and severe injury. In our study, we observed high levels of the protein (median NPX 6–7), which was stable for most patients, while a slightly increasing trend could be observed for some patients in the end of the observation period (Supplementary Fig.1; see online supplementary material at
Growth factors
Macrophage colony stimulating factor 1 (CSF1) is a cytokine and a growth factor that functions as an inducer of proliferation and differentiation of hematopoietic stem cells to macrophages and monocytes. The CSF1 plays an important role in innate immunity, inflammation, osteogenesis, and fertility. The CSF1 have been linked to M2 microglia, 41,44 although the concept of M1/M2 microglia in TBI remains unclear. 45 We saw stable high levels of CSF1 with a median NPX of ∼5 in 9/10 patients. Another M2 stimulator, IL4, was not detectable in our study.
Increased levels of vascular endothelial growth factor (VEGF) have been reported previously in CSF 46 and MD samples. 47 Helmy and colleagues 26 reported a VEGF median ISF/plasma ratio of ∼8 without any peaks. We observed fairly stable high VEGF median levels (NPX ∼8) with three patients showing very high peaks (NPX >8) appearing in the early, middle, and late phase of the monitoring period, respectively. Mellegård and associates 47 reported an ISF peak of VEGF in the second of six 6-h periods after implantation of a MD catheter in seven patients with TBI.
Delta and notch-like epidermal growth factor-related receptor (DNER) is an activator of the NOTCH1 pathway. Notch receptors have been shown to regulate the expression of proteins that are crucial for peripheral T-cell activation and differentiation, including the transcription factors nuclear factor-κB (NF-κB), the proinflammatory cytokine interferon-γ (IFNγ), and the interleukin-4 (IL4) enhancer CNS2. 48 We observed high levels of DNER (median NPX ∼7) with large variations in patterns and trends among the patients, suggesting an important role for DNER mediated signaling in TBI.
Cross-correlations
Because the protein expression levels were monitored over time after TBI, it was possible to study the temporal dependence between different proteins using cross-correlations. The data in Figure 6 and Supplementary Figure 1 reveal strong relationships among the proteins and show that suitably chosen proteins can be monitored to discover (and possibly interfere with) changes in the levels of other proteins hours or days before the changes occur.
A high cross-correlation between two proteins could indicate a direct or indirect regulatory relationship between them, but such cross-correlation could also be because both proteins may be regulated by some external mechanism not included in our data. Indeed, in the example of IL6 and LIF (Fig. 6), the relationship could be explained by the fact that both proteins are decreasing over time. Nevertheless, such relationships are interesting because they may allow us to predict what will happen with the expression levels of some downstream proteins by measuring only a few upstream proteins in the inflammatory cascade.
To visualize the possible regulatory relationships found among the proteins in this study, the proteins with the strongest temporal dependencies are shown as a network in Figure 7. The direction of the arrows in the network shows the temporal direction of the dependence between the proteins. For instance, the arrow from FGF19 to CCL4 shows that the current expression level of FGF19 can be used to predict the future expression levels of CCL4. As illustrated in Figure 7, the proteins with by far the highest number of connections were LIF and CXCL5, suggesting that these proteins have a central role in the inflammatory process.
Study limitations
Despite the fact that the data presented here are based on a small cohort of patients with TBI, we believe that the study brings out new valuable knowledge on the temporal profiles and patterns of potentially important biomarkers of inflammation in human TBI, where both previously studied and novel proteins were analyzed.
Even though the analytical method is semiquantitative, it has proven very potent with high sensitivity and specificity allowing for analyzing extremely small samples such as microdialysates, thus providing valuable comparable data on a large number of proteins useful for studying temporal levels and trends to help monitoring patterns of complex injury mechanism in CNS disease. Once a smaller number of key biomarkers have been identified, a PEA-based platform can be implemented as a quantitative method for routine use in the NIC setting.
Footnotes
Acknowledgment
The authors are sincerely grateful to the nurses and staff of the NIC unit for running the bedside microdialysis and to Inger Ståhl Myllyaho for excellent technical assistance. The study was supported financially by Uppsala University Hospital, Uppsala County Council (Region Uppsala), the Centre of Excellence Neurotrauma, the Swedish Research Council, the Vinnova Foundation, the Uppsala Berzelii Technology Centre for Neurodiagnostics, Marie Curie ITN (GastricGlycoExplorer) and the Selander Foundation.
Author Disclosure Statement
No competing financial interests exist.
Supplementary Material
Supplementary Figure S1
Supplementary Figure S2
Supplementary Table S1
Supplementary Table S2
References
Supplementary Material
Please find the following supplemental material available below.
For Open Access articles published under a Creative Commons License, all supplemental material carries the same license as the article it is associated with.
For non-Open Access articles published, all supplemental material carries a non-exclusive license, and permission requests for re-use of supplemental material or any part of supplemental material shall be sent directly to the copyright owner as specified in the copyright notice associated with the article.