
Abstract
Mild traumatic brain injury (mTBI) is an important public health problem. Although conventional medical imaging techniques can detect moderate-to-severe injuries, they are relatively insensitive to mTBI. In this study, we used hybrid diffusion imaging (HYDI) to detect white matter alterations in 19 patients with mTBI and 23 other trauma control patients. Within 15 days (standard deviation = 10) of brain injury, all subjects underwent magnetic resonance HYDI and were assessed with a battery of neuropsychological tests of sustained attention, memory, and executive function. Tract-based spatial statistics (TBSS) was used for voxel-wise statistical analyses within the white matter skeleton to study between-group differences in diffusion metrics, within-group correlations between diffusion metrics and clinical outcomes, and between-group interaction effects. The advanced diffusion imaging techniques, including neurite orientation dispersion and density imaging (NODDI) and q-space analyses, appeared to be more sensitive then classic diffusion tensor imaging. Only NODDI-derived intra-axonal volume fraction (Vic) demonstrated significant group differences (i.e., 5–9% lower in the injured brain). Within the mTBI group, Vic and a q-space measure, P0, correlated with 6 of 10 neuropsychological tests, including measures of attention, memory, and executive function. In addition, the direction of correlations differed significantly between groups (R 2 > 0.71 and pinteration < 0.03). Specifically, in the control group, higher Vic and P0 were associated with better performances on clinical assessments, whereas in the mTBI group, higher Vic and P0 were associated with worse performances with correlation coefficients >0.83. In summary, the NODDI-derived axonal density index and q-space measure for tissue restriction demonstrated superior sensitivity to white matter changes shortly after mTBI. These techniques hold promise as a neuroimaging biomarker for mTBI.
Introduction
T
Diffuse axonal injury is generally believed to be the initial neuropathology associated with mTBI. 12 –18 The inertia forces subsequent to linear and rotational acceleration caused by TBIs may initiate cellular and subcellular biochemistry reactions, 12 such as calcium dysregulation, 13 thereby compromising cell membrane permeability 14,15 and leading to morphological changes in axonal microstructures. In a study of a mouse model of closed TBI, injured axons underwent dramatic pathomorphological changes with initial swelling and beading, followed by degeneration and apoptosis. 16 Also shown in a fluid-percussion mouse model, such axonal injury progresses over a period of 4–6 weeks and significantly correlates with cognitive impairments. 17 In a recent study of a mouse closed-head mTBI model, mice lacking a key mediator of Wallerian degeneration, the Sarm1 gene, exhibit attenuated axonal injury with better functional outcomes. 18
Despite evidence of axonal injury from animal models, traumatic axonal injury has been more difficult to detect in human mTBI with neuroimaging. MRI-based methods, particularly diffusion tensor imaging (DTI), may be more sensitive than conventional imaging for detecting axonal injury. 19 –21 Among DTI metrics, fractional anisotropy (FA) is the most studied in TBI and is often used as an indicator of white matter “integrity.” Although abnormal FA has been reported in patients with mTBI, its direction of change and brain regions involved have varied, 21 –23 suggesting that further studies of diffusion-weighted techniques are needed. For example, several studies have reported reduced FA values in mTBI, 24 –31 whereas others have reported increased FA values. 32 –38 Even when controlling for the population source, injury-to-imaging interval, age of injury, sample size, publication date, acquisition parameters, and analysis methods, bidirectional changes in FA are reported in the literature. 21,39 The lack of consensus across studies suggests fundamental limitations of DTI for detecting specific damage in mTBI.
Mathematically, FA is defined as the square root of the variance of the diffusion tensor eigenvalues divided by the square root of the sum of the squares of the eigenvalues. That means, in the model of cylindrical symmetry, that FA is driven by two forces—axial diffusivity (AD; principal eigenvalue) and radial diffusivity (RD; second and third eigenvalues that are perpendicular to the axis of the fiber). Therefore, differences in FA could be caused by changes in AD, RD, or both, making FA sensitive to many types of brain pathology 40,41 as well as susceptible to imaging noise, 42,43 loss of specificity, and a lack of information about the nature of the underlying pathology. In addition, there are limitations in the assumptions underlying DTI. Although DTI successfully describes water diffusion behavior at modest b-values (e.g., 1000 s/mm2), many studies have demonstrated that simple Gaussian diffusion models do not sufficiently describe water diffusion in complex tissues, such as crossing fibers 40,44 –48 and mixtures of diffusion compartments. 49 –52 Thus, although diffusion-weighted imaging should theoretically be a significant advance in the detection and explication of the mechanisms of injury in mTBI, conventional DTI approaches have not yet reached this potential.
A novel diffusion MRI acquisition approach, hybrid diffusion imaging (HYDI), 53 comprises multiple diffusion-weighting shells to distinguish diffusion compartments with different diffusivities and multiple diffusion-weighting directions in each shell to capture the directionalities of the compartments. HYDI data can be fit into the recently developed diffusion model, neurite orientation dispersion and density imaging (NODDI), to extract diffusion metrics that may be more biologically specific and unbiased by crossing fibers. 54 –57 Under the NODDI framework, whereas the fiber fanning/crossing is explained by an orientation dispersion index, the volume fraction of the intra-axonal compartment describes axonal density. 54 In recent studies, the axonal density index computed by the NODDI model is almost identical to values obtained from electron microscopy (EM) of ex vivo mouse brains and is in good agreement with the previously reported fiber density of the human brain obtained using EM. 58 In a study of human post-mortem spinal cord with multiple sclerosis (MS), the NODDI axonal density index demonstrated significant sensitivity to the histologically derived density of neuronal element (i.e., neurofilaments staining fraction). 59 NODDI has been demonstrated to be more sensitive than classic DTI in long-term effects of sports-related concussion. 60 Therefore, for mTBI characterized by diffuse axonal injury, the NODDI-derived metrics are highly relevant and may be valuable neuroimaging biomarkers.
Alternatively, changes of white matter microscopic morphology may be studied by a nonparametric analysis, q-space imaging. The q-space approach estimates the water diffusion function, the probability density function, also called mean apparent propagator 61 or ensemble average propagator. 62,63 The zero displacement probability, P0, is the return to origin probability and presents the probability of those water molecules having no net diffusion within a diffusion time. P0 is often interpreted as a measure of restricted diffusion and cellularity. 53,61,64 In animal studies of dysmyelination, P0 was found to be highly sensitive to myelination and brain maturation, 65,66 consistent with other studies of P0 in demyelination of the human brain with MS. 67,68
In this study, we used a five-shell HYDI to sample full q-space diffusion signals. The HYDI data are versatile and were analyzed using DTI, multi-compartmental NODDI modeling, and a nonparametric q-space approach. 55,65,69,70 Seven diffusion metrics computed from the HYDI data were studied voxelwise within a common white matter skeleton with tract-based spatial statistics (TBSS). Diffusion metrics were compared between cohorts and correlated with cognitive function tests.
Methods
Participants
A total of 42 patients were recruited from the emergency department of the Dartmouth-Hitchcock Medical Center (Lebanon, NH), a level 1 trauma center. The mTBI group included 19 patients (11 females, 8 males) with recent autopedestrian accidents. Cases of moderate-to-severe TBI with positive clinical imaging findings (e.g., significant impact-site lesions and hemorrhage) were excluded from this study. In addition, an “other injury” control group consisting of 23 trauma control patients (11 females, 12 males) was also studied. Inclusion criteria for the mTBI group followed the guidelines of the American Congress of Rehabilitation Medicine, 71 including an alteration in level of consciousness subsequent to a force acting on the head, a Glasgow Coma Score of 13–15, loss of consciousness <30 min, and post-traumatic amnesia <24 h. For the trauma control group, individuals with orthopedic injuries, but without injury involving the head, were screened for recruitment. Participants were excluded if they had a history of previous TBI, a history of other neurological disorders, significant systemic medical illness, a current substance-use disorder, and current Diagnostic and Statistical Manual of Mental Disorders, 4th Edition (DSM-IV) Axis I psychiatric illness based on Structured Clinical Interview for DSM interview. 72 All participants provided informed consent approved by the guidelines of the institutional review board at Geisel School of Medicine at Dartmouth College (Lebanon, NH).
Neuropsychological assessment
Clinical assessments included a full battery of neuropsychological measures similar to our previous publications. 10,73,74 The battery assessed the level of estimated intellectual function (Wide Range Achievement Test, 4th edition; WRAT4), sustained attention (Gordon Continuous Performance Test (CPT) for distractibility and vigilance), memory (California Verbal Learning Test [CVLT] II), and executive function (Delis–Kaplan Executive Function System; DKEFS). Measures of mood included the Beck Depression Inventory 75 and State-Trait Anxiety Index. 76 In addition, we used Rivermead Post-Concussion Questionnaire (RPQ) to determine the presence and severity of post-concussion syndrome (PCS). RPQ scores included RPQ-3 (i.e., the sum of the first three items), RPQ-13 (i.e., the sum of the items 4–16), and RPQ-TOT (i.e., the sum of all items). Clinical assessments were performed on the same day of the imaging study. Details of the 10 neuropsychological measures and two mood measures and their abbreviations are listed in Table 1. Neuropsychological measures were compared between groups and were also correlated with the diffusion metrics across the whole brain white matter skeleton.
Two-tailed Student's t-test excluding outliers outside 1.5 IQR and adjusted for estimated verbal intellectual ability (WRAT4 Reading Standard Score).
Bold numbers denote p < 0.05 significant level.
IQR, interquartile range; n, sample size excluding outliers; sd, standard deviation; TBI, traumatic brain injury; WRAT4, Wide Range Achievement Test 4th edition, reading subtest; CPT, Continuous Performance Test; DISRT: Distractibility trial, CPT, reaction time (in milliseconds); VIGRT, Vigilance trial, CPT, reaction time (in milliseconds); CVLT, California Verbal Learning Test, second edition, total words recalled trials 1 to 5; SD, number of words recalled on CVLT-II short-delay free recall; LD, number of words recalled on CVLT-II long-delay free recall; DKEFS, Delis–Kaplan Executive Function System, Trail Making Test; DKEFS1, visual scanning trial of Trail Making Test, seconds to complete task; DKEFS2, number sequencing trial of Trail Making Test, seconds to complete task; DKEFS3, letter sequencing trial of Trail Making Test, seconds to complete task; DKEFS4, number letter switching trial of Trail Making Test, seconds to complete task; DKEFS5, motor speed trial of Trail Making Test, seconds to complete task; Beck, Beck Depression Inventory, second edition (BDI-II), total score out of 63; ANXTR: Trait Anxiety score, total score range 20 to 80; RPQ-3, Rivermead post-concussion questionnaire, the sum of the first three items; RPQ-13, Rivermead post-concussion questionnaire, the sum of the items 4 to 16; RPQ-TOT, Rivermead post-concussion questionnaire, the sum of all items.
Imaging protocol
All participants underwent MRI studies within 1 month of injury: 15 ± 10 days for mTBI patients and 31 ± 20 days for trauma control patients (Table 1). Anatomical imaging included conventional whole-brain T1-weighted, T2-weighted, and T2-weighted fluid-attenuated inversion recovery (FLAIR) imaging. These anatomical images were read by board-certified neuroradiologists to detect abnormal findings. HYDI was performed on a 3.0-T Philips Achieva TX scanner with an eight-channel head coil and sensitivity encoding parallel imaging (R = 2). Similar to a previous work, 53 the HYDI encoding scheme contained one zero diffusion-weighting (b-value = 0 s/mm2, b0) and five concentric diffusion-weighting shells (b-values = 250, 1000, 2250, 4000, and 6250 s/mm2). A total of 142 diffusion-weighting gradient directions (6, 21, 24, 30, and 61 in each shell) were encoded. The diffusion-weighted pulse sequence was a single-shot, spin-echo, echo-planar imaging. MRI parameters used were as follows: repetition time = 3.59 ses, echo time = 114.24 ms, field of view = 224 × 224 mm, matrix = 128 × 128, voxel size = 1.75 × 1.75 mm2, 40 slices with slice thickness = 3 mm, and a total scan time of 24 min. If using a simultaneous multi-slice technique (also called multi-band) 77 as in our other studies, 78 the scan time could reduce to approximately 7 min. Diffusion parameters comprised a maximum b-value of 6250 s/mm2, a diffusion gradient duration δ of 46 ms, and a diffusion gradient separation Δ of 58.4 ms.
Image processing
Image processing included an initial pre-processing and diffusion metrics computation. The diffusion-weighted images were first denoised using a local principle component analysis (LPCA) approach provided in the toolbox developed by Manjon and colleagues.
79
With the b0 images as reference, the diffusion-weighted images were then corrected for motion, eddy current artifacts, and geometrical distortion using the eddy command provided in the FMRIB Software Library (FSL).
80
Using an in-house MATLAB script (The MathWorks, Inc., Natick, MA), the transformation matrices output from the eddy command were used to rotate the corresponding diffusion-weighting directions to match the rotation of the brain image during the motion correction process. After image pre-processing, seven diffusion metrics were computed from the HYDI data set. Diffusion metrics of DTI were computed similarly to a previous work
81
from the inner two shells of the HYDI data using the FSL dtifit command and included FA, AD, RD, and mean diffusivity (MD). NODDI metrics included the axonal density metric (intra-axonal volume fraction; Vic) and orientation dispersion (OD) index, which were computed according to the three-compartment model described in previous works
54, 82
using a MATLAB toolbox provided in
Tract-based spatial statistics analysis
To minimize partial volume effects in finite imaging resolution, in the standard MNI space, a common whole-brain while matter skeleton was extracted using the FSL toolbox, TBSS. 85 The white matter skeleton included only voxels in the center of white matter tracts and excluded edge voxels, which may be contaminated with signals from the nearby anatomy. Within the white matter skeleton, nonparametric permutation-based statistics utilized in TBSS (i.e., the randomise command) was used for voxel-wise statistical analyses in which general linear models controlling for participants' sex, age, and intellectual ability (i.e., WRAT4) were tested. A threshold-free cluster enhancement 86 and 5000 permutations to obtain a corrected p value 87 were utilized in this study. White matter voxels were deemed significant as a corrected p value <0.05 after being adjusted for multiple comparisons by controlling family-wise error rate. Using TBSS, we tested: 1) between-group differences in the diffusion metrics; 2) within-group correlations between the diffusion metrics and neuropsychological measures to explore how sensitive the diffusion metrics are to each neuropsychological outcome; and 3) how mTBI moderates the correlations, that is, the interaction of the group membership and the relationship between the neuropsychological measures and diffusion metrics in general linear regression analyses.
Post-hoc region-of-interest analysis
To produce aggregate results at the subject level, post-hoc region-of-interest (ROI) analyses were performed. For each subject, the mean of each diffusion metric was computed in an ROI comprising white matter voxels that were tested significant in TBSS. For between-group differences, a box plot was used with subjects' means plotted according to their group membership. For within-group correlations, a scatter plot was used with subjects' means plotted against their neuropsychological outcome measures. Further, post-hoc regression analyses allow us to retrieve correlation coefficients (ρ) at the ROI level. In addition, to compare across the diffusion metrics, the total numbers of voxels that were significant in the TBSS regression analysis of within-group correlations and group interactions were summarized in a matrix format for each diffusion-neuropsychological pair. The anatomical interpretation of ROI was based on the Johns Hopkins University (JHU) white matter atlas provided in FSL 88 after skeletonization (Fig. 1). In particular, the TBSS-significant ROIs were intersected with the JHU 48 white matter labels and the voxels counts were summarized in a color-coded matrix.
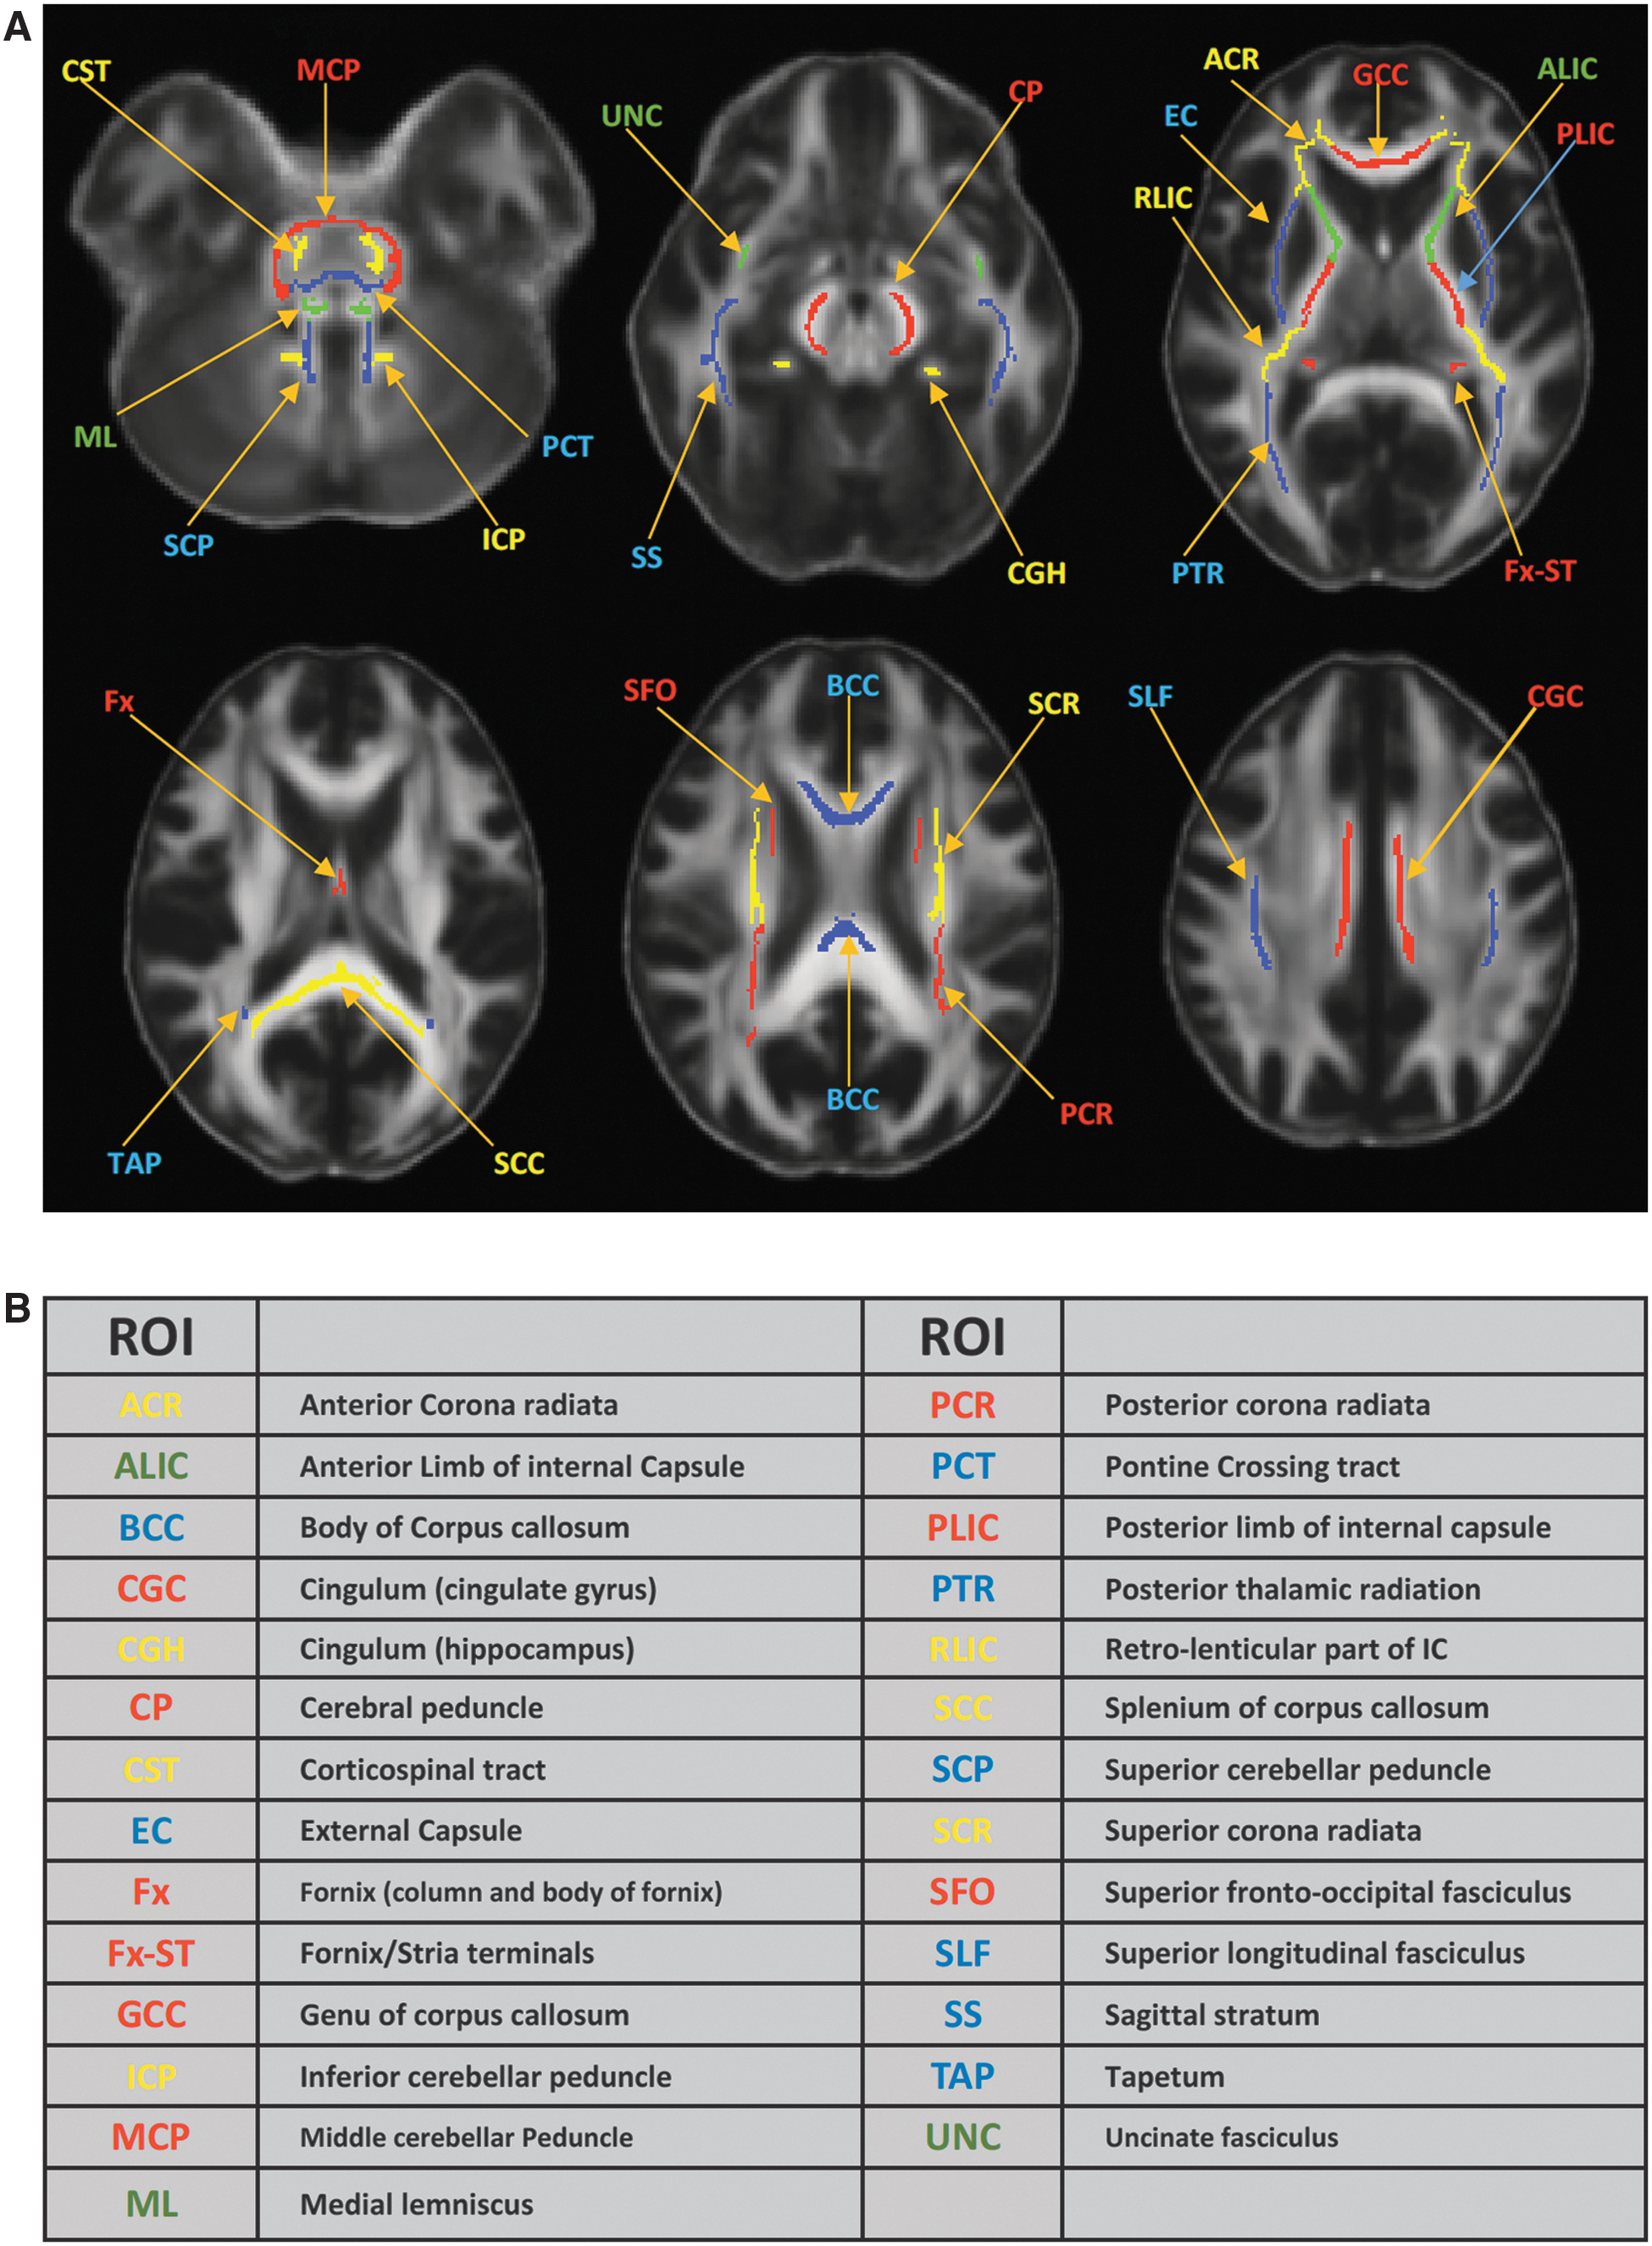
Skeletonized Johns Hopkins University (JHU) white matter atlas and their acronyms. (
Statistical analysis
Outliers in the neuropsychological measures were detected and excluded if outside the median ±1.5 interquartile range (IQR). For between-group comparisons, neuropsychological outcome measures were analyzed with a two-tailed Student's t-test using the Statistical Package for the Social Sciences (version 24; SPSS, Inc., Chicago, IL). Between-group differences in diffusion metrics, within-group correlation, and interaction effects of mTBI were analyzed by regression analyses of general linear models controlling for participants' sex, age, and estimated intellectual ability (i.e., WRAT4).
Results
Clinical and neuropsychological assessments
Clinical reading of the conventional T1-weighted, T2-weighted, and FLAIR images were normal and without hemorrhage or incidental findings in all but 9 participants. Four mTBI patients and 5 trauma controls had nonspecific hyperintense foci in T2-weighted and FLAIR images with otherwise normal white matter. Further, there were no positive findings in CT examinations for all participants. Age distribution and length of education were similar in both groups (Table 1). Individuals with mTBI had a slightly higher verbal intellectual score (WRAT4) than trauma controls; thus, WRAT4 scores were included as a covariate in related statistical tests. None of the neuropsychological and mood measure results differed between groups, except for the distractibility condition of the CPT and RPQ. Distractibility reaction time (DISRT) and severity of PCSs (RPQ-3, RPQ-13, and RPQ-TOT) were significantly higher (worse) in individuals with mTBI (Table 1). Although the injury-to-imaging interval had a relatively large standard deviation (sd; sd = 10 days vs. a mean of 15 days; Table 1), there were no correlations between diffusion metrics and injury-to-imaging interval in a separated analysis using a general linear model.
Between-group differences in the diffusion metrics
Averaged maps of FA, AD, RD, MD, Vic, OD, and P0 across all subjects are shown in Figure 2. Among the seven diffusion metrics tested by TBSS, only Vic differed significantly between groups (Fig. 3A). As shown in the bar plots of the post-hoc ROI analyses (Fig. 3B), individuals with mTBI exhibited lower Vic. The amount of difference was approximately 5–9% of the Vic mean value in trauma controls. These significant results (corrected p < 0.05) were detected in three major clusters of white matter voxels with a minimum p of 0.041 and a size ≥860 mm3 (Fig. 3C). Affected white matter tracts were located predominantly in the corpus callosum and its projections, including the anterior and superior corona radiata.
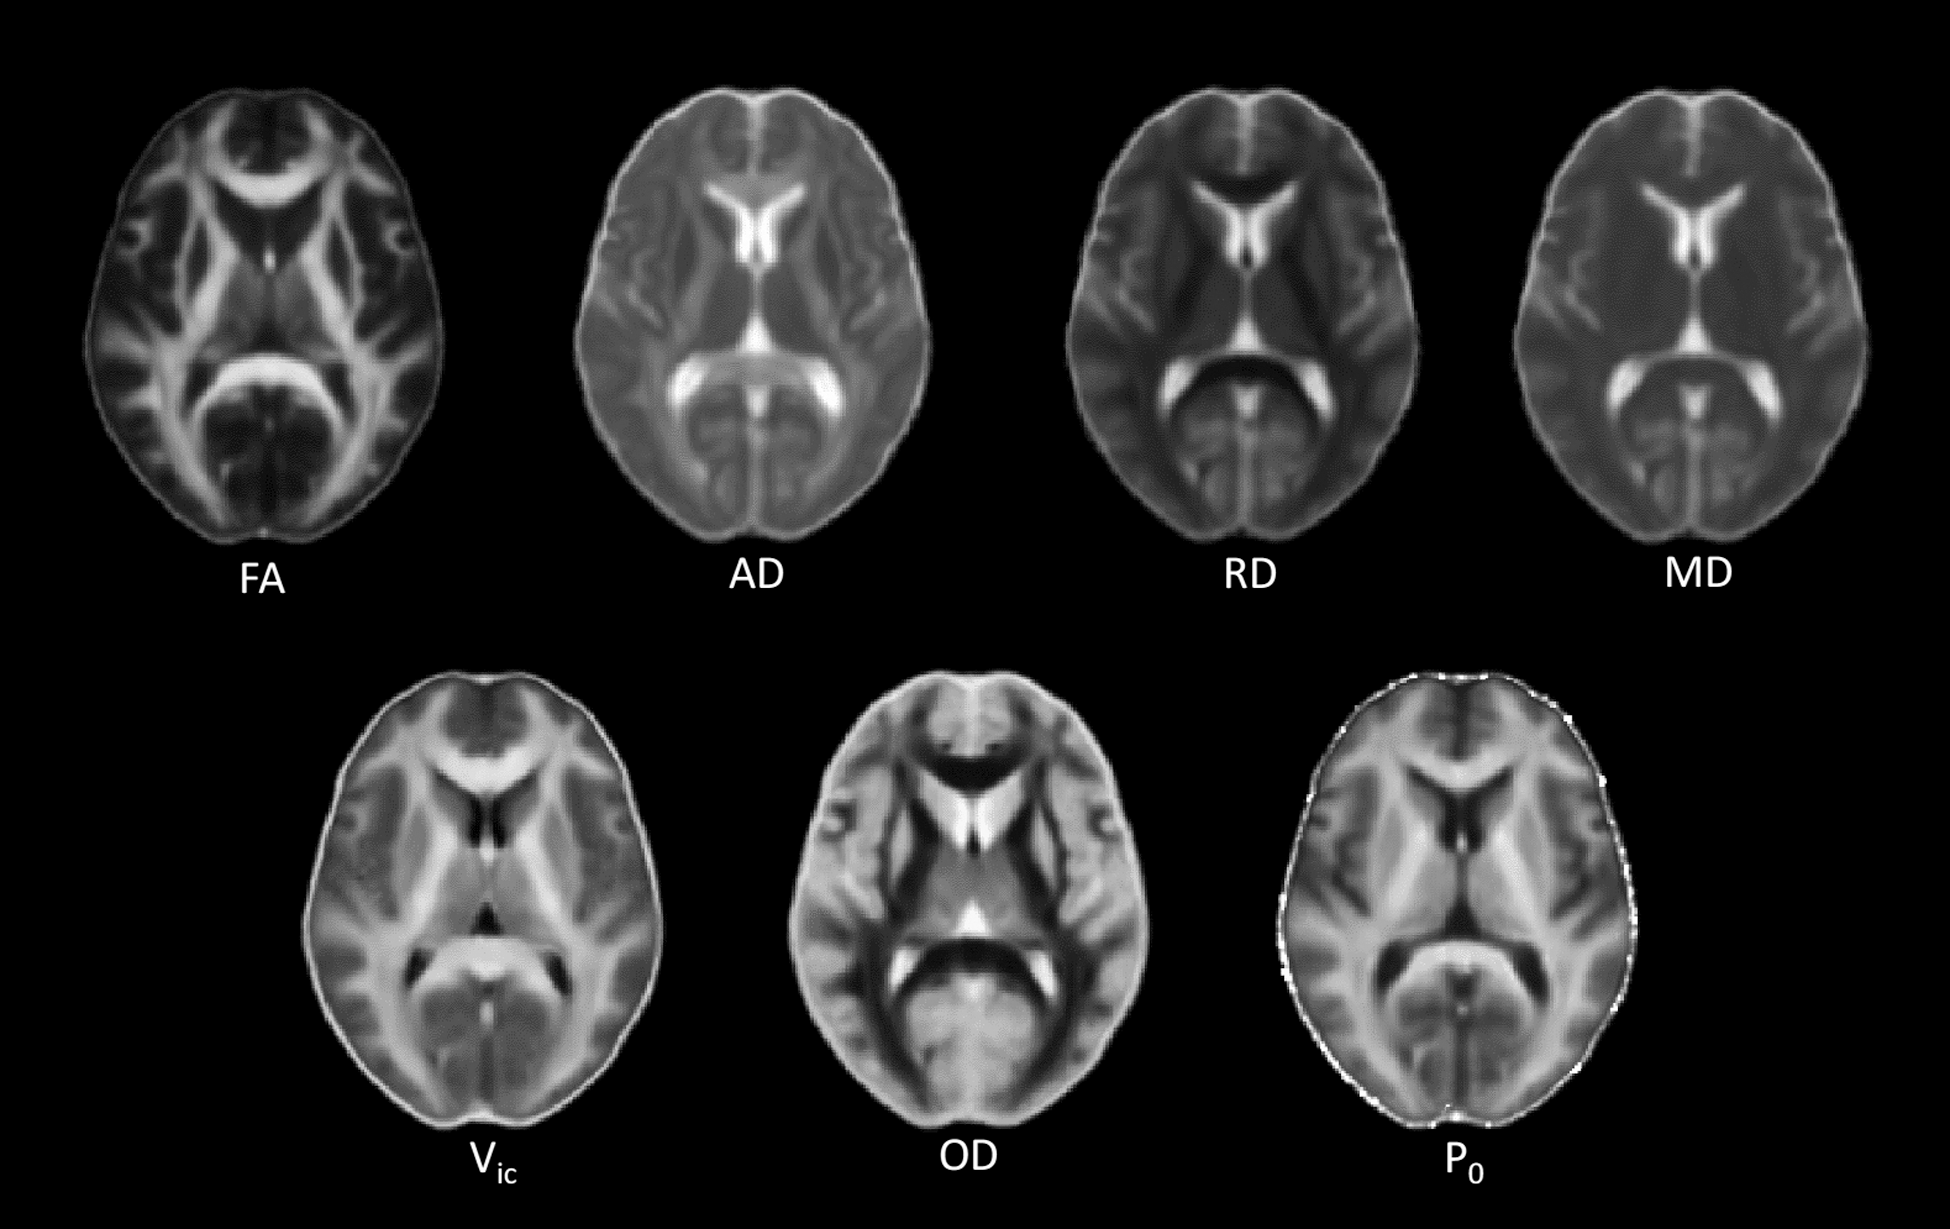
Maps of averaged diffusion metrics of the 42 subjects in the MNI standard space. Diffusion tensor imaging (DTI) metrics include fractional anisotropy (FA), axial diffusivity (AD), radial diffusivity (RD), and mean diffusivity (MD). Neurite orientation dispersion and density imaging (NODDI) metrics include axonal density (Vic) and orientation dispersion (OD). The q-space imaging metric is the zero displacement probability (P0) describing the tissue restriction. The gray scale is 0 to 3*10–6 mm2/s for the diffusivities and is 0 to 1 for FA, Vic, OD, and P0. High intensity in the FA and OD maps indicates high tissue coherence and low dispersion and vice versa. AD and RD have high white matter contrast only in compact fiber tracts with known single-fiber bundles, such as the corpus callosum and the internal capsule. The P0 map shows higher intensity in more restricted areas (i.e., white matter), as expected. White matter also has a higher intensity than gray matter in the Vic map, indicating higher axonal density. MNI, Montreal Neurological Institute.
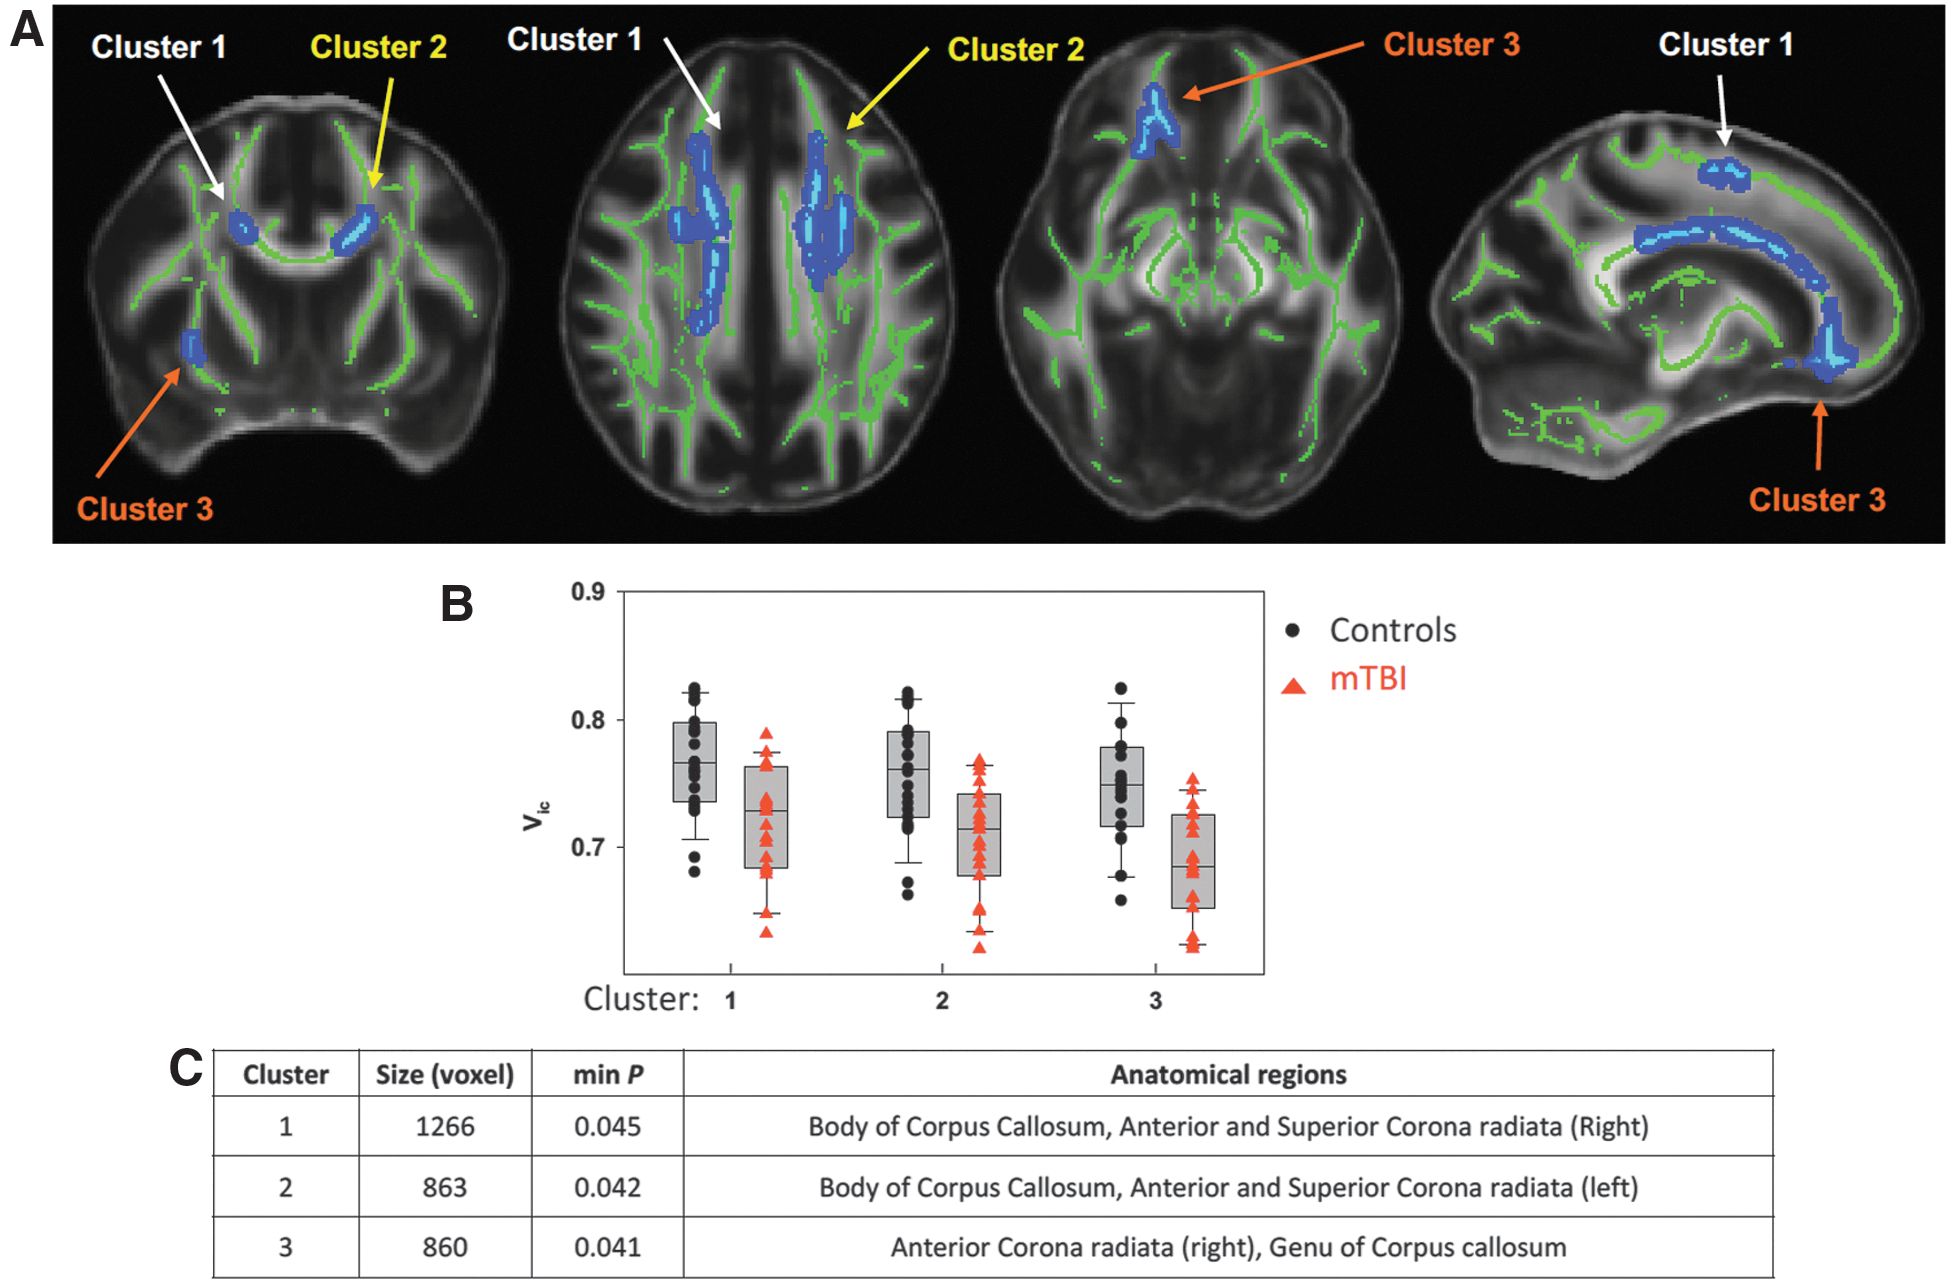
Results of between-group differences in axonal density, Vic. (
Relationship of diffusion metrics to cognitive function: Within-group correlations
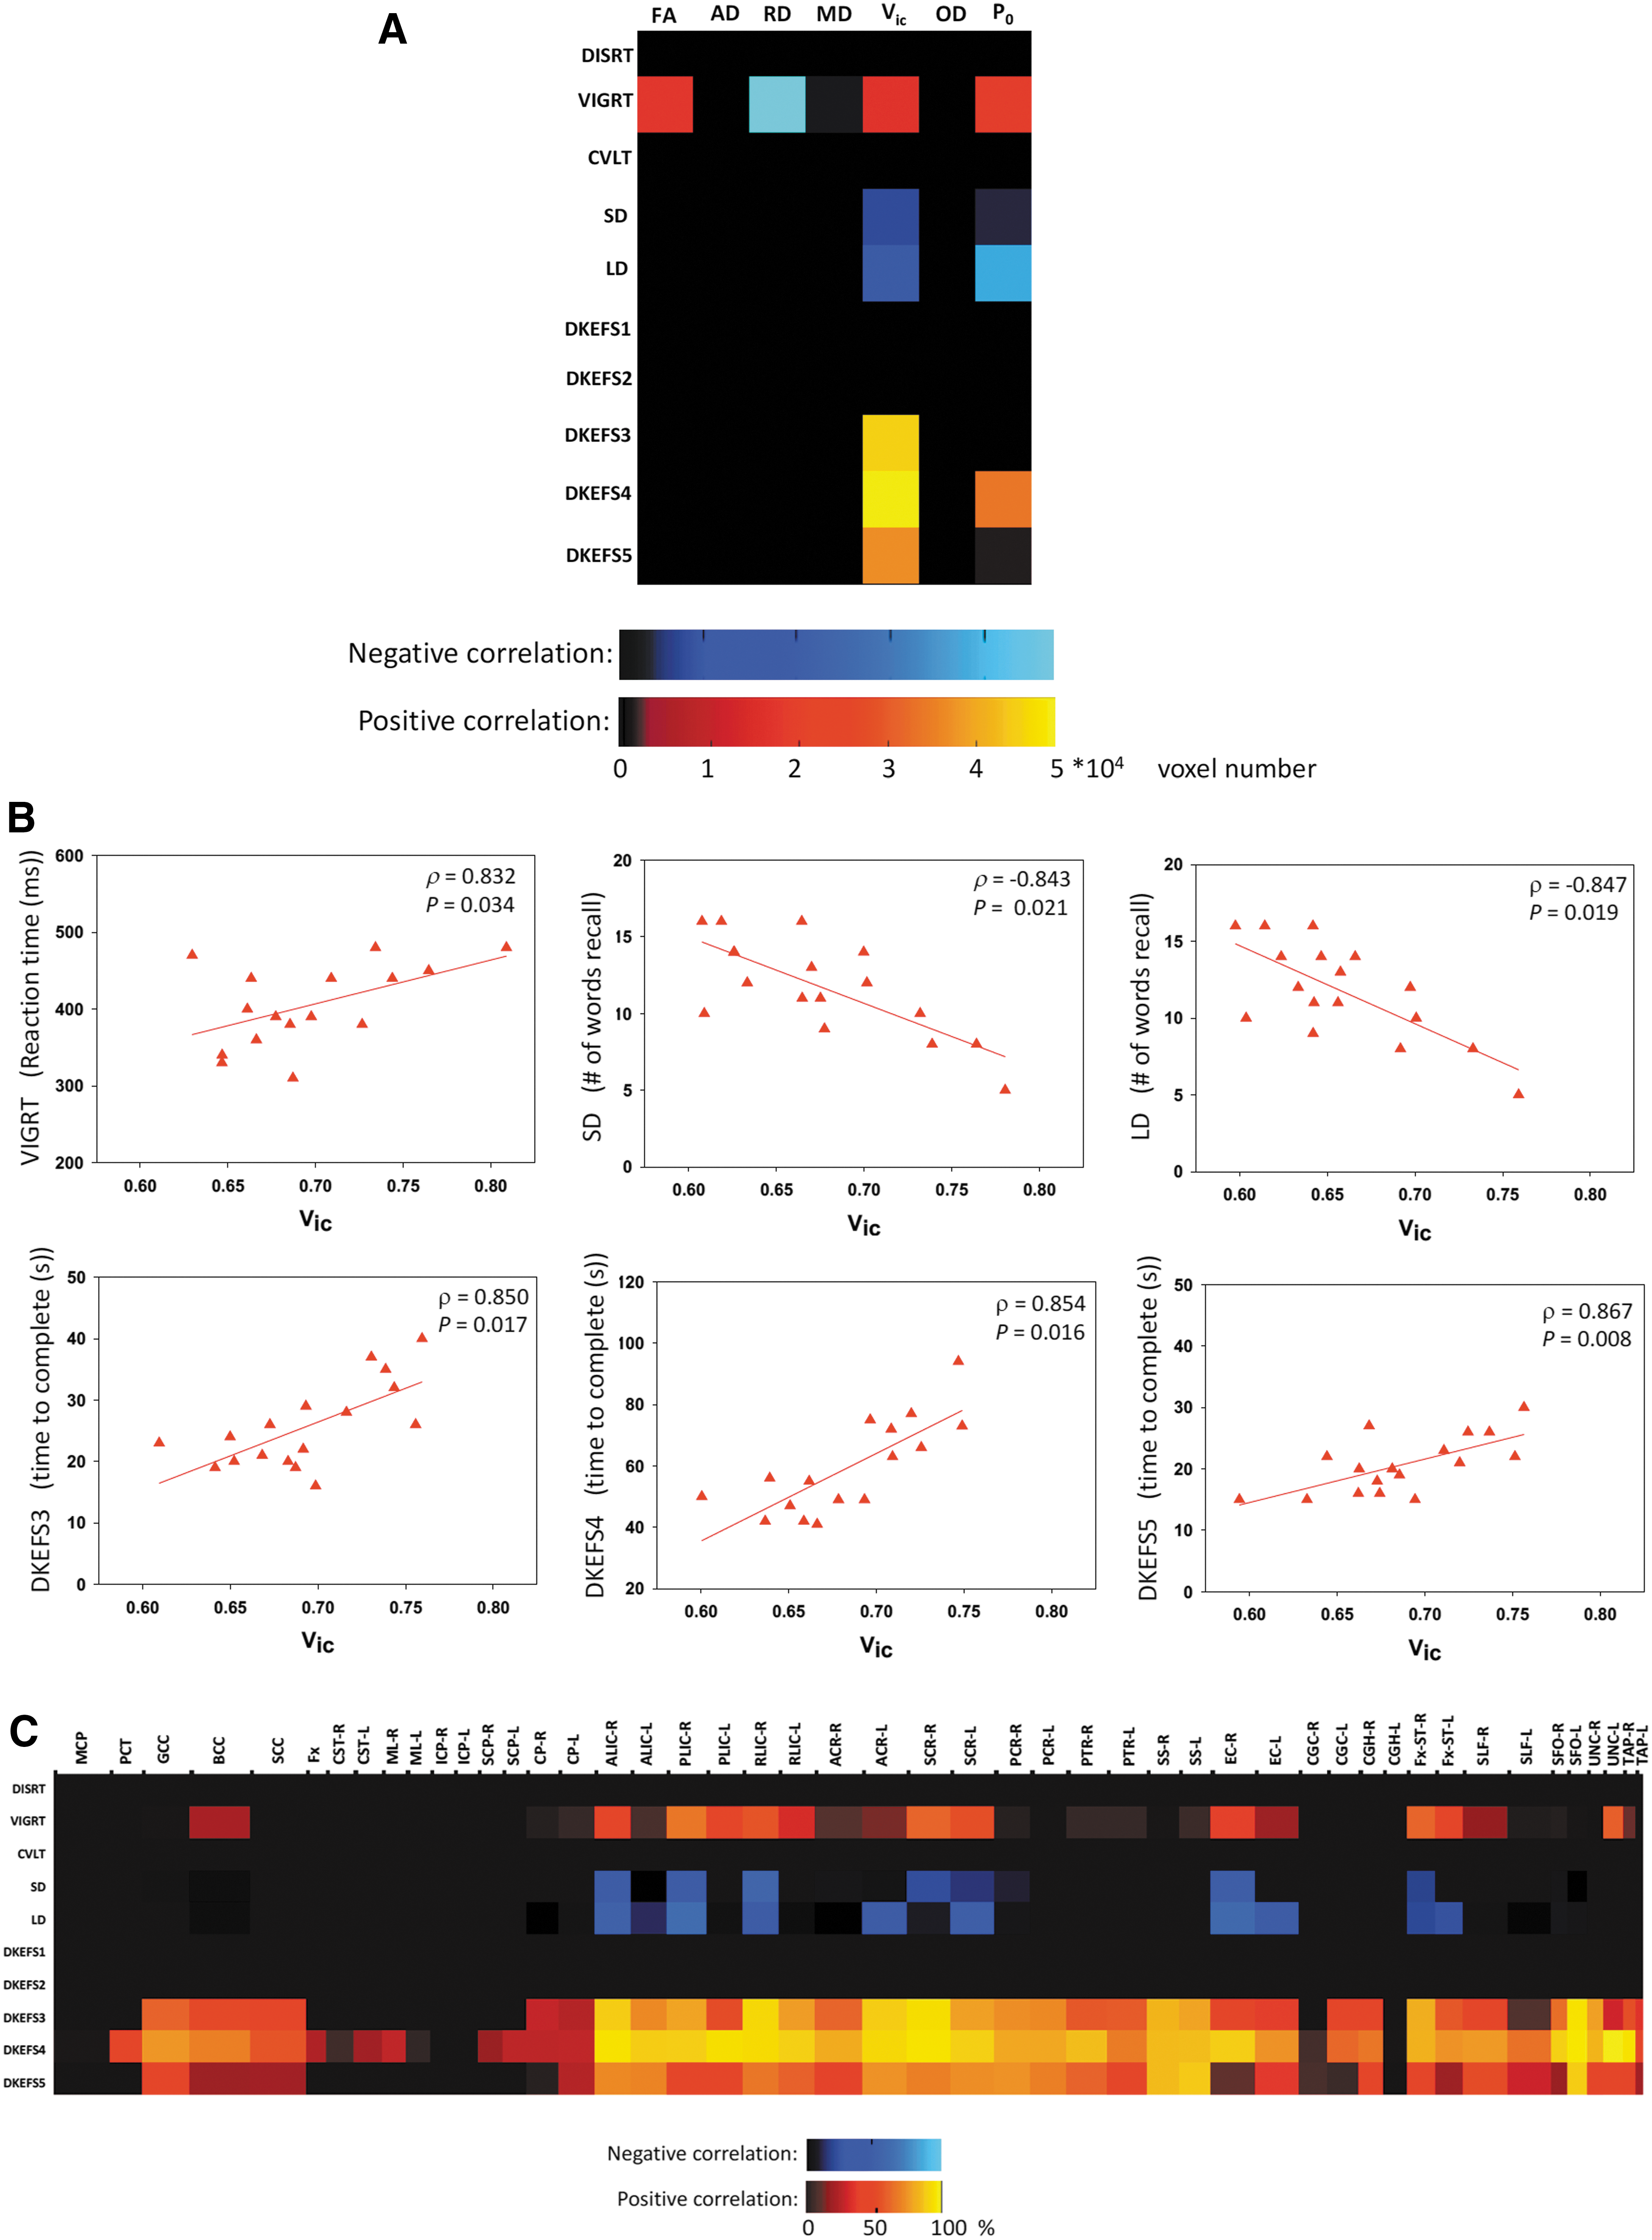
Only Vic, P0, FA, and RD had significant correlations with neuropsychological measures in mTBI subjects. An example of TBSS analysis on within-group correlations between diffusion metrics and neuropsychological measures is shown in Figure 4 for Vic and Number-Letter Switching (DKEFS4), a measure of executive function. Within the group of mTBI, Vic and DKEFS4 had a wide spread of white matter voxels (approximately 5 × 10⁴) that were positively correlated (corrected p < 0.05). For all of the 70 diffusion-neuropsychological pairs, the extent of the correlation expressed as the number of total significant voxels is summarized in Figure 5A.
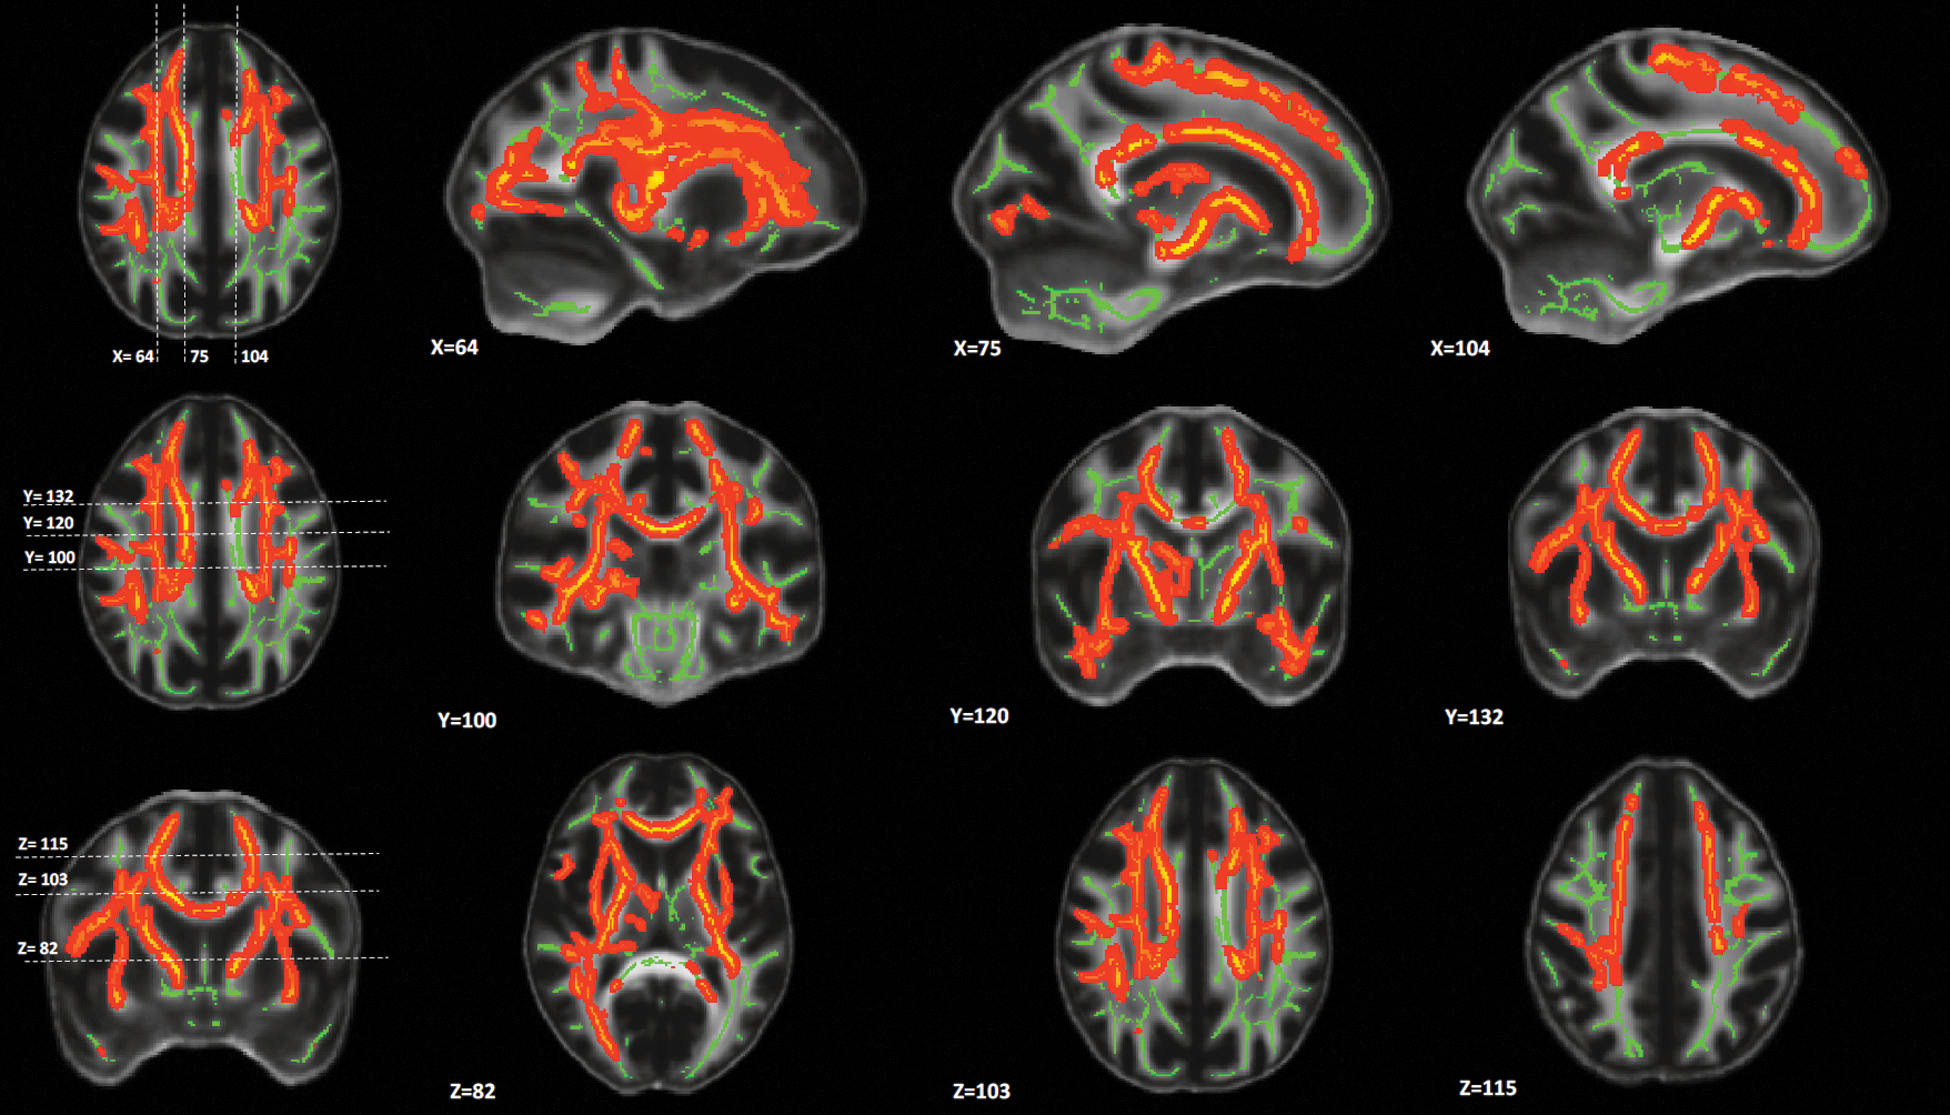
TBSS maps of significant correlations between axonal density, Vic, and Number Letter Switching from the DKEFS Trail Making Test (DKEFS4). In the mild TBI group, a wide spread of white-matter voxels had significant correlations. The mid-brain and posterior part of the brain, however, seemed to be spared. The total number (i.e., ∼5*104) of significant voxels in this map is reported in Figure 3A for the Vic-DKEFS4 pair. The scatter plot of each subject's DKEFS4 score and the averaged Vic over the significant voxels are shown in Figure 3B (bottom middle panel). In addition, anatomical distributions of significant voxels in this map are reported in Figure 3C (row DKEFS4). TBSS, tract-based spatial statistics.
Results of the within-group correlations for participants with mild TBI. (
Vic correlated with 6 of 10 neuropsychological measures including vigilance attention (VIGRT), memory recall measures (SD and LD), and measures of executive function (DKEFS 3–5; Fig. 5A). As Vic increased, performance decreased; that is, the number of words recalled on short and long delay (SD and LD) decreased, and increases were observed in the reaction time of vigilance tasks (VIGRT) and the time to complete in letter sequencing (DKEFS3), number letter switching (DKEFS4), and motor speed tasks (DKEFS5). Extent of the correlation ranged from approximately 2 to 5 × 10⁴ voxels for the positive correlations (warm colors in Fig. 5A) and slightly lower, 0.5 to 1 × 10⁴ voxels, for the negative correlations (cool colors in Fig. 5A). The second-most sensitive diffusion metric was P0, which correlated with the same neuropsychological outcomes, except DKEFS3, and showed the same trends (Fig. 5A). For all the six Vic-neuropsychological pairs with significant findings in TBSS, the collective correlation coefficients were between 0.83 and 0.87 (Fig. 5B). P0 had similar regression results (not shown here).
Anatomical distributions of white matter having significant correlations in Vic-neuropsychological pairs are summarized in the color-coded matrix shown in Figure 5C. The horizontal axis of the matrix denotes the JHU white matter label with the length of the interval reflecting its three-dimensional size in the atlas, and the color denotes the percentage of voxels in the labeled white mater tract with significant correlations. For the correlations with vigilance attention (VIGRT) and sustained memory (SD and LD), significant white matter involved three distinct white matter systems: interhemispheric fibers, longitudinal pyramidal tracts, and the limbic system. The interhemispheric fibers focused on the body of the corpus callosum; the involved pyramidal tracts included the external capsules, internal capsules, and their cortical projecting fibers; and the involved limbic system structures included the stria terminalis and uncinate fasciculus. Compared to attention and memory, the correlation between Vic and the executive functions (mainly DKEFS 3–5) was wider spread in white matter (Fig. 5C, bottom rows), except for the midbrain.
Relationship of diffusion metrics to cognitive function: Between-group interactions
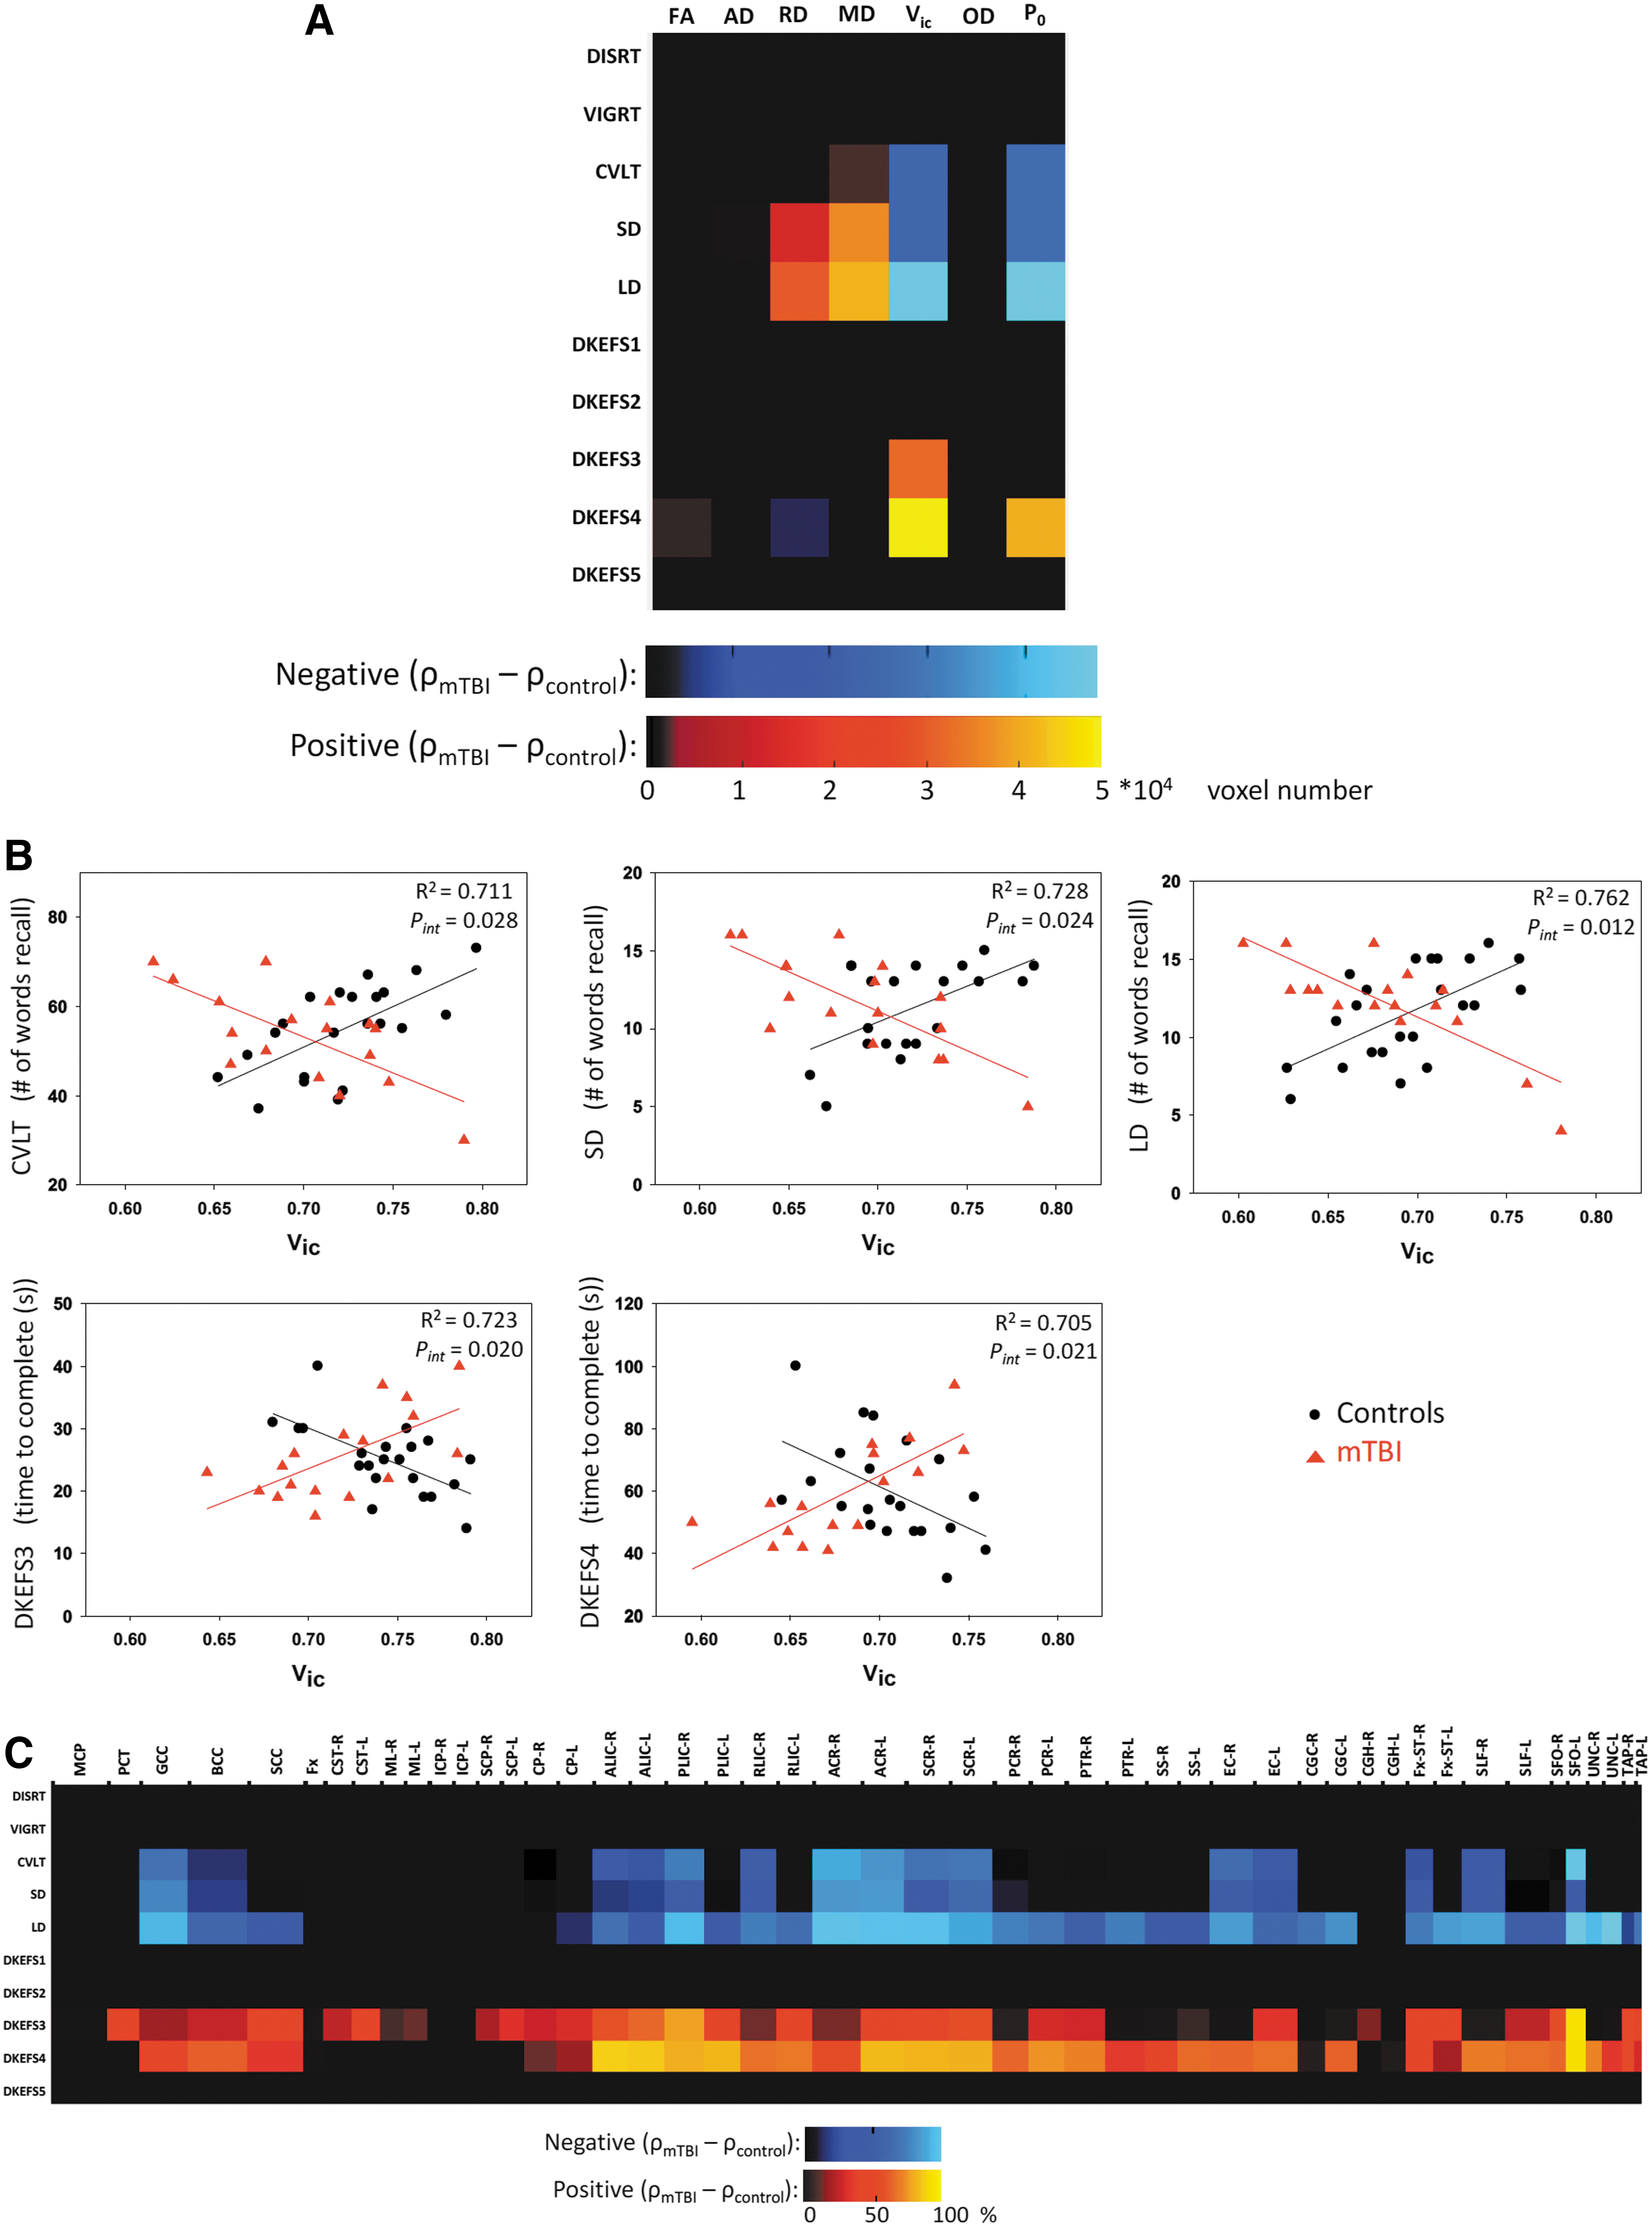
The interaction effect of mTBI on the correlations is summarized in Figure 6, where significant findings describe significant group differences in the correlations between the diffusion metrics and neuropsychological measures. Five Vic-neuropsychological pairs had significant between-group interactions in their correlations (Fig. 6A, fifth column). As shown in Figure 6B, for the memory tests (CVLT, SD, and LD), the direction of the correlations changed from a positive correlation in the trauma controls to a negative correlation in persons with mTBI. Similar results were observed for the executive function tests (DKEFS3 and 4), but the direction of change reversed. Goodness of fit for the interaction linear model ranged from 70% to 76% as indicated by the coefficient of determination (R2) with a significance of p interaction < 0.05 for the moderator term in the model. Anatomical distributions of significant between-group interactions for Vic are summarized in the color-coded matrix in Figure 6C. Similar to the within-group correlations, white matter tracts having significant interaction effects were found in the corpus callosum, internal capsule and corona radiata, and limbic system (stria terminalis and uncinate fasciculus).
Results of between-group interaction effects suggesting mild TBI as a moderator in the relationships between the diffusion metrics and neuropsychological outcome measures. (
Discussion
In this study, HYDI 53 was used to extract seven diffusion metrics computed from the DTI model, NODDI model, and the q-space imaging analysis. NODDI-derived Vic, a potential proxy for in vivo axonal density measurements, and the q-space tissue restriction (P0) index were consistently the most sensitive diffusion metrics for the between-group comparisons (only Vic), within-group correlations, and group interaction effects. Specifically, Vic was lower in the white matter of patients with mTBI. The decreased density of axons may be explained by previous observations of axonal beading followed by apoptosis in infant mice shortly after closed TBI. 16 Interestingly, the decrease of Vic shortly after mTBI was in contrast to a previous study of Vic on long-term effects (9–120 months after last concussion) of sports-related concussion, where increased Vic was found in 31 concussed athletes from seven varsity sport teams. 60 The differences suggest biomechanical forces and (injury-to-imaging) time may play an important role on the trajectory of brain recovery.
Within the mTBI group, Vic and P0 were associated with a majority of the neuropsychological outcome measures (Fig. 5A), but not the other trauma controls (Supplementary Fig. S1). (see online supplementary material at
Consistent with previous animal studies, 17,18 these results suggest that measures of axonal density are related to cognitive functioning. The relationship of axonal density to cognitive performance in mTBI patients (higher density associated with worse performance) was found to be opposite that observed in the other trauma control group, where higher axonal density was associated with better neuropsychological performance (Fig. 6B). A similar relationship was found with P0. P0 is the return to origin probability defined in the model-free q-space imaging theory 89 and is often interpreted as a measure of restricted diffusion and cellularity. 53,61,83 Under circumstances in which axons dominate the packing density, P0 may highly correlate with, and serve as, an indirect marker of axonal density. Similarly, we detected that individuals with lower tissue restriction in their white matter exhibited better cognitive performance post-mTBI. Potential underlying mechanisms for this finding may include a physical buffering effect inherent in the larger interstitial space attributed to lower axonal density or packing density. It is possible that larger interstitial spaces may cushion axons from biomechanical insults by absorbing and dissipating propagating energy. Alternatively, lower axonal density is likely to be associated with higher ratio of neurosupportive cells, such as astrocytes. Converging evidence suggests that astrocytes regulate and restrict inflammation, and help preserve brain function post-TBI. 90 These observations of potential shielding/protecting effects of lower axonal density from TBIs call for further research, such as a carefully designed prospective study with MRI scans at baseline and after TBIs.
Spatial organization of axons remained stable, albeit with a decrease in density, post-mTBI. Axonal orientation dispersion (i.e., OD) in the NODDI model did not differ significantly between groups or correlate with any neuropsychological measures. This finding is somewhat supported by FA of the DTI model, in which significances were weak or nonexistent across the three-stage statistical tests. Both OD and FA represent the structural organization of white matter. The differences lie in that the DTI model does not account for differences between intra- and extra-axonal diffusion, whereas OD is modeled directly for axons. 54 Nevertheless, previous studies using FA and cognitive functions reported similar negative TBSS or ROI results in 15 college athletes concussed within 30 (±2) days, 91 23 emergency room patients injured within 17 (±7.2) days, 92 and 61 level 1 trauma center patients injured within 47 (±6.5) days. 93 However, it is possible that these studies, including ours, were underpowered to detect a small effect size of FA in mTBI.
The aim of this study was to find common white matter regions that are susceptible to mTBI regardless of heterogeneity of the injury. Anatomical distribution of affected white matter focuses on major and long fiber tracts, including the corpus callosum, pyramidal tracts, and the anterior and superior corona radiata, consistent with other human TBI studies suggesting that these white matter regions are vulnerable to biomechanical injury. 21,39,94 To control for injury heterogeneity arising from impact directionality and magnitude of the forces, one may consider individualized analyses by testing the diffusion maps of the injured individual against a template established from a group of control subjects. As a preliminary study to investigate the sensitivity of advanced diffusion metrics, multiple comparisons were not performed across the seven diffusion metrics and 10 neuropsychological measures attributed to potential dependence within the diffusion metrics and neuropsychological measures. Alternatively, a principle component analysis may be performed to reduce the dimensionality of tested variables before multiple comparison adjustments.
The results of this study provide a snapshot of white matter alterations shortly after mTBI, but are limited to a cross-sectional study design with a finite sample size. The white matter alterations were interpreted as differences between the mTBI and control groups rather than between the baseline (i.e., before brain injury) and after brain injuries, which could be better characterized by a prospective study design. In addition, a longitudinal study design with multiple follow-up time points could better describe the dynamic changes in white matter microstructures during brain recovery in the acute, subacute, and chronic phases post-mTBI.
Similar to all diffusion models, the NODDI model has limitations. A frequently discussed point is that NODDI uses rigid-stick geometry to represent healthy axons with a Watson distribution to describe their orientations. 54 The rigid-stick model imposes strong constraints with fixed intra-axonal diffusivities and a tortuosity model for extra-axonal diffusion. 95 Alternative options may be to model the axons using white matter track integrity based on diffusion kurtosis imaging 96 with “flexible” sticks that yield estimates of intra-axonal diffusivities or to model the axons based on composite hindered and restricted model of diffusion 97 without linking intra- and extra-axonal diffusivities. In these cases, however, different sets of diffusion constraints or many more diffusion encoding directions are required. Another consideration is that the suggested initial condition in the NODDI fitting (i.e., the intra-axonal longitudinal diffusivity) 54 may not apply to pathological conditions; hence, it may over- or underestimate the underlying axonal density. 98 As suggested in a previous work, 98 one may perturb the initial conditions to optimize the results, which was not performed in this study because no differences in axial/longitudinal diffusivity in DTI were found between groups.
Despite the limitations, NODDI provides a clinically feasible approach with robust nonlinear data fitting to probe axonal density in vivo. NODDI findings have been correlated with a tau pathology model of Alzheimer's disease, 99 applied in in vivo human studies of normal aging, 55 classic galactosemia, 100 neonatal encephalopathy, 101 white matter development in the newborn, 102 and MS 103 and has yielded valuable and biologically specific microstructural information about neurological disorders of the human brain.
In summary, the NODDI-derived axonal density index and q-space measure for tissue restriction demonstrated superior sensitivity to white matter changes shortly after mTBI over classic DTI. Alterations of axonal density and tissue restriction correlated with cognitive function, and the direction of the correlations was moderated by mTBI. Further, long-range white matter tracts appeared to be more vulnerable.
Footnotes
Acknowledgments
The authors thank Mary L. Hynes and Marcia A. Davis for assistance with data collection. This study was supported by institutional grants from Indiana University-Purdue University Indianapolis ITDP to YCW and TWM, National Institutes of Health grant R21 NS075791 to YCW and TWM, R01 R01AG053993 to YCW, the NCAA-DoD Grand Alliance W81XWH-14-2-0151 to TWM, and a Project Development Team within the ICTSI NIH/NCRR Grant Number UL1TR001108.
Author Disclosure Statement
No competing financial interests exist.
References
Supplementary Material
Please find the following supplemental material available below.
For Open Access articles published under a Creative Commons License, all supplemental material carries the same license as the article it is associated with.
For non-Open Access articles published, all supplemental material carries a non-exclusive license, and permission requests for re-use of supplemental material or any part of supplemental material shall be sent directly to the copyright owner as specified in the copyright notice associated with the article.