
Abstract
We examined recovery from postconcussion syndrome (PCS) in a series of 285 patients diagnosed with concussion based on international sport concussion criteria who received a questionnaire regarding recovery. Of 141 respondents, those with postconcussion symptoms lasting less than 3 months, a positive computed tomography (CT) and/or magnetic resonance imaging (MRI), litigants, and known Test of Memory Malingering (TOMM)-positive cases were excluded, leaving 110 eligible respondents. We found that only 27% of our population eventually recovered and 67% of those who recovered did so within the first year. Notably, no eligible respondent recovered from PCS lasting 3 years or longer. Those who did not recover (n = 80) were more likely to be non-compliant with a do-not-return-to-play recommendation (p = 0.006) but did not differ from the recovered group (n = 30) in other demographic variables, including age and sex (p ≥ 0.05). Clustergram analysis revealed that symptoms tended to appear in a predictable order, such that symptoms later in the order were more likely to be present if those earlier in the order were already present. Cox proportional hazards model analysis showed that the more symptoms reported, the longer the time to recovery (p = 7.4 × 10⁻⁶), with each additional symptom reducing the recovery rate by approximately 20%. This is the first longitudinal PCS study to focus on PCS defined specifically as a minimum of 3 months of symptoms, negative CT and/or MRI, negative TOMM test, and no litigation. PCS may be permanent if recovery has not occurred by 3 years. Symptoms appear in a predictable order, and each additional PCS symptom reduces recovery rate by 20%. More long-term follow-up studies are needed to examine recovery from PCS.
Introduction
P
Methods
Participants and procedures
The same patient cohort reported by Tator and colleagues 11 was used for this longitudinal study. It consists of 285 patients with the diagnosis of PCS seen by C.H.T. (a neurosurgeon with a special interest in concussion and PCS) from January 1997 to June 2013 at the Toronto Western Hospital (TWH), a specialty hospital located in Toronto with a major focus on neurological disorders. Clinical and demographic data were collected retrospectively from medical charts and were recently reported. 11 This cohort was mailed a questionnaire and an informed consent form to be completed and returned via mail or by phone. Some longitudinal data collected from the retrospective study 11 were combined with the follow-up data collected from the present study. Patient age was recorded as the age at the time of the concussion that led to the clinic appointment. This study was approved by the University Health Network (UHN) Research Ethics Board. UHN comprises four major teaching and research hospitals, including TWH and the Canadian Concussion Center.
Inclusion and exclusion criteria
All participants diagnosed with PCS had at least one symptom (e.g., headache, irritability, difficulty concentrating) for more than 3 months in combination with a negative brain computed tomography (CT) or magnetic resonance imaging (MRI) scan. Specifically, patients with hemorrhage or contusion or other focal imaging abnormalities were excluded. Patients involved in litigation for their injuries were excluded (Fig. 1). The criteria for concussion were based on the 2012 Zurich guidelines, a consensus statement of the 4th International Conference on Concussion in Sport. 12 It is recognized that there are many definitions of PCS in the literature, as discussed in the article by Davis and colleagues. 11 The requirement that the PCS symptom or symptoms last at least 3 months was selected to capture a population with definite persistence of PCS.
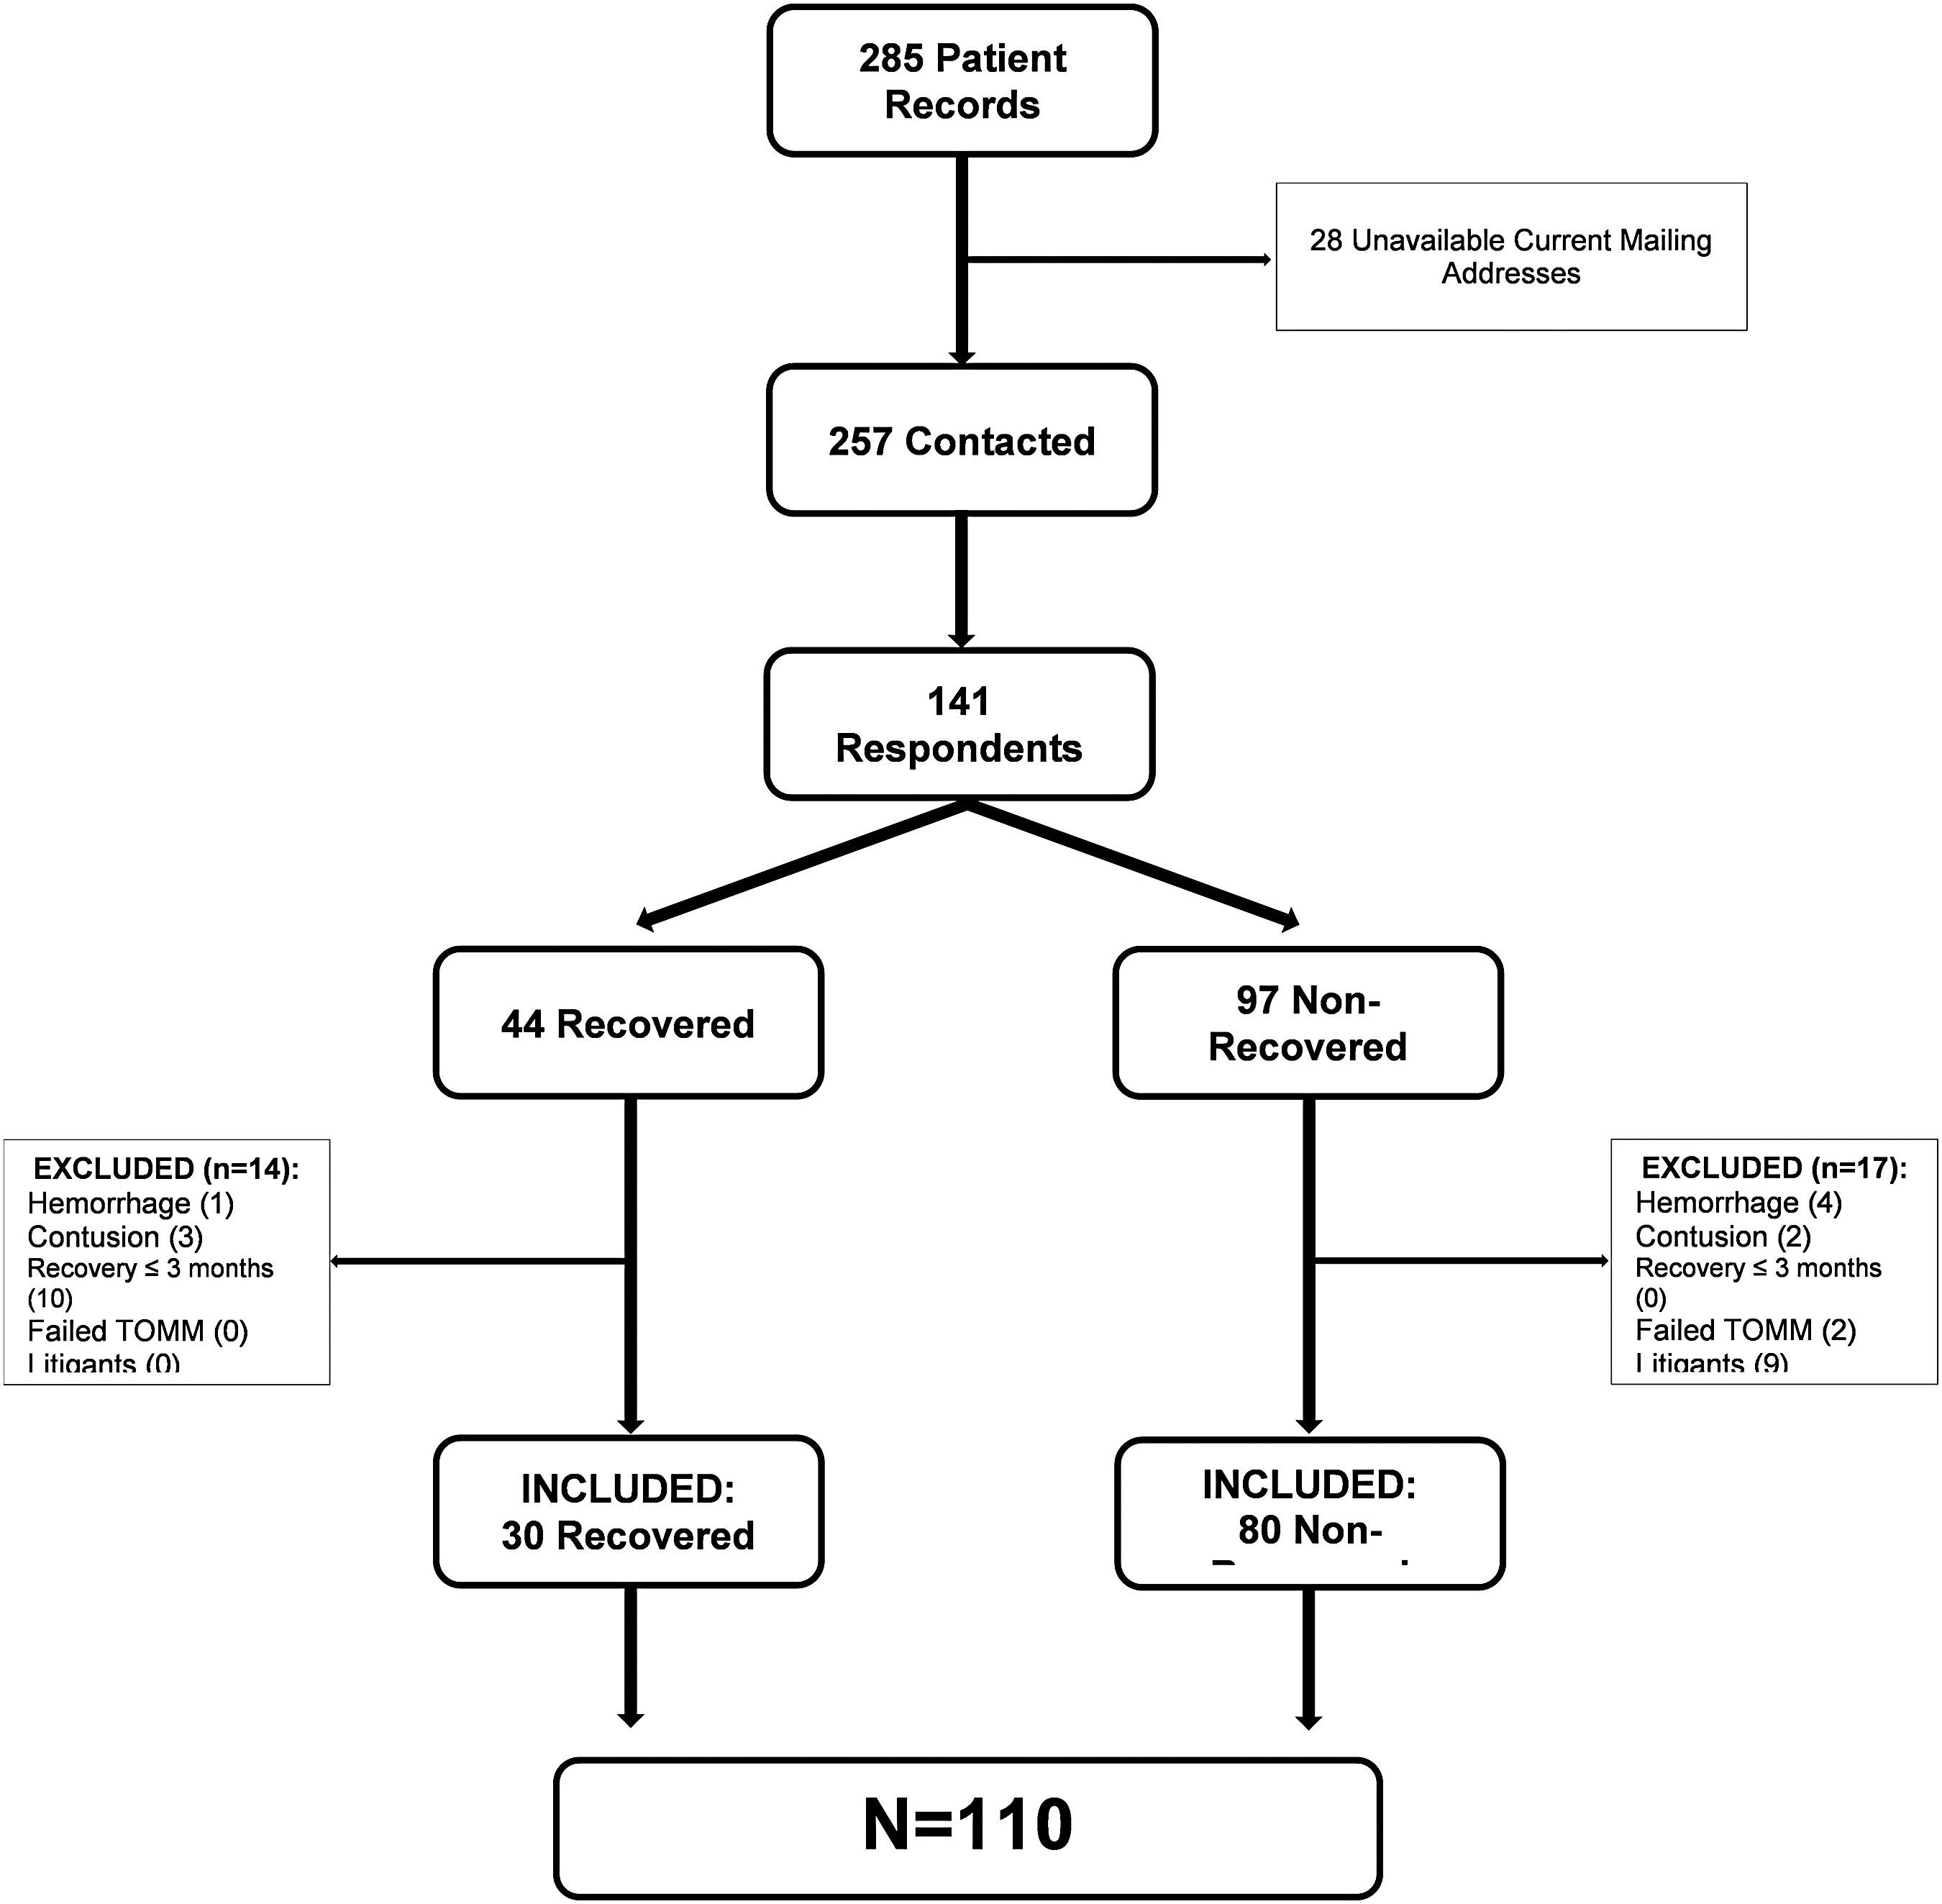
Flow chart for case selection. The criteria used for case selection of the cohort beginning with 285 cases, of which 120 were ultimately selected.
Measures included in the questionnaire (Appendix A)
Data collected by the questionnaire (Appendix A) included: 1) persisting symptoms; 2) time to recovery or duration of PCS; 3) treatments tried and their perceived efficacy, including occupational therapy, medication, chiropractic manipulation, psychotherapy, physiotherapy, and vestibular repositioning exercises; 4) comorbidities including migraines, attention deficit disorder (ADD)/attention deficit hyperactivity disorder (ADHD), learning disability, mononucleosis, depression, anxiety, and suicide attempts before and after the concussion; 5) compliance with a do-not-return-to-play recommendation from C.H.T.; 6) impact of the concussion on their life (a 5-point Likert scale from “Not at all” to “An extreme amount”); and 7) limitations on previous or current type or amount of schooling or work tolerated. If respondents found checkbox responses insufficient, they were asked to expand their answers in the “other” section.
Statistical analysis
All data are presented as mean ± standard deviation. Symptoms on the questionnaire were categorized into somatic, affective, and cognitive symptoms. The symptom list included in the questionnaire was based on the list used previously 11 and included 35 persisting symptoms (as shown in Fig. 2). Results of analyses were considered significant at p ≤ 0.05 and a statistical trend present when 0.05 < p ≤ 0.1. Analyses were performed using SPSS v. 17.0 (Chicago, IL), MATLAB Statistics, and Machine Learning Toolbox Release 2014b, The MathWorks, Inc. (Natick, MA).
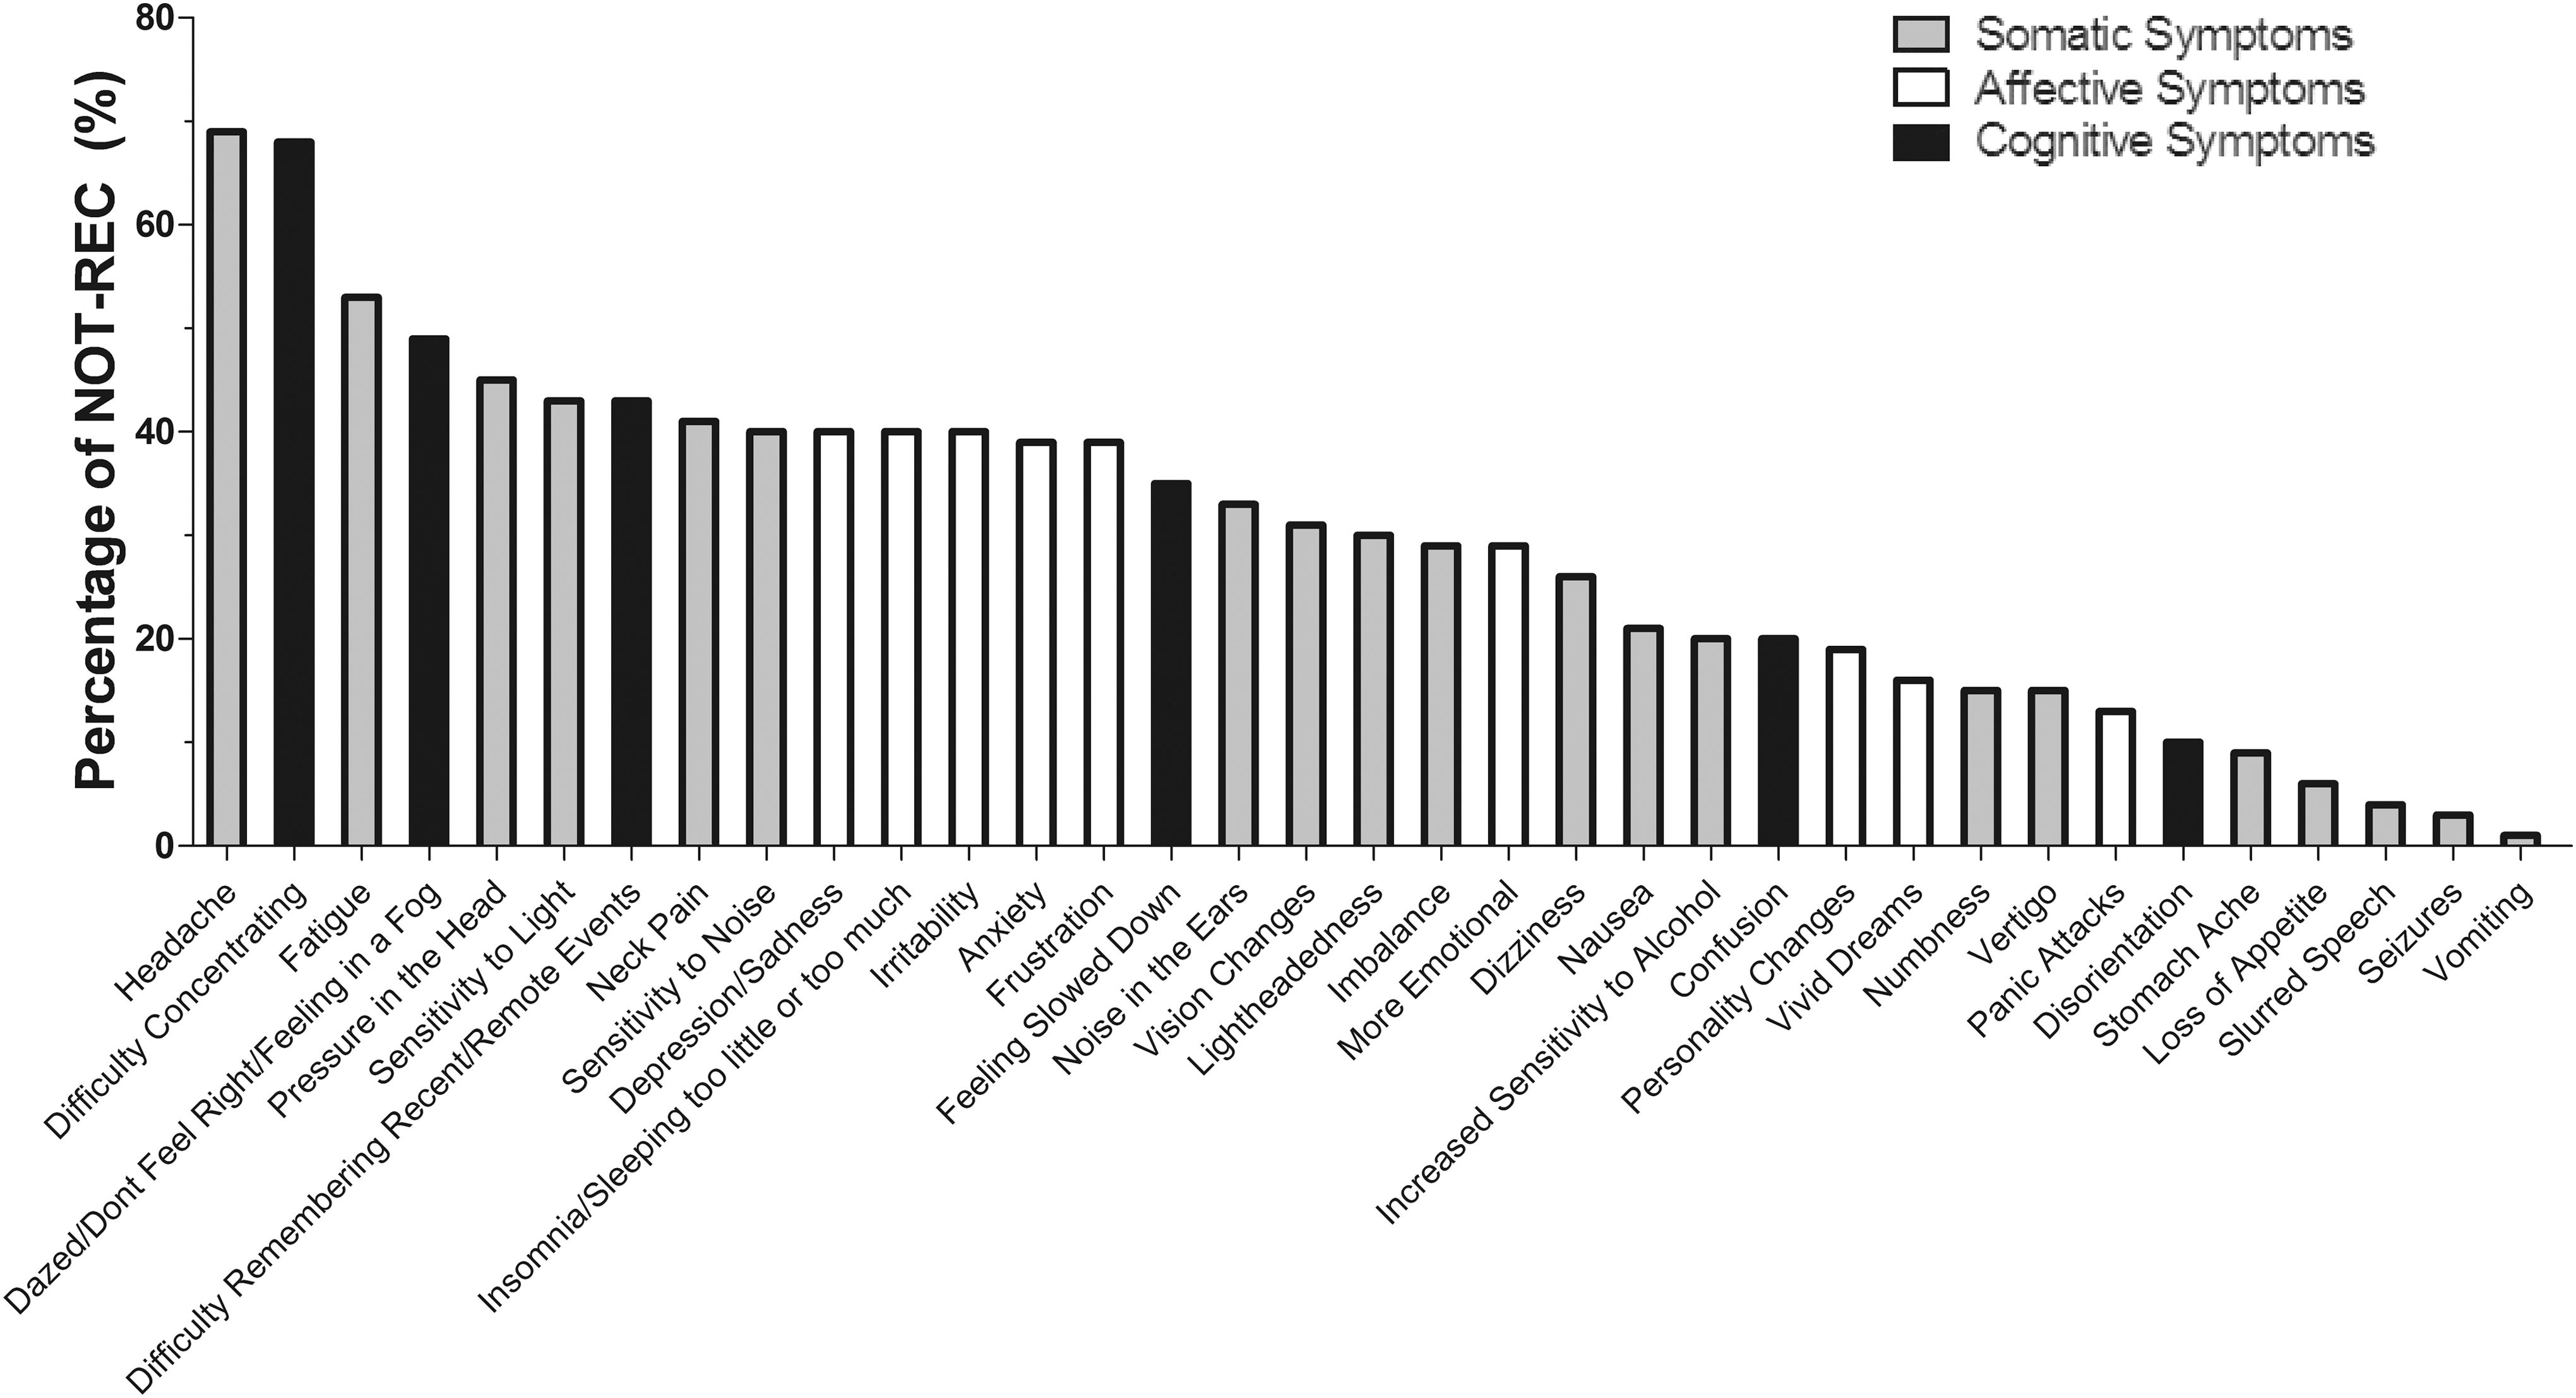
Persisting symptoms. The percentage of the not recovered group (NOT-REC; n = 80) suffering from continuing somatic, affective, and cognitive symptoms. Note that in those with persisting postconcussion syndrome, the persisting symptoms were quite evenly dispersed among somatic, affective and cognitive symptoms.
t-Tests were run on continuous variables and chi-squares on categorical variables to compare those who recovered from their index concussion (the concussion that led to the clinical appointment with C.H.T.) with those who did not. When more than 20% of the cells in the chi-square had an expected frequency less than 5, the likelihood ratio was used. Due to the exploratory nature of the present study, sets of statistical hypothesis tests performed in a group were subjected to a reduced threshold for statistical significance p in order to control the false discovery rate to a specified value q. By subjecting tests to a threshold reduced according to this procedure, the method promises that no more than a fraction q of results identified as significant will actually be insignificant (will be false positives). 13 For each group of tests to which this procedure was applied, two adjusted significance thresholds were employed. The first was calculated with q = 0.05, and p values below this threshold were considered significant. The second was computed with q = 0.10, and p values below this threshold were considered to be trending toward significance. The reader should note here that q is not the threshold, but rather the false discovery rate (FDR) used to compute the reduced threshold.
Variables for multi-variate analyses fell into three categories: 1) demographic; 2) symptoms reported at the index concussion, clinic appointment, and questionnaire; and 3) comorbidities and treatments. Vivid dreaming was excluded as a symptom because it was not reported at the time of the index concussion. The remaining symptoms were further subdivided into 20 somatic, eight affective, and six cognitive symptoms. One analysis explored associations among the variables, while a second examined associations between the variables and the time to recovery.
A principal component analysis 14 was performed with symptoms to identify their major patterns of covariation. Permutation testing was employed to assess the number of significant components. A clustergram analysis, 15 –19 was performed to visualize potential patterns of clustering between patients and symptoms. It consists of a heat map depicting both symptoms and patients together, and two hierarchical agglomerative clustering analyses producing dendrograms for symptoms and patients separately. The consensus across three different cluster evaluation methods 20 –22 was used to establish the number of significant clusters in each dendrogram.
A Cox proportional hazards model 23 was used to evaluate the association between time to recover from PCS and patients' demographics, pattern of symptoms, and comorbidities. Four separate Cox models were analyzed: 1) age and gender; 2) total somatic, affective, cognitive, and overall number of symptoms; 3) all symptoms as individual predictors; and 4) comorbidities and treatments together and individually.
Results
Participants
Figure 1 shows the reduction of the initial 285 patients to a cohort of 110 patients. Twenty-eight patients could not be contacted because of unavailable current addresses. Thus, 257 patients were sent questionnaires by mail and 141 responded, yielding a response rate of 54.86%, which is considered average and expected. 24 Based on medical chart reviews and information collected from the questionnaires, 31 respondents were excluded for the following reasons: positive CT or MRI scans (e.g., hemorrhages, contusions); recovery within 3 months; involvement in litigation; or failure on the Test of Memory Malingering (TOMM), which is a reliable test for screening malingerers. 25 Eighty-one percent of the 110 cases had a CT and/or MRI scan. After exclusions, there were 110 PCS patients, 30 in the recovered group (designated REC) and 80 in the not recovered group (designated NOT-REC).
Demographics
There was no significant difference between REC and NOT-REC with respect to sex, age, cause of injury (sports-related vs. non-sports-related), or presence or absence of one or more subsequent concussions after the index concussion (p ≥ 0.558, FDR q = 0.05; see Table 1 for a list of FDR-corrected chi-square test results). There also was no significant difference between REC and NOT-REC with respect to total number of prior concussions reported at the time of initial clinic appointment. There was no significant difference between those with single versus multiple concussions or those with whiplash between REC and NOT-REC. However, NOT-REC was significantly more likely to have ignored a do-not-return-to-play recommendation made at the clinic appointment (p = 0.006, FDR q = 0.05). There were no differences in the number of symptoms experienced at the time of clinic appointment between REC and NOT-REC (p = 0.28; Table 2).
Significant at p ≤ 0.05 under false discovery rate correction.
Trending toward significance at p ≤ 0.10 under false discovery rate correction.
ADD, attention deficit disorder; ADHD, attention deficit hyperactivity disorder.
Including index concussion
denotes p ≤ 0.05
Data are presented as mean ± standard deviation.
REC, recovered; NOT-REC, not recovered; F, female; M, male; N/A = not applicable.
Symptoms
Figure 2 shows that the three most common symptoms reported by the NOT-REC group were headaches (68.8%), difficulty concentrating (67.5%), and fatigue (52.5%), while the three least common were vomiting (1.3%), seizures (2.5%), and slurred speech (3.8%). Depression occurred alone in 40% of the NOT-REC group.
Effective treatments
Six common treatments were listed on the questionnaire, and respondents were asked if they had tried these treatments and to indicate whether they had been effective (Appendix B and Table 1). There was no significant difference between the REC and NOT-REC groups from chiropractic manipulation, occupational therapy, physiotherapy, and psychotherapy (p ≥ 0.149, FDR q = 0.05). However, the REC group showed a trend toward finding vestibular repositioning exercises effective, whereas the NOT-REC group showed a trend toward finding medication effective (n = 47; p = 0.029 and p = 0.024, FDR q = 0.1).
Respondents also listed a number of other treatments tried and the results. The following ratios indicate the number who found it effective over the number who tried the therapy: electrotherapy (1/1), exercise (1/1), homeopathy (1/1), manual lymphatic drainage (1/1), reiki (1/1), repetitive magnetic stimulation (1/1), vitamins (1/1), yoga (1/1), meditation/mindfulness (3/5), massage (5/12), cranial-sacral therapy (2/5), osteopathy (5/16), acupuncture (3/13), chiropractic neurology (0/1), myofascial release (0/1), naturopathy (0/1), and neuro-postural vision therapy (0/1).
Specific comorbidities before and after the index concussion
The presence of anxiety, ADD/ADHD, migraines, a learning disability, and thoughts/attempts of suicide before and after the index concussion were not significantly different between REC and NOT-REC (Table 1). A trend towards significance was found for the development of depression after concussion in the NOT-REC (p = 0.015, FDR q = 0.1), but no significant difference was found for the prior existence of depression (p = 0.305, FDR q = 0.05). Lastly, a trend was seen for mononucleosis preceding the index concussion in REC (p = 0.011, FDR q = 0.1), whereas the groups did not differ with respect to contracting mononucleosis after concussion.
Impact on life
At the time of completing the questionnaire, the REC group did not feel limited in school/work whereas the NOT-REC group felt limited (p < 10−4, FDR q = 0.05). The REC group felt that the index concussion had impacted their lives “a little” or “a moderate amount,” whereas the NOT-REC group felt the impact was “an extreme amount” (p = 0.001, FDR q = 0.05).
Time to recover and duration of PCS
Three REC patients failed to report the time required for recovery, and three NOT-REC patients failed to report the duration of PCS. The times to recover for the REC group (n = 27) and the duration of persisting PCS for NOT-REC group (n = 77) are shown in Figure 3. All subjects who had recovered by the time of the questionnaire did so within 3 years, with 67% recovering within 1 year, 20% between 1–2 years, and 3% between 2–3 years (the remaining 10% of cases were undetermined). The average time to recovery was 11.7 ± 7.7 months, and the average duration of PCS for those who had not recovered was 4.5 ± 4.0 years.
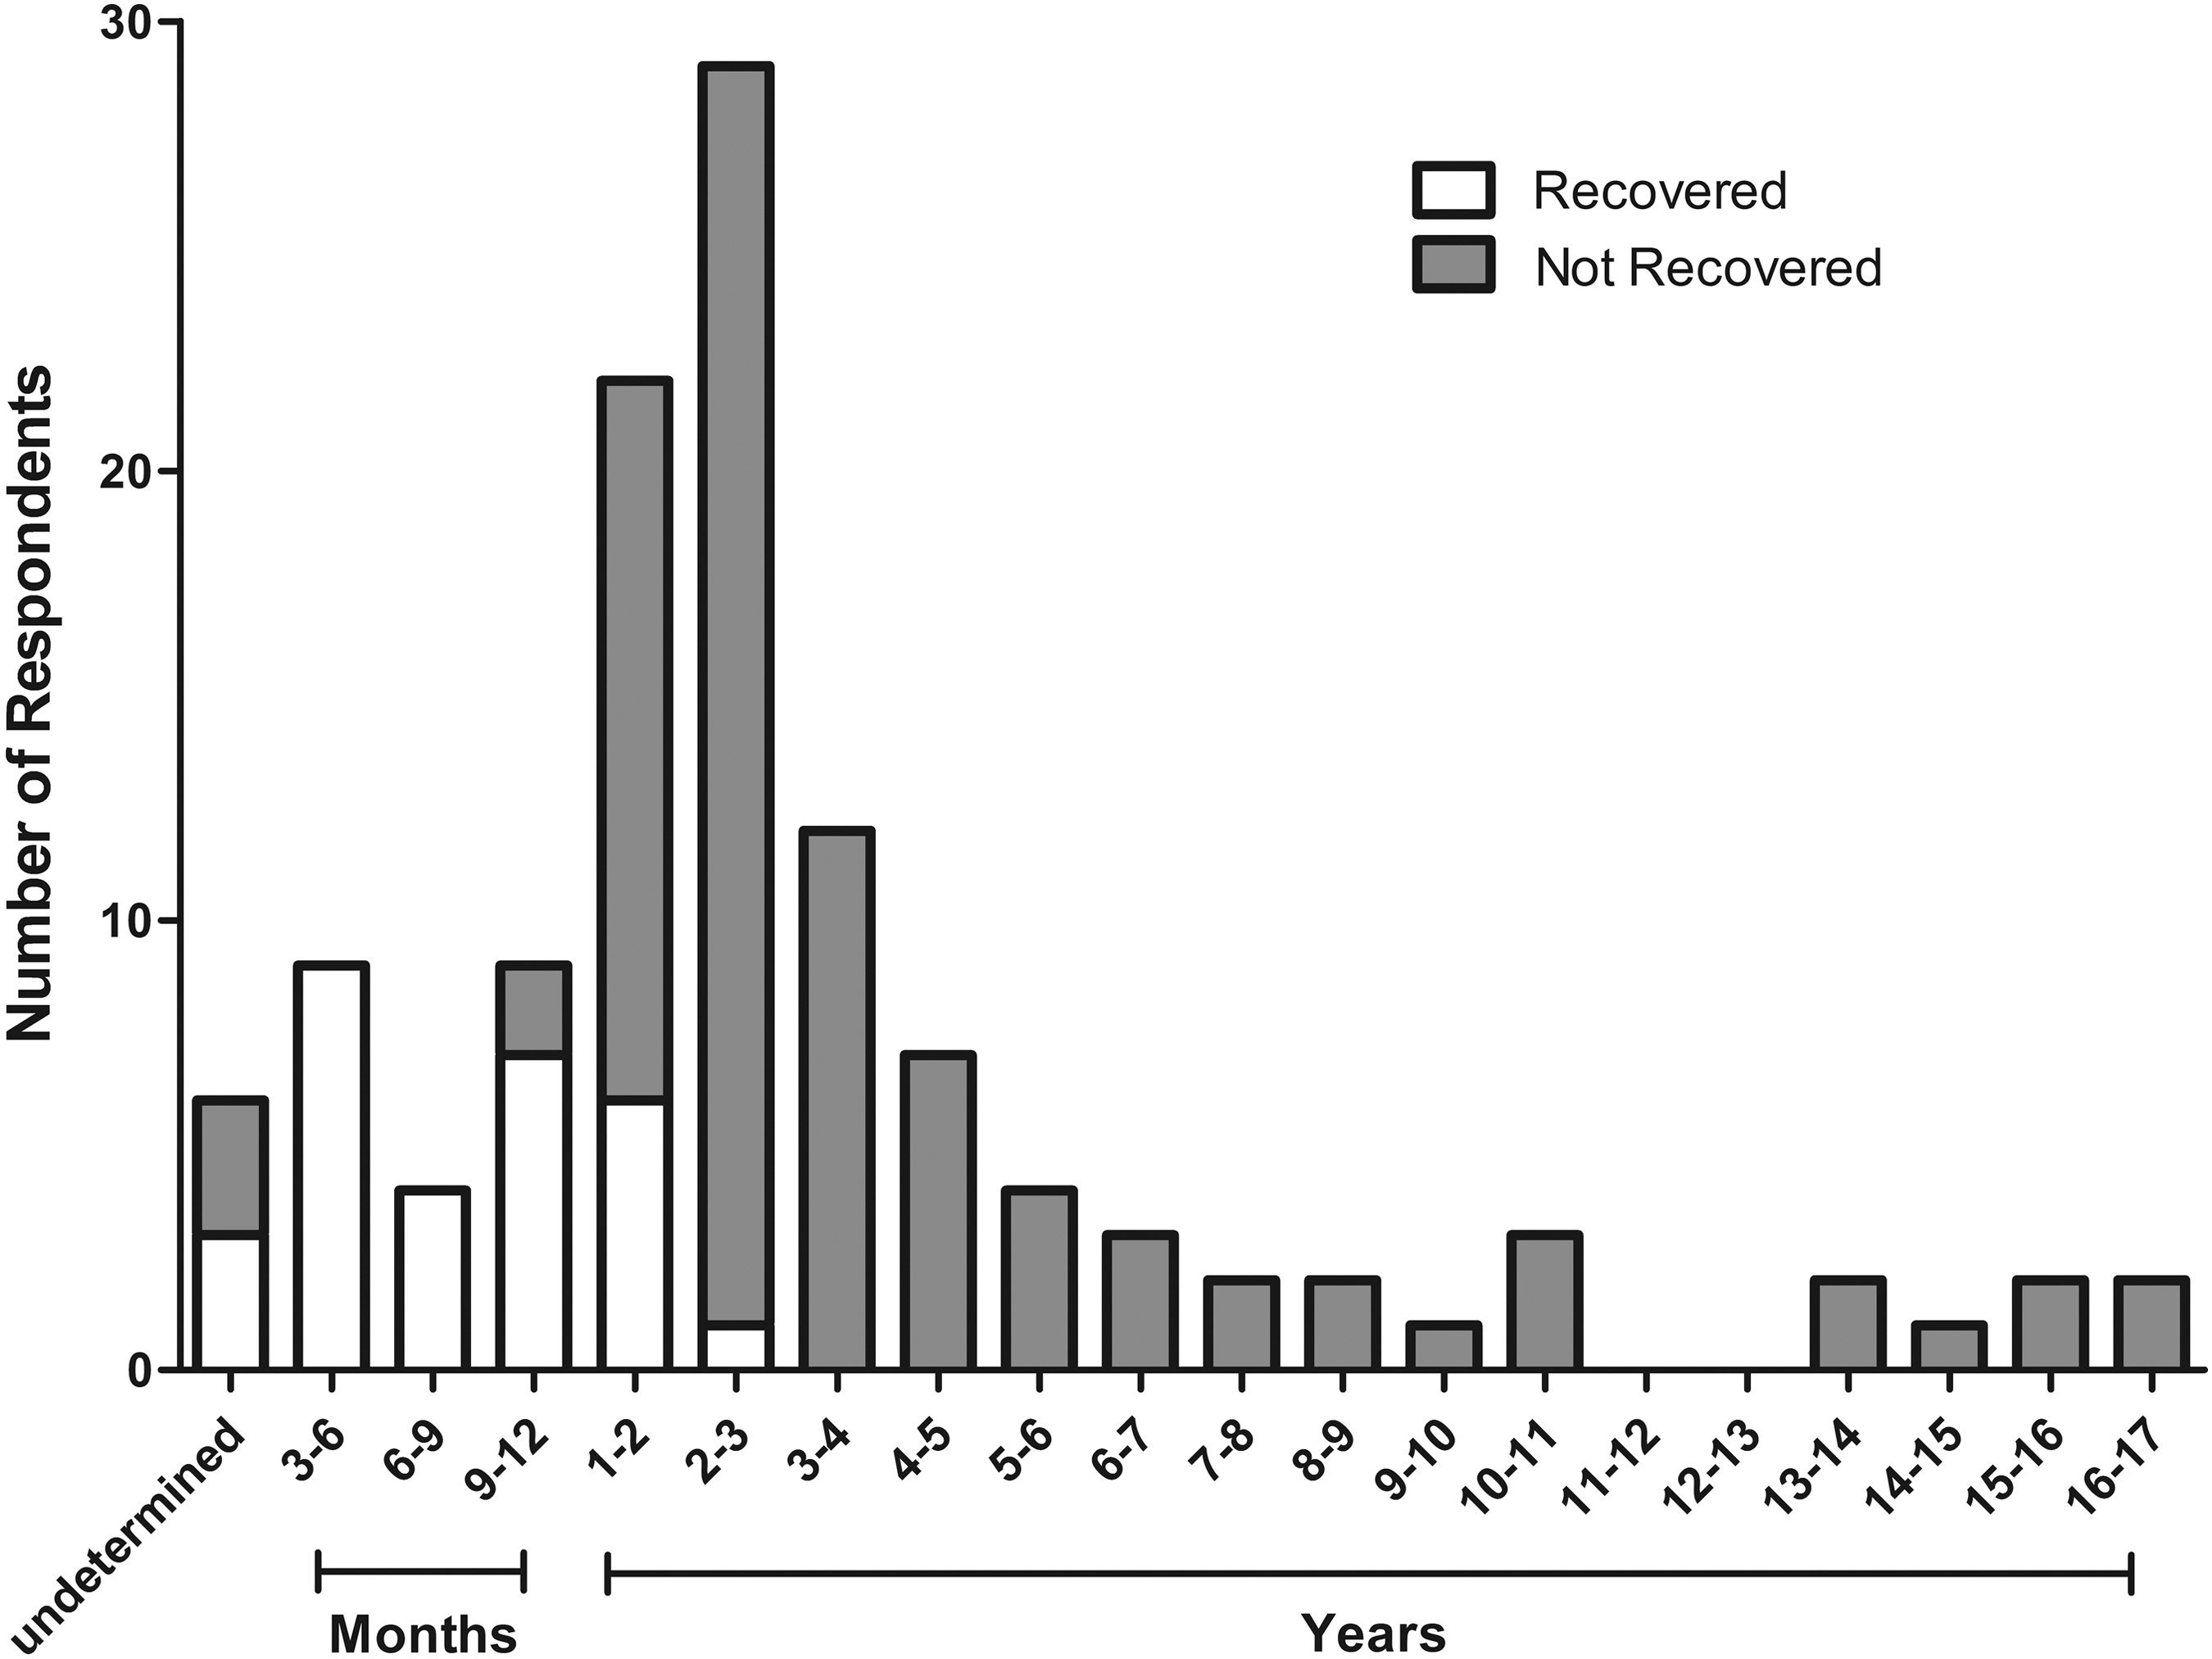
Time required to recover (n = 27) and duration of persisting postconcussion syndrome (PCS; n = 77): Note that no patient recovered after 3 years.
Principal component analysis
The principal component analysis of symptoms revealed one significant component explaining 23.9% of the variance, as shown in Appendix Figure C1 (p < 10−4, permutation test). Of the 34 symptoms, 33 were positively weighted in this component with coefficients of 0.15 ± 0.08. The loadings of each symptom on the first principal component are illustrated in Appendix Figure C2. Vomiting was the only negatively weighted symptom with a small weight of −0.02. This suggests that the symptoms are almost all positively correlated with each other, and that in no case did the presence of one group of symptoms negate the presence of another. An analysis of symptom loadings on the first two components following varimax rotation revealed no identifiable clustering and yielded no further insight into the covariance structure among the symptoms.
Heat map
The heat map (Fig. 4) revealed no patient/symptom clusters of the type often seen in genomic heat maps, 16 but rather showed a continuous gradation of patients with progressively more symptoms from left to right, and a similar gradation of symptoms reported with progressively greater frequency from top to bottom. The heat map algorithm orders patients and symptoms so that adjacent items are similar; two patients are similar to the extent they share the same symptoms, while two symptoms are similar to the extent patients tend to have both symptoms or neither.
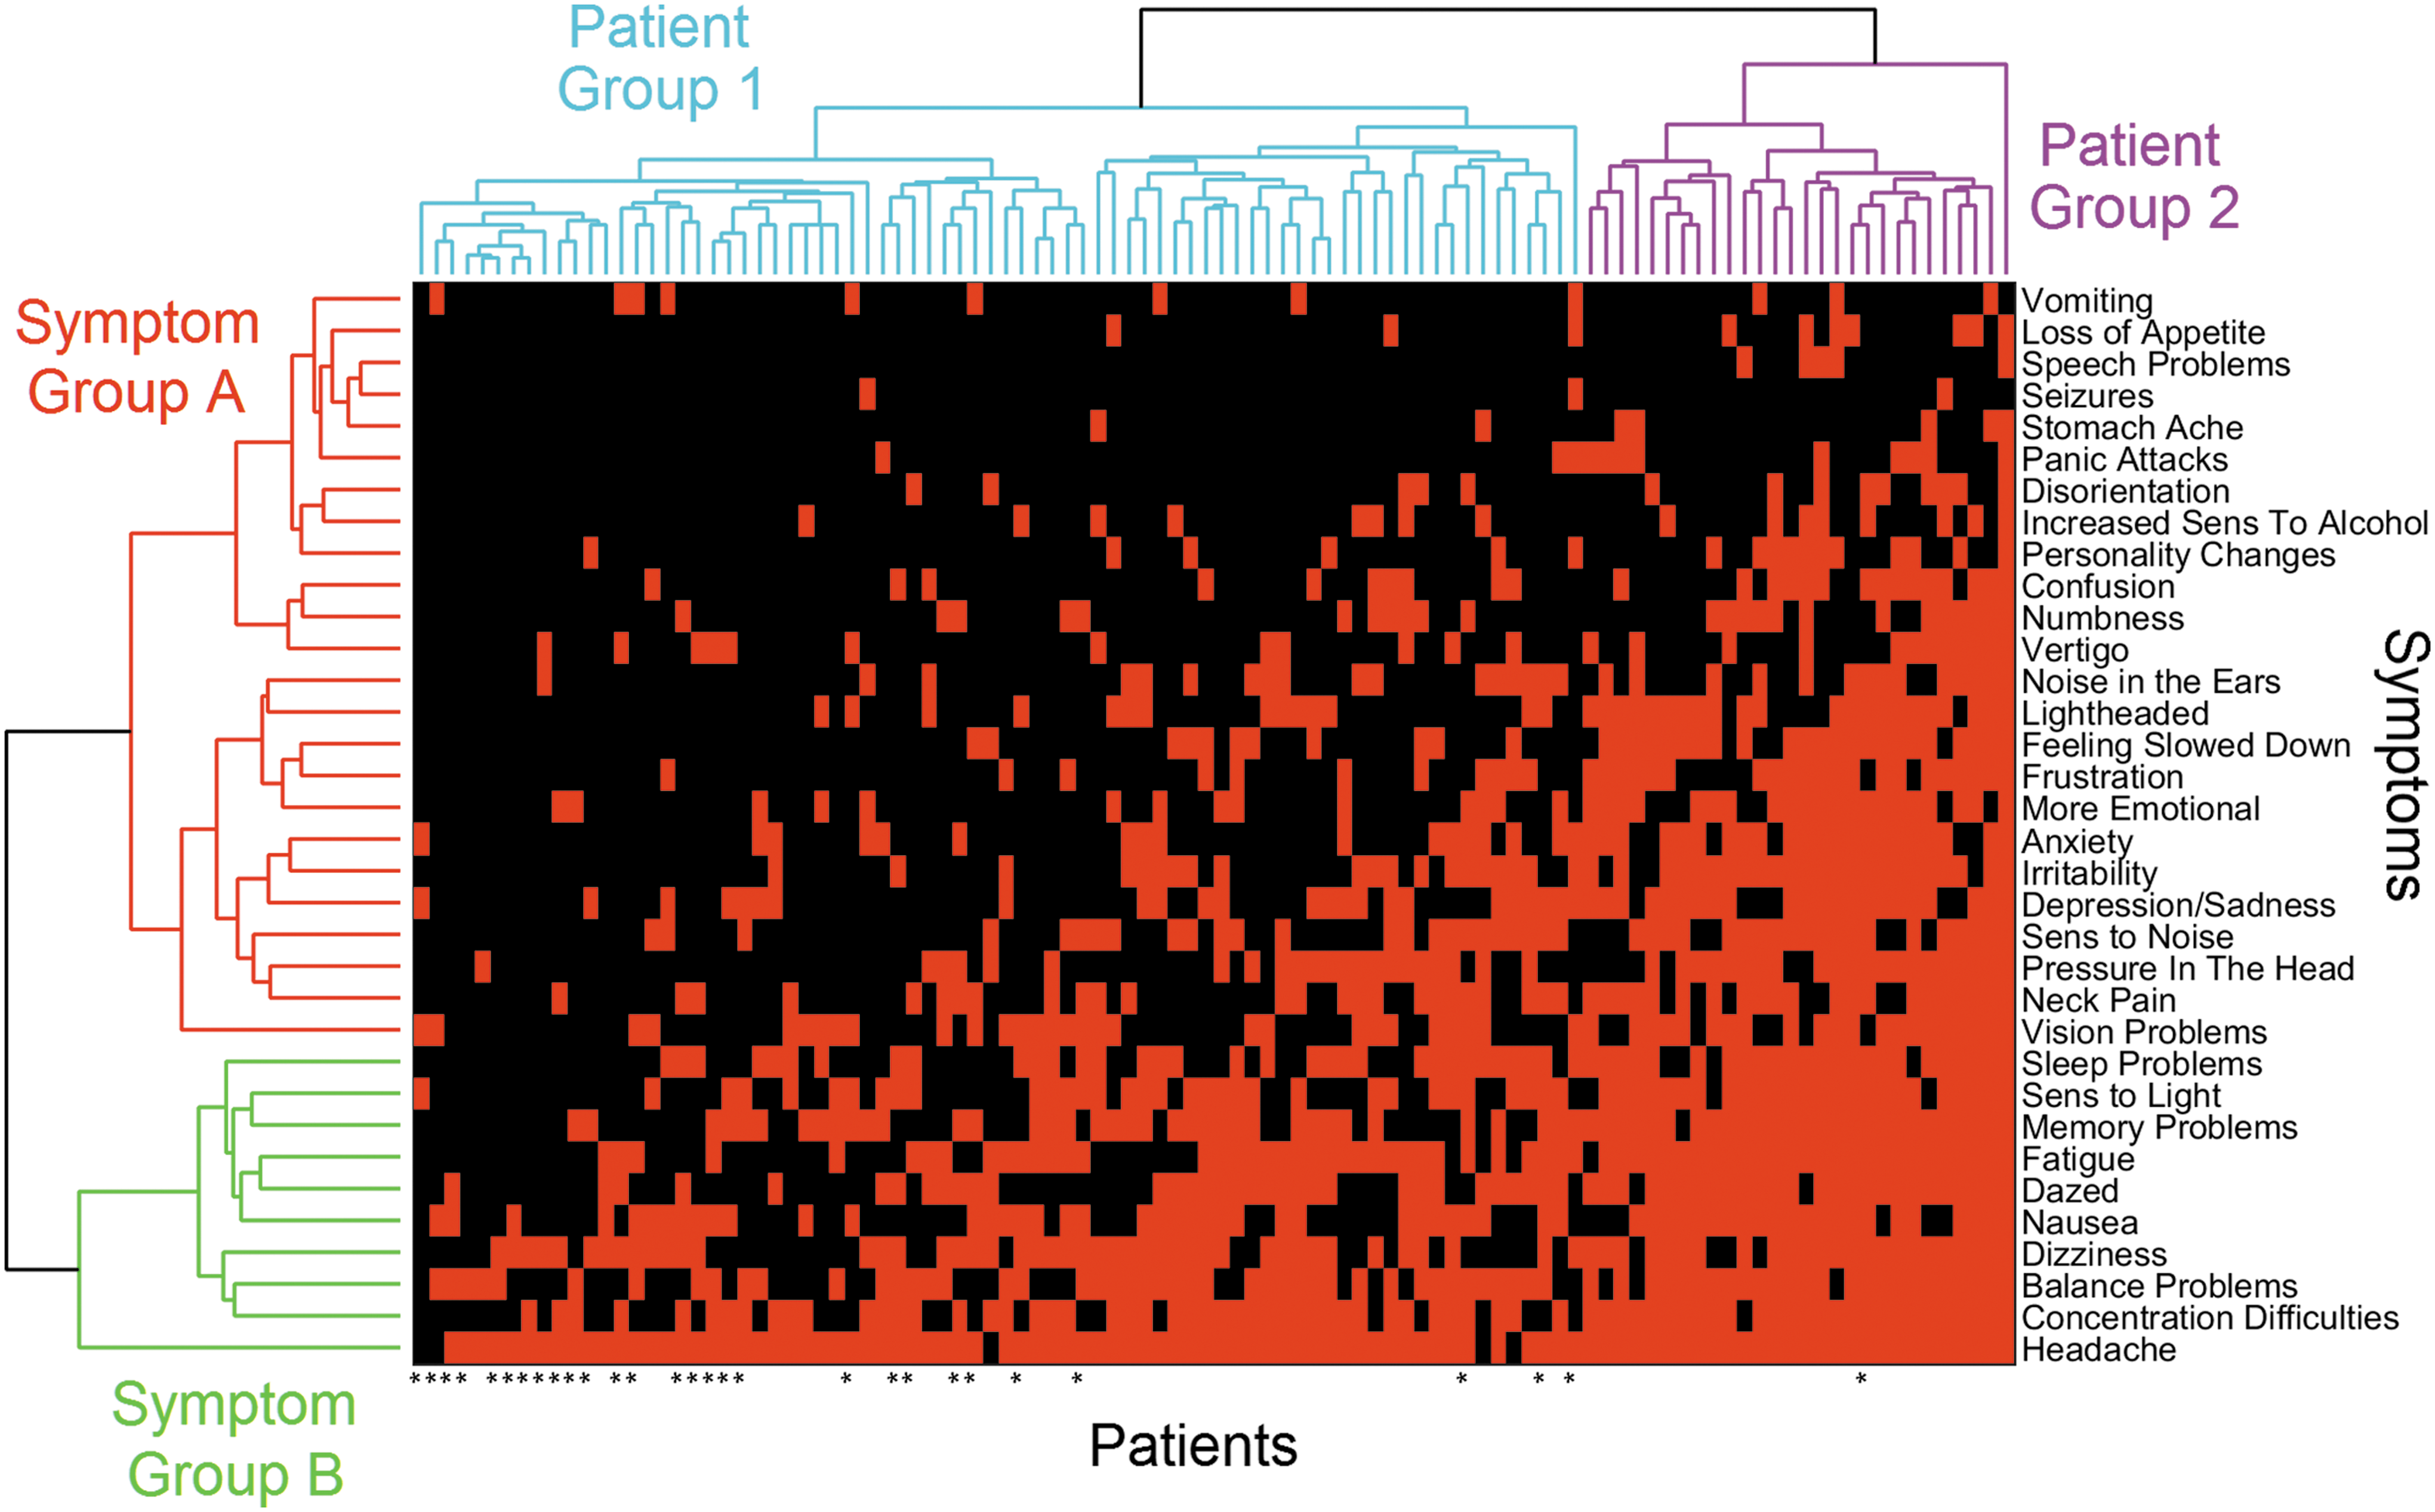
Clustergram of patients vs. symptoms. A heat map is shown in the central area, with each column representing a patient, and each row, a symptom. A red square in a particular row and column indicates the symptom for that row was present in the patient for that column; a black square represents the absence of the symptom. Dendrograms from agglomerative clustering analyses of both patients and symptoms appear at the top and left, respectively, where they have each been divided into two constituent groups. The 29 patients who had recovered are denoted by asterisks along the bottom edge. Symptoms in Group B were reported by significantly more patients than symptoms in Group A. Patients in Group 2 reported significantly more symptoms than patients in Group 1, and also were significantly more likely to have experienced post-injury depression and anxiety, to have tried medication and psychotherapy for treatment, and to have found these treatments effective. Color image is available online at
The ordering of symptoms reveals that a symptom occurring higher in the order (toward the vomiting end) is 2.2 times more likely to occur if a symptom occurring lower in the order (toward the headaches end) is also present than if the latter symptom is absent. This is significantly higher (p = 0.0001, permutation test) than would be expected from uncorrelated symptoms with the same frequencies, where the expected ratio is 1.27 ± 0.02. This means that two patients with the same number of symptoms tend to exhibit the same symptoms to a greater extent than can be expected on the basis of symptom frequencies alone. Similarly, as one traverses a group of patients with progressively more symptoms, the symptoms tend to appear in a predictable order. This is consistent with the positive correlation among nearly all symptoms found in the principal components analysis.
Vomiting does not appear to obey the same symptom-ordering property discussed above, in that the appearance of symptoms lower in the order do not make it more likely. As further evidence, it was the only symptom that showed a negative weighting (albeit of small magnitude) in the one significant principal component explaining the most variance among the symptoms.
Patient clustering
The consensus among the three cluster evaluation methods identified two distinct clusters: patient Groups 1 and 2 in Figure 4. The number of symptoms was strongly associated with patient group (p = 5.8 × 10⁻¹⁵), and in fact, all symptoms showed a significant positive association with membership in Patient Group 2 except for headaches (reported by almost all patients), seizures (reported once in one group and twice in the other), and vomiting (which, as noted earlier, does not appear to fit into the ordering displayed by the other symptoms). Patient Group 2 also was significantly associated with patients who reported a distinct behavioral phenotype: the experience of depression, anxiety, and learning disorders following their concussion; trying medication, psychotherapy, and vestibular repositioning as treatments; and finding medication and psychotherapy as effective treatments. There was no significant association between patient group with age or gender.
Symptom clustering
The cluster evaluation methods identified two distinct clusters among symptoms: symptom Groups A and B (Fig. 4). The symptom grouping was strongly associated with the number of patients reporting each symptom (p = 6.2 × 10⁻⁶). However, the symptom grouping was not significantly associated with the symptom categorization into somatic, affective, and cognitive symptoms. Based on Figure 4, the primary difference between the two symptom groups is that Group B appears to contain symptoms that are reported significantly more often than those in Group A. It also appears that if patients are going to report 10 or fewer symptoms, they are far more likely to be from symptom Group B than from symptom Group A.
Other associations
A large-scale test for associations between symptoms on the one hand and comorbidities and treatments on the other yielded only 33 significant associations following FDR correction out of a total of 34 × 36 = 1224 tests. Most of these followed obviously from their definitions. For example, patients who reported anxiety as a symptom also reported experiencing anxiety following their concussion as a comorbidity, trying medication and psychotherapy to treat their anxiety, and finding this treatment effective. A similar set of associations was exhibited for depression. A few significant exceptions to these expected patterns included significant positive associations between reporting symptoms of slurred speech and other speech problems, a greater number of prior concussions, and with the taking of anxiety and depression medications.
Associations with time to recovery
A further six respondents were excluded from this particular analysis due to the absence of one or more variables, leaving 29 who had recovered by the time they completed their questionnaire and 75 who were classified as censored for the purpose of this Cox analysis. Neither age nor gender were significantly associated with time to recovery. In contrast, the number of reported symptoms was highly associated with time to recovery (p = 7.4 × 10⁻⁶). The number of symptoms reported in each of the somatic, affective, and cognitive sub-groups were also highly significant with p < 10−4 for all three, but none reached the level of significance of the total number of symptoms. These three regressors are highly correlated (ρ > 0.5 for all pairs); therefore, including them together in a single model did not yield a stronger association with time to recovery. Following FDR correction, no individual symptom considered alone was significantly associated with time to recovery. Similarly, none of the comorbidities and treatments was statistically significant following FDR correction, although taking medication to treat depression came closest. Figure 5 illustrates the most robust of these results, showing the recovery curves for individuals reporting 1–2, 3–7, 8–12, 13–17, and more than 17 total symptoms. The proportion of the 104 patients best represented by each curve is shown in parentheses. The regression coefficient for the total number of reported symptoms in the Cox model was β = −0.206 ± 0.046, representing a reduction of roughly 20% in the recovery rate for each additional symptom. These results suggest that the number of symptoms reported by a patient may be the best predictor of the time to recovery, and that the nature of the symptoms making up this number are less important. However, the earlier finding that symptoms tend to appear in a predictable order may render this redundant, since patients reporting the same number of symptoms also tend to report the same symptoms.
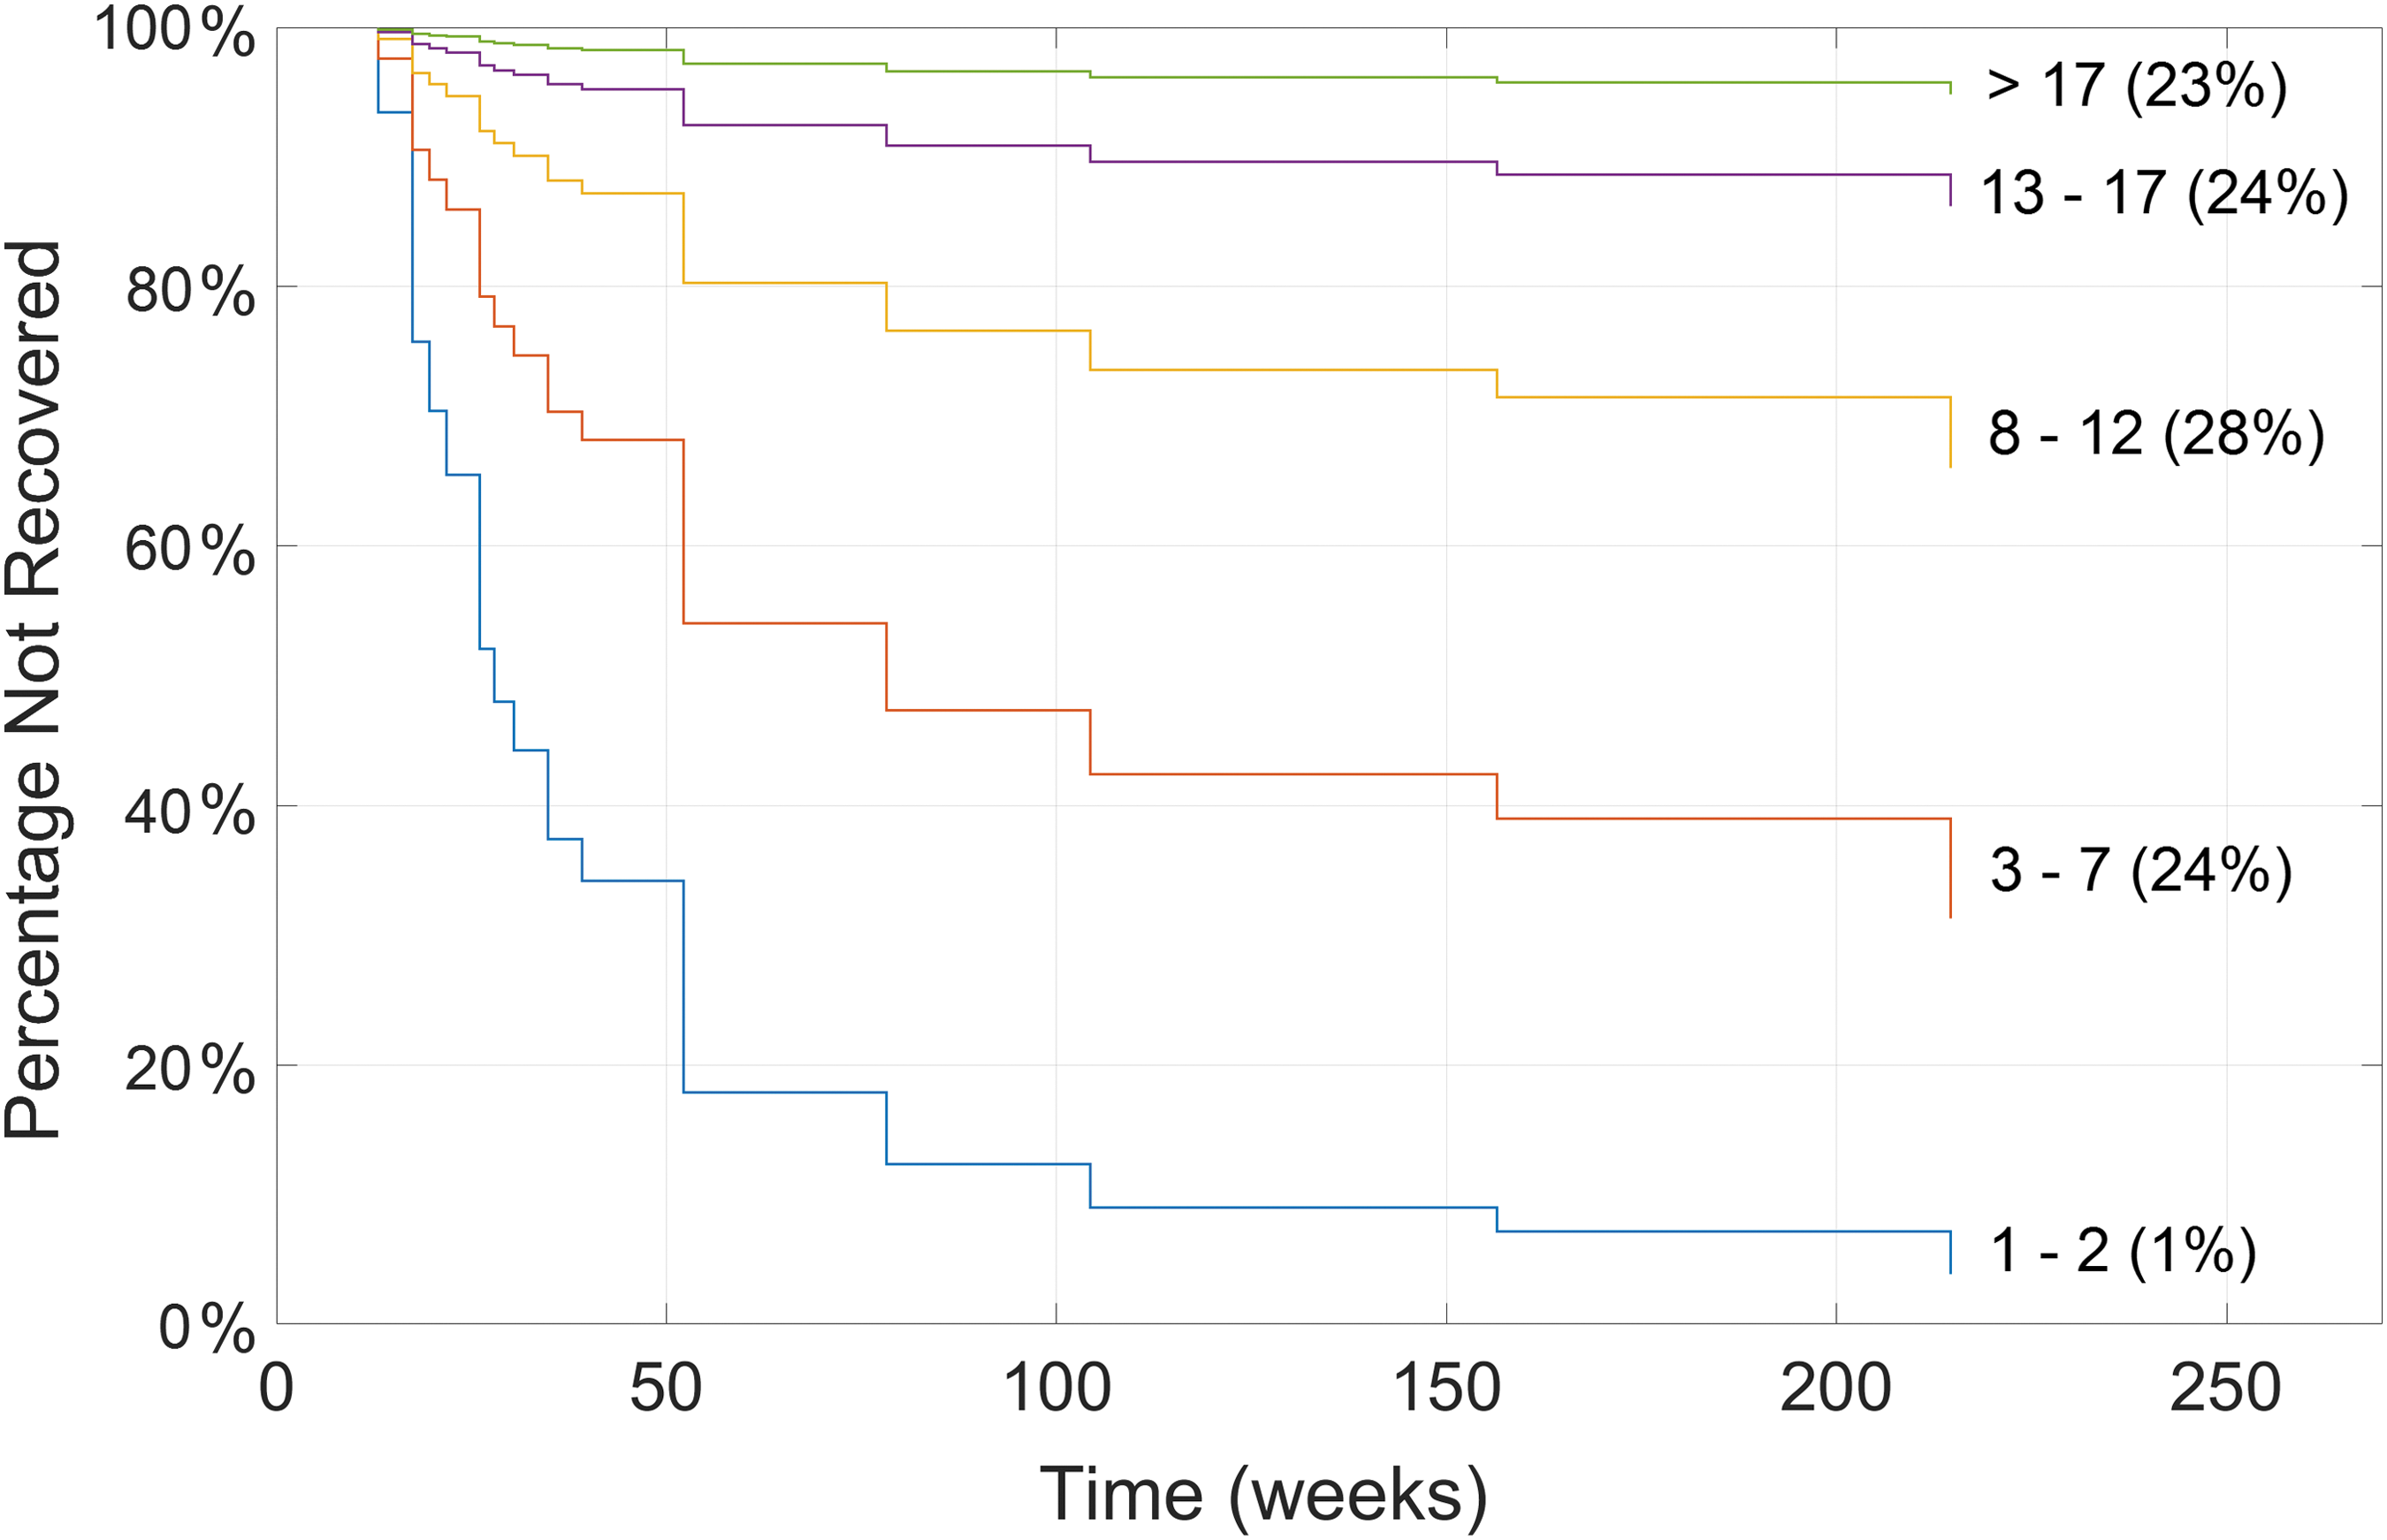
Recovery curves for patients reporting different numbers of symptoms from a Cox proportional hazards analysis. The number of symptoms associated with each curve is shown to the right of the figure at the end of each curve, with the percentage of patients in this range shown in parentheses. Color image is available online at
Litigants
None of those who recovered from PCS were involved in litigation. The nine litigants excluded from analyses because of ongoing litigation would have been in the NON-REC group. Concern about including litigants in PCS research studies has been expressed since litigation has been reported to prolong recovery and indicate an over-reporting of symptoms. 26,27 Thus, litigants were compared with non-litigants within the NOT-REC group. These groups did not significantly differ in total number of concussions sustained, number of cognitive symptoms, cause of injury, and duration of PCS (p ≥ 0.09 for all tests). However, litigants were more likely to be older, female, and self-report a greater number of somatic, affective, and overall symptoms (p ≤ 0.03 for all tests; Table 3).
Including index concussion
denotes p ≤ 0.05
Data are presented as mean ± standard deviation
NOT-REC, not recovered; F, female; M, male; PCS, postconcussion syndrome.
Discussion
This is the first longitudinal follow-up study of patients with PCS based on a diagnosis of concussion strictly in conformity with the international sport concussion criteria, and which specifically excluded patients with contusions and hemorrhages identified by imaging, known TOMM-positive cases, and litigants. More severe brain injuries often represent a significant proportion of patients in reports of PCS and can provide misleading information about concussion because of inclusion of symptoms of focal brain injury. 11 Also, this is the first longitudinal study of PCS to analyze symptom patterns using heat maps, and to predict time to recovery using a Cox model with symptoms as predictors.
There is incomplete knowledge of the demographic features, etiology, and recovery course of patients with PCS. Interestingly, we found no major demographic differences, such as age or sex, between recovered and non-recovered groups. In contrast, one systematic review of PCS found that being older and female were significant contributors to persisting PCS. 28 In the present study, only among litigants were female sex and older age significantly related to persisting PCS.
We performed two exploratory multivariate analyses of demographics, symptomology, comorbidities, and treatments in patients with persisting PCS. The first examined the associations among symptoms using principal component analysis, and between symptoms and patients based on clustergram analysis. These analyses revealed that 33 of the 34 symptoms were positively weighted in the one significant principal component, with vomiting the only exception, highlighting a general tendency for all symptoms to be positively correlated with each other. The clustergram analysis also showed a correlational structure and an ordering among the symptoms, with symptoms later in the ordering being twice as likely to appear if symptoms earlier in the ordering are present. This leads to a tendency for patients with the same number of symptoms to have the same symptoms, and for symptoms to appear in a predictable order as their numbers increase. The pathophysiology of these symptom relationships is unknown, such as whether there is a structural basis.
There is likely much more to be elucidated about these dependencies among symptoms, a possibility that has the potential to yield stronger prognostic models capable of better predicting negative outcomes in PCS. Multivariate regression models may be inadequate for this task, 29 but more sophisticated probabilistic graphical models 30 or causal inference methods 29,31 might provide greater insight.
The second analysis examined the association of demographics, symptoms, comorbidity, and treatment variables with patients' time to recovery. We do not refer to this as a prognostic model, since the independent variables were assessed at varying times ranging from the initial injury to the time of recovery, which differs from prior studies. 32 However, prognostic models of concussion outcome are important for risk stratification of patients at the early stages of injury; therefore, it is important to examine how our findings may stimulate the creation of such models. Consistent with the literature, we found that none of the individual variables examined showed a significant association with time to recovery. 32 –34
We found a strong association between the total number of symptoms reported and the time to recovery. Future studies may capitalize on this finding by querying the presence of the full set of symptoms during the first month post-injury, and fitting a Cox model to the outcomes recorded a month or more later. 32 The use of machine learning approaches may mitigate the need for large numbers of patients to match the large number of predictors, such as the recently described adaptive lasso version of the Cox regression model. 35
An important finding in our study was that no patient recovered who had PCS lasting 3 years or longer. Only 27% of our population eventually recovered and 67% of those who recovered did so within the first year. The finding that PCS may be permanent if it lasts longer than 3 years suggests that it may be critical to treat PCS appropriately in the early stages. To our knowledge, this is the first study to identify a definite duration of PCS beyond which recovery has not occurred in a large population of PCS patients.
The symptoms experienced by PCS sufferers in this study span a wide range. The most common symptoms were headaches, difficulty concentrating, and fatigue. However, symptom profiles for each individual may change over time and unfortunately, we were not able to perform the follow-up data collection at specified time-points after the index concussion. The most commonly reported symptoms in our study differ somewhat from other studies, 36,37 but it is difficult to compare studies because the duration of PCS differed among studies. The average follow-up with our questionnaire since the last clinic appointment was 4.4 years. This is one of the longest follow-up studies to date in PCS, and we intend to continue the follow-up of this patient population.
All respondents were seen by a single physician who specializes in concussion with persisting symptoms, and so a specified subset of PCS sufferers comprised this cohort. However, the data is consistent in terms of the definitions of concussion and PCS and the methods of collection. It is possible that respondents reported more symptoms on the questionnaire than if they had been asked to report directly to the physician. 38 Iverson and colleagues found that the same group of PCS patients tended to self-report more symptoms on a questionnaire than they reported directly to a physician, although participants in that study were receiving compensation from a workers' compensation system when tested. 38 Importantly, our study likely had a response bias as unrecovered PCS sufferers may have been more willing to participate in the follow-up questionnaire, whereas recovered PCS patients may have been less likely to take the time to respond.
More studies with long-term follow-up utilizing the specific definitions of concussion and PCS of the present study are needed, especially with respect to exclusion of focal injuries, such as contusions and hemorrhages. Such studies are required to predict recovery in persisting PCS and to inform potential treatment regimens.
Footnotes
Acknowledgments
The authors thank Dr. Adrian Crawley for his helpful comments on the statistical analyses and manuscript. This study was funded by grants from the Ontario Brain Institute and the Toronto General and Western Hospital Foundation, including grants from SmartCentres Limited and the Marion and Gerald Soloway Concussion Chair Fund.
Author Disclosure Statement
No competing financial interests exist.
Appendix A Postconcussion Questionnaire
Unless otherwise indicated, the following questions pertain to the