
Abstract
Concussion, or mild traumatic brain injury (mTBI), is a growing concern, especially among the pediatric population. By age 25, as many as 30% of the population are likely to have had a concussion. Many result in long-term disability, with some evolving to postconcussion syndrome. Treatments are being developed, but are difficult to assess given the lack of measures to quantitatively monitor concussion. There is no accepted quantitative imaging metric for monitoring concussion. We hypothesized that because cognitive function and fiber tracks are often impacted in concussion, interhemispheric brain communication may be impaired. We used functional near-infrared spectroscopy (fNIRS) to quantify functional coherence between the left and right motor cortex as a marker of interhemispheric communication. Studies were undertaken during the resting state and with a finger-tapping task to activate the motor cortex. Pediatric patients (ages 12–18) had symptoms for 31–473 days, compared to controls, who have not had reported a previous concussion. We detected differences between patients and controls in coherence between the contralateral motor cortices using measurements of total hemoglobin and oxy-hemoglobin with a p<0.01 (n=8, control; n=12 mTBI). Given the critical need for a quantitative biomarker for recovery after a concussion, we present these data to highlight the potential of fNIRS coupled with interhemispheric coherence analysis as a biomarker of concussion injury.
Introduction
M
mTBI and PCS symptoms may be the result of a disturbance in cerebral energy metabolism. 9 –12 Cell membrane perturbation resulting from head trauma can lead to a cascade of events, resulting in mitochondrial dysfunction, oxidative stress, free radical generation, and alterations in cerebral blood flow. 9,11 As a result, there is potential for a cerebral “energy crisis” owing to a mismatch between cerebral glucose requirement and energy demand. 13,14 Mitochondrial dysfunction impairs cellular repair mechanisms (leading to activation of both apoptotic and necrotic pathways) and results in free radical generation, which can lead to lipid peroxidation, cell membrane damage, and an increase in cell permeability. Although much of this evidence is for acute mTBI, there is also evidence for chronic metabolic changes in PCS. 11 These data show that the long-term sequalae of brain injury can impact brain metabolism.
Indeed, functional magnetic resonance imaging (fMRI) studies of mTBI patients using working memory and spatial memory tasks have demonstrated increased activity within multiple cortical networks, relative to control subjects, even though the performance on the task was similar to controls. 15 –17 This suggests that additional brain networks may need to be recruited in order to perform cognitive tasks after mTBI.
Given that there is a strong coupling between brain function, perfusion, and metabolism, functional activation studies may provide insight into ongoing pathology. An increase in brain activity is associated with an increase in microvascular hemoglobin (Hb) saturation as well as an increase in oxyhemoglobin (oxy-Hb) concentration and a decrease in deoxyhemoglobin (deoxy-Hb) concentration. 18,19 Using MRI, these changes in deoxy-Hb concentration can be localized using blood-oxygenation-level–dependent imaging, which forms the foundation of fMRI. 20 Functional near-infrared spectroscopy (fNIRS) can be used to calculate changes in deoxy-Hb, oxy-Hb, and total-Hb concentration at the cortical surface. 21 –24 fNIRS also has the added benefit of being a portable technology that can be easily sited in a clinic or at a sporting facility. Indeed, fNIRS has successfully demonstrated a decrease in oxy-Hb and deoxy-Hb concentration within the prefrontal cortex of mTBI patients during cognitive tasks, as compared to controls. 25
It has been demonstrated, using fMRI, that spontaneous fluctuations of brain activity are synchronous between brain regions that make up functional networks in the brain. 26 –28 The degree of synchrony (typically determined through a variant of temporal cross-correlation analysis, or coherence of temporal frequency signal components) has been termed functional connectivity and reflects the strength of inter-regional communication during subject rest. Functional connectivity was first used during subject rest and has subsequently been used during tasks. 29,30 We and others have shown that fNIRS can also be used to measure functional connectivity during the resting state and during tasks. 24,31
Functional connectivity can be applied to a variety of clinical populations, with the expectation that a reduction in connectivity is indicative of a disruption in brain region communication. 32,33 There is evidence to suggest that a reduction in connectivity may be present in mTBI patients. In the primary motor cortex (M1), there is a disruption in metabolism that may be the result of the high content of pyramidal cells, which are more susceptible to an energy crisis. 34 As noted above, this may occur in PCS, potentially altering connectivity between the left and right hemisphere. This may be exacerbated during the performance of tasks, when energy balance may be more severe. Reduction in interhemispheric connectivity could also occur if communicating fiber tracts are damaged or broken. Diffusion tensor imaging (DTI) studies have revealed reduced structural integrity of major white matter (WM) tracts after mTBI. 35 –38
Based on these studies, in the current study, we used fNIRS to investigate our primary hypothesis that interhemispheric connectivity of the motor cortices is reduced in youth with persistent symptoms after mTBI, as compared to controls.
Methods
Subjects
This study was approved by the research ethics board governing the institution. Participants were recruited from the Calgary Complex Concussion and Traumatic Brain Injury Program at the Alberta Children's Hospital (Calgary, Alberta, Canada). mTBI was defined as any direct or indirect biomechanical force resulting in a change in neurological state without the following: loss of consciousness for more than 20 min, focal neurological deficits, and/or post-traumatic amnesia for more than 24 h. 39 The terms mTBI and concussion are often used interchangeably, with the term concussion used more often in sports medicine or as a subset of mTBI. 40,41 As a result, for this article, mTBI and concussion were not differentiated. PCSs were recorded using the Rivermead Post-Concussion Symptoms Questionnaire. 42 Controls were healthy children with with no previous history of TBI. Exclusion criteria included use of neuroactive medication, regular use of alcohol or recreational drugs, and presence of skull fractures. All participants were right handed. Informed consent was obtained from all participants and legal guardians before participation.
Functional near-infrared spectroscopy system
A continuous-wave, diffuse optical system was used for data collection (CW5; TechEn, Inc., Milford, MA). 43 Near-infrared light for source optodes was supplied by diode lasers, and detector optodes were avalanche photodiodes. A head pad consisting of four source and eight detector optodes, 2.0 cm apart, was placed over the location of the motor cortex of each hemisphere (Fig. 1). Positioning was based on the standard 10–20 electroencephalogram (EEG) protocol at 40% of the measured distance from nasion to inion. 24,44,45 Each pad was held in place by a velcro strap placed in the coronal orientation and tightened for comfort. Pads were then connected to one another, and hair was moved out of the way for optimal contact of the optodes with the scalp.
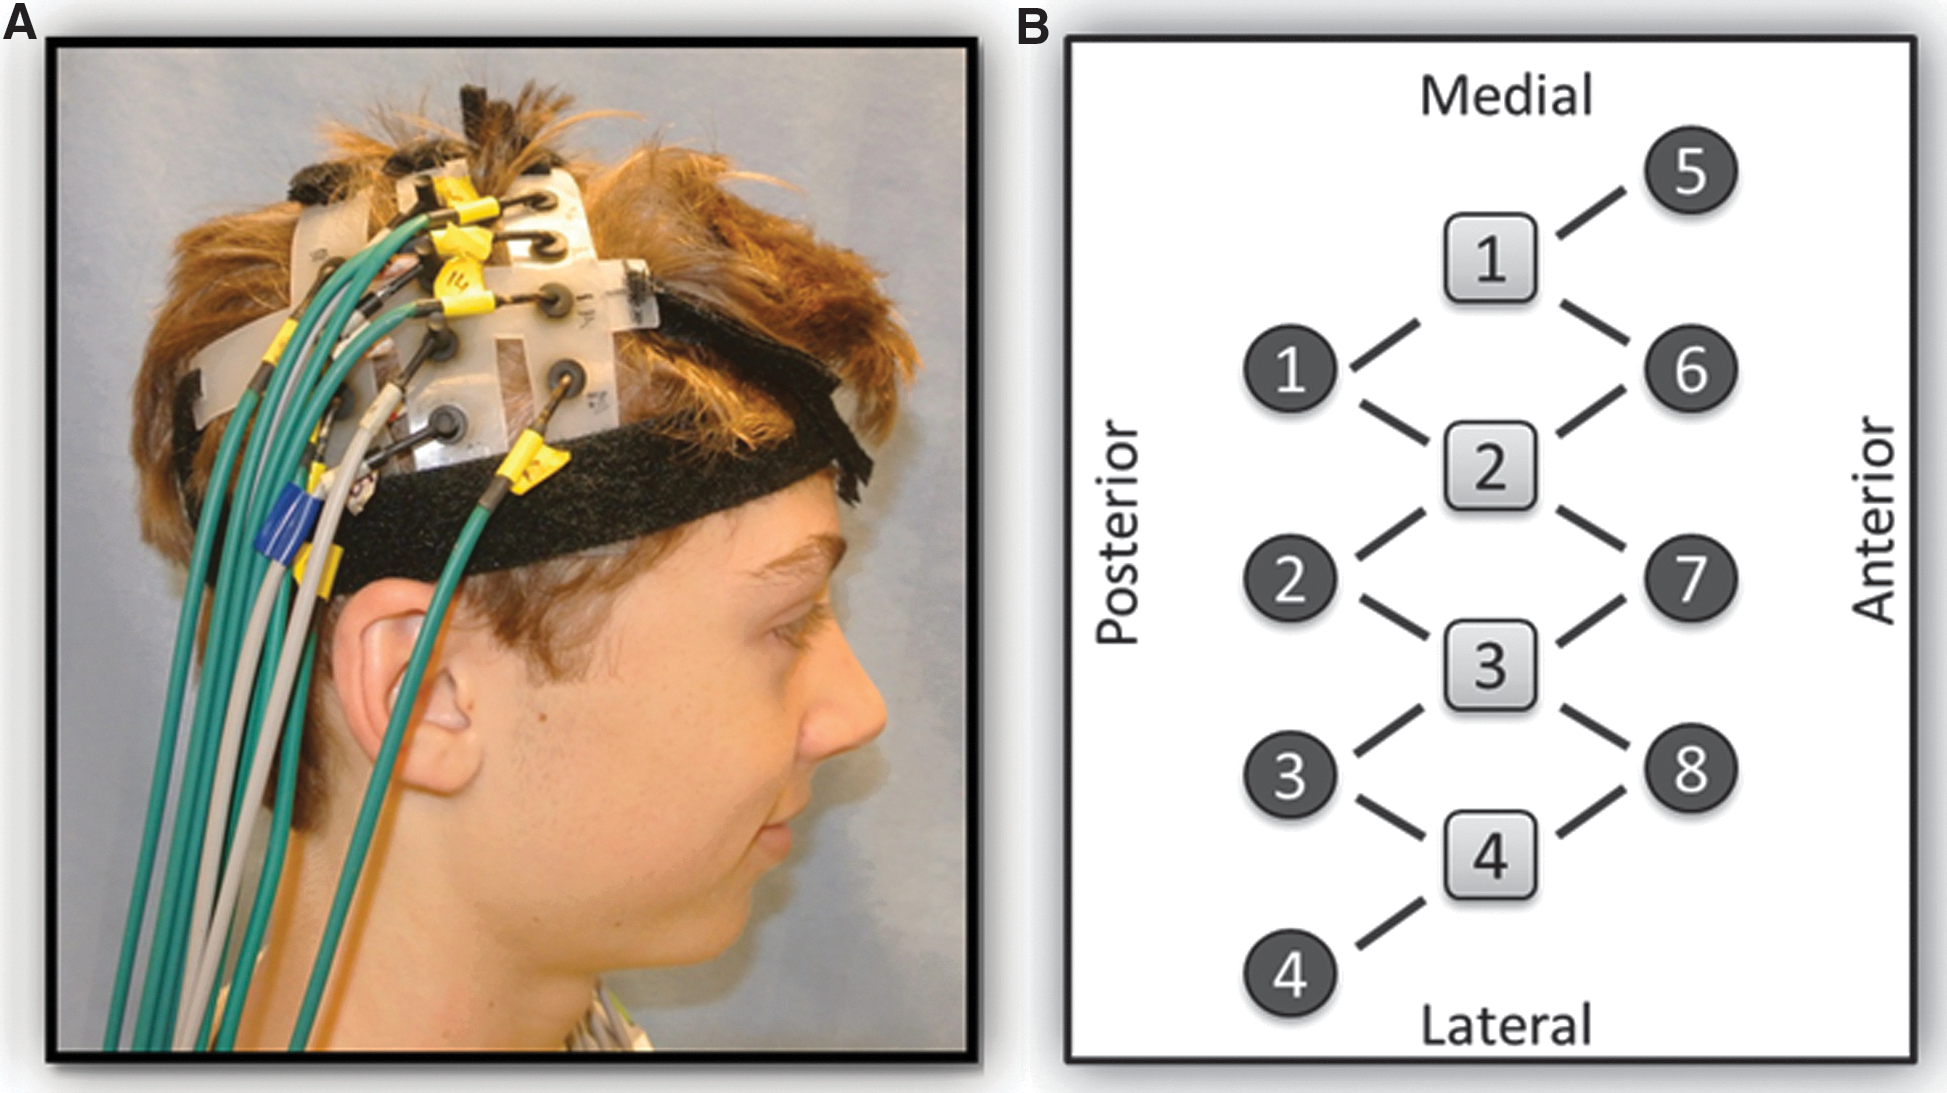
(
Study paradigm
To minimize background noise, room lights were dimmed and the room was kept quiet. The participant was positioned comfortably in a chair and was asked to limit movement. Data were then collected for 300 sec while the subject rested. The subject was then asked to perform a motor task, which consisted of tapping the index and middle finger of the right hand to the thumb at a rate of 1 Hz, as paced by an audio metronome. Task periods lasted 15 sec and alternated with 30 sec of rest. Total task time was 300 sec.
Calculation of hemoglobin concentration change during the motor task
All measurements were based on changes in chromophore concentrations corresponding to optimal absorbance for deoxy-Hb and oxy-Hb at wavelengths of 690 and 830 nm, respectively. Preprocessing of raw optical density (OD) by a CW Filter (TechEn designed program; TechEn, Inc., Milford, MA) down-sampled data from 200 to 100 Hz. These were down-sampled to 10 Hz using MATLAB (The MathWorks, Natick, MA). Identification of each source-detector pair was accomplished by Fourier transform of the received signal. 46 Next, a graphical user interface software package was used to process the filtered OD data (HoMER; TechEn, Inc.). A low-pass filter of 0.8 Hz was applied to the data, which were then converted to change in OD as a function of time for each source-detector pair. Changes in total Hb, deoxy-Hb, and oxy-Hb were calculated using a modified Beer-Lambert law. 43 In order to calculate concentration changes in each of the total Hb, deoxy-Hb, and oxy-Hb during the motor task, for each source-detector pair, data during the rest periods 5 sec preceding task commencement were averaged and subtracted from averaged data during the last 10 sec of the motor task periods. Using MATLAB (The Mathworks), a tomographical map of the average change in chromophore concentration (in micromolar units) during the motor task was generated. For each participant, the changes in concentration of total-Hb (Δ-total-Hb), deoxy-Hb (Δ-deoxy-Hb), and oxy-Hb (Δ-oxy-Hb) were averaged over the source-detector pair exhibiting the maximum change during finger tapping and the three nearest source-detector pairs.
Coherence analysis
In this study, we used coherence as the measure of connectivity. Coherence is an estimate of a linear-time variant relationship of two time-varying signals, at a particular frequency, on a scale of 0–1. A value of 1 indicates a complete linear relationship and 0 indicates no relationship. That is, coherence determines connectivity in terms of the common temporal frequencies between two signals. The calculation of coherence for fNIRS data has been described previously by our group. 24 The source-detector pair exhibiting the greatest change in total Hb and oxy-Hb during the tapping task was chosen as the reference, whose signal during the 300-sec rest period was compared with all other source-detector pairs by coherence analysis. Tomographical maps of coherence within the frequency range of 0.04–0.10 Hz were then computed using software written in MATLAB (The MathWorks). For each participant, coherence was averaged over the three source-detector pairs surrounding the reference region in the ipsilateral hemisphere (i.e., the reference source-detector pair was excluded, given that the coherence is equal to 1 at that location), as well as over the four anatomically homologous source-detector pairs in the contralateral hemisphere.
Coherence analysis was repeated for data collected during the finger-tapping task, to see whether coherence at resting-state frequencies (0.04–0.10 Hz) was modulated differentially between participant groups during the performance of the motor task.
Statistical analysis
Means, standard deviations, and ranges were used to describe the samples. Kolmogorov-Smirnov's test was used to test for normal distribution of the data. Between-group chromophore magnitude of change (Δ-total-Hb and Δ-oxy-Hb) during motor task performance was compared using the Student's t-test. Differences in mean coherence between hemispheres and participant groups were compared using analysis of variance (ANOVA). In order to allow for multiple comparisons, Tukey's post-hoc analysis was used to compare means through pair-wise comparisons. We examined the direction of change in coherence within each hemisphere with task activation using paired t-tests.
Results
Twelve mTBI participants (6 male; average age, 15.3±1.9 years) and 8 controls (5 males; average age, 14.0±2.2 years) were enrolled. Participants and controls were similar in age (t=−1.50; p=0.152) and sex (χ2=1, 0.30; p=0.58). Details of the mTBI cases are shown in Table 1. Average time postinjury was 158±131 days. The most common symptoms were: difficulty concentrating (82%); dizziness (82%); headache (64%); fatigue (64%); balance problems (64%); difficulty remembering (64%); feeling mentally foggy (55%); slowed down (55%); and irritable (55%).
Subjects did not complete PCS-I. PCS-I includes the additive scores of each patient, including a Likert scale between 0 and 4 for each of the 18 symptoms.
F, female; M, male; mTBI, mild traumatic brain injury; MVA, motor vehicle accident; PCS-I, Post-Concussion Symptom Inventory.
Figure 2 shows examples of topographic maps of the increase in total Hb concentration during task performance. The magnitude of the increase in total Hb concentration was similar between the patient and control subject. Group statistical analysis confirmed that the change in total Hb concentration during the motor task was not significantly different (p=0.42) between mTBI (18.5±6.4 μM) and controls (12.7±2.8 μM). There was also no difference in the change in oxy-Hb concentration (p=0.51; 12.3±3.4 μM for mTBI and 15.9±4.3 μM for controls).
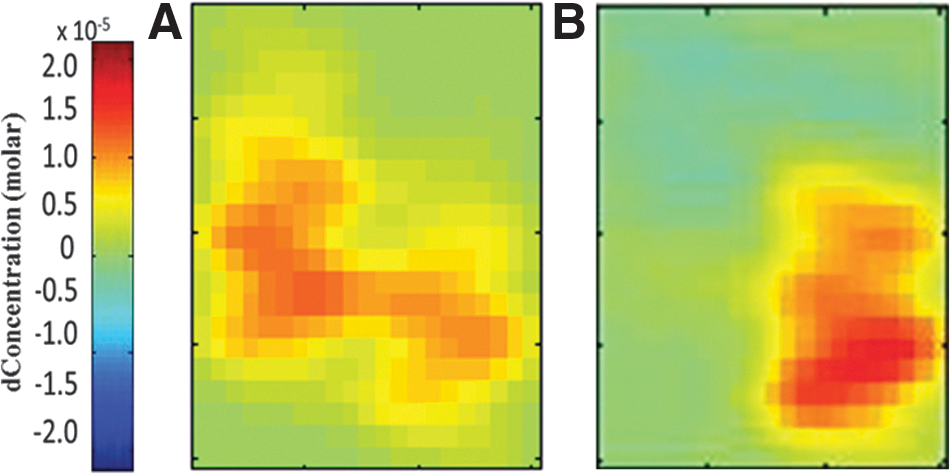
Tomographic maps of total hemoglobin signal change in the contralateral motor cortex during the unilateral motor task for (
Examples of coherence maps during rest and task performance are shown in Figure 3. Table 2 and Figure 4 show the calculated coherence values. Table 1 highlights changes within each group caused by task activation. Figure 4 highlights the comparison between controls and mTBI patients. To provide an example of data variability, the coefficient of variation of the total Hb coherence measurement for the right hemisphere of controls during the resting state was 33%. This was similar to the value obtained in a previous study in an adult control population using the same data collection paradigm. 47
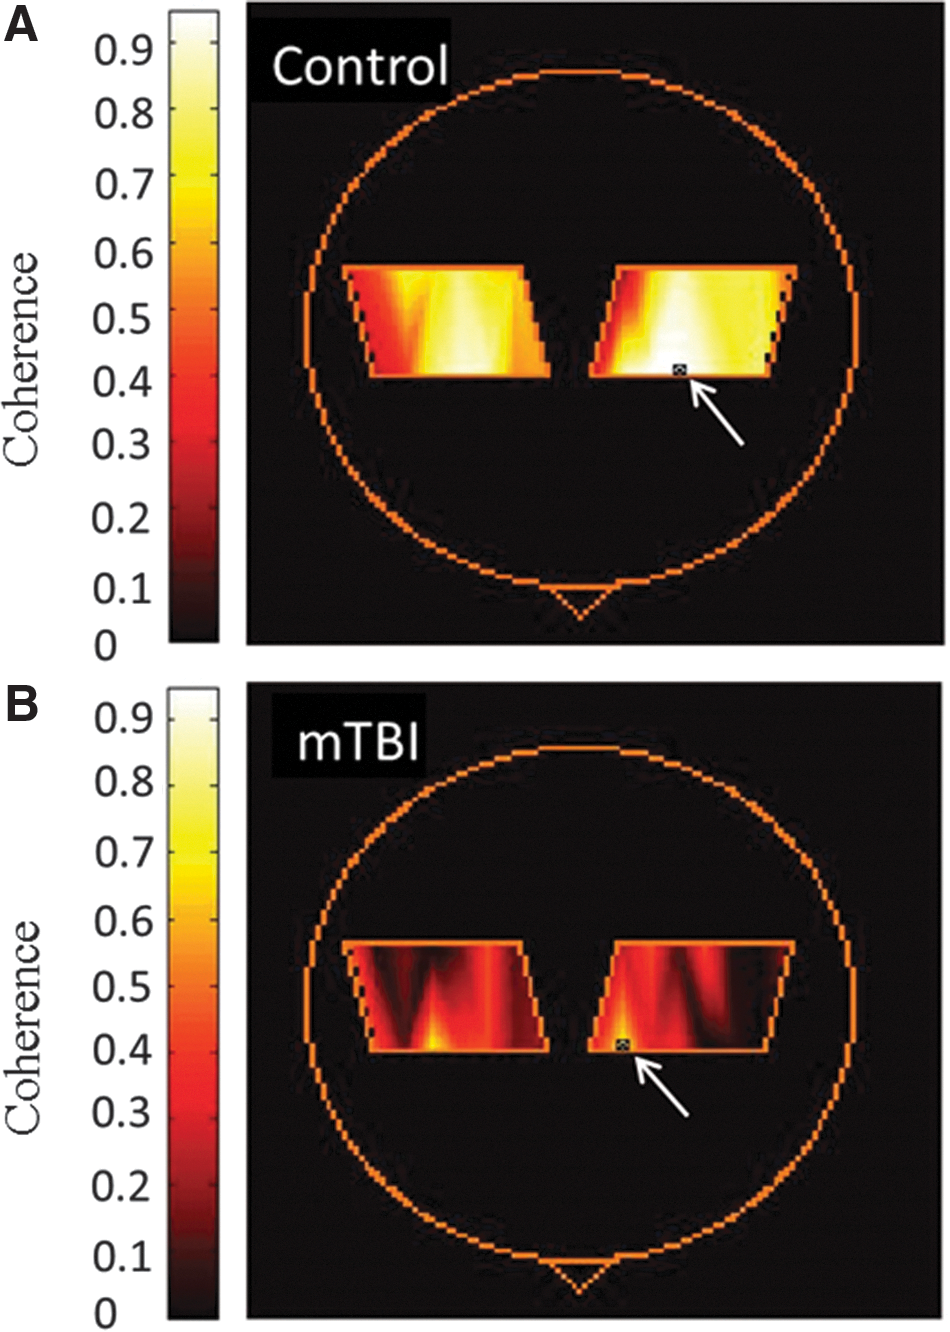
Coherence maps calculated from total hemoglobin for a control (
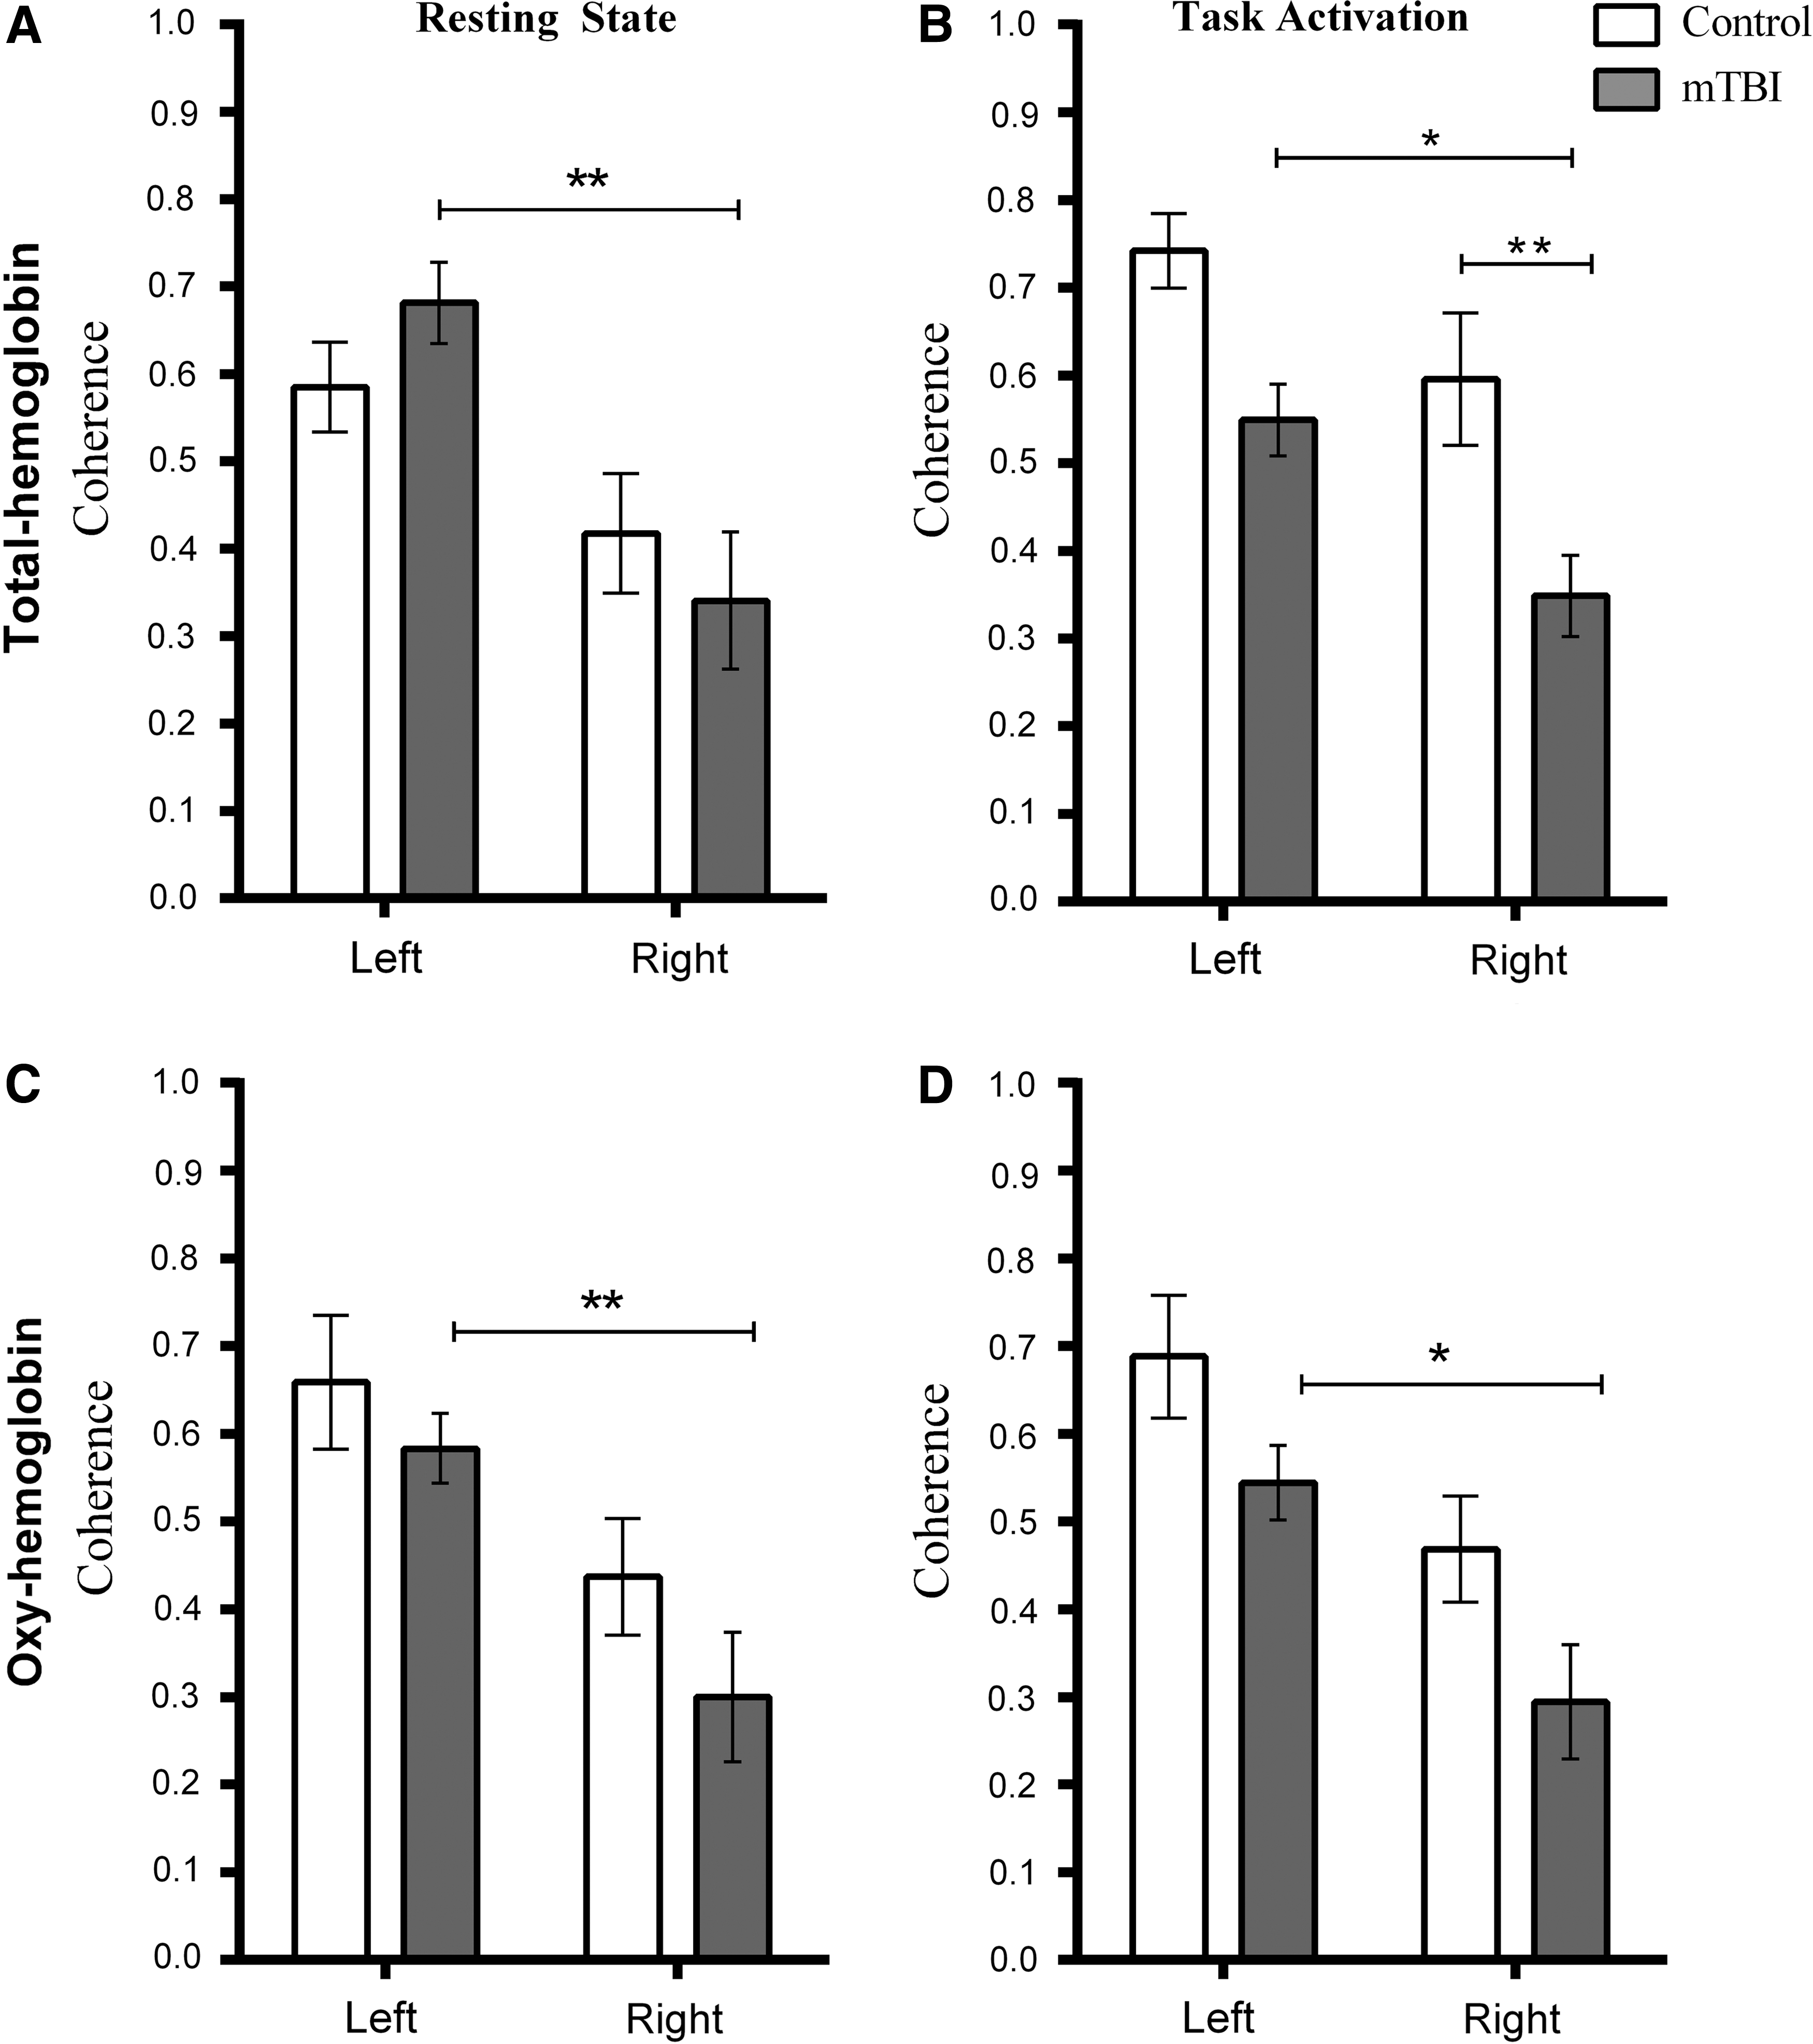
Coherence in the motor coretex in controls and mTBI patients for total hemoglobin (Hb) and oxy-Hb. Left and right refer to hemisphere of the brain. The task was right-hand finger tapping. (
Average coherence values for controls and mTBI subjects during resting state and task activation in the left and right hemisphere. Coherence values are shown as mean and SEM.
mTBI, mild traumatic brain injury; Hb, hemoglobin; oxy-Hb, oxyhemoglobin; SEM, standard error of the mean.
During the resting state, ANOVA revealed there was a significant difference in coherence between hemispheres for total Hb (F (1,36)=14.77; p<0.001) and oxy-Hb (F (1,36)=14.72; p<0.001), but not between subject groups. During task activation, there was a significant difference between hemispheres for total Hb (F (1,36)=11.24; p<0.002) and oxy-Hb (F (1,36)=14.87; p=0.005) and between subject groups for total Hb (F(1,36)=18.06; p<0.001) and oxy-Hb (F(1,36)=6.83; p=0.013).
Tukey's post-hoc multiple comparisons (results shown in Fig. 4) revealed that coherence was significantly different between hemispheres for mTBI patients only. Total Hb was lower in the right hemisphere during the resting state (p=0.013; 95% confidence interval [CI]=−0.57 to −0.12) and task activation (p=0.021; 95% CI=−0.38 to −0.02). This reduction was also observed in oxy-Hb during the resting state (p=0.009; 95% CI=−0.51 to −0.06) and task activation (p=0.013; 95% CI=−0.46 to −0.04).
Tukey's post-hoc multiple comparison tests on the coherence data during the motor task also revealed that the difference in coherence between subject groups for total Hb was significant for the right hemisphere (p=0.009; 95% CI=−0.44 to −0.05), with a strong trend toward significance in the left hemisphere (p=0.057; 95% CI=−0.39 to −0.004). Coherence in the right hemisphere of mTBI patients was also significantly less than the coherence in the left hemisphere of controls (p<0.001; 95% CI=−0.59 to −0.20). For oxy-Hb, the only significant difference between groups was that coherence in the right hemisphere of mTB patients was significantly less than the left hemisphere of controls (p<0.001; 95% CI=−0.63 to −0.16; see also Fig. 4).
Total Hb coherence in the left hemisphere between the resting state and task performance was significantly increased in controls (t(7)=2.65; p=0.033), but decreased in mTBI patients (t(11)=2.64; p=0.023). Oxy-Hb coherence did not change significantly when comparing the resting state to task performance.
Discussion
Previous studies have proposed that brain activation in response to a task can be altered after mTBI. 15,48 –52 Studies of adults have shown reduced task-related activation in the normal network along with hyperactivation of areas outside of this network. 49 An fMRI study of symptomatic pediatric patients performing a working memory task demonstrated hypoactivation of the normal networks involved and a hyperactivation of a larger, more dispersed group of networks. 53 Although it has been proposed that the amount of recruitment to achieve the same task requires greater functional activation and such activation will dispersed over a larger region of area, 53 our study did not support this during a motor task. The magnitude of response to tapping task was not significantly different between mTBI and control patients, although there was a larger variability in the magnitude of response for mTBI patients. Similarly, during the resting state, the total Hb and oxy-Hb coherence values did not differ from controls.
The most significant finding in our study is the reduced total Hb and oxy-Hb coherence during motor activation tasks in the contralateral hemisphere, suggesting impairment in interhemispheric functional connectivity in PCS patients. Specifically, coherence is reduced, relative to controls, during task activation. Currently, the mechanism for a decrease in functional connectivity is not fully understood. In a healthy population, there is an increase in functional connectivity (or coherence) with task activation, as shown from fMRI studies. 33 Controls in our study showed a trend toward decreased coherence in between hemisphere; however, within hemisphere there was an increase. Investigations of the motor cortex have also shown that functional connectivity increases during task activation, as compared to the resting state. 33,54 This increase has been suggested to relate to the increased activity of the interhemispheric inhibitory pathways associated with motor control. 33,54
Without further study, it is not clear whether these changes reflect dysfunction in the WM tracts or a metabolic dysfunction. Metabolic changes have been reported in the motor cortex. 34 Reduction of coherence could be a result of WM volume loss, 55 focal axonal injury, 56 metabolic dysfunction in the corpus callosum (CC), 57 or the M1. 34 The decrease in coherence could also be a result of cellular damage after an mTBI. 58
WM tract damage or dysfunction has been reported based on DTI studies. 59 –61 , which is consistent with our finding of disruption in functional connectivity between left and right motor cortices in mTBI patients. A correlation has been reported between fractional anisotropy (FA) and task reaction times in several areas of the brain, including the genu of the CC and the thalamus 59 –61 ; in particular, a decrease in FA values in the ascending fiber tracts from the CC to the PMC after mTBI. 34 A previous fNIRS study on patients with multiple sclerosis, a disorder associated with WM damage, also reported reduced coherence during task activation, compared to controls. 47
Measurements of functional connectivity have been done between the motor cortices using fMRI in patients with traumatic brain injury (TBI). 57,62 Functional connectivity in healthy controls increased during task activation, in agreement with the increase within hemisphere with task activation in controls using fNIRS coherence analysis. Functional connectivity in TBI patients declined during task activation, resulting in a lower connectivity during motor function in patients versus controls. 57 These fMRI results are similar to our findings, in that during task activation, the patient population had lower connectivity than controls. A reduction in task-specific coherence is consistent with the altered connectivity/cortical activation during task activation in fMRI, transcranial magnetic stimulation, and EEG of mTBI patients. 62 –66 Further work is needed to compare these methods.
A limitation of the study is the sample size, although this group number was sufficient to show significant changes between groups. Also, it remains possible that the motor cortex may not be the location with the largest differences in interhemispheric communication. Further analysis should incorporate other brain regions, such as the dorsal lateral prefrontal cortex, which shows functional impairment after mTBI. 67,68 A larger mapping study should be done to examine other regions. There was also a large variability in time after injury and symptom presence. If symptoms changed with time, this could account for part of the variance. Although we found a group difference, compared to controls, the sample size is too small to determine whether there is a relationship between time after injury and magnitude of the change in coherence.
Children with mTBI and PCS often have headaches, fatigue easily, and are intolerant of noise or bright lights. fNIRS is quiet, and the participant can sit comfortably in a chair and complete tasks. Further, in our study, fNIRS was well tolerated, with no study failures, and suggests that this could be a useful tool for studies of cortical function, especially in children with PCS.
This is the first fNIRS study, of which we are aware, to use coherence analysis in an mTBI population to explore cortical communication. This study provides evidence of underlying disruption in intercortical functional connectivity based on a reduction in interhemispheric coherence in pediatric mTBI PCS patients, compared to controls. fNIRS, combined with coherence analysis, provides an objective protocol that may be used to assess mTBI. fNIRS may also provide a portable, quantitative tool that one can used to monitor functional impairment after mTBI as well as to monitor treatment response and recovery.
Footnotes
Acknowledgments
The authors acknowledge funding from the Alberta Children's Hospital Research Institute, the Alberta Children's Hospital Research Foundation, the Canadian Foundation for Innovation, and the National Sciences and Engineering Research Council.
Author Disclosure Statement
No competing financial interests exist.