
Abstract
Mass spectrometry (MS) has long been used for quality control of oligonucleotide therapeutics, including single-guide RNAs (sgRNAs) for clustered regularly interspaced short palindromic repeats techniques. However, the application of MS is limited to qualitative assays in most cases. Here, we showed that electrospray-ionization quadrupole time-of-flight MS (ESI-QTOF-MS) assays can be quantitative for chemical species found in sgRNA samples. More specifically, using a 100-nt SpCas9 sgRNA as the example, we estimated that the limits of quantification for length variants in the range of N − 4 to N + 4 (i.e., 96–104 nucleotides) were equal to or lower than 1%. Our study highlighted the potential of ESI-QTOF in its application as a quality control method for sgRNA molecules.
Introduction
Clustered regularly interspaced short palindromic repeats (CRISPR) technology has revolutionized the field of life sciences by offering a precise and efficient method for genome manipulation, 1 diagnostics, 2 and other fundamental sciences.3,4 At the heart of CRISPR systems lie the two key components, CRISPR-associated (Cas) protein and RNA molecules guiding the nuclease to targets. It was soon recognized that the RNA dyads in Type II CRISPR/Cas systems, namely, CRISPR RNA (crRNA) and transactivating CRISPR RNA (tracrRNA), can be fused into a single-guide RNA (sgRNA), which further simplified the engineered CRISPR tools. 5 The quality of sgRNA is paramount, as it directly affects the accuracy and efficiency of gene editing. Thus, sgRNA quality control is pivotal for harnessing the full potential of CRISPR technology and delivering safer and more efficient CRISPR-based cell and gene therapies.
A major component in sgRNA quality control is to quantify impurities in the sgRNA samples. Conventional analytical assays based on liquid chromatography often struggle to meet such quantification needs for impurities with similar lengths to the sgRNA itself. 6 Mass spectrometry (MS), on the other hand, has been widely applied for quality control of oligonucleotide therapeutics.7,8 However, MS is generally considered qualitative and applicable for identity confirmation and impurity nomination. Here, we showed that MS can be used as a methodology for quantification of length variants in samples of SpCas9 sgRNA molecules. More specifically, our method developed on an electrospray-ionization quadrupole time-of-flight (ESI-QTOF) mass spectrometer provided a limit of quantification (LoQ) at or below 1% (molar ratio percentage) for length variants that were 1–4 nucleotides different in length from the 100-nucleotide sgRNA molecule.
Materials and Methods
Synthesis of surrogate RNAs and SpCas9 sgRNA
RNAs were synthesized on controlled pore glass support with pre-installed 5′-O-(4,4′-dimethoxytrityl)−2′-O-methyl uridine (AM Chemicals, Vista, CA) using Synthego proprietary DNA/RNA synthesizers. The coupling step was performed with 1:1 mixture (v/v) of phosphoramidites and 0.25 M 5-benzylthio-1H-tetrazole (Chemgenes, Wilmington, MA) in acetonitrile (ACN). Oxidation and thiolation of phosphite triesters were carried out with 0.02 M iodine in tetrahydrofuran/pyridine/water 70/20/10 (v/v/v) (Millipore Sigma, Burlington, MA) and 0.1 M [(dimethylamino-methylidene)amino]−3H-1,2,4-dithiazoline-3-thione (Chemgenes), respectively. Capping steps were carried out using 20% (v/v) 1-methylimidazole in ACN (Millipore Sigma) and acetic anhydride/2,6-lutidine/ACN 20/30/50 (v/v/v) (Millipore Sigma). Finally, the detritylation reaction was facilitated with 3% (v/v) dichloroacetic acid in toluene. Cleavage and deprotection steps were performed as described in literature.7,9 The fully deprotected RNAs were further purified using ion-pair reverse-phase high-performance liquid chromatography (RP-HPLC) [Agilent 1260 Infinity II LC; XBridge Premier Oligonucleotide BEH C18 column, 2.5 µm, 6.6 × 150 mm; gradient of 100% solvent B (0.1 M triethylammonium acetate in water) at 0 min to 95% solvent A (0.1 M triethylammonium acetate in ACN) and 5% solvent B at 30 min with flow rate of 1 mL/min].
ESI-QTOF analysis of RNA surrogate mixtures
Mixtures were prepared in triplicates between the SpCas9 sgRNA sample and one of the surrogate RNA samples, where the total molar concentrations of these two components were held constant at 3.0 µM. Each surrogate RNA was mixed with the SpCas9 sgRNA at a series of molar percentages: 0%, 0.3%, 1%, 3%, 10%, 30%, and 100%; the molar percentages of the SpCas9 sgRNA in those mixtures were 100%, 99.7%, 99%, 97%, 90%, 70%, and 0%, respectively. In total, 168 mixture samples were prepared. Each sample was analyzed using the Agilent Q-TOF 6530 LC/MS ESI-MS in negative mode (injection volume at 12 µL; gas drying temperature at 325°C; flowrate at 12 L/min; nebulizer pressure at 40 psi; capillary voltage at 4000 V). The acquisition protocol was set to capture data between 100 and 3200 m/z, with an acquisition rate and time of 5 spectra/s and 200 ms/spectrum, respectively. The spectrum was deconvoluted using a maximum entropy algorithm (mass range at 4000–35000 Da, mass step at 1 Da) without holding any constraint on the charge states.
Derivatization of recovered impurity molar percentage from MS data
Impurity (i.e., surrogate) molar percentage, Y, was recovered from individual deconvoluted spectrum using Eq. 1 below. First, the maximal counts for surrogate and SpCas9 sgRNA,
Estimation of LoQ levels
The LoQ levels in this study were estimated via a three-step strategy based on the recovered impurity percentage values obtained above. First, the average and standard deviation of 0% spiked-in samples within each sample set (
In the third step, the LoQ level of spiked-in impurity percentage was estimated with Eq. 3, where
Estimation of linear ranges
The linear range was estimated for each impurity with the following three criteria:
The lower end of linear range starts at the corresponding LoQ level estimated above. The slope for the linear regression within the linear range has to be 1.00 ± 0.01. The coefficient of determination (i.e., R2) for the linear regression within the linear range is ≥0.99.
Results and Discussion
For proper evaluation of LoQ levels in any quantitative assay, a clean baseline is critical. A number of chemical and technical obstacles prevent the possibility of synthesizing 100% pure SpCas9 sgRNA, including the inevitable impurity build-up during solid-phase synthesis and limitations in current purification techniques.10,11 More specifically, it is very challenging to prepare SpCas9 sgRNA samples with undetectable N − 1 and N + 1 species. Here, N − X species refer to RNA species that are X nucleotide(s) shorter, while N + X species refer to those with X extra nucleotide(s). To avoid such issues, we first designed sequence surrogates for length variants that are 1 to 4 nucleotides different in length from the 100-nucleotide long sgRNA molecule (Supplementary Table S1). These surrogates are designed so that the calculated molecular weight of each sequence is at least 50 Da away from any N ± 1 species of other surrogate sequences (Fig. 1). Take the surrogate sequence of the sgRNA N − 2 species, that is, the 98-mer named after its length, as an example. Its calculated molecular weight is 31829.3 Da, while the closest inherent length variants from the 99-mer and 97-mer are 31712.4 and 31706.0 Da, respectively. The molecular weights of both inherent impurities are more than 50 Da away from the N − 2 surrogate, which guarantees clean baselines in MS around the mass window of the N − 2 surrogate when it is mixed with N − 1 and/or N − 3 surrogates.
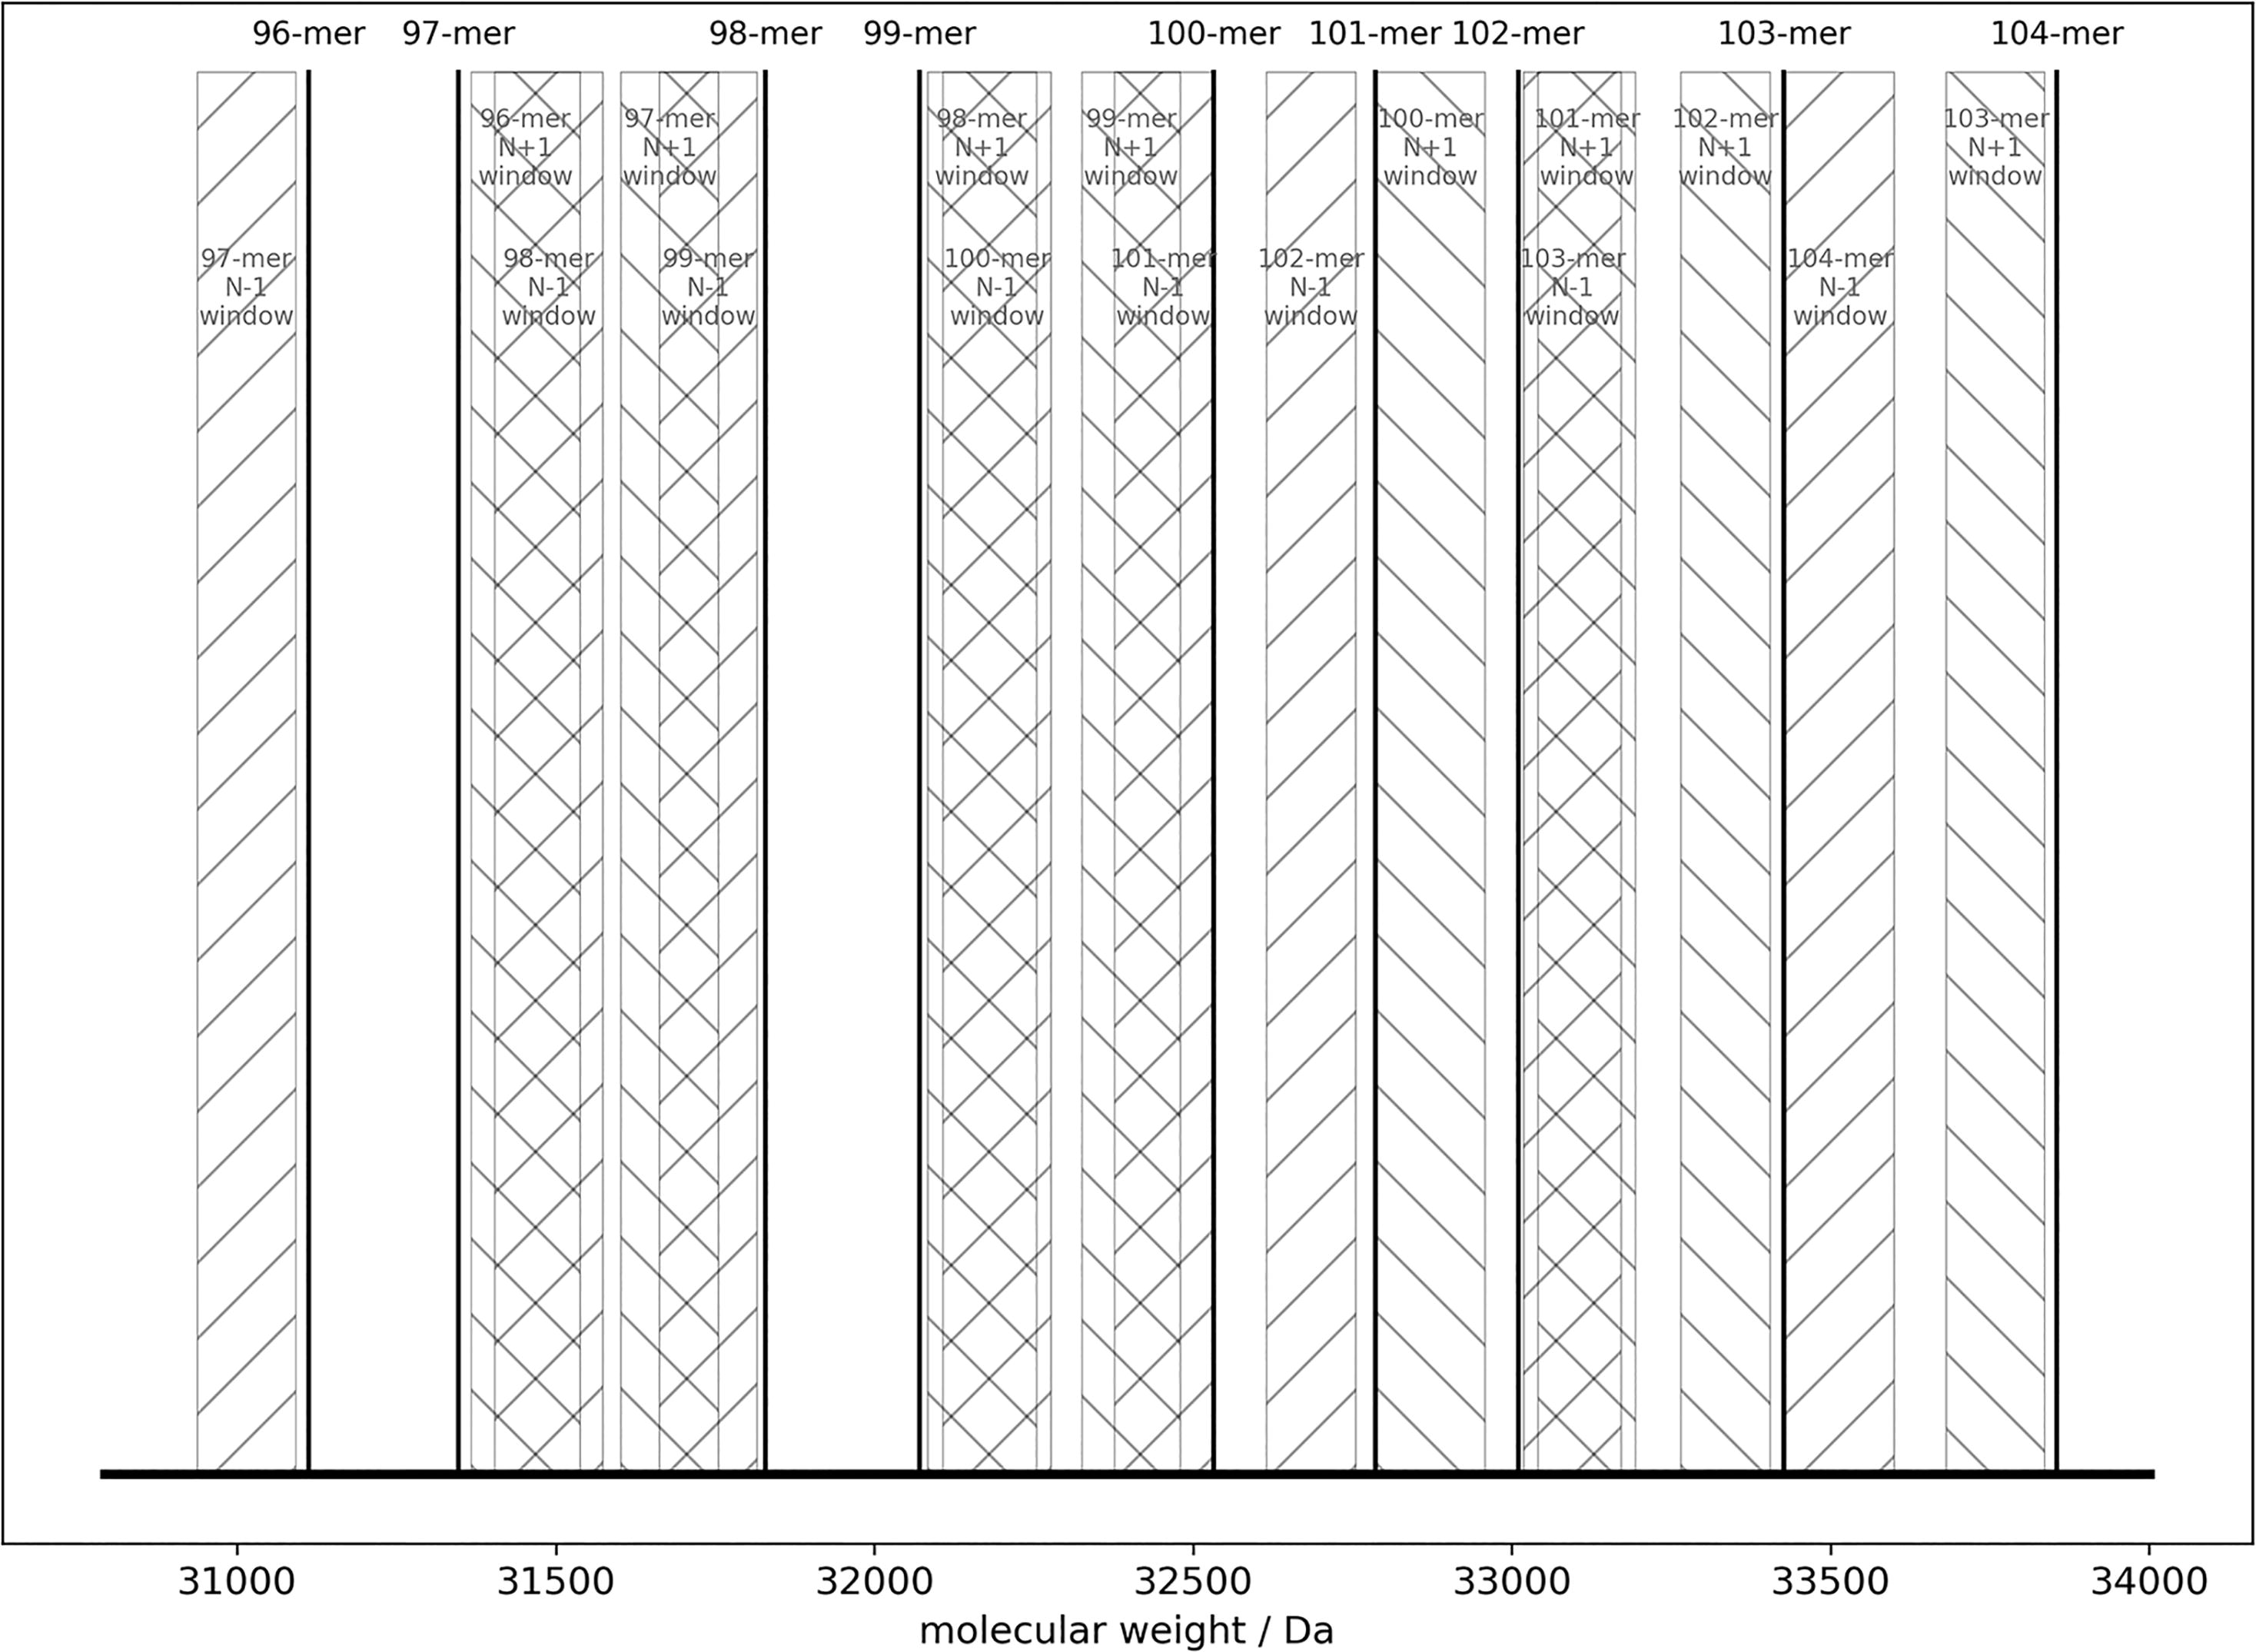
Each surrogate RNA sequence is designed to avoid overlap of molecular weight with any N ± 1 species from other surrogates. The mass of each surrogate RNA sequence is represented as a vertical line. The mass window of N − 1 species from a surrogate sequence (other than 96-mer) is represented as a rectangular with forward slash (“/”) texture. The mass window of N + 1 species from a surrogate sequence (other than 104-mer) is represented as a rectangular with back slash (“\”) texture.
Once the surrogate sequences were determined, these RNA molecules were chemically synthesized and further purified by RP-HPLC. Once these purified surrogates were mixed with SpCas9 sgRNA sample, namely, the 100-mer that was also purified by RP-HPLC, the impurity percentage values recovered from MS data could be compared with the experimentally spiked-in ones. More importantly, LoQ levels and linear ranges for different impurities were then derived from MS data (Table 1). For length variants that are close to sgRNA, for example, N + 1 (Fig. 2A), they were expected to share similar responsive factor in MS assay. Therefore, these species were expected to have wide linear ranges and low LoQ levels, which was observed in our assay. Surprisingly, impurities with more significant length differences from sgRNA molecule, for example, N − 4 (Fig. 2C), still had LoQ levels at 1.0% and linear ranges from LoQ to 100%. The entire set of scatterplots for all surrogates studied can be found in the Supplementary FIG. S1. There was indeed an increasing trend in the LoQ levels as the length differences of impurities against sgRNA increased. Such trend could be explained by the general impact of oligonucleotide length on its responsive factor in ESI-QTOF assays. The only exception of such trend observed in our data was N + 1 species, which had higher LoQ level than N + 2 species in our analysis. Upon further investigation of the MS data (Supplementary Fig. S2), it showed that there was a known adduct impurity in the sgRNA sample with calculated molecular weight (32782.8 Da) close to the N + 1 surrogate (32785.9 Da), which inflated the recovered percentages in blank sample (i.e.,
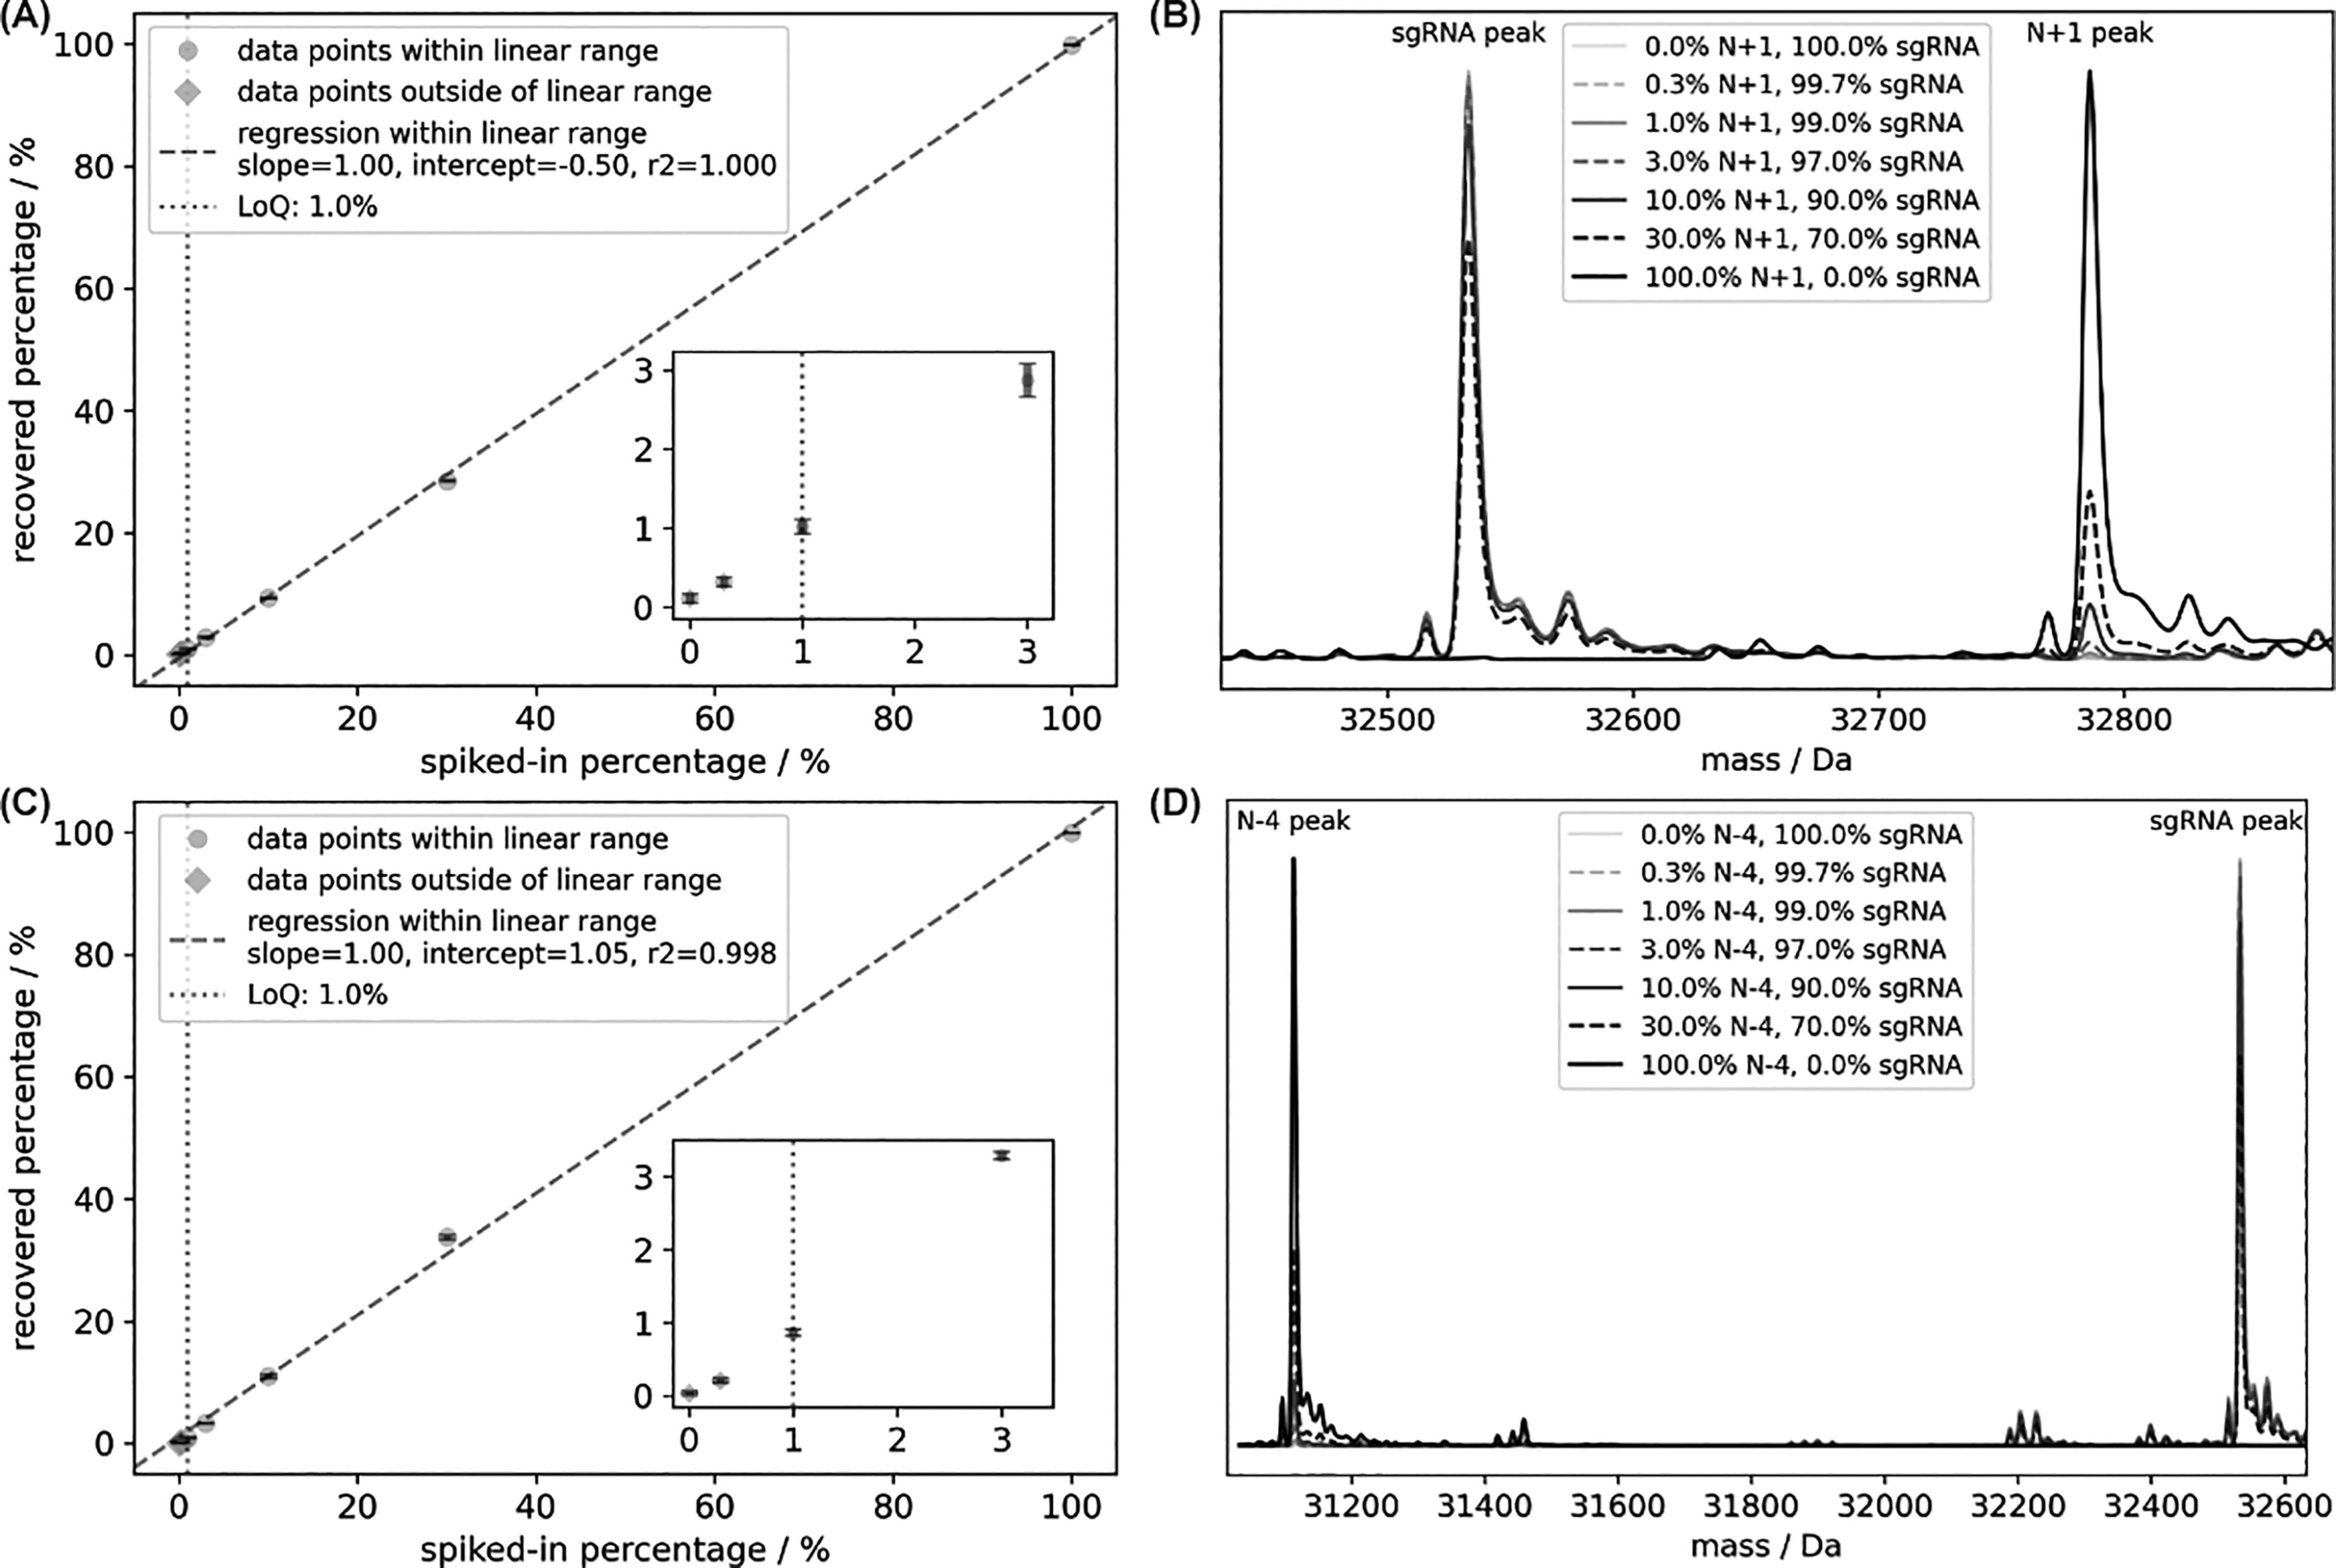
Examples of scatterplots for recovered impurity percentage versus spiked-in percentage for N + 1
Limit of Quantification Levels and Linear Ranges for Length Variants of SpCas9 sgRNA
LoQ, limit of quantification; sgRNA, single-guide RNA.
To evaluate the quantification of inherent length variants instead of their surrogates, another SpCas9 sgRNA targeting the gene locus, RELA, was synthesized. 12 Samples of the same SpCas9 sgRNA were prepared at three different purity levels: (A) crude, where the deprotected oligonucleotide was just desalted; (B) purified, where the deprotected oligonucleotide went through purification using the 4,4′-dimethyoxytrityl (DMT) protecting group at the 5′-end of the molecule (i.e., DMT-on purification); and (C) doubly purified, where the purified sample was further purified using ion-pair RP-HPLC as described in the Material and Methods section. The sample at each purity level was analyzed by our ESI-QTOF assay in triplicates, and the percentages of length variants were compared in Figure 3. Among the length variants discussed earlier, N − 2, N + 2, N + 3, and N + 4 were not detected in any of the samples and thus omitted in Figure 3. The quantified levels of the other length variants decreased as the sgRNA sample was progressively purified. Certain impurities, such as N − 4 and N − 3, decreased below the corresponding LoQ levels and thus were annotated with n.q. (not quantified). The differences of impurity percentages among samples at different purification levels were all statistically significant, except for N + 1 percentages between crude and purified samples. Given that N + 1 impurities caused by the incorporation of an additional nucleotide also contain the DMT group, it is not surprising that DMT-on purification cannot efficiently remove them. Overall, the comparison of length variants among the samples prepared at different purification levels confirmed that the ESI-QTOF assay described can be used to quantify these impurities in SpCas9 sgRNA molecules.
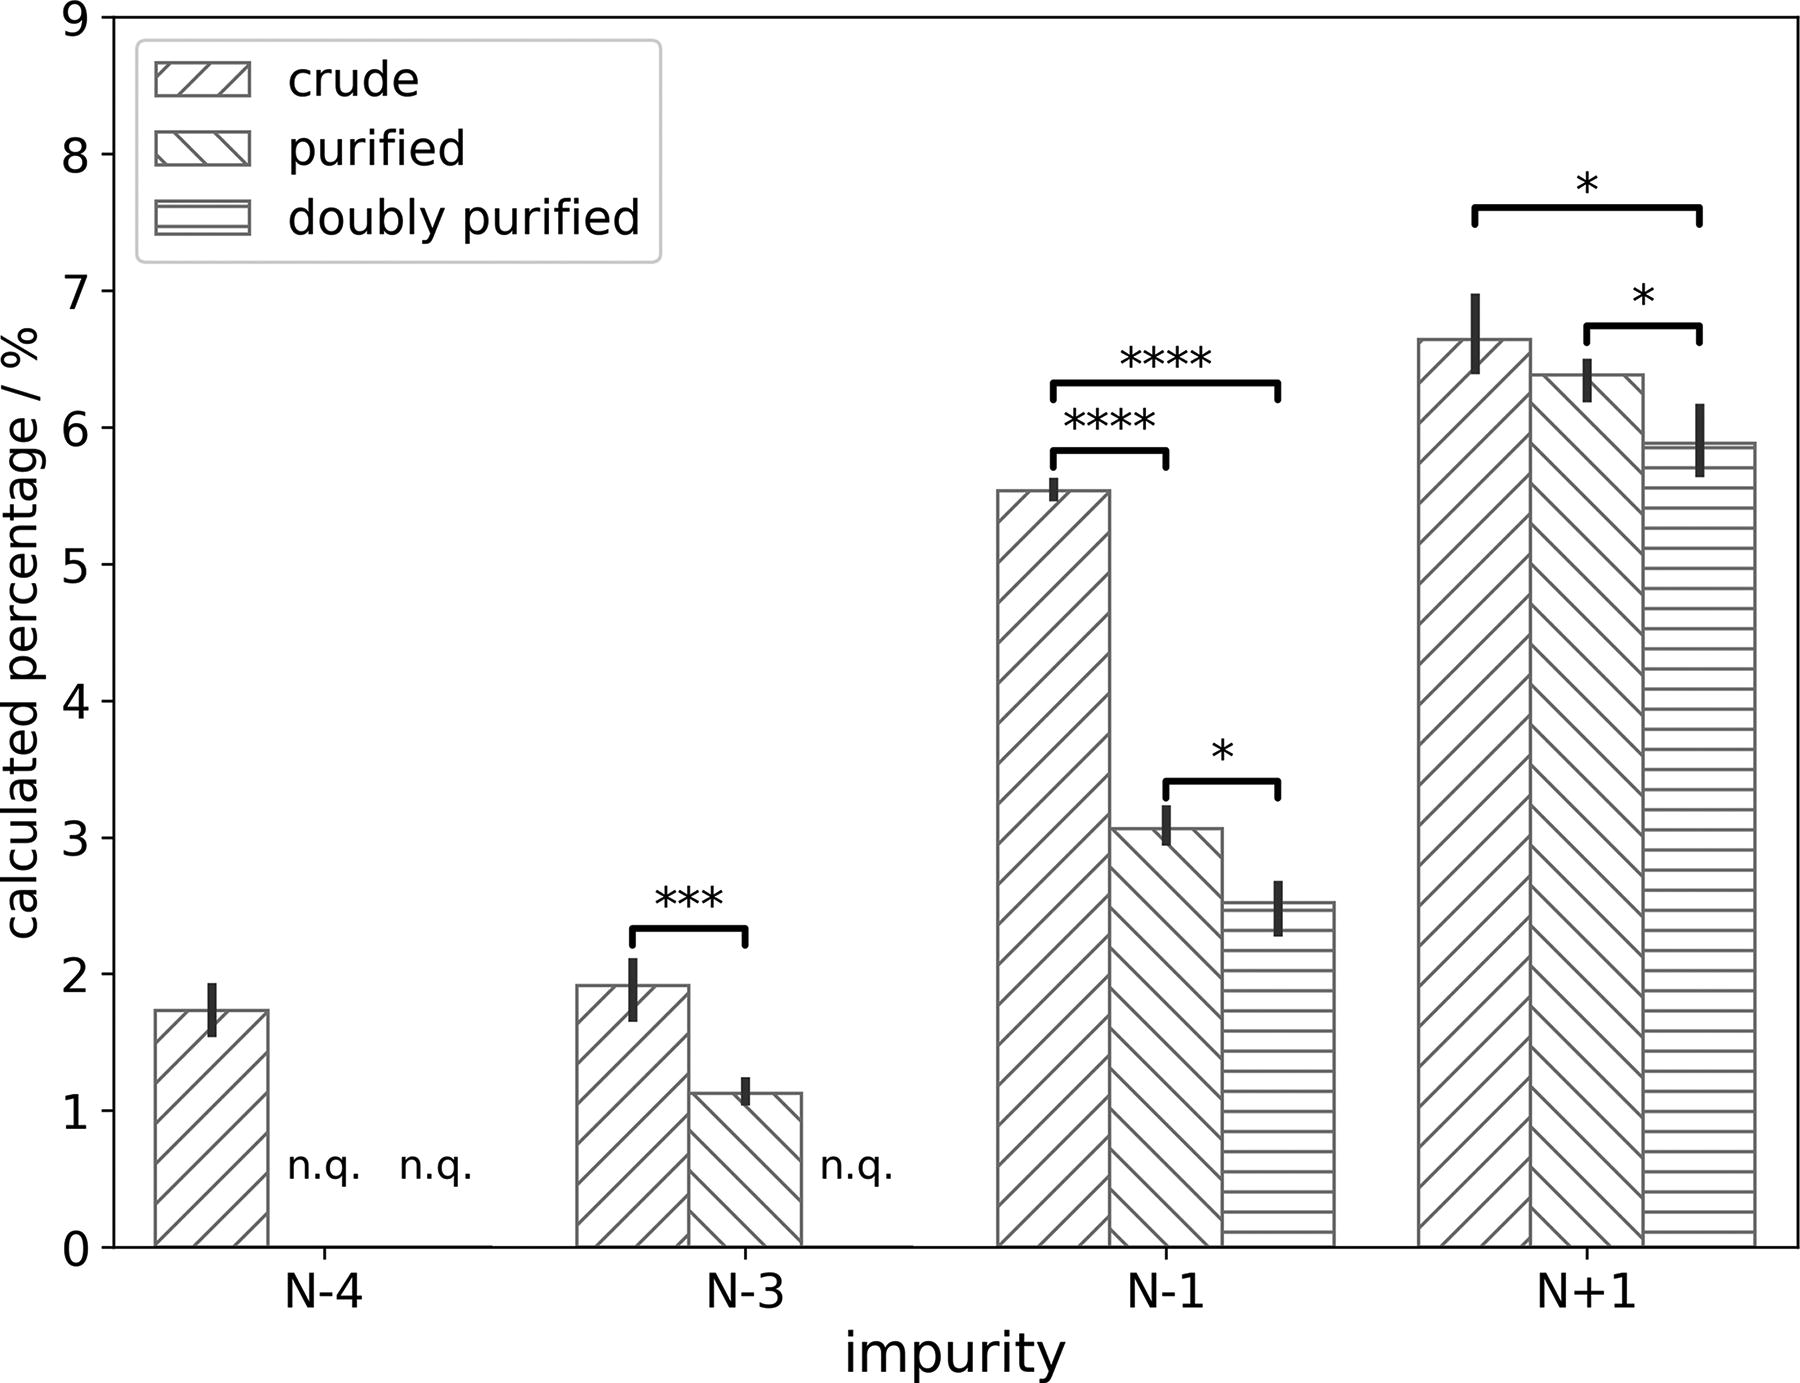
Comparison of average quantified percentages for length variants in SpCas9 sgRNA samples at different purification levels, with error bars representing standard deviations (n = 3). Crude samples are represented with forward slash (“/”) texture; purified samples are represented with backward slash (“\”) texture; and doubly purified samples are represented with horizontal strike (“—”) texture. Length variants below their limit of quantification levels in certain samples are annotated as “n.q.” (not quantified). Two-tailed t-test results are represented with: *P < 0.05, ***P < 0.005, ****P < 0.001. sgRNA, single-guide RNA.
As a summary, it was shown in this report that ESI-QTOF, a technique widely believed as only qualitative, could provide quantitative evaluation for length variants found in 100-nucleotide long sgRNA molecules. With careful sequence design of surrogates used in this study, the LoQ levels for all impurities investigated were at or below 1% molar percentage. Given that the length of oligonucleotide species is commonly believed as one of the major contributors to difference in their ESI responsive factor, 13 it is deduced that other chemical impurities sharing the same length as the sgRNA, such as N2-acetyl-2,6-diaminopurine formed during acetyl capping 14 and N3-cyanoethyl-uracil, 15 should have similar, if not lower, LoQ levels. In future studies, we would like to collect further data on such impurity species and report on their LoQ levels. The ESI-QTOF assay described here is likely to become a useful gadget in the toolkits for groups characterizing sgRNA molecules and derisking CRISPR-based therapeutics.
Footnotes
Acknowledgment
The authors would like to thank Dr. Jason Derry, Dr. Stephen Dudek, and Dr. Kevin Holden for careful reading of the article. They further thank all members of Synthego for their support in this research.
Author Disclosure Statement
The authors declare no further interest beyond their employment by Synthego Corporation.
Funding Information
No funding was received for this article.
References
Supplementary Material
Please find the following supplemental material available below.
For Open Access articles published under a Creative Commons License, all supplemental material carries the same license as the article it is associated with.
For non-Open Access articles published, all supplemental material carries a non-exclusive license, and permission requests for re-use of supplemental material or any part of supplemental material shall be sent directly to the copyright owner as specified in the copyright notice associated with the article.