
Abstract
Stable isotope labeling (SIL) of active pharmaceutical ingredients (API) is a well-established technique for the accurate quantification of small-molecule drugs. As the scope of active ingredients is expanding into areas of larger molecules, such as oligonucleotides (ONs), the development of new quantification techniques is critical. Herein, we describe the analysis of a 34S-SIL anti-PCSK9 gapmer-type antisense ON. A new method for the quantification of this API in complex biological matrices was developed and applied to mouse, dog, and monkey tissue homogenates, which gave improved accuracy and reproducibility compared with the use of auxiliary ONs as internal standard.
Introduction
Therapeutic oligonucleotides (ONs) have a history spanning over many decades. After the discovery that short DNA sequences could inhibit viral RNA translation in 1978, the field started growing rapidly [1]. Several pathways have been described by which short ONs can influence protein translation [2–6]. The specific mechanism of action of a biologically active ON depends on the type of ON and cellular target. In the early days of ON drug development, many problems were encountered, such as unfavorable pharmacokinetics, lack of oral bioavailability, poor cell penetration, and off-target effects that unfortunately led to preclinical and clinical failures [7].
Recently, ONs have been even more chemically modified with the goal to increase tolerability, affinity, and selectivity for complementary strands [8]. However, a modification that is very prevalent in therapeutic antisense ONs (ASOs) is the phosphorothioate (PS) linkage, which replaces a nonbridging oxygen of a phosphodiester linkage by a sulfur atom. This increases resistance toward nuclease degradation and increases protein binding, which leads to improved tissue distribution and longer half-life [8,9].
ON drugs designed to treat numerous common diseases, for example, cancer, infective and metabolic diseases, are currently undergoing clinical trials [10,11]. With the growing number of ASOs reaching clinical trials, comes a demand to conduct pharmacokinetic and pharmacodynamic studies to substantiate the properties of these drug molecules. In particular, the quantification of ASOs in complex biological matrices has been a challenge and multiple approaches have been proposed with varying results [12–14]. Therefore, a more sensitive, reproducible, and general method was desired to increase the sensitivity and robustness of quantification. ONs are highly charged and polar which makes method development difficult. Achieving sufficient chromatographic resolution in high performance liquid chromatography (HPLC) is challenging and the presence of multiple charge states and adducts in mass spectra limits sensitivity [15]. In small-molecule drug development, stable isotope labeling (SIL) of active pharmaceutical ingredients (API) to support metabolite exploration and quantification of APIs is common practice both in man and animal models [16,17]. Isotope labels do not significantly change the biological or physical properties of the drug but have the important benefit that they can be easily distinguished from the unlabeled version by mass spectrometry. This makes SIL compounds excellent internal standards in quantification assays and allows control of factors such as matrix effects and extraction efficiency [17,18]. Furthermore, SIL compounds are used in a variety of pharmacokinetic and pharmacodynamic assays, for example, bioavailability determination, by coadministration of the labeled and the unlabeled compound [19,20].
SIL has not been used to any substantial extent for therapeutic ONs, presumably because isotope-labeled monomers used in the chemical synthesis of ON are very expensive and labor intensive to synthesize. A new and convenient method for the general synthesis of 34S-labeled ONs was recently established by our group, also envisioning its use in quantification assays within pharmaceutical ON programs [21].
We are progressing the Proprotein Convertase Subtilisin Kexin type 9 (PCSK9) project in the clinic, a target that has been recognized for lipid-lowering therapy in atherosclerotic cardiovascular disease (CVD). Circulating PCSK9 causes hypercholesterolemia by reducing low-density lipoprotein (LDL) receptors in hepatocytes. Thus, inhibiting PCSK9 with an ASO will lead to an increase in the LDL receptor levels, which in turn will result in lowering of LDL cholesterol and thereby CVD risk [22].
Our 5′-GalNac-conjugated PCSK9 ASO drug product (AZD8233) is currently undergoing early clinical trials. The ASOs that are currently being investigated contain a 3-10-3 gapmer, in which the wings consist of constrained ethyl (cEt)-building blocks, while the gap stretch consists of DNA building blocks; additionally the ASOs comprise a PS backbone. We were interested in quantifying the unconjugated AZD8233 (1) ASO (i.e., the naked 3-10-3 gapmer). Quantification of 1 initially proved challenging in tissue samples since the first tests using surrogate ONs of differing lengths as internal standard were not perfectly reproducible. Considering we have multiple therapeutic ON programs in the early clinical phase, an accurate and precise quantification method for PS ONs was required [23]. Herein, we describe a new general quantification protocol of PS ONs in tissue samples using 34S labels.
Materials and Methods
Synthesis
All ONs included in this study were 16mers with a 3-10-3 cEt-DNA-cEt gapmer design, that is, the central DNA gap region was flanked by cEt stretches on each side and the backbone consists of PS linkages. The unlabeled ON 1 (unconjugated AZD8233) was synthesized using standard procedures. The fully 34S labeled analog 2 (unconjugated 34S-AZD8233) was synthesized using the same ON synthesis procedures, except that 34S-labeled phenylacetyl disulfide (PADS) was used during the sulfurization step. All ONs were purified using ion pair HPLC (Supplementary Data) and analyzed by ultra performance liquid chromatography (UPLC) using a gradient from 30% to 80% acetonitrile in 10 mM tributylammonium acetate over 20 min on a XBridge C18 column at 60°. HRMS spectra were collected by elution of the ON on a XBridge C18 column using a 0.3 mL/min linear gradient from 20% to 70% acetonitrile in 10 mM tributylammonium acetate over 8 min at 60°C on Waters BioAccord system with a time of flight mass analyzer. Ionization mode: electrospray ionization (ESI) negative. Source capillary voltage: 800 V. Source desolvation temperature: 550°C. Full scan with fragmentation, mass range: 400–5,000 and 2 Hz scan rate.
Liquid chromatography with tandem mass spectrometry quantification protocol
Commercially sourced blank liver and kidney tissues from CD-1 mice, Beagle dogs, and cynomolgus monkeys (matrix supplier: BioIVT) were homogenized in 9 volumes (cynomolgus monkey and dog) or 19 volumes (mouse) (w/v assuming a density of 1) of homogenization buffer [2.92 g NaCl, 3.72 g ethylenediaminetetraacetic acid (EDTA), 2.5 mL Nonidet P40, 10 mL Trizma hydrochloride, and 500 mL deionized water] using an ULTRA-TURRAX T10 for ∼5 min until a smooth pipettable consistency was achieved. Stock solutions of 1 and the stable isotope-labeled internal standard 2 were prepared in deionized water and stored at −20°C in silanized amber glass vials. Calibration standards and quality control (QC) samples were prepared by serial dilution of 1 stock solutions using blank tissue homogenate. Working solutions of the internal standard were prepared in deionized water.
Twenty microliters of internal standard was added to 200 μL (cynomolgus monkey and dog) or 150 μL (mouse) calibration standard, blank matrix samples, QC sample, or unknown tissue sample. Two hundred microliters of 35% ammonia solution was added and mixed before addition of 600 μL phenol:chloroform:isoamyl alcohol (25:24:1 v/v/v). After mixing and centrifuging, 250 μL of the top aqueous layer was transferred to a new tube. A further 250 μL of water was added to the original tube, mixed, centrifuged, and 250 μL of the top aqueous layer was transferred to the new tube. Four hundred microliters of dichloromethane was added to the combined aqueous layers, vortex mixed and centrifuged, and then 350 μL of the aqueous layer was transferred to a new tube. Samples were evaporated to dryness, under nitrogen, and reconstituted with 150 μL of 100 μM EDTA in deionized water followed by 50 μL 400 mM hexafluoroisopropanol/15 mM triethylamine in deionized water.
Samples were analyzed by UPLC-MS/MS using an injection volume of 10 μL on an Acquity ON BEH C18 50 × 2.1 mm, 17 μm column with an Acquity UPLC BEH C18 1.7 μm VanGuard™ Pre-Column. Mobile phase A was Methanol and Mobile Phase B was 400 mM hexafluoroisopropanol/15 mM Triethylamine in deionized water. Gradient conditions starting with 20% of Mobile Phase A and increasing to 40% of Mobile phase A over 8 min were used, with an initial flowrate of 500 μL/min reducing to 300 μL/min after 1 min. Mass spectrometry parameters were set using a Sciex API5000 liquid chromatography with tandem mass spectrometry (LC-MS/MS) system in Turbo Ion Spray Negative mode using summed mass transitions [(1)—sum of 899.1 → 94.9 and 770.7 → 94.9 and (2)—sum of 1084.7 → 97.2 and 903.5 → 97.1] (Supplementary Table S4).
Pharmacokinetic study in Beagle dogs
AZD8233 solution (at 1 mg per injection) was administered to two groups of two Beagle dogs (Supplier: Marshal BioResources) by subcutaneous injection. The test item was administered to the dogs once daily by subcutaneous injection into the scapular and mid-dorsal areas over 7 or 28 days until the day before scheduled necropsy [all studies were performed at Charles River Laboratories, Sherbrooke, Canada], with required permits (Study No. 8002148). Injection sites were rotated on each occasion. All animals underwent euthanasia on the day following their last dose (Days 8 or 29). Tissues for bioanalysis were collected and preweighed tissue sections were rapidly frozen on dry ice, then stored at −80°C until transfer to the bioanalytical laboratory. Individual tissue sections were processed and analyzed as described in the LC-MS/MS quantification protocol above.
Results and Discussion
Accurate and precise LC-MS/MS methods were developed for the quantification of pharmacologically active 1 in cynomolgus monkey, dog, and mouse tissue homogenates following dual liquid/liquid extraction of the samples. The analytical methods showed robust calibration over the ranges 0.5 to 500 μg/g in cynomolgus monkey and dog tissue and 2 to 2,000 μg/g in mouse tissue (Fig. 1). The higher analytical range in mouse was selected based on the greater intended dose of AZD8233 to be delivered in mouse toxicology studies. A pharmacokinetic study was conducted in Beagle dogs to investigate the tolerability to AZD8233 and evaluate the exposure in target organs. A comparison of internal standard plots (Fig. 2) from the analysis of 1 in dog liver samples from the pharmacokinetic study in Beagle dogs, shows that the use of an analog ASO internal standard did not perform reliably. There was high variation in internal standard responses between individual study samples and a difference in internal standard response in study samples compared with calibration standards and QC samples. Introduction of 2 as the internal standard facilitated a much more consistent internal standard response between study samples and the calibration standards or QC samples and enabled subsequent further optimization of the method to enable delivery of accurate data.
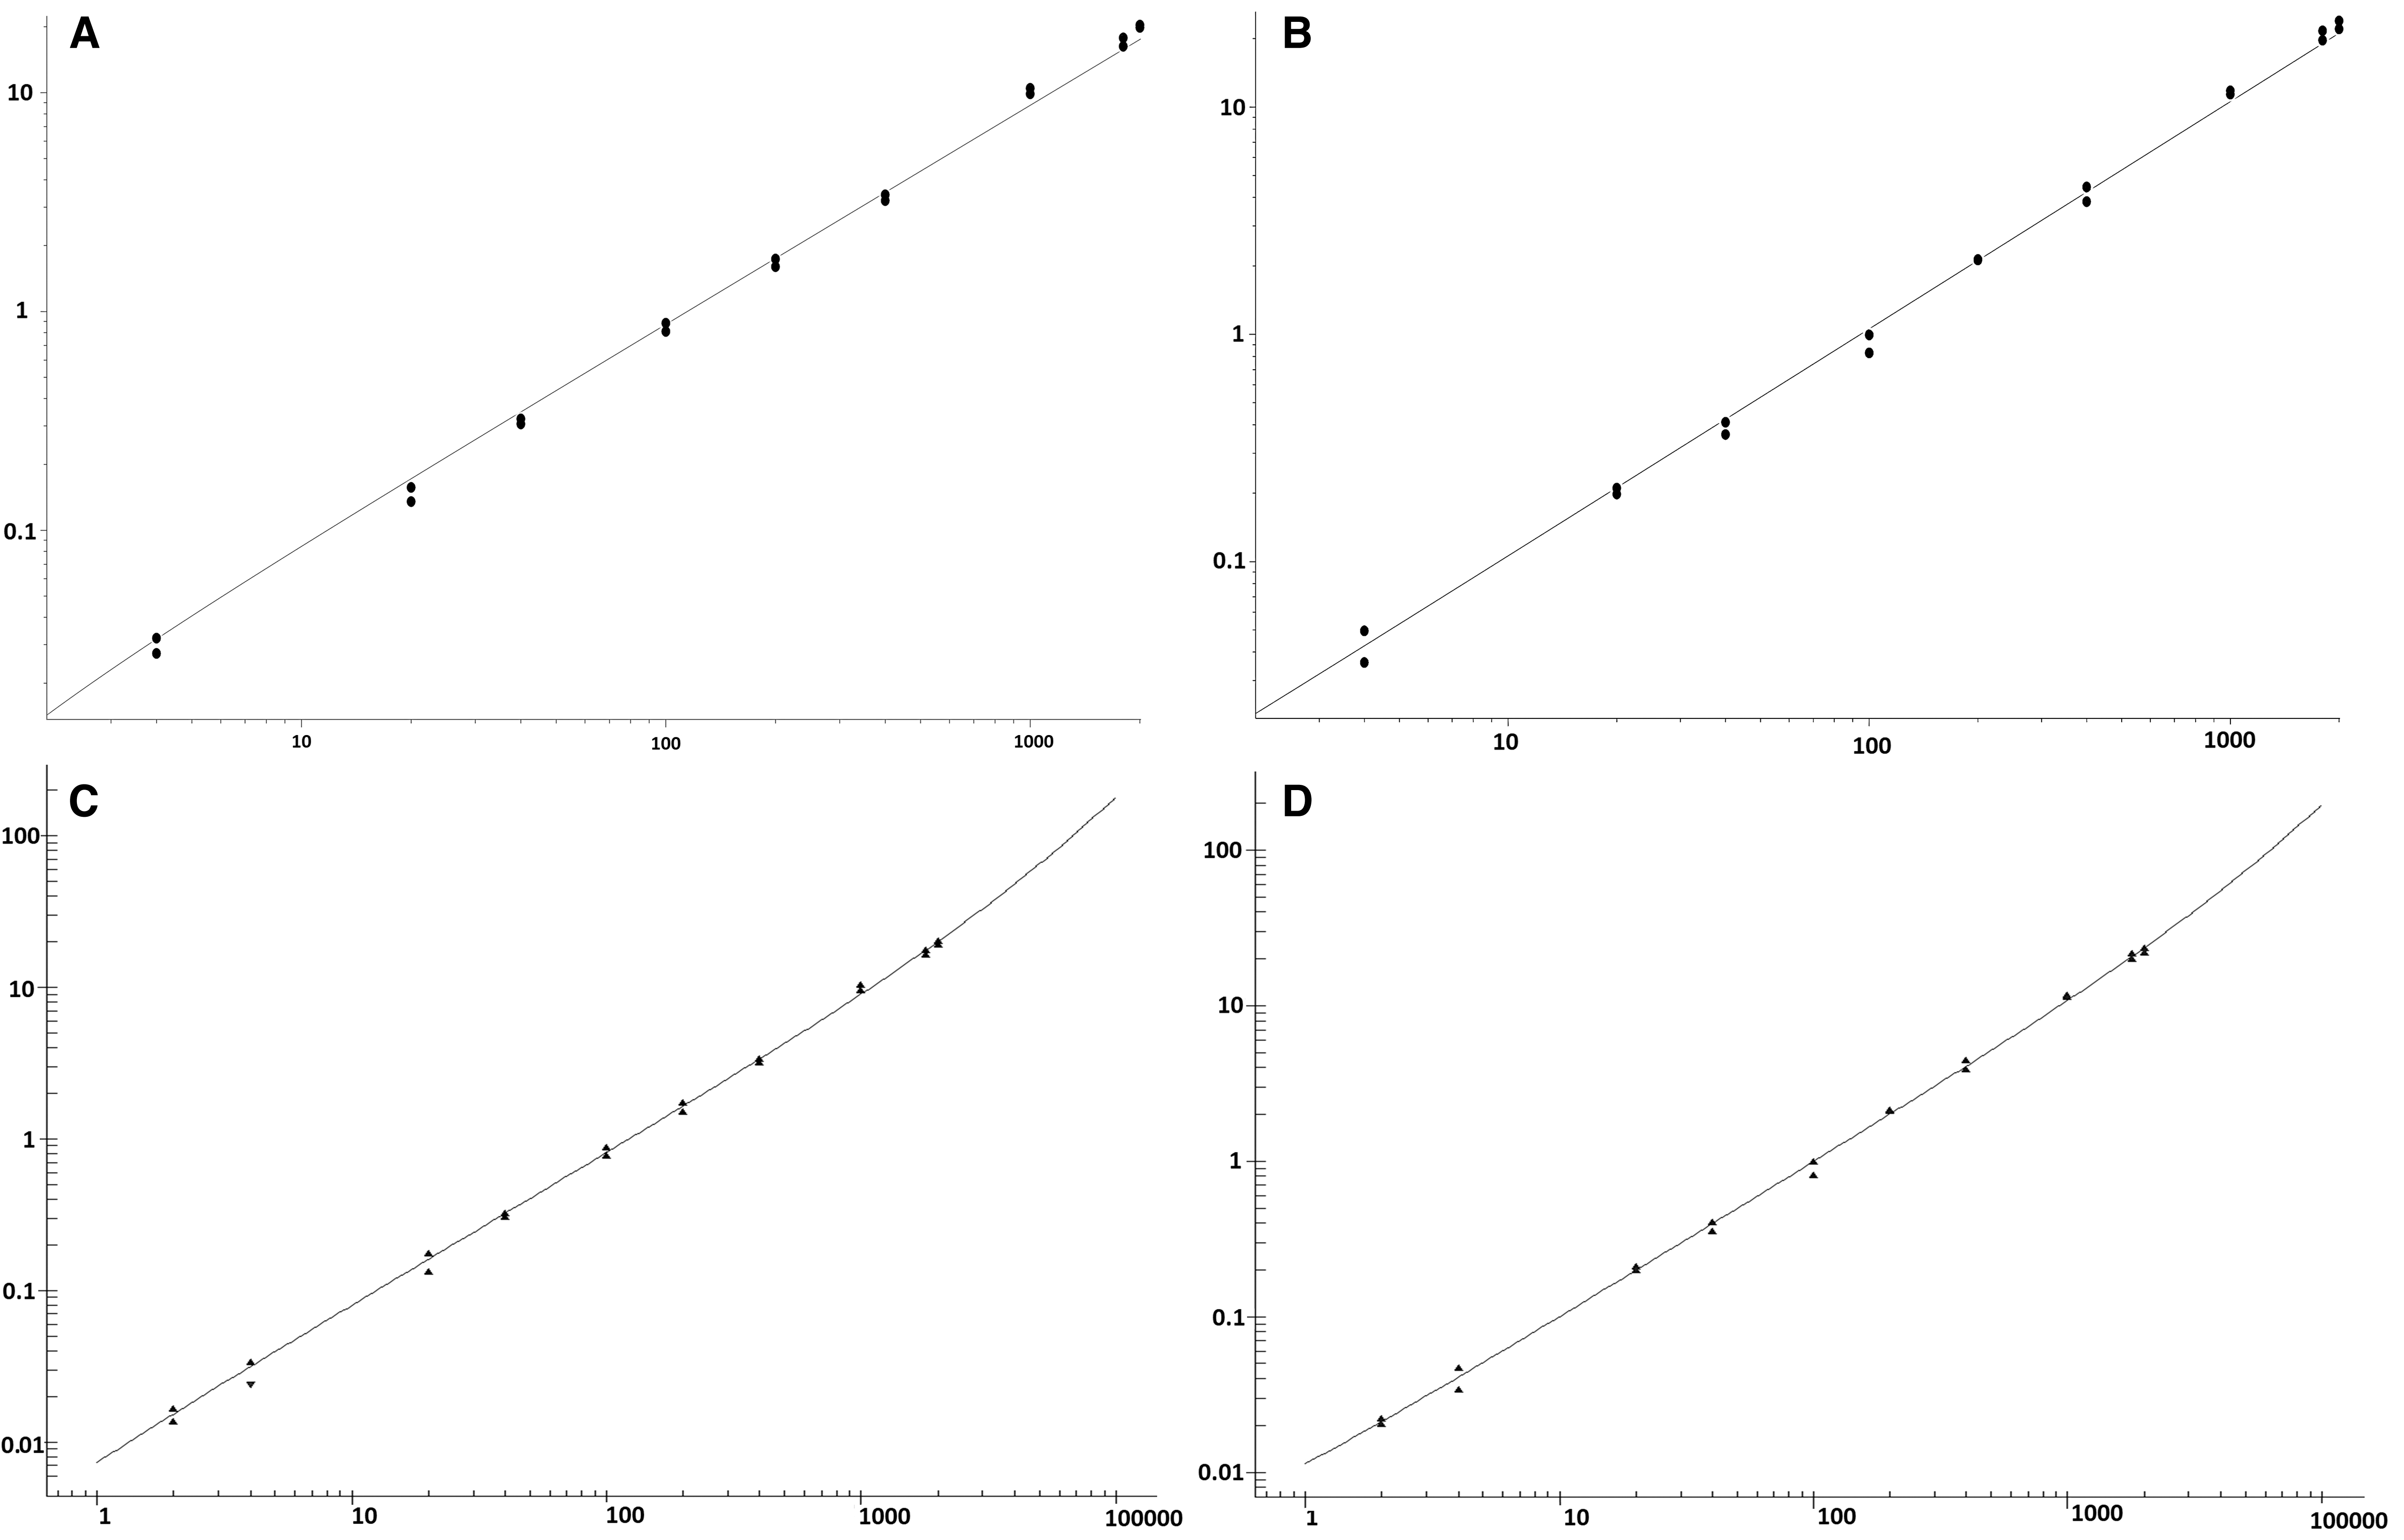
Representative calibration curves for the determination of unconjugated AZD8233 (1) in cynomolgus monkey and mouse tissues. X-axis; Concentration (μg/g tissue), Y-axis; Internal standard normalized response.
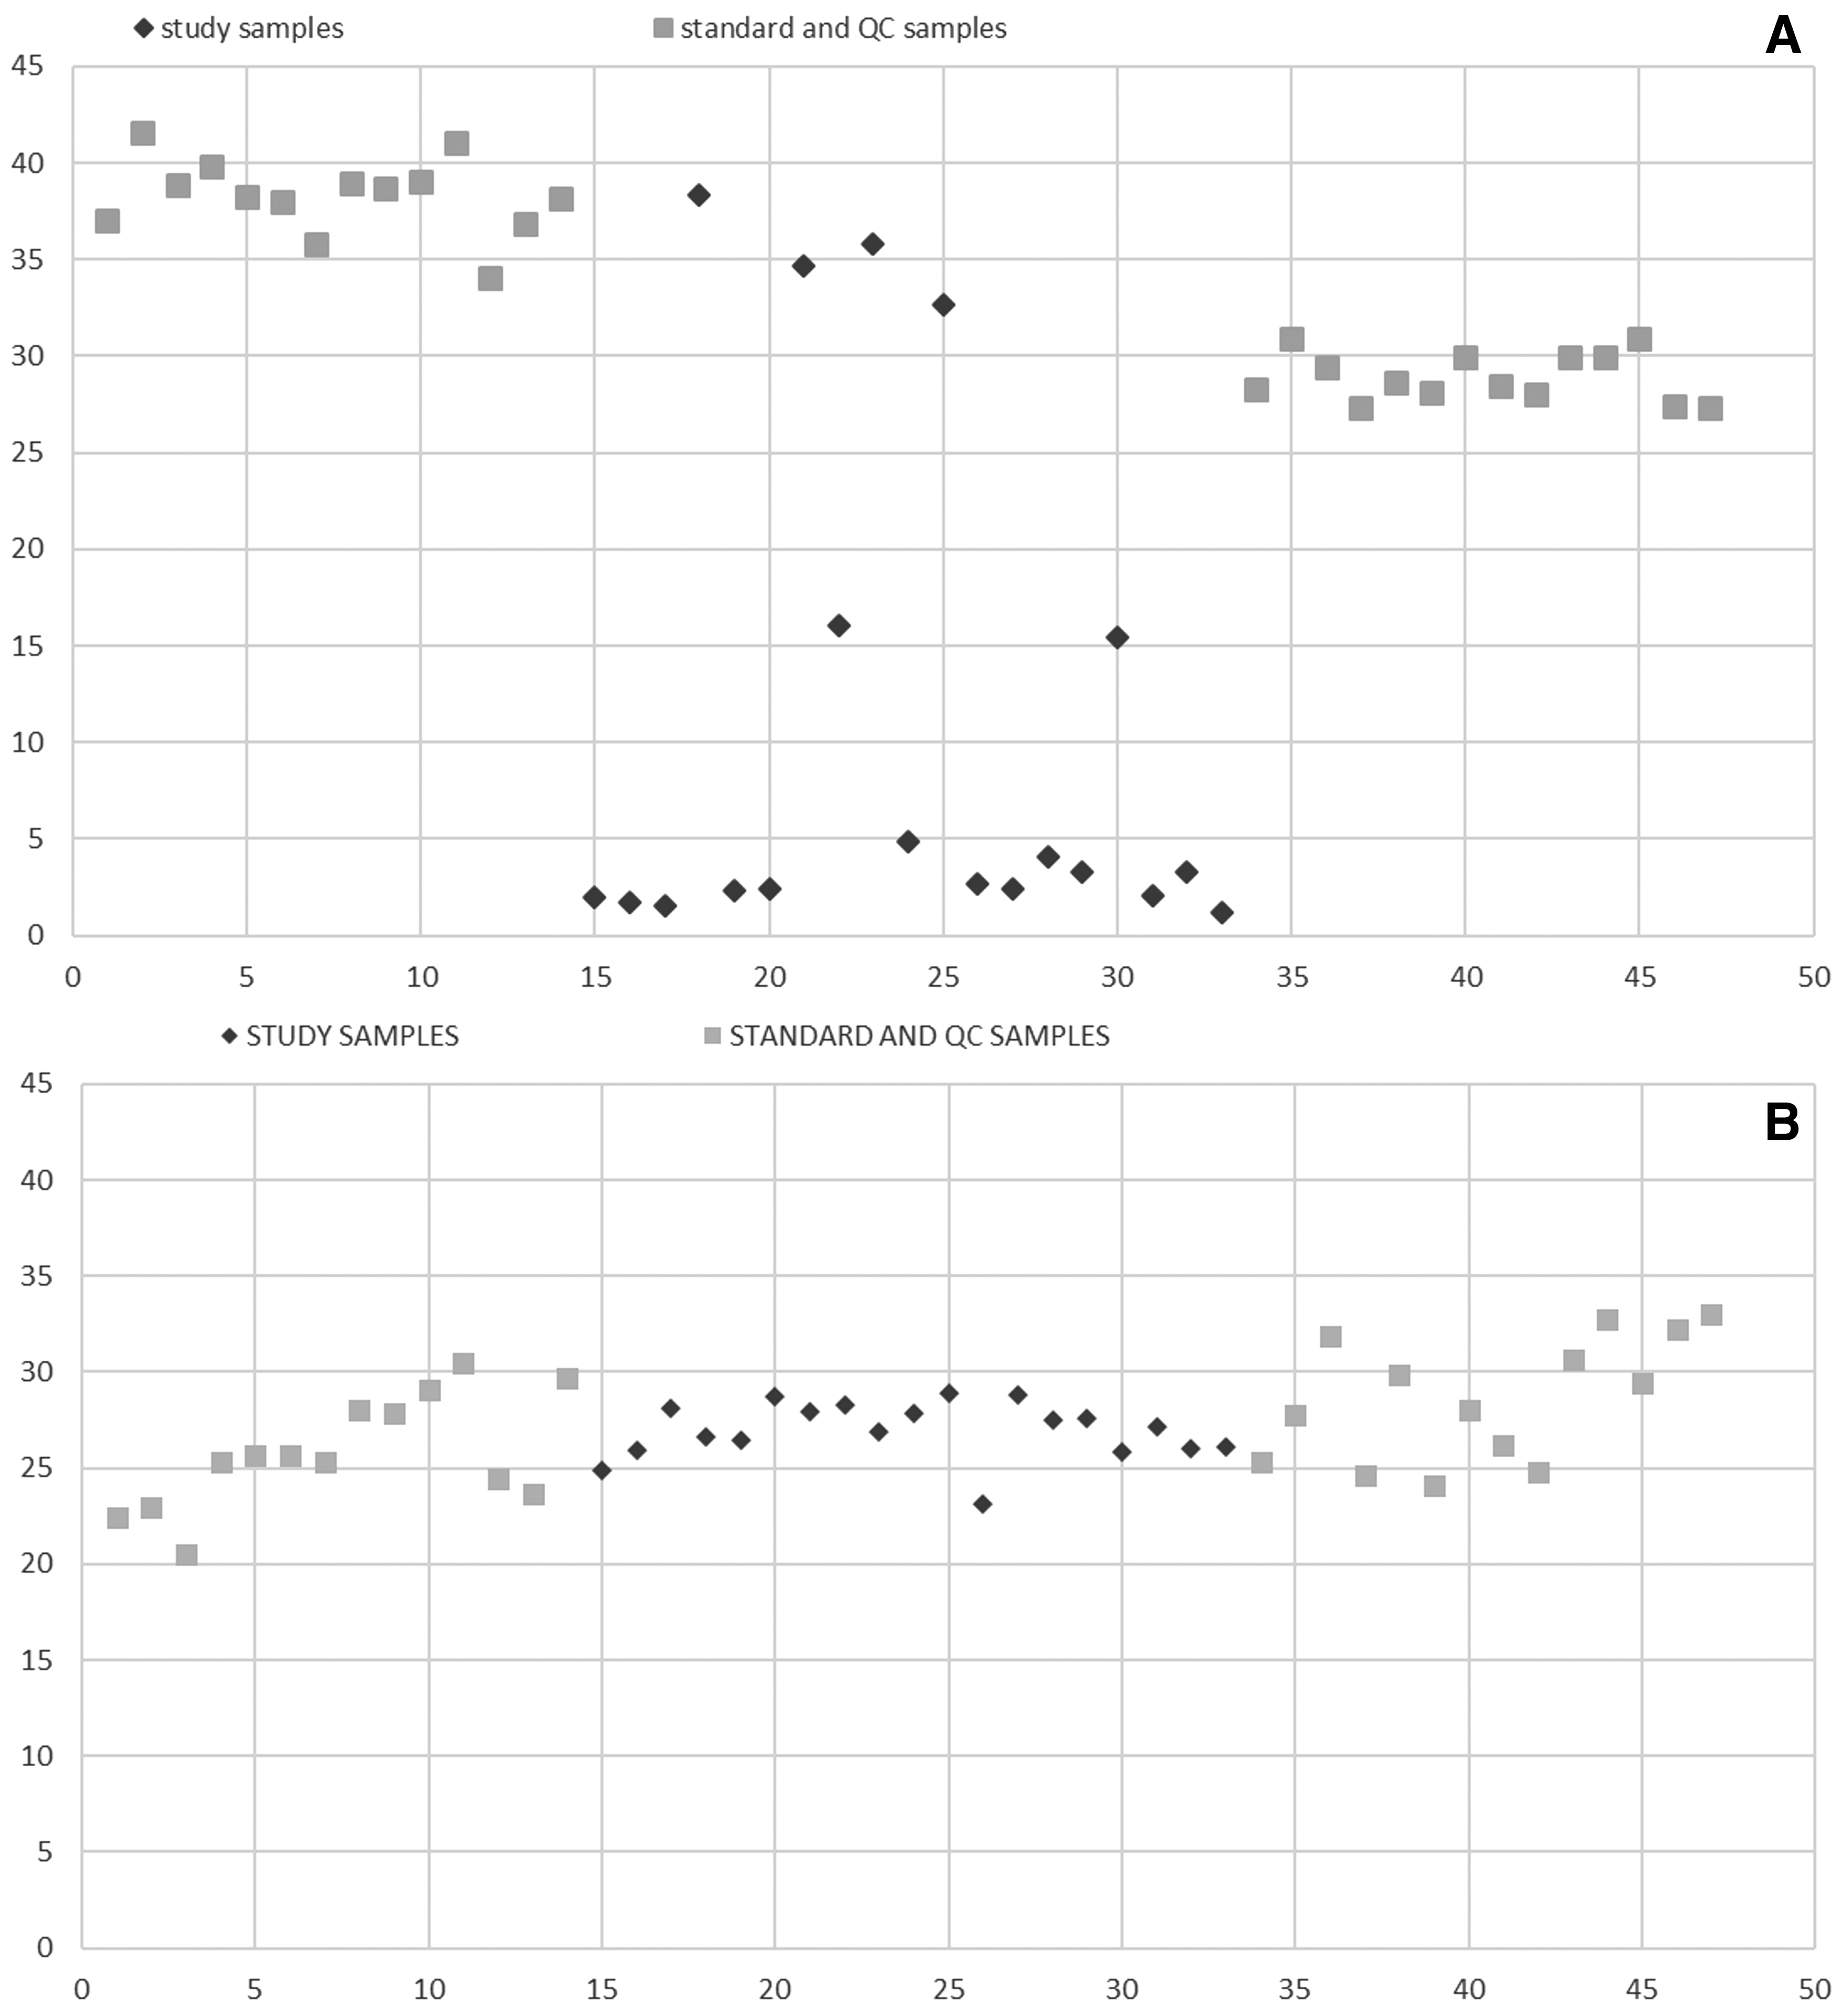
Internal Standard peak areas for standard, QC, and study sample dog liver homogenate extracts. Y-axis; Peak area of internal standard for each standard/QC and study sample in batch, X-axis; Injection order of the standards/QCs and study samples in batch
The new protocols were investigated for selectivity and were demonstrated to be selective for 1 and 2 in tissue homogenates from cynomolgus monkey and mouse (Fig. 3). In a double-blank cynomolgus monkey liver sample (Fig. 3E), a small peak was identified for the transition of 2, which was insignificant relative to the internal standard peak. The contribution of the analyte to the internal standard was less than 7% of the internal standard peak area when tested in individual tissue homogenates. No contribution of 2 was observed in the transition for 1 (Fig. 3F). In a mouse liver homogenate double-blank sample, no peak was identified for either 1 or 2. The contribution of the analyte to the internal standard peak area was less than 2% and there was no detectable contribution from the internal standard 2 to the 1 transition.
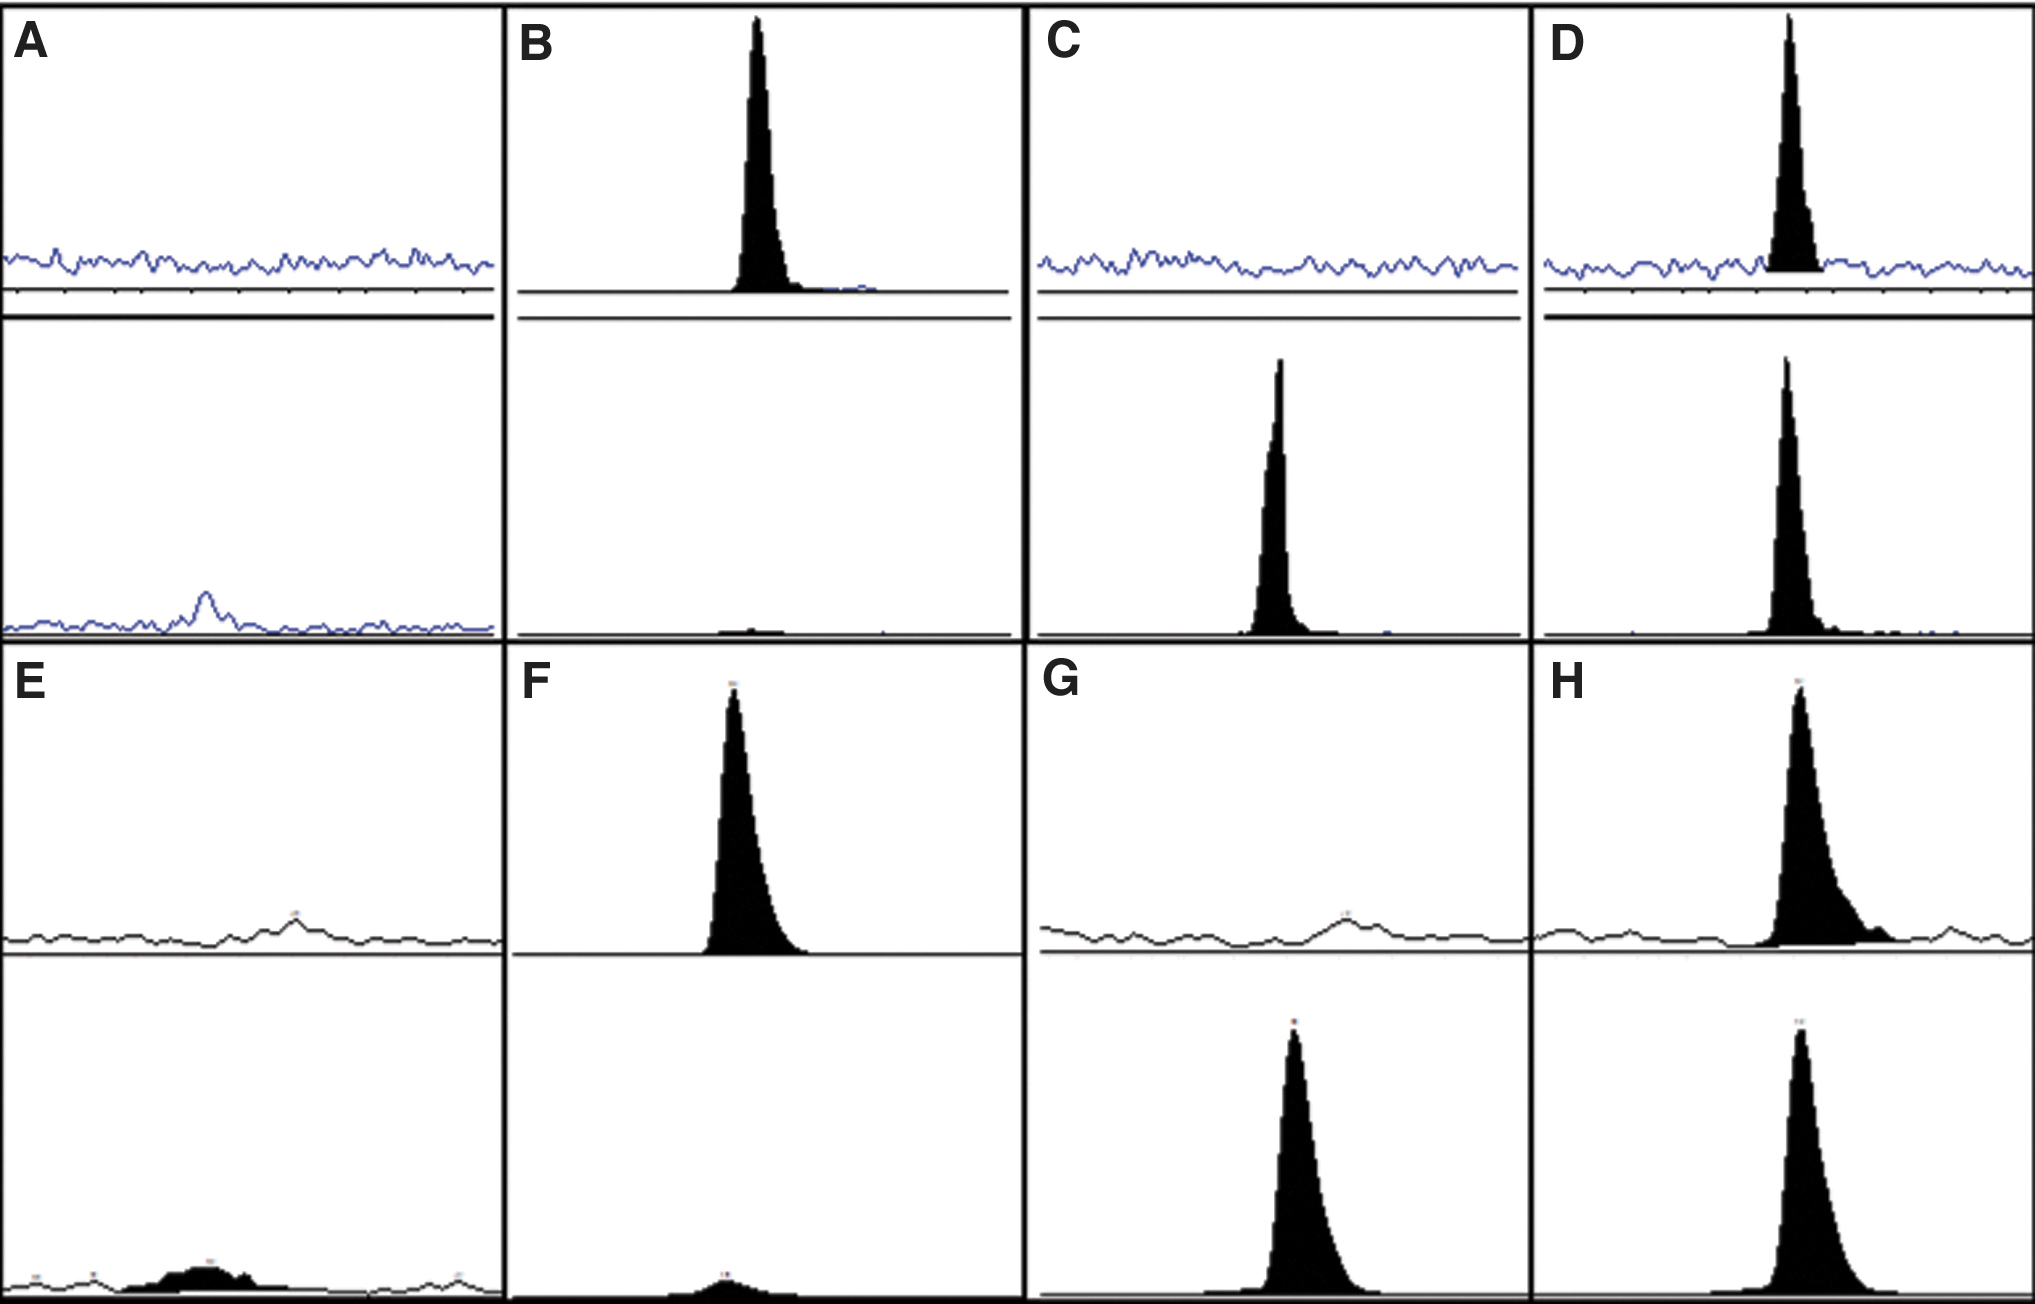
Representative LC/MS-MS chromatograms for unconjugated AZD8233 (1) and 34S-AZD8233 internal standard (2) in mouse
An assessment of instrument carryover was conducted by injecting tissue homogenate extracts fortified with a high concentration of analyte 1 (Supplementary Tables S1 and S2) or internal standard 2 (Supplementary Table S3), followed by two consecutive blank homogenate samples. Although a low level of carryover for 1 was observed in monkey kidney cortex, the peak response in the second blank homogenate sample was determined to be less than 20% of the method lower limit of quantification and therefore adequately controlled in the method. For 2, acceptable carryover was defined as 5% of the upper limit of quantification response and those criteria were met for all tested samples.
Conclusion
The isotope-labeled ASO 2 was demonstrated to be appropriate as internal standard for quantitative measurement of 1 in tissue samples. Application of a stable isotope-labeled internal standard provided a robust correction for matrix effects and is superior compared with the use of surrogate ASO internal standards due to identical retention time and ionization. The use of the stable isotope-labeled internal standard also provides a more accurate correction for extraction recovery compared with an analog internal standard. The selectivity and robustness proved to be superior to other approaches and provides more accurate exposure data from toxicology studies, thus we anticipate that this method will become widely used for the quantification of ONs in biological fluids and tissues in clinical and preclinical development. 34S-labeled ONs may also have valuable applications to improve the quality of data for metabolism studies and other in vitro assays, as well as the application to analytical support of in vivo studies.
Footnotes
Acknowledgments
The authors thank Dr. Chad Elmore for providing them with 34S8. Dr. Linda Thunberg for purification and analysis. Dr. Anders Björkbom and Dr. Marie Elebring for fruitful discussions.
Author Disclosure Statement
R.S., C.S., S.A., and A.D. are employees of AstraZeneca. I.L. and F.M. are employees of Charles River Laboratories.
Funding Information
Funding from the European Union Framework Program for Research and Innovation Horizon 2020 (H2020-MSCA-ITN-2016 MMBio—721613) is gratefully acknowledged.
References
Supplementary Material
Please find the following supplemental material available below.
For Open Access articles published under a Creative Commons License, all supplemental material carries the same license as the article it is associated with.
For non-Open Access articles published, all supplemental material carries a non-exclusive license, and permission requests for re-use of supplemental material or any part of supplemental material shall be sent directly to the copyright owner as specified in the copyright notice associated with the article.