
Abstract
Background:
Triglyceride-glucose (TyG) index, a product of triglyceride and fasting plasma glucose, is a novel tool that can identify people with metabolic syndrome (MS). It is unknown if TyG index can identify MS among Nigerians.
Methods:
Cross-sectional health screening conducted between August and December 2018, among staff and students of Ekiti State University/Ekiti State University Teaching Hospital, Nigeria, Ado-Ekiti. The analysis included 473 participants, aged ≥18 years. Anthropometric indices and blood pressure were measured by standard protocol. Fasting lipid profile and blood glucose were determined. TyG index and product of TyG and anthropometric indices were calculated, and MS defined according to the harmonized criteria. The diagnostic ability of TyG index and related parameters to identify people with MS was determined with the area under curve (AUC) of receiver operating characteristic curves. Stepwise logistic regression analyses were used to generate odd ratios (ORs) for prediction of MS.
Results:
The mean age of the participants was 39.2 (11.4) years and there were 173 (36.6%) men. In all participants, TyG-waist to height ratio (TyG-WHtR) shows the largest AUC for MS detection (0.863, 95% confidence interval, CI: 0.828–0.892) followed by TyG-waist circumference (TyG-WC) (0.858, 95% CI: 0.823–0.888), TyG-body mass index (TyG-BMI) (0.838, 95% CI: 0.802–0.870), TyG index (0.796, 95% CI: 0.757–0.831), WHtR (0.791, 95% CI: 0.752–0.827), and TyG-waist-to-hip ratio (TyG-WHpR) (0.771, 95% CI: 0.730–0.808) in that order. Gender analysis revealed that TyG-WC and TyG-WHtR have largest AUC in both genders. Before and after adjustment, TyG-WHtR (OR: 6.86, 95% CI: 3.94–11.93) and TyG index (OR: 5.91, 95% CI: 3.01–11.59) presented the highest OR in all participants, respectively.
Conclusions:
TyG index is effective in identifying MS in this cross-sectional study, and the product of TyG index and anthropometric indices improved identification and prediction of MS.
Introduction
Metabolic syndrome (MS) is characterized by co-occurrence of cardiovascular disease (CVD) risk factors such as arterial hypertension, android obesity, hyperglycemia, and dyslipidemia. 1 Abnormal lipid metabolism of MS is characterized by elevated triglyceride (TG) and low high-density lipoprotein cholesterol (HDL-C). Detection of MS enables identification of those who are at risk of type 2 diabetes mellitus and CVD. 2 MS is also associated with excess mortality. 3 –5
Insulin resistance (IR), characterized by impaired tissue sensitivity or responsiveness to circulating insulin, is thought to be the pathogenic disorder underlying MS. 6,7 The gold standard for measuring IR is the euglycemic clamp method, but due to the technicalities involved, it is unsuitable for large-scale epidemiological survey. Therefore, surrogates that correlate with direct (clamp) method, such as Homeostasis Model Assessment for Insulin Resistance (HOMA-IR) and Quantitative Insulin Sensitivity Check Index (QUICKI) were developed. 8 Determination of IR with HOMA-IR involves insulin assay that lacked standardization, coupled with the fact that it is a labile hormone. Thus, it is necessary to develop a simple tool to identify IR, and by extension, MS.
Triglyceride-glucose (TyG) index, a product of triglyceride and fasting plasma glucose (FPG) is a novel tool that has been found to correlate with surrogate and direct measures of IR. 9,10 In a study that compared the predictive ability of TyG index and HOMA-IR in identifying IR determined with glucose clamp, the former outperformed the latter. 11 Furthermore, TyG index is strongly associated with, and performed better than HOMA-IR in identifying MS. 12 Finally, TyG-related parameters such as product of TyG and waist circumference (TyG-WC), TyG and waist-to height ratio (TyG-WHtR), TyG and waist-to-hip ratio (TyG-WHpR), and TyG and body mass index (TyG-BMI) improved identification of people with IR. 13
Previous studies that evaluated the usefulness of TyG index were conducted among Americans, Caucasians, and Asians. Blacks have low TG despite the high rates of CVDs, the so-called metabolic paradox. 14 In sub-Sahara Africans with MS, elevated TG has been documented as the least common lipid abnormality. 15 Thus, it is unknown if TyG index can identify MS among blacks. Can TyG index and related parameters identify MS in Nigerians? Is TyG index as effective in identifying MS in Nigerians as it is in other races? This study was aimed at answering these questions. We hypothesize that TyG index may be less effective in identifying MS in Nigerians. Furthermore, we hypothesize that product of TyG index and anthropometric indices will improve prediction of MS.
Methods
To test our hypothesis, we analyzed the data of cross-sectional health screening conducted between August and December 2018, among staff and students of Ekiti State University/Ekiti State University Teaching Hospital (EKSU/EKSUTH), Ado-Ekiti, Nigeria.
Four hundred seventy-three participants, aged ≥18 years were included in this analysis. Participants were recruited using convenient sampling method. Exclusion criteria included pregnant women, those with history of memory or neurological impairments, or both, which would limit reading, talking, or walking. The Research and Ethics Committee of Ekiti State University Teaching Hospital, Ado-Ekiti approved the study protocol (EKSUTH/A67/2018/08/004). Written informed consent was obtained from the participants.
Demographic data of age, gender, marital status, educational attainments, and occupation were obtained from the participants. History of smoking was also obtained.
Anthropometric and blood pressure measurements
Weight (in kilograms) and height (in meters) of participants were determined with bathroom scales and stadiometer, respectively. Waist (at the level of umbilicus) and hip (widest diameter) circumferences (in centimeters) were determined with nonstretchable tape. The body mass index (BMI) was calculated as weight/height 2 , waist-to-hip ratio (WHpR) was calculated as waist circumference/hip circumference, and waist-to-height ratio (WHtR) was calculated as waist circumference/height in centimeters. The blood pressure was determined (while participants were seated), twice with mercury sphygmomanometer, and average taken. The first and fifth Korotkoff sounds were taken as the systolic blood pressure (SBP) and diastolic blood pressure (DBP), respectively.
Laboratory analysis
After an overnight fast, venous sample were obtained through aseptic techniques for plasma glucose and lipids measurements. Plasma glucose was determined by glucose oxidase method. Total cholesterol and TG were determined by enzymatic method. HDL-C was estimated by oxidase/peroxidase method after precipitation of other cholesterol fractions. Low-density lipoprotein cholesterol was calculated by Friedwald equation. All analyses were done with kits by Randox (Randox Laboratories Ltd., UK)
Definition of terms
TyG index and related parameters were calculated as follows: TyG index = Ln[TG (mg/dL) × fasting glucose (mg/dL)/2].
16
TyG-BMI = TyG index × BMI TyG-WC = TyG index × WC TyG-WHpR = TyG index × WHpR TyG-WHtR = TyG index × WHtR.
MS was defined according to the harmonized criteria. 1 These criteria have good concordance with the International Diabetes Federation definition, thus making comparisons among studies possible. 17
Data analysis
Data analysis was done with Statistical Package for Social Sciences (IBM SPSS) version 25 for Windows (IBM Corp., Armonk, NY) and MedCalc Statistical Software version 19.1.5 (MedCalc Software bv, Ostend, Belgium;
Results
Four hundred seventy-three participants comprising 173 (36.6%) men were analyzed for this study, giving a male to female ratio of 1:1.7. The mean age of the participants was 39.2 years. The age, systolic blood pressure (SBP), diastolic blood pressure (DBP), fasting plasma glucose (FPG), TG, HDL-C, TyG index, and TyG-WC of men and women were not significantly different. In comparison with men, women had significantly higher anthropometric and TyG parameters of BMI, WC, and WHtR, TyG-BMI, and TyG-WHtR, but lower WHpR and TyG-WHpR (Table 1).
Clinical Characteristics of the Study Participants
Data were expressed as n (SD), except for smoking history and MS that were expressed as n (%).
BMI, body mass index; DBP, diastolic blood pressure; MS, metabolic syndrome; SBP, systolic blood pressure; SD, standard deviation; TyG, triglyceride-glucose; TyG-BMI, product of TyG and body mass index; TyG-WC, product of TyG and waist circumference; TyG-WHpR, product of TyG and waist-to-hip ratio; TyG-WHtR, product of TyG and waist-to-height ratio; WHpR, waist-to-hip ratio; WHtR, waist-to height ratio.
The ROC curve analyses are shown in Fig. 1A–C, and the corresponding AUCs (95% confidence interval, CI) in Table 2. Table 3 shows the pairwise comparison of the AUCs of WHtR, TyG index, TyG-BMI, TyG-WC, TyG-WHpR, and TyG-WHtR for the detection of MS. All the parameters significantly (P < 0.001) identified MS in all participants and both genders. In all participants, TyG-WHtR shows the largest AUC for MS detection (0.863, 95% CI: 0.828–0.892) followed by TyG-WC (0.858, 95% CI: 0.823–0.888), TyG-BMI (0.838, 95% CI: 0.802–0.870), TyGindex (0.796, 95% CI: 0.757–0.831), WHtR (0.791, 95% CI: 0.752–0.827), and TyG-WHpR (0.771, 95% CI: 0.730–0.808) in that order. Gender analysis revealed that TyG-WC and TyG-WHtR have largest AUC in both genders, suggesting that they have the best discriminating power to identify MS in comparison with other parameters.
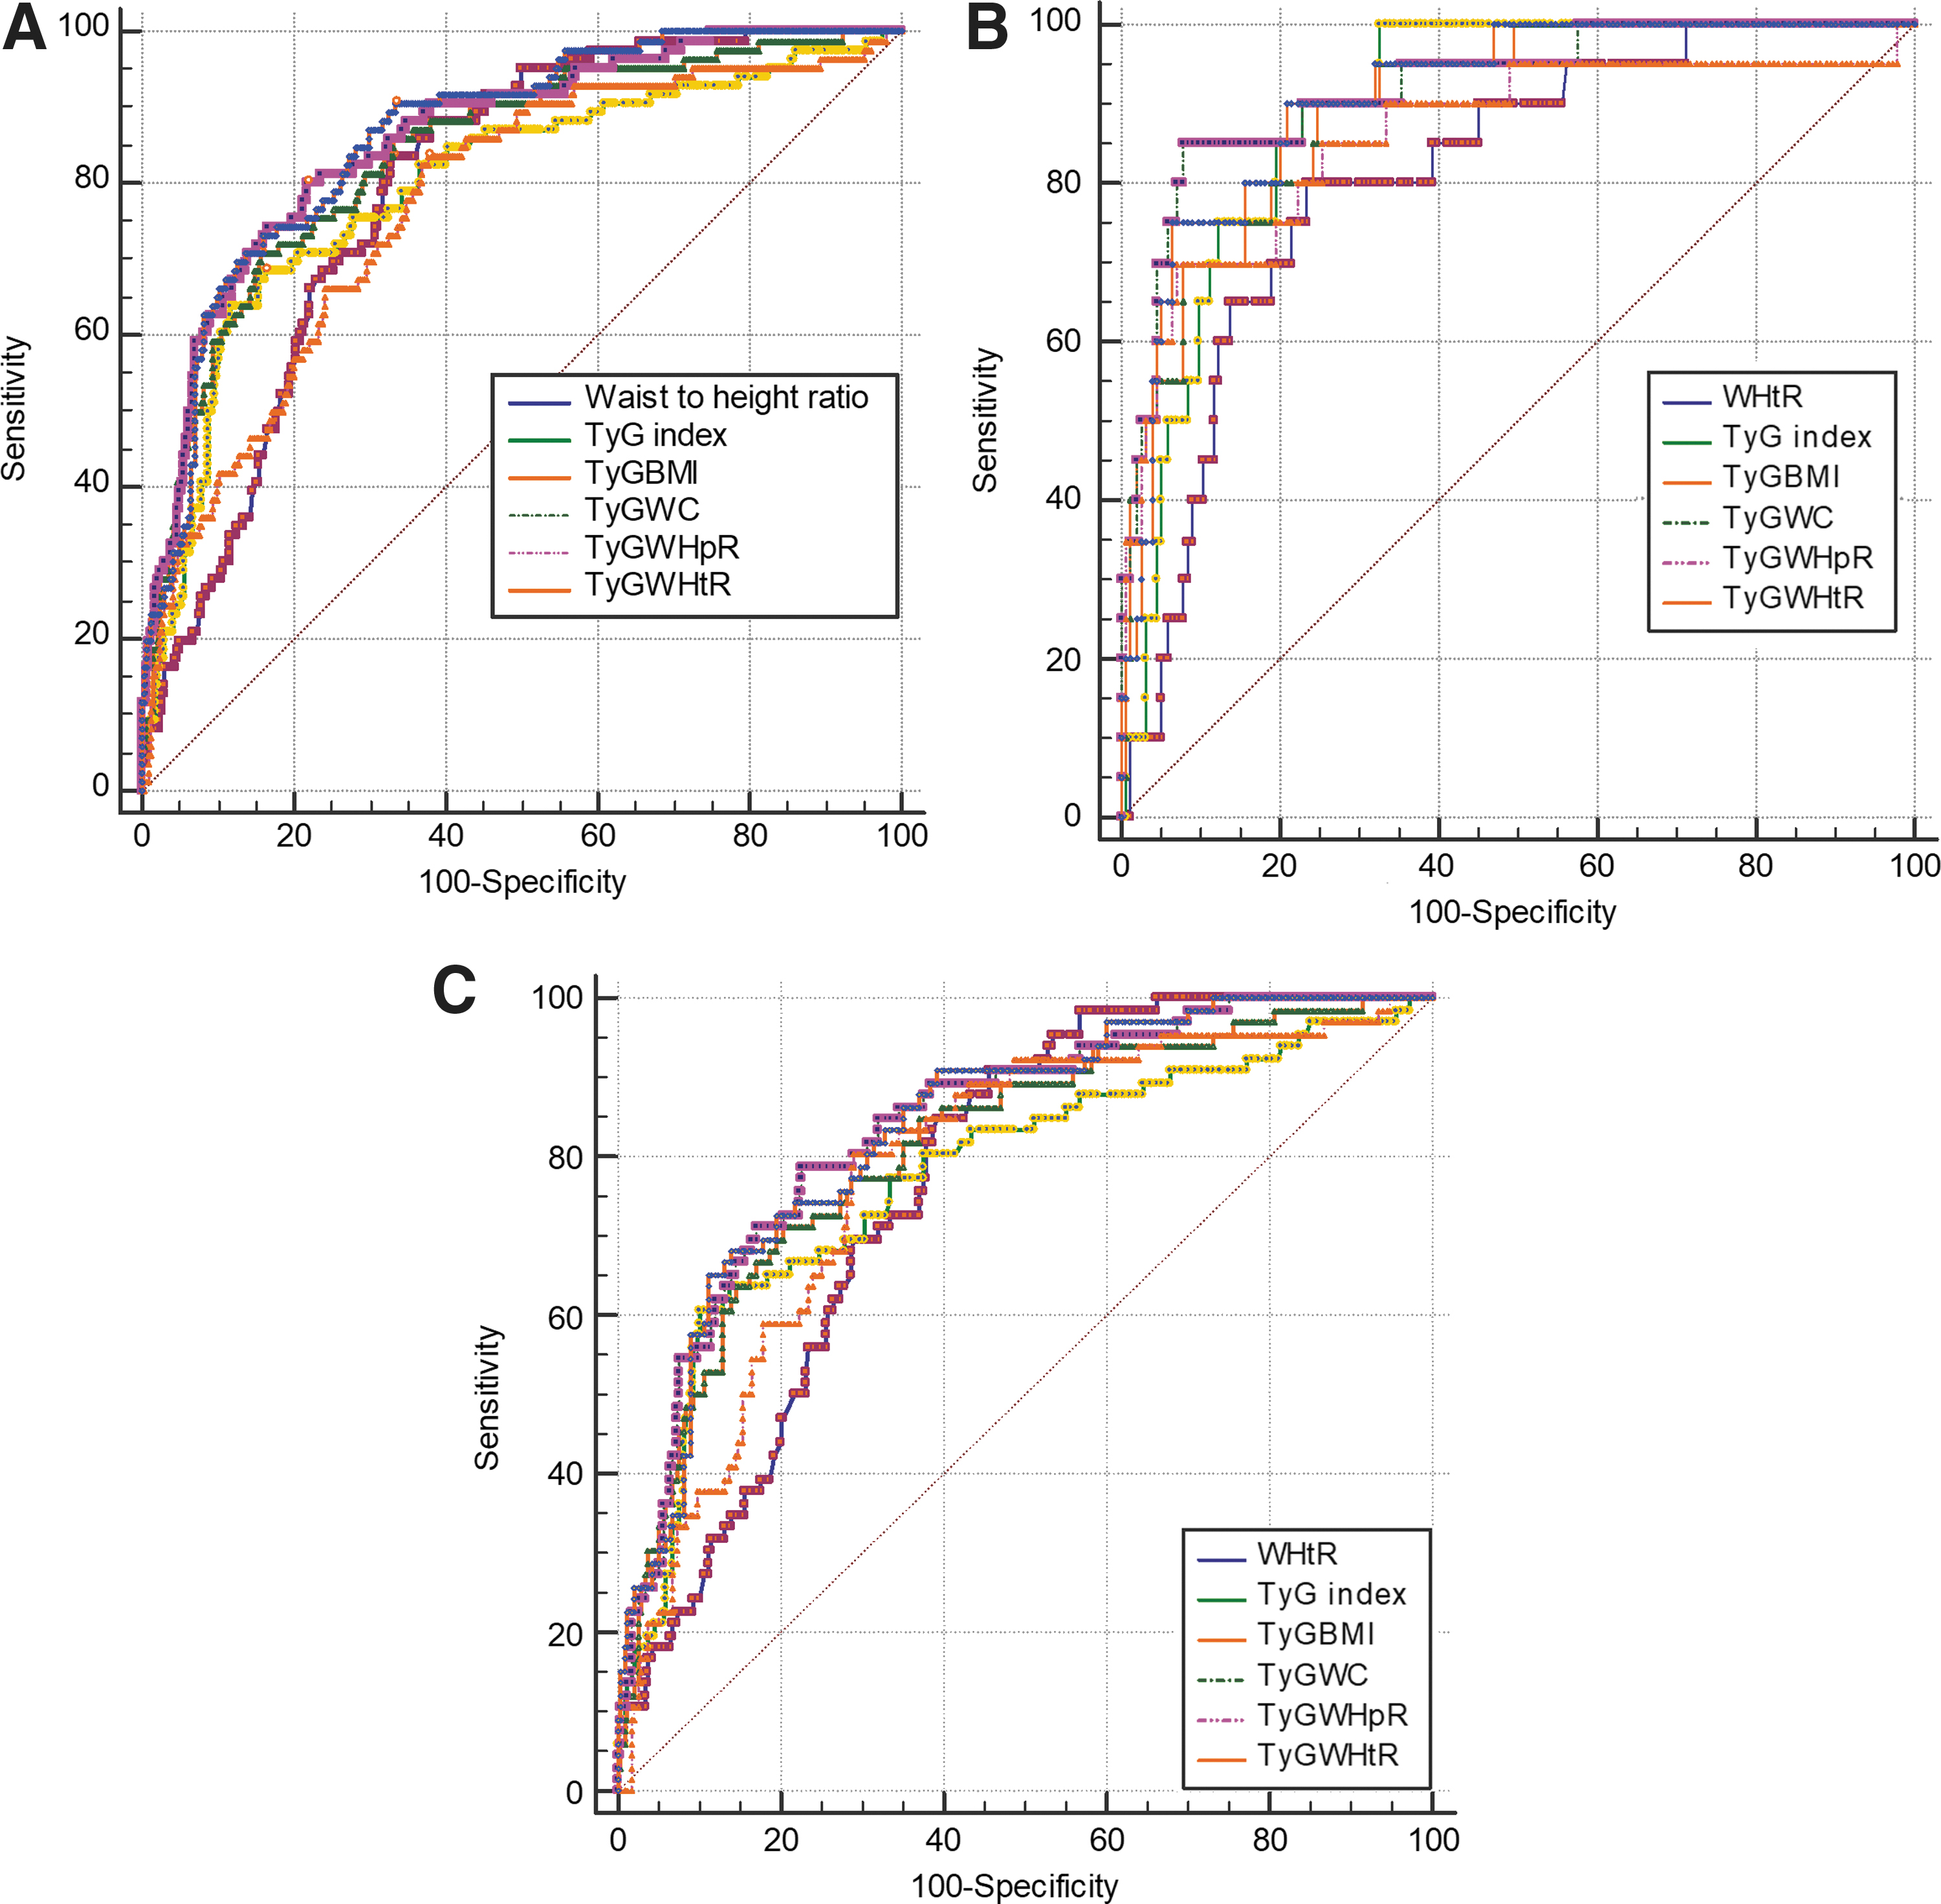
ROC curves for the parameters for identifying MS.
The Areas Under the Receiver Operating Characteristic Curve for Each Parameter for Identifying Metabolic Syndrome
AUC, area under curve; CI, confidence interval; WHtR, waist-to height ratio; TyG-BMI, product of TyG and body mass index; TyG-WC, product of TyG and waist circumference; TyG-WHpR, product of TyG and waist-to-hip ratio; TyG-WHtR, product of TyG and waist-to height ratio.
Pairwise Comparison of Area Under Curve of the Different Parameters
Pairwise comparison of the AUCs showed that compared with WHtR (the reference or standard), TyG index and TyG-WHpR equally (P > 0.05) identified MS in all the participants and both genders. In contrast, TyG-BMI, TyG-WC, and TyG-WHtR were better than WHtR in detecting MS in all the participants (TyG-BMI vs. WHtR, P = 0.0284; TyG-WC vs. WHtR, P = 0.0002; TyG-WHtR vs. WHtR, P < 0.0001) and both men (TyG-BMI vs. WHtR, P = 0.0153; TyG-WC vs. WHtR, P < 0.0001; TyG-WHtR vs. WHtR, P < 0.0001) and women (TyG-WC vs. WHtR, P = 0.0004; TyG-WHtR vs. WHtR, P = 0.0002). In women TyG-BMI was as good as WHtR in identifying MS. Both TyG-WC and TyG-WHtR equally identified MS in all the participants, but were better than TyG index in all participants and women. In men TyG index and all the TyG parameters perform equally in detecting MS.
The result of ORs and 95% CIs for MS before and after adjustment for gender (for all participants), age, smoking, SBP, and DBP is shown in Table 4. Nonsignificant parameters were automatically removed by the software from the model. In a model that included TyG index and TyG parameters, only TyG index and TyG-WHtR significantly predicted MS in all participants and women, before and after adjustment. In men, only TyG index and TyG-BMI significantly predicted MS. Before adjustment, TyG-WHtR presented the highest OR in all participants (6.86, 95% CI: 3.94–11.93) and women (4.11, 95% CI: 2.43–6.95), whereas TyG index presented the highest OR in men (9.12, 95% CI: 2.50–33.33). After adjustment, TyG index presented the highest OR in all participants (5.91, 95% CI: 3.01–11.59) and men (28.36, 95% CI: 4.69–171.63). In all the models, the percentage variation (R 2 ) for MS increased after adjustment.
The Odd Ratios for Metabolic Syndrome
OR, odd ratio; TyG-BMI, product of TyG and body mass index; TyG-WC, product of TyG and waist circumference; TyG-WHpR, product of TyG and waist-to-hip ratio; TyG-WHtR, product of TyG and waist-to height ratio.
Discussion
Identification and prompt management of MS are important to prevent future diabetes and CVD. 2 Because direct measurement of IR, the underlying disorder in MS is difficult to determine in large-scale studies, surrogates are necessary. In this study, we assessed and compared the predictive ability of TyG index, TyG-BMI, TyG-WC, TyG-WHpR, and TyG-WHtR in identifying MS as per the criteria. Furthermore, these were compared with WHtR.
TyG index and all the TyG-related parameters identified MS. Overall, TyG index and TyG-WHpR were as good as WHtR in identifying MS. Furthermore, TyG-WHtR with AUC of 0.863, and TyG-WC with AUC of 0.858 were superior to TyG index and WHtR in all the participants. A combination of TyG index and obesity indices is better than TyG index alone in women but not in men.
Consistent with our finding, previous study by Khan et al. 12 showed that TyG index predicted MS. In their study, TyG index with AUC of 0.764 was superior to other CVD risk factors and IR in identifying MS. However, they neither compared TyG index with any anthropometric index nor with TyG-anthropometric indices. In another Korean study that examined the usefulness of TyG index in identifying metabolically obese but normal weight individuals, Lee et al. 20 found that the index highly predicted MS with a large AUC of between 0.855 and 0.868. A similar study among Chinese also confirmed the predictive ability of TyG index with AUC of 0.863–0.867 depending on the gender. 21
The overall AUC for TyG index (0.796) in our study is similar to that of Pakistan study, 12 but lower than Korean 20 and Chinese 21 studies, suggesting that TyG index may be less predictive in our cohort when compared with the latter populations (Koreans and Chinese). It has been suggested that TG levels may determine the cutoff of TyG index for identifying MS, 22 but whether this is applicable to AUC is doubtful. The mean TG, FPG, and TyG index in our study were lower, despite similar AUC compared with that of the Pakistani study. 12 In comparison with Korean study, 19 our cohort had a higher TG, lower FPG, similar TyG index, but a lower overall AUC. These may imply that the interaction among these parameters in identifying MS is complex and ethnic specific.
In contrast, Lim et al. 13 compared the ability TyG index and related parameters to predict IR. Similar to our findings, they reported that a combination of TyG index and anthropometric indices predicted IR (the underlying disorder in MS) better than TyG alone. Cardiovascular risk factors interact synergistically. Therefore, it is expected that addition or combination of three CVD risk factors should predict MS than only one or two risk factors. Apart from the fact that MS was less prevalent among men, the reason why TyG-related parameters were not better than TyG index alone in men is unclear, since both genders had similar mean TG and FPG. It may, however, be due to variable gender-dependent interaction of CVD risk factors, which has been reported by some workers. 23,24
Our ROC analysis showed that TyG-WHtR and TyG-WC outperformed other indices in all participants and women. Further, TyG-WHtR showed the highest OR in all participants and women before adjustment. TyG-WHtR appear to be the best of all the parameters studied. Thus, combining TyG and WHtR may be valuable in identifying MS in our cohort. Both WC and WHtR are markers of visceral fat that has been found to correlate more with CVD than BMI, a measure of general obesity. 25 Because WHtR corrected for height, it may be better than WC. Indeed, it was reported that WHtR identified people with early health risks better than a matrix that combined BMI and WC. 26,27 In a study that compared the predictive ability of multiple anthropometric indices and other parameters, TyG-WC was reported to be the best. 28 But TyG-WHtR was not included for comparison in their study.
Similar studies for comparison are lacking in our environment. But WHtR was earlier reported to be superior to WC in identifying CVD risk factors. 18 Reports of a multicountry study on performance of anthropometric indices for identification of cardiometabolic disorders in sub-Sahara Africa also confirmed our finding. 15 In the aforementioned study involving >19,000 participants, WHtR was as good as WC but better than BMI and WHpR in all the cohort and men. It was, however, the best index in women. It is, therefore, not surprising that TyG-WHtR was the best predictor of MS in this study.
Strength and limitations
Our study has strength and limitations. First, this is the first study in our environment to evaluate the usefulness of TyG index and TyG-related parameters (involving commonly used anthropometric indices) to detect MS. Because definition of MS is ethnic specific, our findings is not generalizable. Furthermore, the cutoff of TyG index for identifying MS was not determined.
Conclusions
TyG index is effective in identifying MS in this cross-sectional study. Furthermore, the product of TyG index and anthropometric indices improved identification and prediction of MS.
Footnotes
Author Disclosure Statement
No conflicting financial interests exist.
Funding Information
No funding was received for this work.