
Abstract
Background:
Higher medical care costs have been associated with the number of metabolic syndrome components present, but the association with future medical costs has not been described. Furthermore, the independent cost contribution of each component alone and in combination with other components is unknown.
Methods:
We identified 57,420 nondiabetic adults aged ≥30 with all metabolic syndrome components measured in 2003–2004 and with 5 years of follow-up data available. We calculated and compared total annualized direct medical costs across the number of metabolic syndrome components present and for all possible combinations of metabolic syndrome components. The independent contribution to costs of each component was isolated by adjusting for age, sex, the other metabolic syndrome components, incident diabetes, number of years with diabetes, cardiovascular (CVD) hospitalization, and years after hospitalization.
Results:
Annualized age- and sex-adjusted medical costs incurred over follow-up increased with each additional metabolic syndrome component present. After full adjustment, hypertension ($550), obesity ($366), low high-density lipoprotein (HDL) ($363), and high triglycerides ($317) were significantly associated with higher annual costs (P < 0.001 for all), but impaired fasting glucose was not. Further analysis indicated that costs were significantly elevated for each of these components only among those who did not develop diabetes or were not hospitalized for CVD.
Conclusions:
Incident diabetes or CVD hospitalizations accounted for the association between each metabolic syndrome component and future costs when these events occurred, but the elevated costs associated with metabolic syndrome components were observed even when these events did not occur. Further research is needed to understand the underlying morbidity that is driving the increased costs.
Introduction
One possible use of metabolic syndrome is to target cost-effective strategies for reduction of CVD and diabetes risk, which would require a thorough understanding of costs associated with metabolic syndrome and its individual components. To our knowledge, however, such research is lacking. Some prior work has demonstrated elevated medical costs associated with impaired fasting glucose 7 and obesity, 8 but did not account for the interplay of other metabolic syndrome components. One study that did examine individual metabolic syndrome components was limited to elderly persons and included patients with established diabetes. 9 A recent cross-sectional analysis that examined costs for all combinations of metabolic syndrome components could not determine the effect of those components on future costs. 10 It is possible, however, that associations between future costs and metabolic syndrome could be entirely attributable to incident diabetes or CVD events. Therefore, we undertook the current analysis to isolate the contribution of each metabolic syndrome component to medical costs incurred over 5 years while accounting for the development of diabetes and CVD hospitalizations.
Methods
The study sample was drawn from members of Kaiser Permanente Northwest (KPNW), a closed group practice health maintenance organization located in Portland, Oregon. KPNW maintains comprehensive medical utilization data that includes an electronic medical record of all patient encounters, laboratory results that are analyzed by a single regional laboratory using standardized methods, and dispensing records from pharmacies located in all clinics.
Study sample
For this study, we identified 57,420 nonpregnant adults age 30 or older who had no prior evidence of diabetes and had all metabolic syndrome components measured in 2003 or 2004. The five components of the metabolic syndrome are: (1) Elevated fasting glucose (≥100 mg/dL); (2) elevated blood pressure (systolic ≥130 mmHg or diastolic ≥85 mmHg or on antihypertensive drug treatment); (3) reduced high-density lipoprotein cholesterol (HDL-C) (<40 mg/dL in men or <50 mg/dL in women or on drug treatment); (4) elevated triglycerides (≥150 mg/dL or on drug treatment); and (5) elevated waist circumference. Because waist circumference is rarely measured or recorded in the medical record, we substituted body mass index (BMI) for the waist circumference criterion, using the cut-point of >28.8 kg/m2 as used in other published studies. 11,12 We included only those who remained KPNW members for at least 5 years following the date that the last of the metabolic syndrome components was measured (index date), intentionally allowing measurement to occur over 2 calendar years (2003 and 2004) to minimize selection bias that could occur from clinical diagnostic workups.
Follow-up period
All subjects were followed for 5 years from the index date. New onset of diabetes was defined as an inpatient or outpatient diagnosis [International Classification of Diseases, 9th Revision, Clinical Modification (ICD-9-CM codes 250.xx)], a dispensing of an antihyperglycemic medication, or a fasting plasma glucose result >125 mg/dL. To avoid misclassifying patients using metformin to prevent diabetes, a metformin dispense without a coded diagnosis did not constitute incident diabetes. The first date that any of the above diagnostic criteria occurred was defined as the diabetes incidence date. CVD hospitalizations were identified from hospitalization records where the first-listed discharge diagnosis included myocardial infarction (ICD-9-CM 410.xx), unstable angina (411.1, 411.81, 411.89), other ischemic heart disease (413.xx, 414.xx), or cerebrovascular disease (430.xx–436.xx, 437.1). The admission date of the first such hospitalization was defined as the CVD event date.
Costing methods
Total direct medical costs were calculated for an individual's entire 5-year follow-up period. We based our costing method on procedures developed and validated by the Kaiser Permanente Center for Health Research. 13,14 For outpatient costs, this method creates standard costs for office visits by specialty/department and type of clinician (M.D. vs. physician assistant/nurse practitioner). The number of visits per department per clinician type is then multiplied by the appropriate unit cost. Pharmaceutical costs are based on retail prices within the service area. Hospitalizations were assigned to diagnosis-related groups (DRGs) based on the primary reason for hospitalization. The average daily rate per DRG was then multiplied by the length of stay. Costs for medical services incurred at facilities not owned by KPNW were derived from an automated claims system and were based on the amount paid by KPNW to the nonplan provider. Thus, although the costs reported herein may be specific to KPNW, they approximate the charges a nonmember would be billed if these services were purchased from KPNW. These costs represent the payer's perspective, so out-of-pocket and indirect costs are not included. All costs were adjusted to 2009 U.S. dollars using the medical care component of the Consumer Price Index and then annualized on an individual basis by dividing by 5. To estimate annual costs before and after incident diabetes or a CVD event, we summed each individual's costs over the pre and post periods separately, divided by the number of months of observation in the appropriate period, then multiplied by 12.
Statistical analyses
All analyses were conducted using SAS version 8.2 (SAS Institute, Cary, NC). All costs reported herein are adjusted for age and sex using the least-squares means (LSMEANS) in PROC GLM. We constructed a series of seven models to isolate the independent contribution of each metabolic syndrome component. The first five models included only age, sex, and each individual component. The sixth model included age, sex, and all five metabolic syndrome components. The final model also included dichotomous variables for incident diabetes and presence of a CVD hospitalization during follow-up, the number of years of observation an individual had diabetes, and the number of years of follow-up after the occurrence of a CVD event. Cost data are typically nonnormal, but we found that normalizing the data via log transformation did not change the direction or statistical significance of the results. Therefore, we report untransformed costs to allow for straightforward interpretation of the parameter estimates.
Results
Age, sex, and the proportion of the sample with each of the metabolic syndrome components are displayed in Table 1, stratified by the number of metabolic syndrome components present. Also shown is the proportion with CVD at baseline, the proportion that developed diabetes, and the proportions that experienced a CVD hospitalization during the 5-year follow-up period. All of these proportions increased with the number of metabolic syndrome components present. Annualized age- and sex-adjusted medical costs incurred over follow-up increased with each additional metabolic syndrome component present (Fig. 1). All incremental differences between the number of components were statistically significantly different (P < 0.001) except between presence of three and four components (P = 0.058). A detailed table displaying the proportion developing diabetes, the proportion experiencing a CVD hospitalization, and the age/sex-adjusted annualized costs associated with all possible combinations of metabolic syndrome criteria is available online (Supplementary Table 1, Supplementary Data are available online at
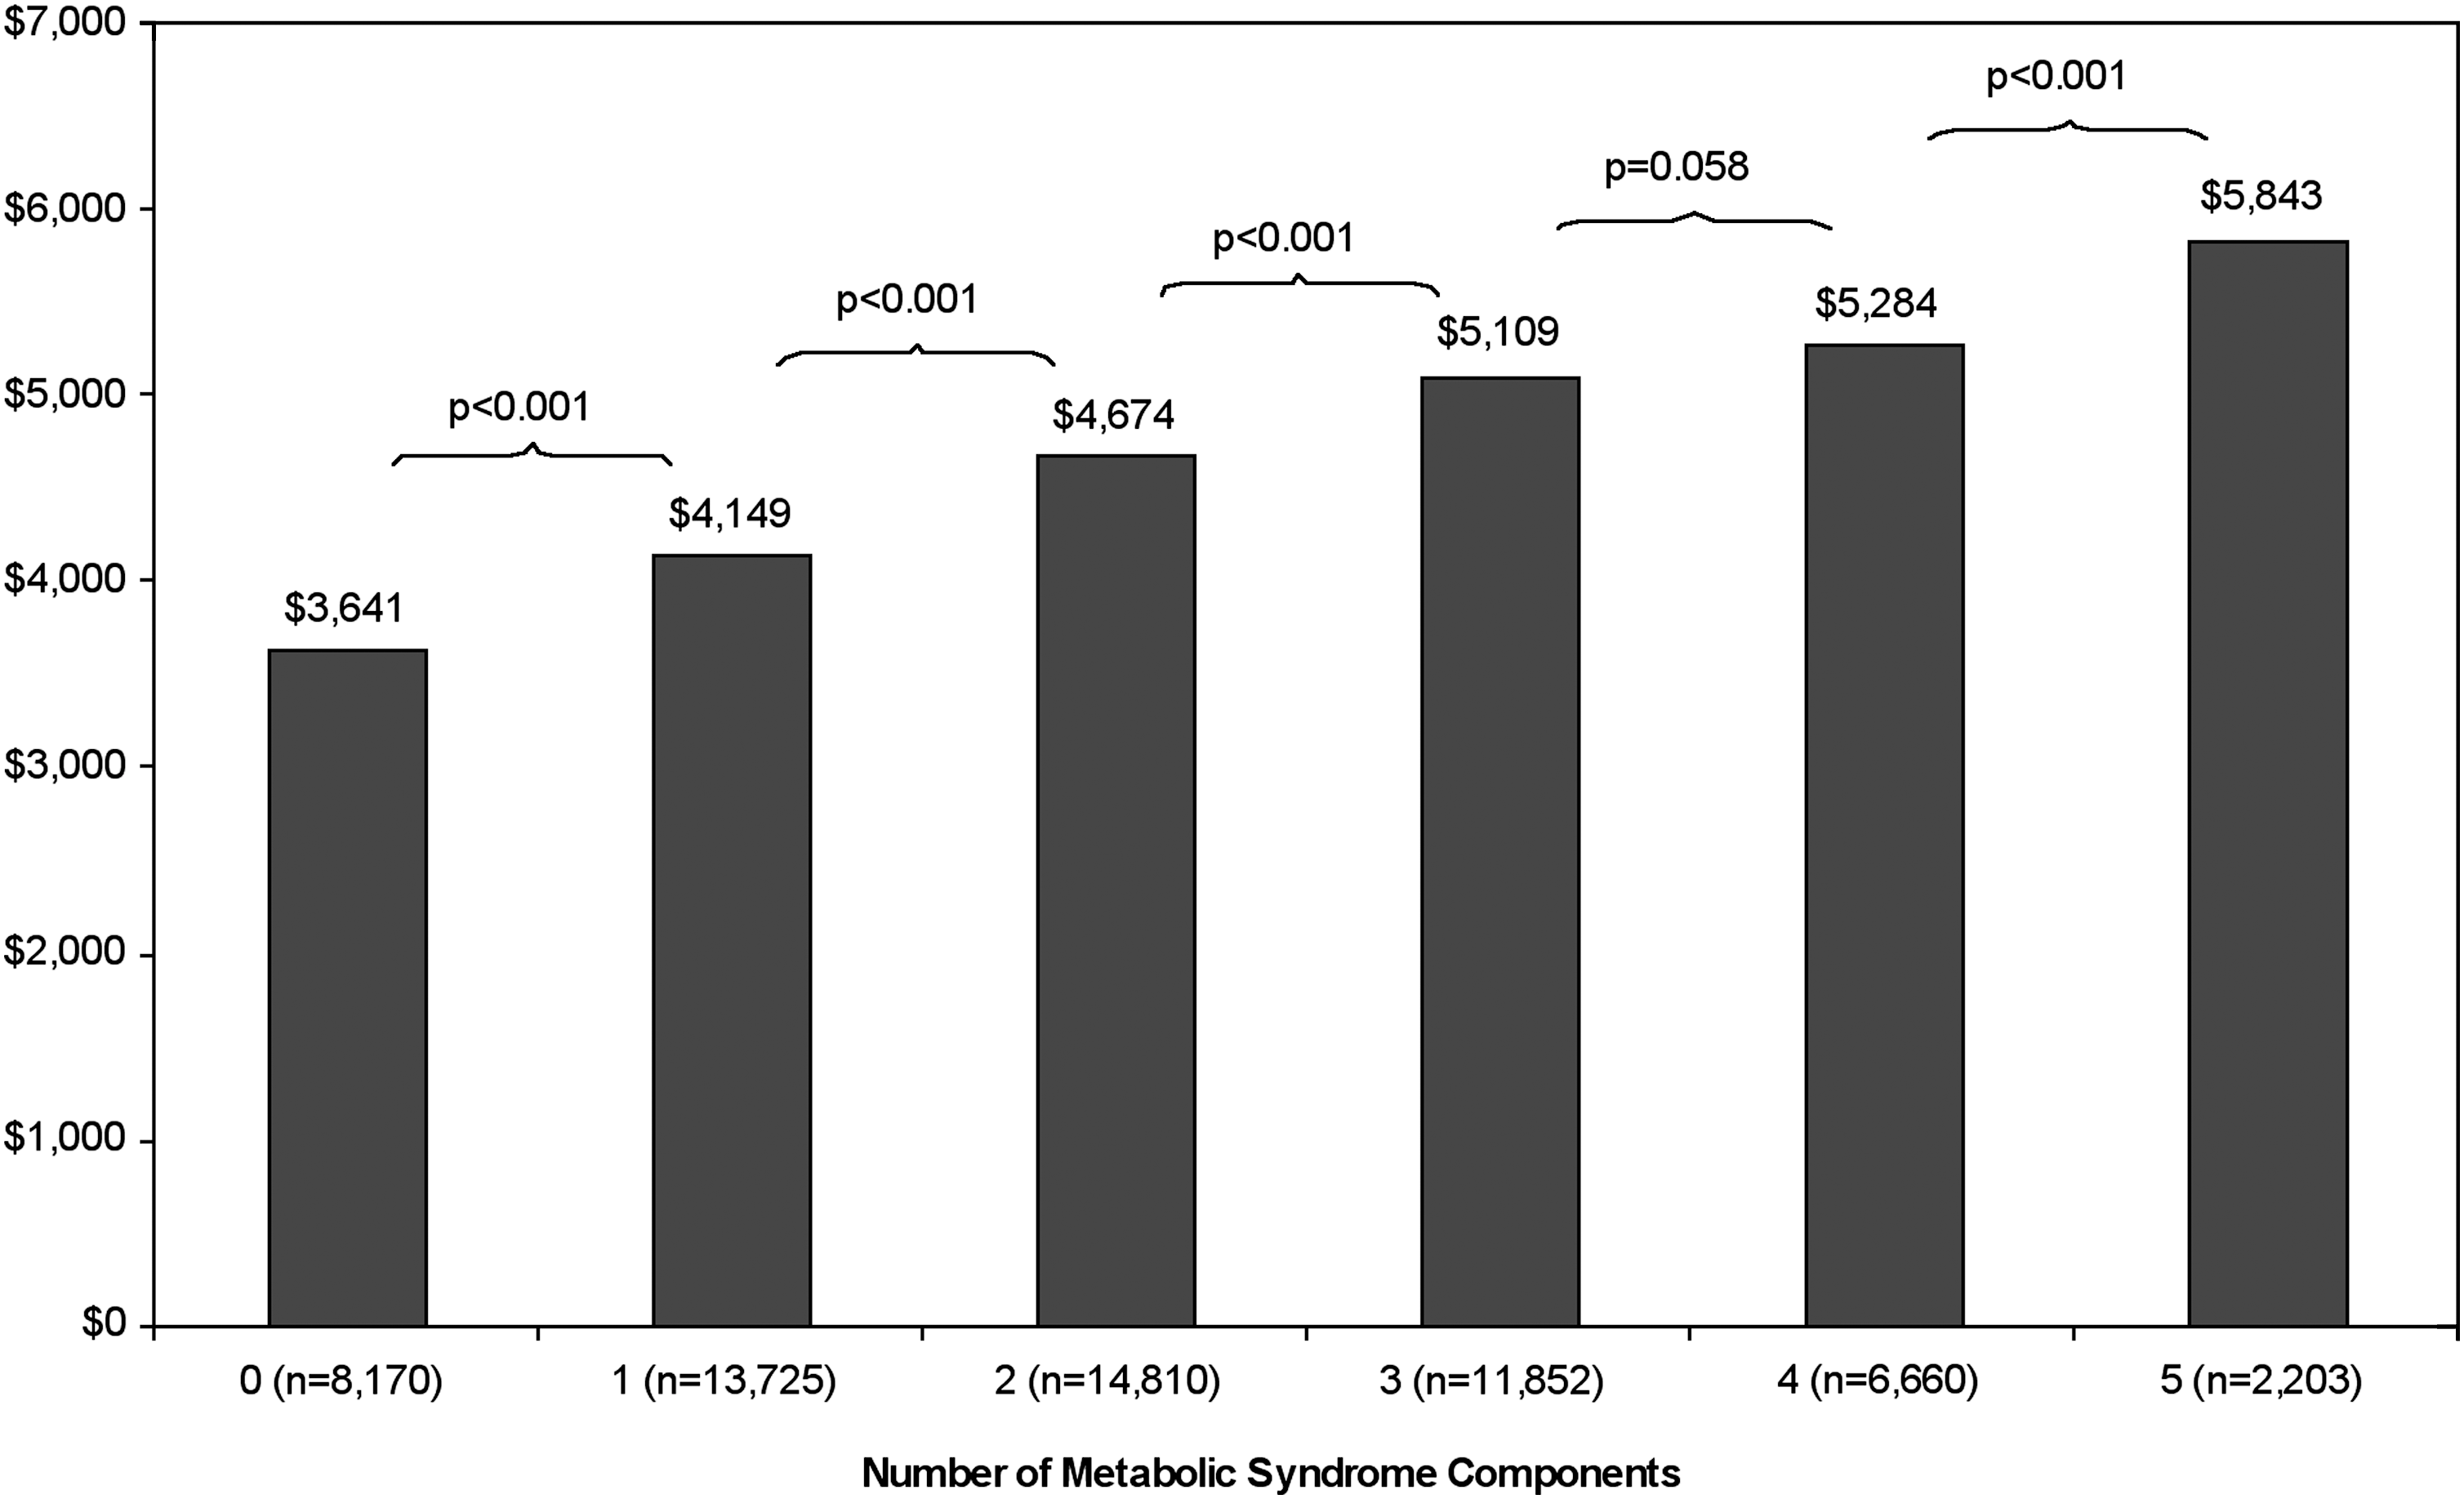
Annualized medical care costs incurred over 5 years following measurement of metabolic syndrome components, by number of component present at baseline.
Table 2 shows the results of the seven multivariable models. When analyzed individually, each of the components of metabolic syndrome was significantly associated with higher medical costs over the ensuing 5 years, with parameter estimates ranging from $423 for impaired fasting glucose (IFG) to $888 for hypertension (P < 0.001 for all components). When analyzed simultaneously, the parameter estimate for IFG declined to $161 (P = 0.006). Estimates for the other components also declined, but remained highly statistically significant. Further adjustment for incident diabetes, years with diabetes, a CVD hospitalization, and years post-CVD hospitalization modestly attenuated the size but not the significance of the estimates for high BMI, hypertension, low HDL, and high triglycerides. IFG, however, was no longer associated with future costs after these adjustments.
Models 1 through 5 include age, sex, and each individual metabolic syndrome component. Model 6 includes age, sex and all five metabolic syndrome components. Model 7 adds incident diabetes (yes/no), years with diabetes, CVD hospitalization (yes/no), and years since CVD hospitalization to model 6.
Individual parameter estimates for age were: Model 1 (IFG), $79; model 2 (BMI) $83; model 3 (hypertension) $70; model 4 (low HDL) $84; and model 5 (high triglycerides) $80.
Individual parameter estimates for female sex were: Model 1 (IFG) $250; model 2 (BMI) $226; model 3 (hypertension) $250; model 4 (low HDL) $197; and model 5 (high triglycerides) $255.
Individual intercepts (p values) were: Model 1 (IFG) −$128 (0.317); model 2 (BMI) −$597 (<0.001); model 3 (hypertension) −$78 (0.536); model 4 (low HDL) −$469 (<0.001); and model 5 (high triglycerides) −$334 (0.009).
CVD, cardiovascular disease; IFG, impaired fasting glucose; BMI, body mass index; HDL, high-density lipoprotein.
Annualized medical costs in total and for those with and without diabetes are displayed in Table 3 (adjusted for age, sex, and all five metabolic syndrome components) separately for the presence/absence of each metabolic syndrome component. For patients who developed diabetes, annualized costs are shown before and after diabetes, and the difference is shown in the “diabetes specific effect” column. The “general diabetes effect” column represents the difference between annualized costs for those who did not develop diabetes and costs following diabetes among those who developed it. Costs were nearly identical for patients with and without IFG who did not develop diabetes. However, costs were substantially elevated among those without IFG who did develop diabetes, both before and after diabetes incidence, creating a sizeable negative component effect that was statistically significant. For each of the other metabolic syndrome components, costs were significantly greater when the component was present among those who did not develop diabetes, but were not statistically significantly different among those who developed diabetes, either before or after diabetes incidence. Interestingly, costs among those who developed diabetes were already higher compared to patients who did not develop diabetes.
Difference in costs before and after diabetes developed.
Difference between costs for those who did not develop diabetes and postdiabetes costs for those with incident diabetes.
Table 4 shows adjusted annualized costs for each metabolic syndrome component in total and among those who did and did not experience a CVD hospitalization. Costs for patients with and without IFG did not differ, regardless of whether a CVD hospitalization occurred. For each of the other metabolic syndrome components, costs were significantly greater when the component was present among those who did not have a CVD event, but did not differ among those who did, either before or after the event. A CVD hospitalization increased costs by $11,000–$12,000 for all patients. As with diabetes, patients who experienced a CVD hospitalization had higher costs prior to the event compared to individuals who were not hospitalized.
Difference in costs before and after CVD hospitalization among those who experienced a CVD hospitalization developed.
Difference between costs for those who did not experience a CVD hospitalization and posthospitalization costs for those with who experienced a CVD hospitalization.
CVD, cardiovascular disease.
Discussion
In this observational longitudinal cohort study of over 57,000 individuals, we found that medical care costs incurred over 5 years of follow-up were associated with the number of metabolic syndrome components present at baseline. Our results confirm previous research demonstrating an association between number of metabolic syndrome components and current medical costs. 10,15 To our knowledge, however, ours is the first study to report an association between metabolic syndrome components and future medical care costs.
Perhaps more importantly, ours is the first study to examine the individual contribution of each metabolic syndrome component to medical costs in a representative sample. Our results were generally consistent with findings from the Cardiovascular Health Study, which included only elderly individuals age 65 or older, some of whom already had diabetes, making direct comparisons difficult. 9 Although other previous research has examined costs associated with obesity, 16 IFG, 7 and hypertension, 17,18 none have done so while simultaneously evaluating the contribution to costs in the context of other cardiometabolic risk factors.
We found that each individual metabolic syndrome component was associated with higher costs independent of the other components, and with the exception of IFG, the significant associations persisted after accounting for diabetes incidence and CVD hospitalizations. Upon further analysis, we demonstrated that increased costs were statistically significantly higher when a given metabolic syndrome component was present only among those who did not develop diabetes or who did not experience a CVD event. This is likely due to the fact that the independent contribution of the metabolic syndrome components was a few hundred dollars per year, whereas the annual cost of incident diabetes and CVD events was approximately $3,000 and $13,000, respectively. Thus, the occurrence of either of these high cost events likely overwhelmed the relatively small effect of the metabolic syndrome components.
Given the enormous burden of diabetes 19 and cardiovascular disease, 20 it was no surprise that we found persons who experienced these events incurred much higher medical costs. However, these were relatively uncommon events, even among those with multiple risk factors. Furthermore, we found that relative to those who did not develop diabetes or experience a CVD hospitalization, medical costs were already elevated prior to occurrence of these events. This has been previously reported in diabetes, 21 but not, to our knowledge, in CVD. Notably, we found that among those who developed diabetes, costs were significantly greater for patients without IFG compared to those with IFG. It is possible that many of these patients had impaired glucose tolerance, which has previously been shown to be associated with substantially greater costs relative to those with IFG. 22 Unfortunately, oral glucose tolerance tests are not routinely performed in our study setting. In any case, the finding that patients had elevated medical costs prior to incident diabetes or a CVD hospitalization was consistent regardless of whether a given metabolic syndrome component was present, suggesting that these patients are already experiencing significant morbidity that is not captured by presence of metabolic syndrome components. Taken together, these results highlight the importance of identifying who among those with or without any given risk factor, or combination of factors, are most likely to experience these high-cost events so that prevention strategies can be appropriately targeted.
Several limitations deserve note. By including only patients who had all five metabolic syndrome components measured, we excluded patients who were likely to be lower users of health services, which would result in an overestimate of medical costs. However, the relative contribution to costs of each of the metabolic syndrome components and the impact of incident diabetes or CVD events may or may not have been affected by our design. We assessed metabolic syndrome components only at baseline. Patients with a baseline set of metabolic syndrome criteria could have subsequently met additional criteria, which would result in the misassignment of costs. In addition, all study subjects were required to remain continuously enrolled for 5 years. Whether those who died and disenrolled earlier would have experienced similar costs could not be determined. Last, the organizational structure of KPNW is somewhat unique and might produce a different cost function than in other settings. Although this could impact absolute costs, it should have less effect on relative cost comparisons of metabolic syndrome components.
In conclusion, we found that the presence of each individual metabolic syndrome component was associated with higher future medical costs. Incident diabetes or CVD hospitalizations accounted for much of the cost increases, but the elevated costs were associated with the presence of metabolic syndrome components, even when these events did not occur. Further research is needed to understand the underlying morbidity that is driving the increased costs. In addition, prediction tools that better identify which patients will incur subsequent medical care costs could enhance prevention efforts.
Footnotes
Acknowledgment
The authors wish to thank A. Gabriela Rosales, M.S. for her assistance with the statistical analyses.
Author Disclosure Statement
The study was funded by Tethys Bioscience, Inc., and the coauthor (E.J.M.) is an employee and stockholder of that organization. Dr. Moler assisted with design of the study, interpretation of the data, and review of the manuscript. Dr. Nichols had full access to the all the data in the study and takes full responsibility for the integrity of the data and the accuracy of the data analysis. Dr. Nichols also has current research funding from Takeda Pharmaceuticals America, GlaxoSmithKline, and Novartis Pharmaceuticals.
References
Supplementary Material
Please find the following supplemental material available below.
For Open Access articles published under a Creative Commons License, all supplemental material carries the same license as the article it is associated with.
For non-Open Access articles published, all supplemental material carries a non-exclusive license, and permission requests for re-use of supplemental material or any part of supplemental material shall be sent directly to the copyright owner as specified in the copyright notice associated with the article.