
Abstract
Background:
Chronic edema management depends on measuring small volume changes over time. Therefore, a highly sensitive, accurate, and reliable technique is needed to objectively judge sequential measurements.
Methods and Results:
The prototype of the Peracutus Aqua Meth (PAM), a new volumetric measuring device, was used in an experimental study. Thirty-nine healthy test subjects were measured three times. The measuring principle of the PAM is based on obtaining a profile of cross-sectional areas along the length of an object or limb. Besides total arm volumes, the volume of any chosen segment can be determined. The utmost tip of the middle finger appeared to be an unreliable reference point. Instead, the concept of “hand median” was introduced to align and compare profiles of cross-sectional areas of sequential measurements. Using the hand median strongly improved the measuring accuracy, rendering standard deviation values of 0.4%–1.3% for (segmental) volume determination.
Conclusions:
Measurements with the PAM show that accurate local/segmental volume determination of a limb is possible. Standard deviations of less than 1.3% are easily obtained for cross-sectional area and volume determination.
Introduction
Chronic edema is a pathological condition and may result in visible swollen limbs or any other body part. It is characterized by the progressive development of excess tissue over time through a geometric and quantitative expansion of the extracellular matrix and the local cells.1,2 Chronic edema may be caused by venous insufficiency, 3 deep vein thrombosis, 4 hereditary angioedema, 4 congestion, 5 and certain forms of trauma 5 like breast cancer treatment,6–11 infections, 12 or by various other conditions.3,13,14
Chronic edema can be difficult to diagnose, especially in early stages if the edema is less and temporary. Delays in accurate diagnosis cause increased severity of chronic edema, secondary fibrosis, and fat formation. Early treatment usually provides rapid recovery and can prevent the formation of chronic changes.15,16
In chronic edema management measuring volume changes over time is essential. 17 As the changes are generally small in human limbs, the detection of edema in the latent phase poses significant challenges. 16 Therefore, a highly sensitive, accurate, and reliable technique is needed to objectively judge sequential measurements whether a true change has occurred during the process of care or treatment, and plan appropriate management.16–18
Recently, a new measuring principle was presented based on obtaining a profile of cross-sectional areas along the length of an object and a limb. The prototype of the new device, the Peracutus Aqua Meth (PAM, Peracutus B.V.), and method were described in detail elsewhere. 19 The PAM was used to render profiles of cross-sectional areas of static objects as well as of the arm of a test subject, showing that accurate, local volume determination is possible. 19
The accuracy of a measurement method deals with trueness (true value obtained with a measurement standard also known as etalon) and precision. 20 Under idealized conditions, the trueness of the PAM compared with calipers was less than 1.3% and the precision was less than 0.37%. 19
The PAM was previously utilized in an experimental study by Wolfs et al. 21 measuring 39 test subjects. The validity and reliability of the first prototype of the PAM has been compared with the Bravometer.22–24 The emphasis was then on measuring total volume of the arm. We processed the same measurement data obtained by Wolfs et al. 21 in a different way. Measuring a human limb is more challenging than measuring static objects and will probably have an impact on precision. In this article we therefore focused on the precision by means of repeatability and reproducibility of measuring limb profiles of cross-sectional areas and volumes of limb segments.
The utmost tip of the middle finger appeared to be an unreliable reference point, and the concept of “hand median” is introduced instead in order to align and compare profiles of cross-sectional areas of sequential measurements in an objective way. Using the hand median ensures a strong improvement of the measuring accuracy. In this article we show how accurate and reliable this concept is for determining cross-sectional areas and (segmental) volumes, based on multiple measurements of test subjects.
Materials and Methods
Measurement principle
The measuring method and device are described extensively. 19 In short: An arm is placed vertically in a cylinder filled with water. During emptying of the cylinder at a nearly constant flow rate the change of the water level is recorded continuously using a pressure sensor at the bottom. The change of the water surface level, that is, dh/dt, is influenced by the cross-sectional area of the finger, hand, and the rest of the arm. This results in a profile of cross-sectional areas as function of the height of the water column, that is, the position of the arm in the cylinder. The volume of any chosen segment can be determined based on the profile. For calibration purposes the profile of the cross-sectional areas is related to the system profile. This profile is based on the water surface level change dh/dt measured in the absence of an object or limb.
Reference position on the arm
In the arm profile belonging to one measurement (Figs. 1 and 2A) the wrist position (W), that is, the valley in the graph right next to the hand maximum (M), is selected and a horizontal line is drawn to the left as far as it cuts the graph (L). The line thus connects two positions on the hand having equal cross-sectional areas, the hand maximum (M) being somewhere in between. Subsequently, the hand median (HM) is determined mathematically by drawing a vertical line dividing the area between the graph and the horizontal line in two equally sized areas: area left (AL) and area right (AR). In this way the initial selection of the wrist position is expected not to be crucial as a (small) shift to the left or right would not contribute much to the size of the resulting areas in the graph and therefore hardly change the position of the hand median. The purpose is that the position of the hand median serves as the reference/start position for the cross-sectional areas from the wrist to the upper arm. We expect the hand median position to be a well-defined location that facilitates comparing cross-sectional areas and volumes of subsequent arm measurements of one subject.
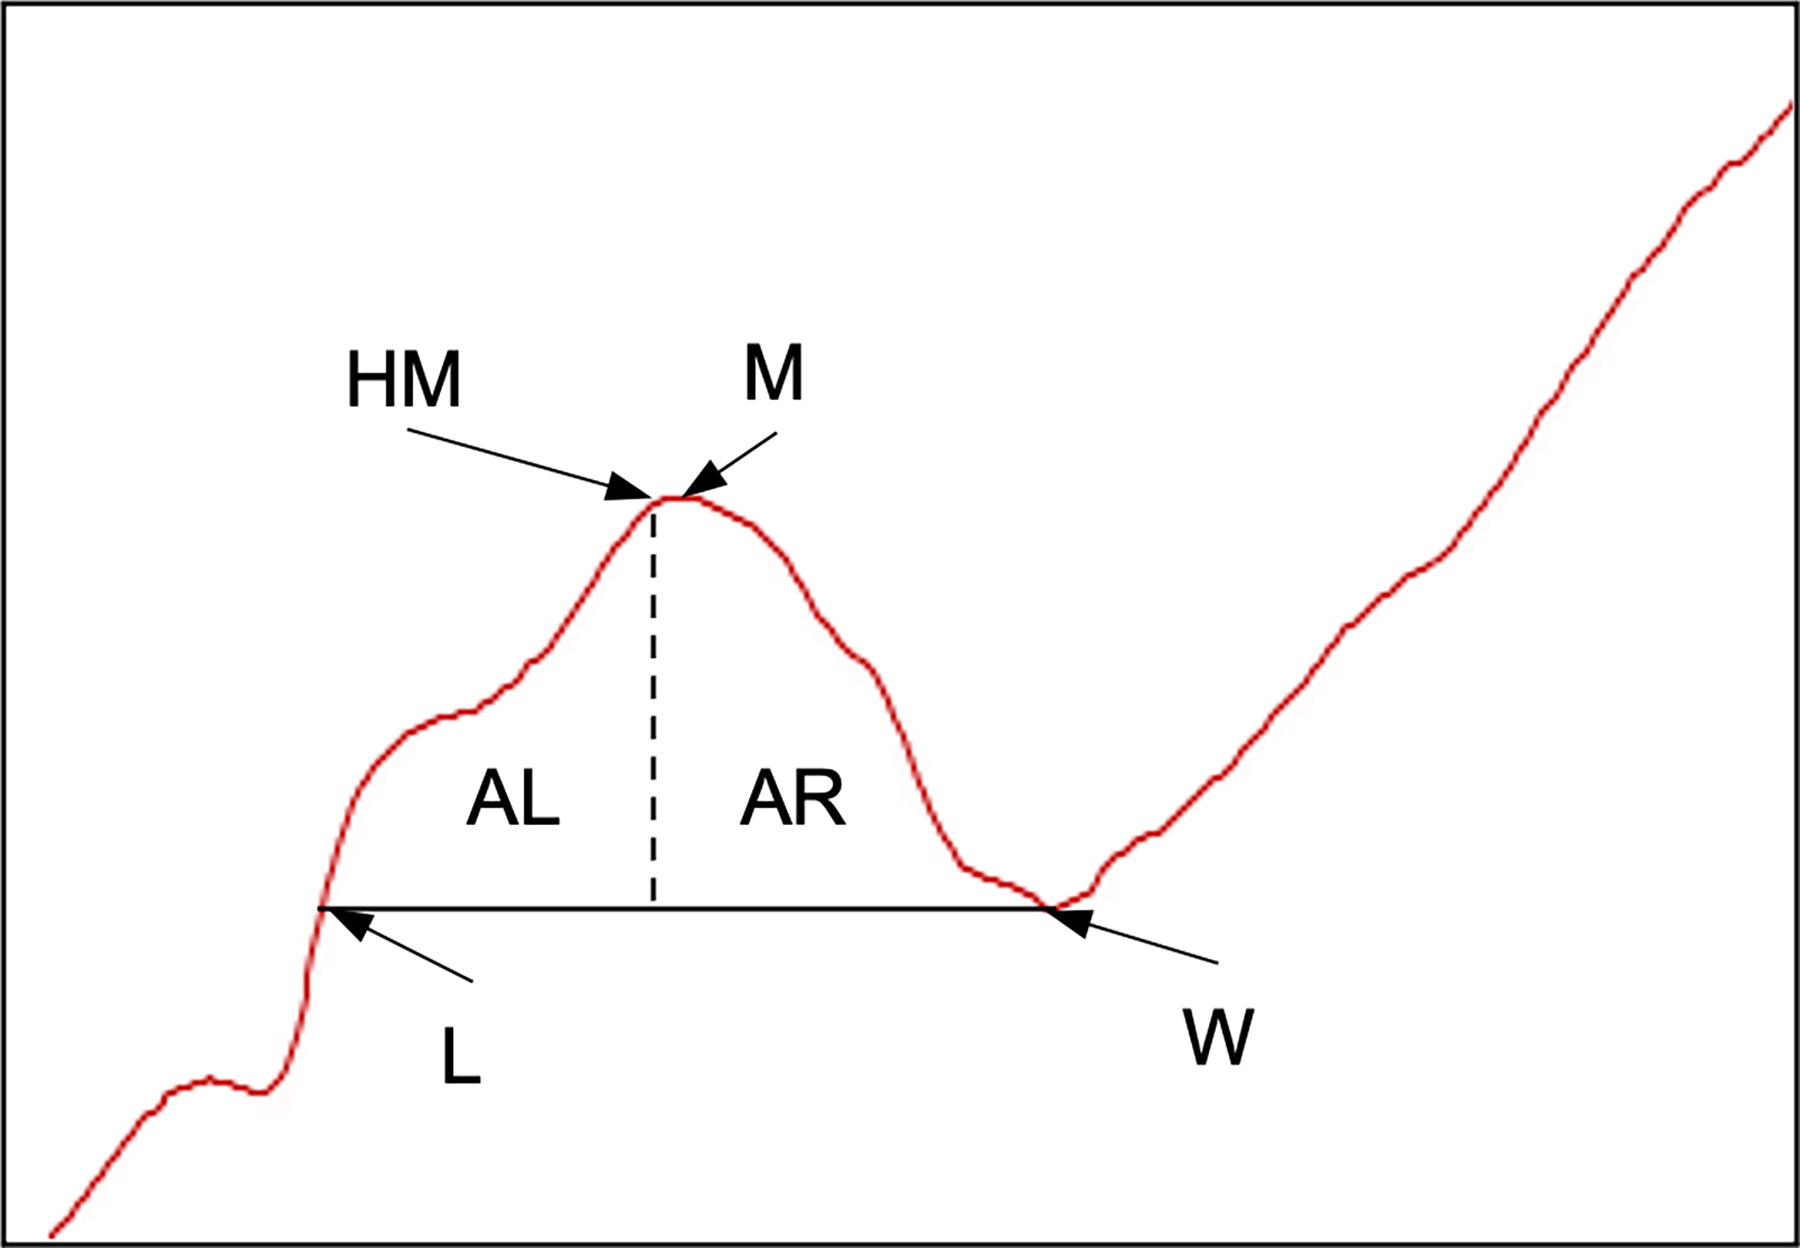
Graphic representation of determining the hand median. The graph corresponds to the first measurement in Figure 2.
For explanatory reasons and to demonstrate accuracy and reliability the arm was divided in different segments. The first segment starts from the tip of the middle finger till the hand median, followed by arbitrary chosen segments of 5 cm each. The position for which data are available of all test subjects (profiles) included is 40 cm above the hand median.
Study population and measurement strategy
Thirty-nine healthy test subjects were measured at least three times with the PAM. The ethics committee of the Maastricht University Medical Center+, Maastricht, The Netherlands, approved the conduct of the study (Institutional Review Board waiver METC17-4-063). In this article the data from the study 21 were processed and the effectiveness of a new reference method is demonstrated.
In order to demonstrate the effectiveness/usability of the hand median as reference, the left arm of a voluntary healthy test subject (test subject José Coenen [JC]) was measured 10 times. After each measurement the volunteer got up and put her arm back in the measuring unit. The 10 measurements took a total of about 40 minutes.
Exclusion criteria
Three exclusion criteria were applied. First, profiles showing signal drift due to unwanted causes were excluded. The second exclusion criterion was strong fluctuation in the signal caused by (extensive) movement of the arm. Finally, only test objects were included if at least three profiles were available for evaluation.
Statistics
Descriptive statistics was applied to determine means and standard deviations of the measurements.
The discussed standard deviation reflects the variation of the measurements of the PAM and not the standard deviation around the average from an etalon (trueness). The standard deviation is made up of several ingredients, one family of which is the systematic errors and the other of random errors, and the term accuracy includes besides reproducibility also trueness. 20 As it was previously shown that correct absolute values are determined with the PAM, 19 the results presented in fact show the accuracy of the measurement.
Availability of data
The data that support the findings of this study are available from the corresponding author, F.H., upon reasonable request.
Results
In order to demonstrate the effect of the hand median as a reference point (see Material and Method section) compared with the fingertip, the arm of a voluntary test subject (test subject JC) was measured 10 times. Figure 2A shows the typical profiles of the arm. The tip of the middle finger, hand maximum, wrist, forearm, elbow, and upper arm are easily distinguished in the profiles. The first part of the graphs, up to ±3.5 cm in the cylinder, represents the part till the calibration level. Next, there is a no-object-zone, which in this example is approximately between 3.5 and 11 cm in the cylinder. The length of the arm of the test subject was about 59 cm in the water column and the cross-sectional area of the upper arm was around 97 cm2.
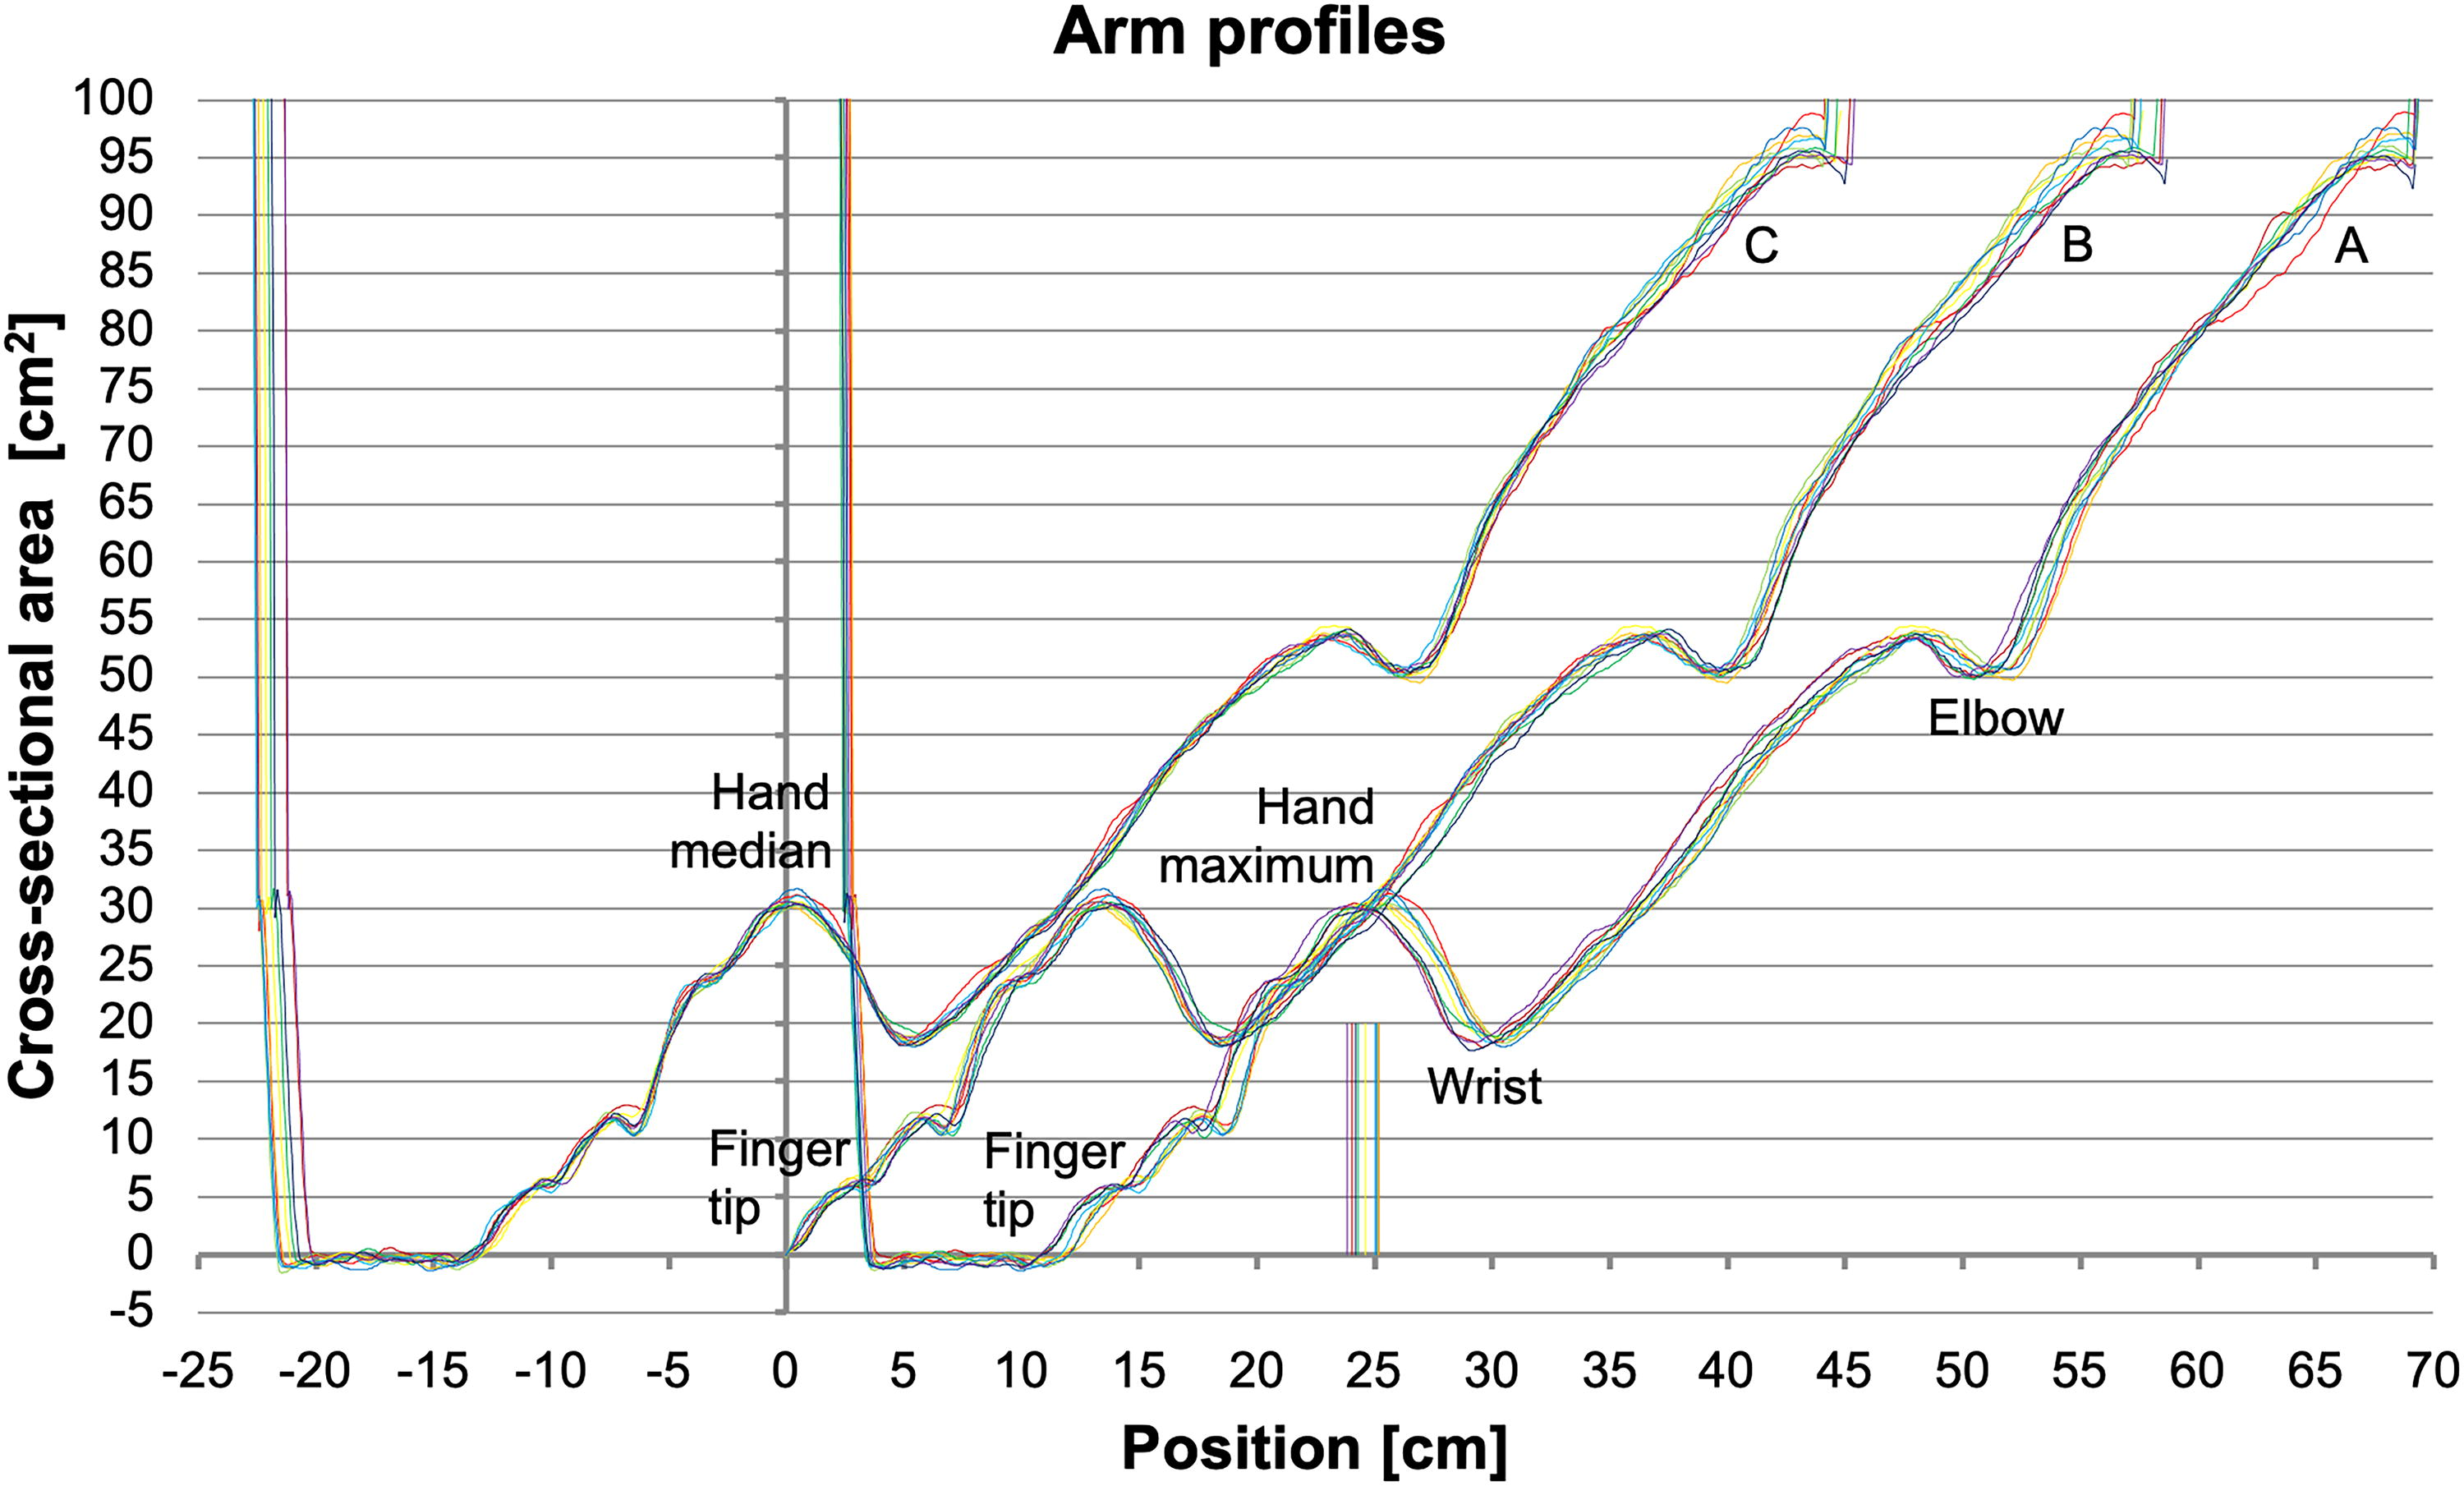
When measuring the arm of the test subject JC 10 times, the arm was not equally deep in the cylinder during individual measurements and profiles of cross-sectional areas are shifted (horizontally) relative to each other. The differences may be as large as 2 cm (Fig. 2A). In order to calculate the volume of the arm, all profiles were aligned by setting the fingertips of the profiles at 0 (Fig. 2B). Using the fingertip as the reference point, the arm volume was 2137.01 mL with a standard deviation of 24.65 mL (1.15%) (Table 1).
Comparison of Standard Deviations Using the Finger Tip and Hand Median as Reference, respectively. Measurements belong to Test Subject JC and 14
Test subjects JC and 14 were measured 10 times and 3 times, respectively.
Cumulative volume at position hand median + 40 cm.
Standard deviation, absolute and percent based (Absol. StD/Avg × 100%).
JC, José Coenen.
Still, even a small bending of the middle finger influences all positions on the arm and thus all volume calculations. A “shortening” of the finger(s) of, for example, about 1 cm corresponds to an equal shift of the graph to the left (Fig. 2A), resulting in an extra total arm volume of about 97 cm3 (1 cm × 97 cm2). Also, the noise level of the measurement is in the same range as the signal at the beginning of the fingertip, which makes it difficult to determine its position. The hand medians belonging to the 10 profiles in Figure 2A were determined and are represented by the vertical lines between positions 23.84 and 25.19 cm.
Figure 2C shows the same 10 graphs by which the hand medians are laid on top of each other and are put to position 0. The cylinder or fingertips are no longer used as reference.
Applying the hand median to align the profiles strongly increased the accuracy of determining the arm volume. The standard deviation decreased to only 7.90 mL (0.37%) (Table 1).
A comparison between using the fingertip and hand median as reference was also done using the results of three measurements of the arbitrarily chosen test subject 14 (of 39). The standard deviation of the calculated arm volume decreased to a comparable extend as seen with the 10 measurements (Table 1).
Because the profiles are so accurate, even small differences and small deviations become apparent. Movements of the arm vertically, horizontally, and tilted can be read from the profiles (not shown).
All results shown and discussed in the following are based on the hand median as reference point.
Thirty-nine test subjects were measured at least three times with the PAM. The profiles were examined closely and based on the exclusion criteria 25 subjects (64%) were included in the current study.
In order to demonstrate the accuracy and reliability of determining cross-sectional areas and volumes, results from all test subjects were evaluated in detail. As an example, Table 2 shows cross-sectional areas (left part), segmental volumes (middle part), and cumulative volumes (right part), and their corresponding standard deviations, of the arm of test subject 14. The highest standard deviation calculated for a cross-sectional area was 2.8%. Also both other quantities were determined very accurately, showing standard deviations of only 1% or less.
Measured and Calculated Quantities belonging to Test Subject 14
Position on the arm relative to the hand median.
Cross-sectional area at the specific position on the arm.
Standard deviation, absolute and percent based (Absol. StD/Avg × 100%).
Volume of specific arm segment. First segment: fingertip till hand median; second segment: hand median till hand medium + 5 cm; etc.
Cumulative arm volume from fingertip till specific position on the arm. First segment: fingertip till hand median; second segment: fingertip till hand median + 5 cm; etc.
The average volume of the hand of test subject 14, that is, the cumulative volume at position 5, is 294.6 cm3 with a standard deviation of 0.8%. The cumulative volume of the arm till position 40 cm is 1889.6 cm3 on average (Table 2). Naturally, having all data available the volume of any chosen segment of the arm can be determined.
Table 3 shows an overall insight of the measuring accuracy of the PAM. Standard deviations of all measurements and calculations were gathered of all test objects included. Again, very low standard deviations prevail.
Overview of Several Standard Deviations of All Test Subjects included (n = 25)
Position on the arm relative to the hand median.
Standard deviations belonging to the cross-sectional areas at the specific positions on the arm.
Standard deviations belonging to the volumes of the specific arm segments. First segment: fingertip till hand median; second segment: hand medium till hand median + 5 cm; etc.
Standard deviations belonging to the cumulative arm volumes from fingertip till specific position on the arm. First segment: fingertip till hand median; second segment: fingertip till hand median + 5 cm; etc.
Minimum standard deviation (absolute) of all test subjects.
Average standard deviation (absolute) of all test subjects.
Maximum standard deviation (absolute) of all test subjects.
Mean value of all percent based standard deviations.
SD, standard deviation.
Discussion
Recently, a prototype of the PAM for measuring limb volume was described. The measuring principle is based on obtaining a profile of cross-sectional areas along the length of an object or a limb. Measuring static objects and the arm of a test subject showed that accurate local volume determination is possible. 19 The prototype of the PAM was also used in a study measuring total arm volumes of 39 test subjects. 21 In the current study the same measurement data were processed in a different way with a focus on increasing the accuracy and reliability of cross-sectional area and segmental volume determination.
Measuring the arm of a healthy volunteer 10 times rendered typical profiles of cross-sectional areas (Fig. 2). The arm was not placed equally deep in the cylinder during subsequent measurements and profiles were first aligned by setting the fingertip of the profiles at position 0 (Fig. 2B). The corresponding standard deviation was 1.15% (Table 1).
Aligning profiles based on fingertip appeared to be unreliable as unintentionally bending of the fingers would shift all positions on the arm, and consequently all volume calculations. Instead, the concept of “hand median” was defined and applied to the same measurement results rendering a strong decrease of the standard deviation to only 0.37% (Fig. 2C, Table 1). When only three profiles of a test subject in the study were aligned using the hand median, a similar decrease in standard deviation was observed (Table 1). Thus, using the hand median as the reference point improves the statistical value of the measuring results.
For leg volumetry it may be possible to mathematically define a “knee median” or “ankle median” as reference point(s). This needs further investigation.
The data presented in Tables 2 and 3 clearly show that sequential and accurate measurements with the PAM are possible. For example, the cross-sectional area at position 25 on the arm of test subject 14 is 45.1 cm2 with a standard deviation of 0.9% (Table 2). This corresponds to only 1.1 mm at a position on the arm with a (circular) circumference of about 24 cm. Our experiences have shown that 10 circumference measurements with a girth done by one and the same observer showed an equal accuracy. 24 Also, the determination of volumes of the PAM is very good. Standard deviations of less than 8 mL (average 3 mL) and less than 16 mL (average 8 mL) were obtained for 5 cm segments and total arm volumes, respectively (Table 3). So, profiles obtained with the PAM can be used to show the exact location of the edema.
Accurate segmental volumetry is indispensable, as a segmental change can be different even if the overall volume of the limb remains the same.25,26 It may be important in case of tests with, for example, different types of stockings 27 and the effect of local administration of drugs. 28 Also, bariatric 29 and edema 30 surgery could be evaluated over time. Segmental volumetry could also be applied in case of muscle recovery, injury of a top athlete, evaluating training and rehabilitation programs, testing compression garments, and development of space suits. 19 Waist measurements may be used to effectively measure obesity in adults. 31
From 39 test subjects in the study 21 25 subjects (64%) were included in the current study. Exclusion was based on several profiles showing signal drift, which was most probably due to inhomogeneity in the water temperature. In the first prototype of the PAM, used in the current study, the pressure sensor used (Sendosensor SS115, Elco Jacobs B.V. Eindhoven, The Netherlands) is temperature-sensitive, and small temperature variations effect the measurements. This will be overcome by choosing a better, temperature-independent sensor, which meanwhile has become commercially available. Further, some measurements were not usable as the test subject had moved the arm overmuch during the measurement, resulting in strong fluctuations in the signal. Clear instructions before start of the measurement will prevent such disturbances.
Obviously, from a clinical point of view the measurements with the PAM need to be more robust and studies are needed with lymphedemes whose limb geometry is much more complex than the limbs of healthy people and whose functional capacity to hold an immobile position is markedly different from healthy subjects.
Although water is not reused, 19 disinfection of the system may be advisable. In a clinical setting there will be at least 5 minutes between measuring two different patients, which gives ample time to include a disinfection step using, for example, chlorine tablets.
Calculating cross-sectional areas at every height was done using a system profile. Calibrating for system characteristics improves the measuring accuracy. The degree of calibration will be determined by the desired accuracy in conjunction with the use in practical situations.
The measuring principle of the PAM differs fundamentally from water displacement with overflow. Instead, determining the change in water surface level with a pressure sensor poses a core element. 19 The volumetric principle of combining water surface level and weight, that is, Archimedes’ principle, was applied previously,4,32–36 and the use of a pressure transducer was proposed. 25 Segmental volume determination, though, would be laborious with these techniques and the distance between the applied marks would determine the segment size. In contrast, the PAM measures nearly continuously generating segments of 1–1.5 mm (or any chosen larger size). 19 Water displacement without overflow was used too applying a photoelectric float sensor 37 or a metallic needle 38 to determine the water level.
To date, a myriad of diagnostic and measuring techniques is used to assess limb volume and have been extensively compared. These include (inverse) water displacement with overflow, circumferential measurements, anthropometry/caliper, shape capture methods like perometry, ultrasonography, laser scanning, magnetic resonance imaging, (micro) computed tomography, X-ray absorptiometry, and 3D/medical imaging techniques.10,13,18,24–26,36,39–50
Currently, there is no consensus on the best measuring method26,44,51 and while they are all routinely applied in clinical practice, each comes with certain benefits and drawbacks. 47 The ideal device to qualify lymphedema should be objective, reliable, reproducible, accurate, sensitive, operator-independent, easy in use, time efficient, safe, noninvasive, and economically advantageous.5,51–53
Knowledge about the exact limb volume is important to detect the first signs of lymphedema and to follow the progressive and regressive effects of the treatment.22,54,55 High-frequent segmental volumetric measurements would generate a (preoperative) baseline measurement including (circadian) variability of the limb volume due to either of several causes like ambulatory activities and exertion, occupational and postural influences, medications, diet changes, hormonal fluctuations, temperature influences, and clothes worn.3,32,37,56–65 Such extensive monitoring would render a personal anthropometric “fingerprint,” making measurements much less depending on the patient’s activity schedule and offering the possibility to discriminate between treatment effect and inherent variation.3,58
For optimized lymphedema surveillance an objective and accurate limb volume assessment is required, even before (chronic) lymphedema is diagnosed based on visible or clinically apparent changes or symptoms occur.9,11,15,58,66,67 Such an assessment appears to be an important goal in the rehabilitation of lymphedema and a multidisciplinary approach to management.10,11,53,68 Establishing baseline measurements on normative data are essential to evaluate standards of care and the impact of clinical and surgical treatments. 69
Footnotes
Acknowledgments
Joost Wolfs is highly appreciated for making the measurement data of the study available. Ger Segers is acknowledged for his contribution during the multiple discussions. The authors thank José Coenen for acting as a voluntary test subject and Juul Houwen for his interest in this work.
Author Disclosure Statement
F.H. is the owner of Peracutus B.V. This company is developing a medical device to assess (local) volume changes in limbs and other objects. D.v.S. is closely related to Peracutus B.V., whereas J.S. was the co-owner of Peracutus B.V. All other authors have no competing financial interests.
Funding Information
This research received no specific grant from any funding agency in the public, commercial or not-for-profit sectors.