
Abstract
Background:
Intersection of gender and race and/or ethnicity in academic medicine is understudied; we aim to understand these factors in relation to scholarly achievements for neurology faculty.
Methods:
Faculty from 19 US neurology departments completed a survey (2021–2022) to report rank, leadership positions, publications, funded projects, awards, and speaker invitations. Regression analyses examined effects of gender, race, and their intersectionality on these achievements. Women, Black/Indigenous/People of Color (BIPOC), and BIPOC women were comparator groups.
Results:
Four hundred sixty-two faculty responded: 55% women, 43% men; 31% BIPOC, 63% White; 21% BIPOC women, 12% BIPOC men, 36% White women, 31% White men. Men and White faculty are more likely to be full professors than women and BIPOC faculty. The number of leadership positions, funded projects, awards, and speaker invitations are significantly greater in White compared to BIPOC faculty. Relative to BIPOC women, the number of leadership positions is significantly higher among BIPOC men, White women, and White men. Publication numbers for BIPOC men are lower, number of funded projects and speaker invitations for White women are higher, and number of awards among White men and White women is higher compared to BIPOC women.
Discussion:
Our study highlights that inequities in academic rank, award number, funded projects, speakership invitations, and leadership roles disproportionately impacted BIPOC women. More studies are needed to evaluate gender and race and/or ethnicity intersectionality effects on faculty achievements, reasons for inequities, recognition, and potential solutions.
Introduction
Gender gaps in academic medicine are well-known. Women disproportionately experience inequities in salary, rank, promotion, awards, and career advancements within neurology. 1 –9 According to the Association of American Medical Colleges (AAMC), women faculty in academic neurology departments (which includes MDs, PhDs, joint, and other doctoral degrees) comprise about half of instructors, assistant and associate professors, but only 28% of full professors. 10 In 2021, women accounted for 34% of American Academy of Neurology (AAN) membership, yet only 8% are Fellows of the AAN, compared to 19% men, 11 and have received only 22% of the 187 AAN physician awards. 4 A 2023 article by the AAN Clinical Research Subcommittee highlighted the continued gender disparities in neurology researchers with respect to academic rank, authorships, and invited speakerships. 8 In neurological journals from 2002 to 2020, women comprised only 25% of last/senior authors and 36% of first authors. 12 Despite recent emphasis on diversity, equity, and inclusion (DEI) efforts, inequities persist between genders in neurology faculty. 1 –8,13
Racial and ethnic gaps in academic medicine are also pervasive, but not as well-studied as gender gaps, particularly within neurology. Academic promotion rates for Hispanic and Black/African American (Black/AA) faculty are lower than for White faculty. 14 AAMC data show that for neurology department faculty, 60% identified as White, 24% as Asian, 3% as Hispanic, 3% as Black/AA, <1% as Indian or Native, <1% as Native Hawaiian or Other Pacific Islander, and the remainder as other (including multiracial and unknown). 10 While the Hispanic/Latino and Black/AA populations comprise about 33% of the US population combined, they represent only about 6% of neurology faculty. 10,15 To date, one study has begun addressing racial/ethnic gaps along with gender gaps in neurology with a retrospective analysis of AAMC data showing that over the past 12 years, while proportions of non-White neurology faculty in various ranks have increased, they remain disproportionate to that of the US population, and also that women faculty continue to be underrepresented in leadership roles (e.g., Chairperson), despite an increase in proportion of women faculty. 9 However, there are limited data about the intersection of gender and race/ethnicity in neurology.
The term “intersectionality” was coined by Kimberly Crenshaw and is considered an analytical framework to examine “interlocking systems of power and oppression.” 16 A person’s intersectional identities, particularly the social constructs of gender and race/ethnicity, confer varying degrees of power, privilege, oppression, discrimination, marginalization, and disenfranchisement. 12,17 To our knowledge, there is no study to date that has examined the combined impact of gender and race/ethnicity in achievements of academic neurology faculty, but we can glean some insight with previous work in academic medicine. Women from an underrepresented race/ethnicity in medicine (UIM) comprise only 13% of full-time women faculty, with the greatest proportion at the assistant professor rank. 10 Furthermore, 22% of UIM women faculty in academic medicine report experiencing racial/ethnic discrimination. 14 Women who are Black/Indigenous/People of Color (BIPOC) experience unique challenges due to the overlap of sexism and racism at interpersonal and institutional levels, with policies that have historically and systematically disenfranchised this group. 11 Thus, in this multicenter study, we aimed to better understand the effects of intersectionality of gender and race/ethnicity on career achievements of academic neurology faculty. We hypothesized that compared to BIPOC women faculty in neurology, other groups report higher levels of scholarly achievements.
Methods
Study design
This cross-sectional study administered a standardized survey to neurology faculty across 19 of an estimated 157 academic neurology centers representing all five geographical regions in the United States. (Fig. 1A). 18 Initial advertisement for institutions to participate in the Women in Neurology Collaborative Study (WINCS) survey was made through contacts within the AAN Women in Neurology section and other professional contacts. However, further targeted site recruitment by SP was independently conducted to identify faculty willing to serve as site Principal Investigators (PIs) at academic institutions that represented geographical and size diversity.
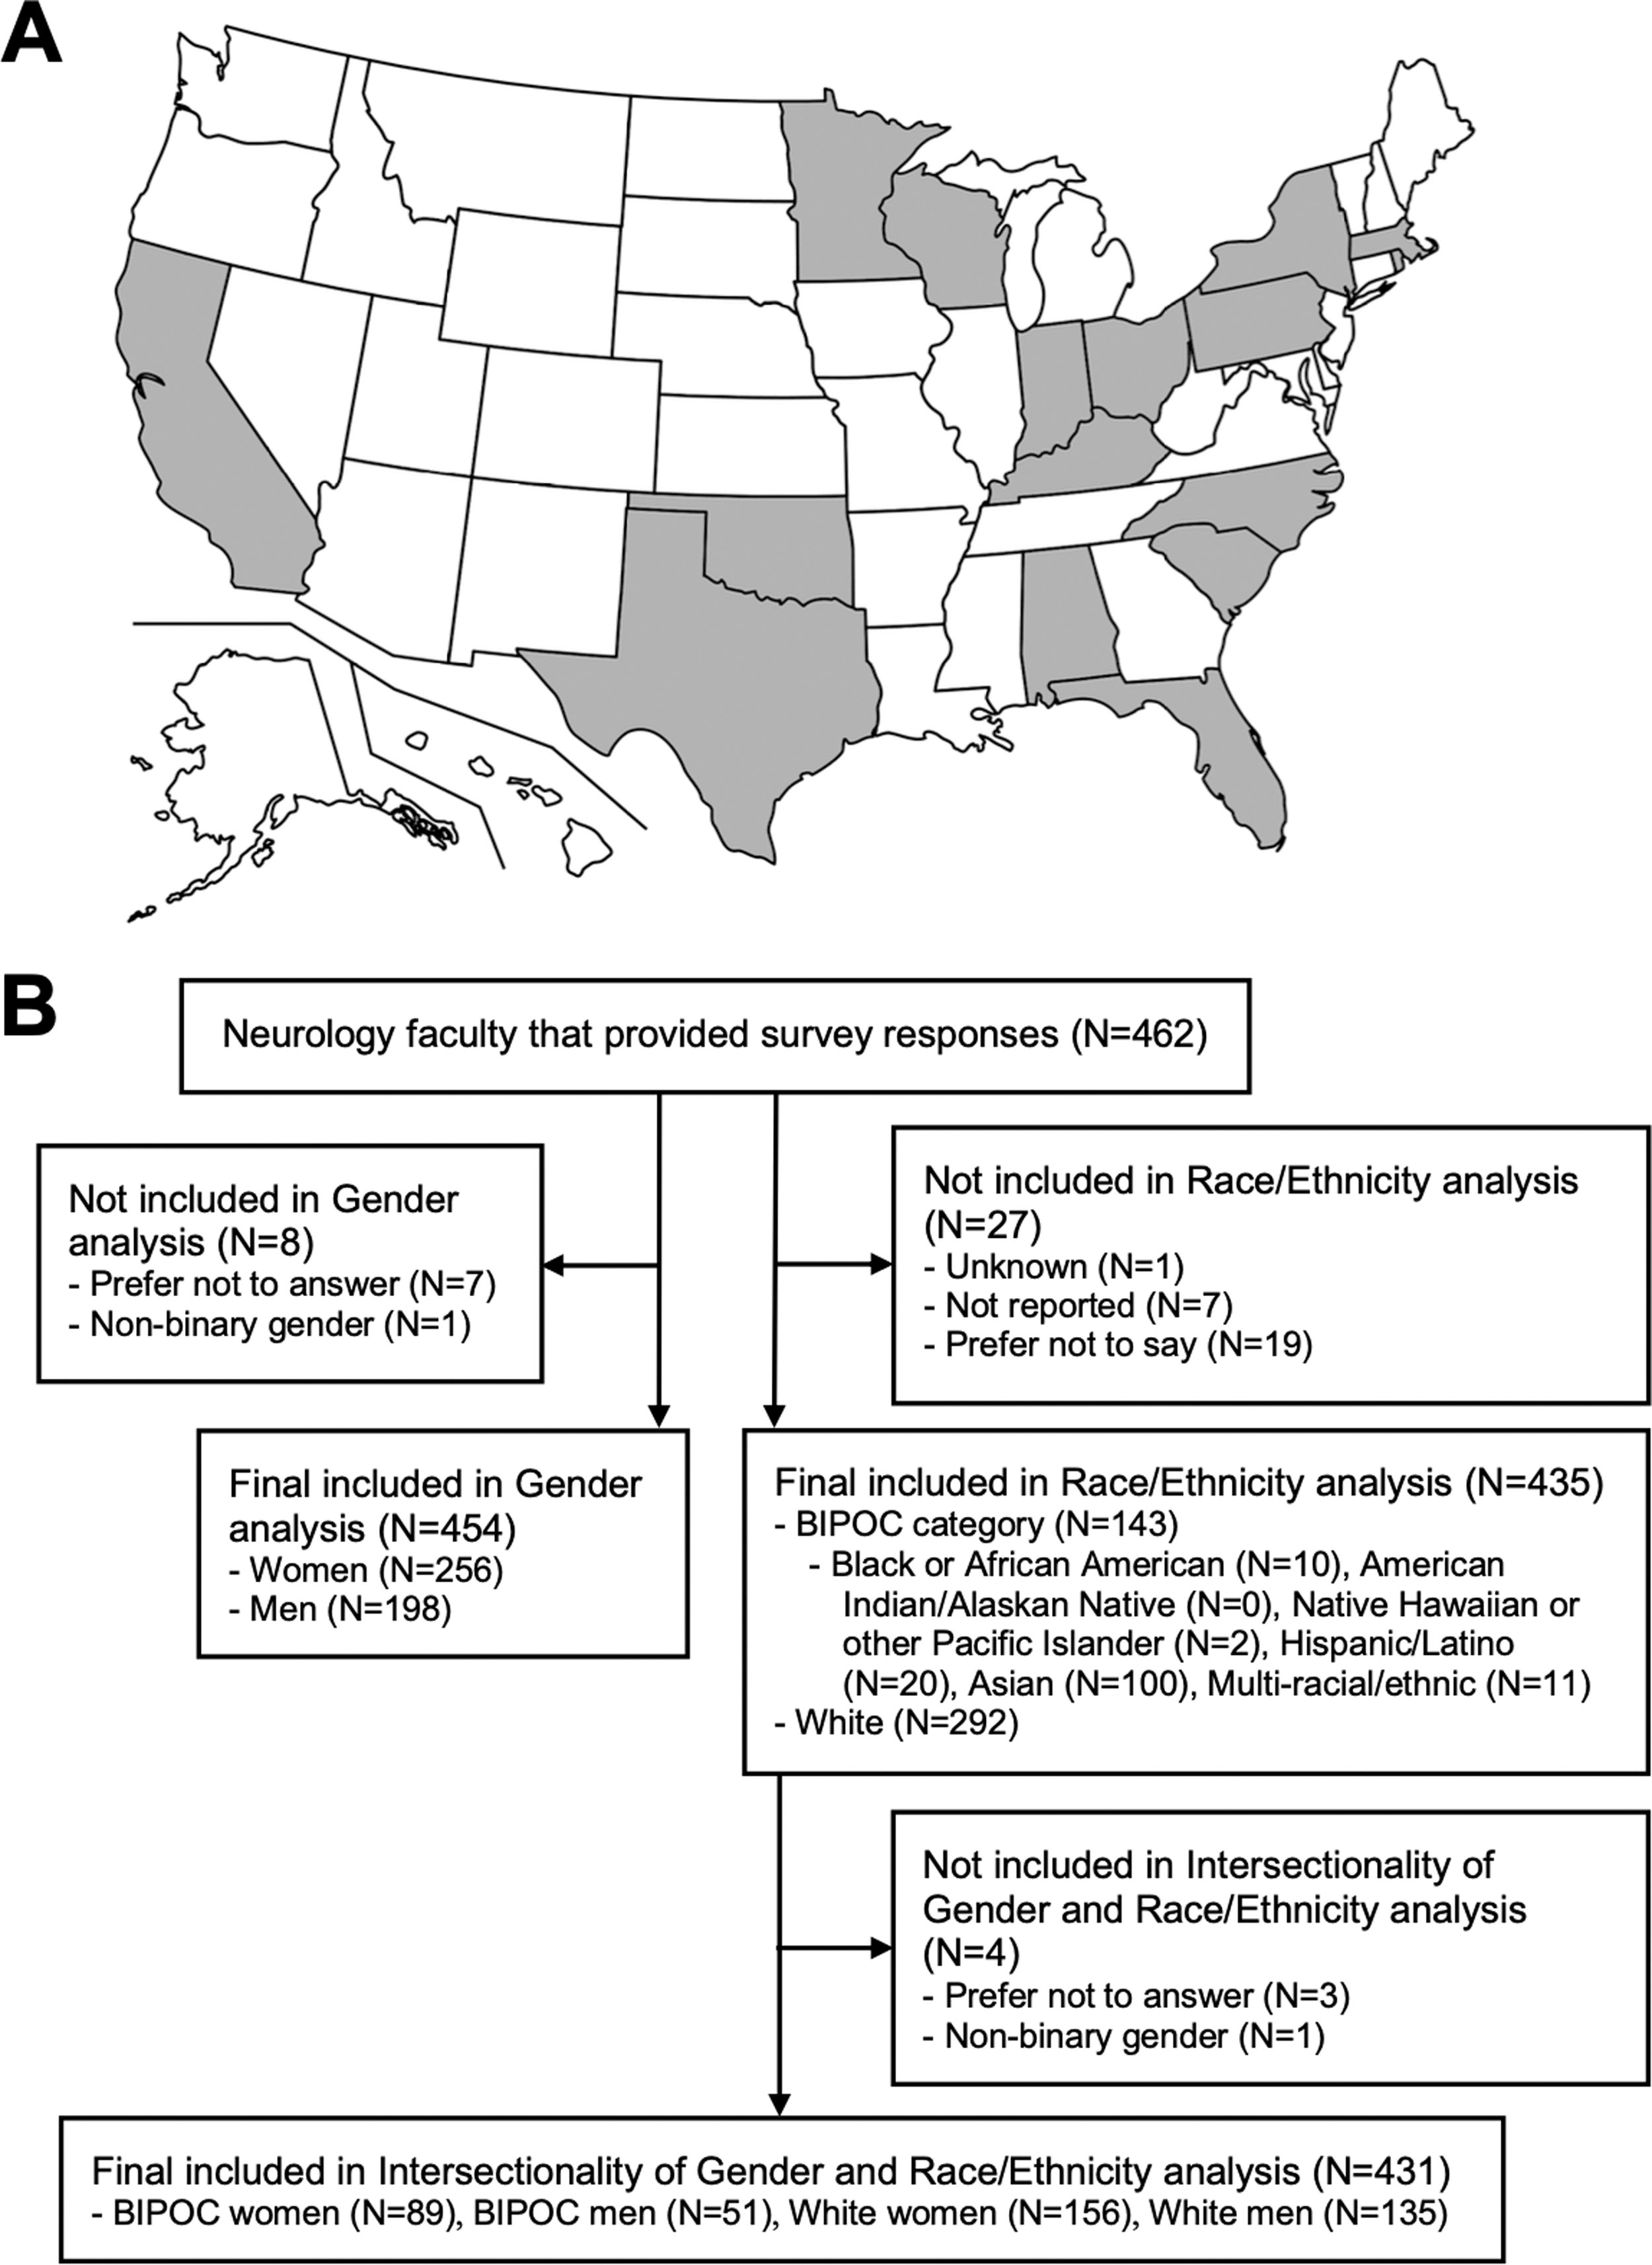
Map illustrating the states that encompass the 19 academic medical centers that participated in the survey and number of participants in each (
Survey creation
Eight primary WINCS steering committee members (SP, CN, PG, SA, AY, SM, AH, and CZ) designed the study and created the self-report survey questions based on the following domains: demographics, career achievements, compensation, perception of gender equity, domestic circumstances, parental leave, lactation, and burnout. The survey was internally validated within the organizing committee and two neurology departments. There were a total of 99 questions, 48 of them with branching logic (Supplementary data). Study data were collected and managed using Research Electronic Data Capture (REDCap), hosted at University of Texas Southwestern Medical Center. 19,20 The REDCap survey was active from February 19, 2021, to April 6, 2022, during the COVID-19 pandemic, although participants were asked to reference prepandemic conditions.
Protocol approvals
Each site PI obtained neurology chair approval and Institutional Review Board (IRB) approval with waiver of informed consent or IRB exemption, as appropriate. Adult and pediatric neurology faculty with advanced degrees (MD, DO, PhD, MD/PhD, MBBS, and MS) were eligible to complete the survey. Graduate medical trainees, medical students, nurse practitioners, physician assistants, and other nonfaculty members were excluded. The WINCS survey was administered to neurology department faculty of the participating sites.
Academic achievement measures
We collected ten measures of achievement. Academic rank, tenure-track status, having had any leadership position, and having had any incentivized leadership position were analyzed as categorical variables. Total number of leadership positions, average number of peer-reviewed publications per year over the last five years, total first or last author publications, total number of funded projects, total number of awards received, and total invited guest speakerships were analyzed as continuous variables.
Statistical analysis
Statistical analysis was performed using R version 4.0.3; means with standard deviations and counts with percentages are reported as applicable. The following survey item and response selections determined gender categorization: “Please indicate your gender: (1) Man, (2) Woman, (3) Nonbinary gender, (4) Prefer not to answer, (5) A gender not listed above [entry was allowable].” Analysis of gender differences was restricted to response selections for “Man” and “Woman” due to the small number of responses in the other categories (Fig. 1B; Table 1). The following survey item and response selections determined race/ethnicity categorization: “Please indicate your racial/ethnic identity: (You may select more than one option.): (1) American Indian/Alaskan Native, (2) Asian, (3) Black or African American, (4) Native Hawaiian or other Pacific Islander (5) White, (6) Hispanic/Latino, (7) Unknown, (8) Not reported, (9) Prefer not to say.” This allowed the possibility of combinations in which individuals could be classified as multi-racial/ethnic (e.g., selection of both “White” and “Hispanic/Latino”), as opposed to single response selections. Analysis of race/ethnicity differences was restricted to the BIPOC group (i.e., combining all responses with “Black or African American,” “American Indian/Alaskan Native,” “Native Hawaiian or other Pacific Islander,” “Asian,” “Hispanic/Latino”), or chose multiple selections to indicate multi-racial/ethnic (e.g., selecting both “Hispanic/Latino” and “White”) versus “White” (i.e., single response selection), due to the small numbers in other categories (Fig. 1B; Table 2). 8 Intersectionality analysis of gender and race/ethnicity was restricted to BIPOC women, BIPOC men, White women, and White men (Fig. 1B; Table 3).
Sample Characteristics of Survey Respondents by Gender
Note: Data are presented as mean (SD) or frequency (percentage), as appropriate. Gender data for participants who responded with “Nonbinary gender” (N = 1) or “Prefer not to answer” (N = 7) were not included due to the small numbers, resulting in overall N = 454.
Race/Ethnicity data for participants who responded with “Black or African American” (N = 9), “American Indian/Alaskan Native” (N = 0), “Native Hawaiian or other Pacific Islander” (N = 2), “Hispanic/Latino” (N = 24), and Asian (N = 98), and made multiple selections indicating multi-racial/ethnic identity (N = 7) were combined under “BIPOC” due to the small numbers.
Race/Ethnicity data for participants who responded with “White” as their only selection.
Race/Ethnicity data for participants who responded with “Unknown” (N = 1), “Not reported” (N = 7), and “Prefer not to say” (N = 15) were combined under “Not reported” due to the small numbers.
Sample Characteristics and Descriptive Statistics of Survey Respondents by Race/Ethnicity
Note: Data are presented as mean (SD) or frequency (percentage), as appropriate. Race/Ethnicity data for participants who responded with “Unknown” (N = 1), “Not reported” (N = 7), and “Prefer not to say” (N = 19) were excluded due to the small numbers, resulting in overall N = 435.
Data for participants who responded with “Black or African American” (N = 10), “American Indian/Alaskan Native (N = 0), “Native Hawaiian or other Pacific Islander” (N = 2), “Hispanic/Latino” (N = 20), and Asian (N = 100), and made multiple selections indicating multi-racial/ethnic identity (N = 11) were combined under “BIPOC” due to small numbers.
Race/Ethnicity data for participants who responded with “White” as their only selection.
Gender data for participants who responded with “Nonbinary gender” (N = 1) or “Prefer not to answer” (N = 3) were combined due to the small numbers.
Sample Characteristics of Survey Respondents Included in Intersectionality Analysis of Gender and Race/Ethnicity
Note: Data are presented as mean (SD) or frequency (percentage), as appropriate. Sample excludes participants who did not report their race/ethnicity (N = 27), and subsequently excluding those who did not report their gender identity (N = 3) and one binary participant, resulting in overall N = 431.
Negative binomial regression and logistic regression analyses were performed as appropriate to determine odds ratios (ORs) and rate ratios (RRs), respectively, to examine the effects of gender, race/ethnicity, and their intersectionality on the ten achievement measures. Bidirectional stepwise regression was applied to determine the factors that were consistently identified as contributing to the outcome variables. Three consistent factors were identified: academic rank, clinical effort, and total hours worked per week. Regression analysis adjusting for these three variables were performed on all outcome measures and constituted the full model results (ORadjusted and RRadjusted). Additional variables were not included in the adjusted model, because they were not consistent predictors of the outcome variables.
For each regression, women was the comparator group for gender analysis, BIPOC was the comparator group for race/ethnicity analysis, and BIPOC women was the comparator group for analysis of intersectionality of gender and race/ethnicity. ORs are reported in the logistic regression output for 4 outcomes: is a full professor, is on tenure track, has had a leadership position, and has had an incentivized leadership position. RRs are reported in the count regression output for 6 outcomes: number of leadership positions, number of funded projects or studies, number of peer-reviewed publications, number of publications as first/last author, number of awards received, and number of invited guest speakerships. Regression results are significant at the 0.05 level.
Results
A total of 462 (31%) neurology faculty completed the survey (Fig. 1B), and the proportions by gender were 55% women, 43% men, and 2% other (“Nonbinary gender, “Prefer not to answer,” “A gender not listed above”; not included in gender analyses). For the total sample, the proportions by race/ethnicity were 31% BIPOC, 63% White, and 6% other (“Unknown,” “Not reported,” “Prefer not to say,” and not included in race/ethnicity analyses). The median response rate for the 19 sites was 39% (range = 11–53%). A total of 454 respondents were included in the analysis by gender (56% women; Table 1) and 435 respondents in the analysis by race/ethnicity (67% White; Table 2). The main analysis on the intersectionality of gender and race/ethnicity included 431 respondents and comprised 21% BIPOC women, 12% BIPOC men, 36% White women, and 31% White men (Table 3).
Gender
Compared to women, men have higher odds of being a full professor (OR = 2.3; p < 0.001) and tenure track (OR = 1.7; p = 0.038). Compared to women, men have 47% higher number of leadership positions (RR = 1.5; p < 0.001), 82% higher number of funded projects (RR = 1.8; p = 0.001), 91% higher number of awards (RR = 1.9; p = 0.001), and 78% higher number of invited guest speakerships (RR = 1.8; p < 0.001). ORs did not differ by gender for having a leadership position or an incentivized leadership position. RRs did not differ by gender for number of publications or number of first/last author publications.
In the full model, men continue to have higher odds of being a full professor (ORadjusted = 2.2; p = 0.002) compared to women. No other achievement remained significantly different by gender in the full model.
Race/ethnicity
Compared to BIPOC faculty, White faculty have higher odds of being a full professor (OR = 2.2; p = 0.002) and having a leadership position (OR = 1.9; p = 0.005). Compared with BIPOC faculty, White faculty have 51% higher number of leadership positions (RR = 1.5; p = 0.001), 137% higher number of funded projects (RR = 2.4; p < 0.001), 93% higher number of publications (RR = 1.9; p < 0.001), 50% higher number of first/last author publications (RR = 1.5; p = 0.008), 125% higher number of awards (RR = 2.3; p < 0.001), and 150% higher number of invited guest speakerships (RR = 2.5; p < 0.001). ORs did not differ by race/ethnicity for being tenure track or having an incentivized leadership position.
In the full model, White faculty continue to have higher odds of being a full professor (ORadjusted = 2.1; p = 0.009), 26% higher number of leadership positions (RRadjusted = 1.3; p = 0.037), 50% higher number of funded projects (RRadjusted = 1.5; p = 0.013), 57% higher number of awards (RRadjusted = 1.6; p = 0.010), and 56% higher number of guest speakerships (RRadjusted = 1.6; p = 0.001) compared to BIPOC faculty. The odds of having a leadership position, the number of publications, and the number of first/last author publications no longer differed by race/ethnicity in the full model.
Intersectionality of gender and race/ethnicity
Compared to BIPOC women, White men have higher odds of being a full professor (OR = 4.3; p < 0.001; Fig. 2A) and having a leadership position (OR = 2.7; p = 0.001; Fig. 2C), and White women have higher odds of having a leadership position (OR = 1.8; p = 0.033; Fig. 2C). White men have 129% higher (RR = 2.3; p < 0.001), White women have 65% higher (RR = 1.7; p = 0.002), and BIPOC men have 73% higher (RR = 1.7; p = 0.008) number of leadership positions compared to BIPOC women (Fig. 3A). White men have 245% higher (RR = 3.4; p < 0.001) and White women have 79% higher (RR = 1.8; p = 0.026) number of funded projects compared to BIPOC women (Fig. 3B). White men have 70% higher (RR = 1.7; p = 0.007) and White women have 91% higher (RR = 1.9; p = 0.001) number of publications compared to BIPOC women (Fig. 3C). White women also have 67% higher (RR = 1.7; p = 0.010) number of first/last author publications compared to BIPOC women (Fig. 3D). White men have 256% higher (RR = 3.6; p < 0.001) and White women have 76% higher (RR = 1.8; p = 0.032) number of awards compared to BIPOC women (Fig. 3E). White men also have 207% higher (RR = 3.1; p < 0.001) number of guest speakerships compared to BIPOC women (Fig. 3F).
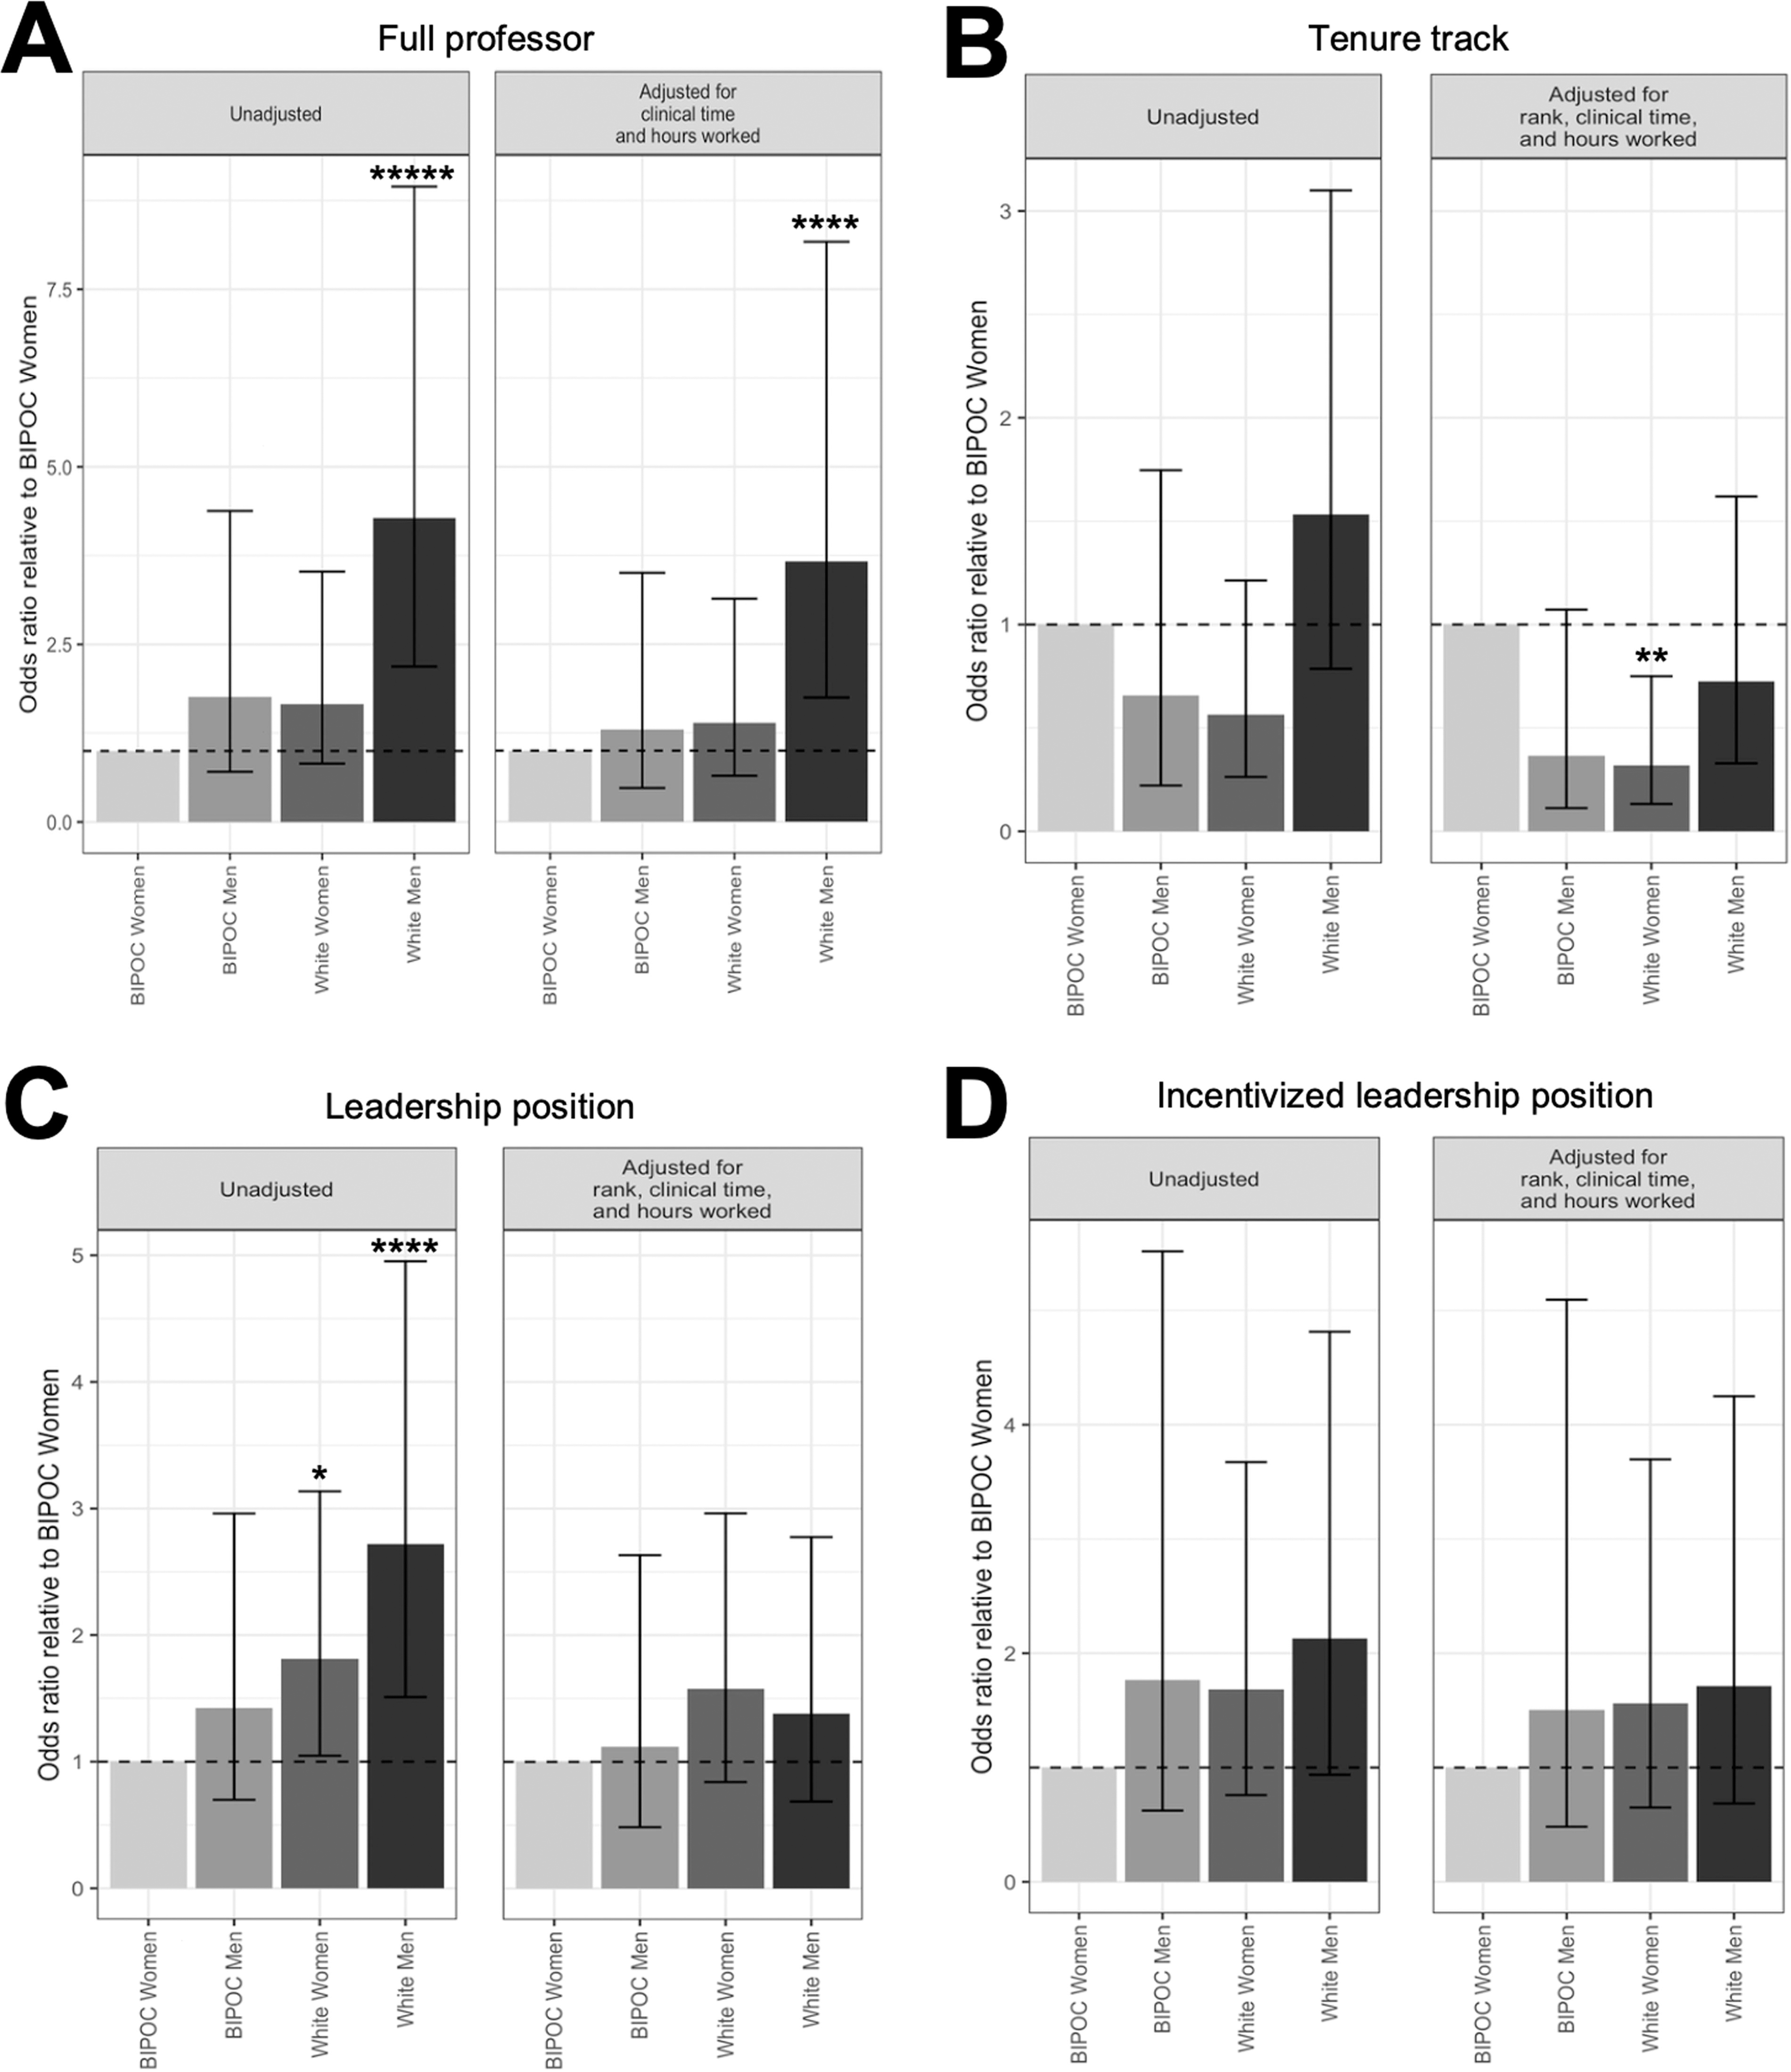
Results of regression models examining combined effects of gender and race on academic productivity measures, with reference group as Black, Indigenous, and People of Color (BIPOC) women. Odds ratios (ORs) and their confidence intervals are illustrated for the logistic regression output for 4 outcome variables: (
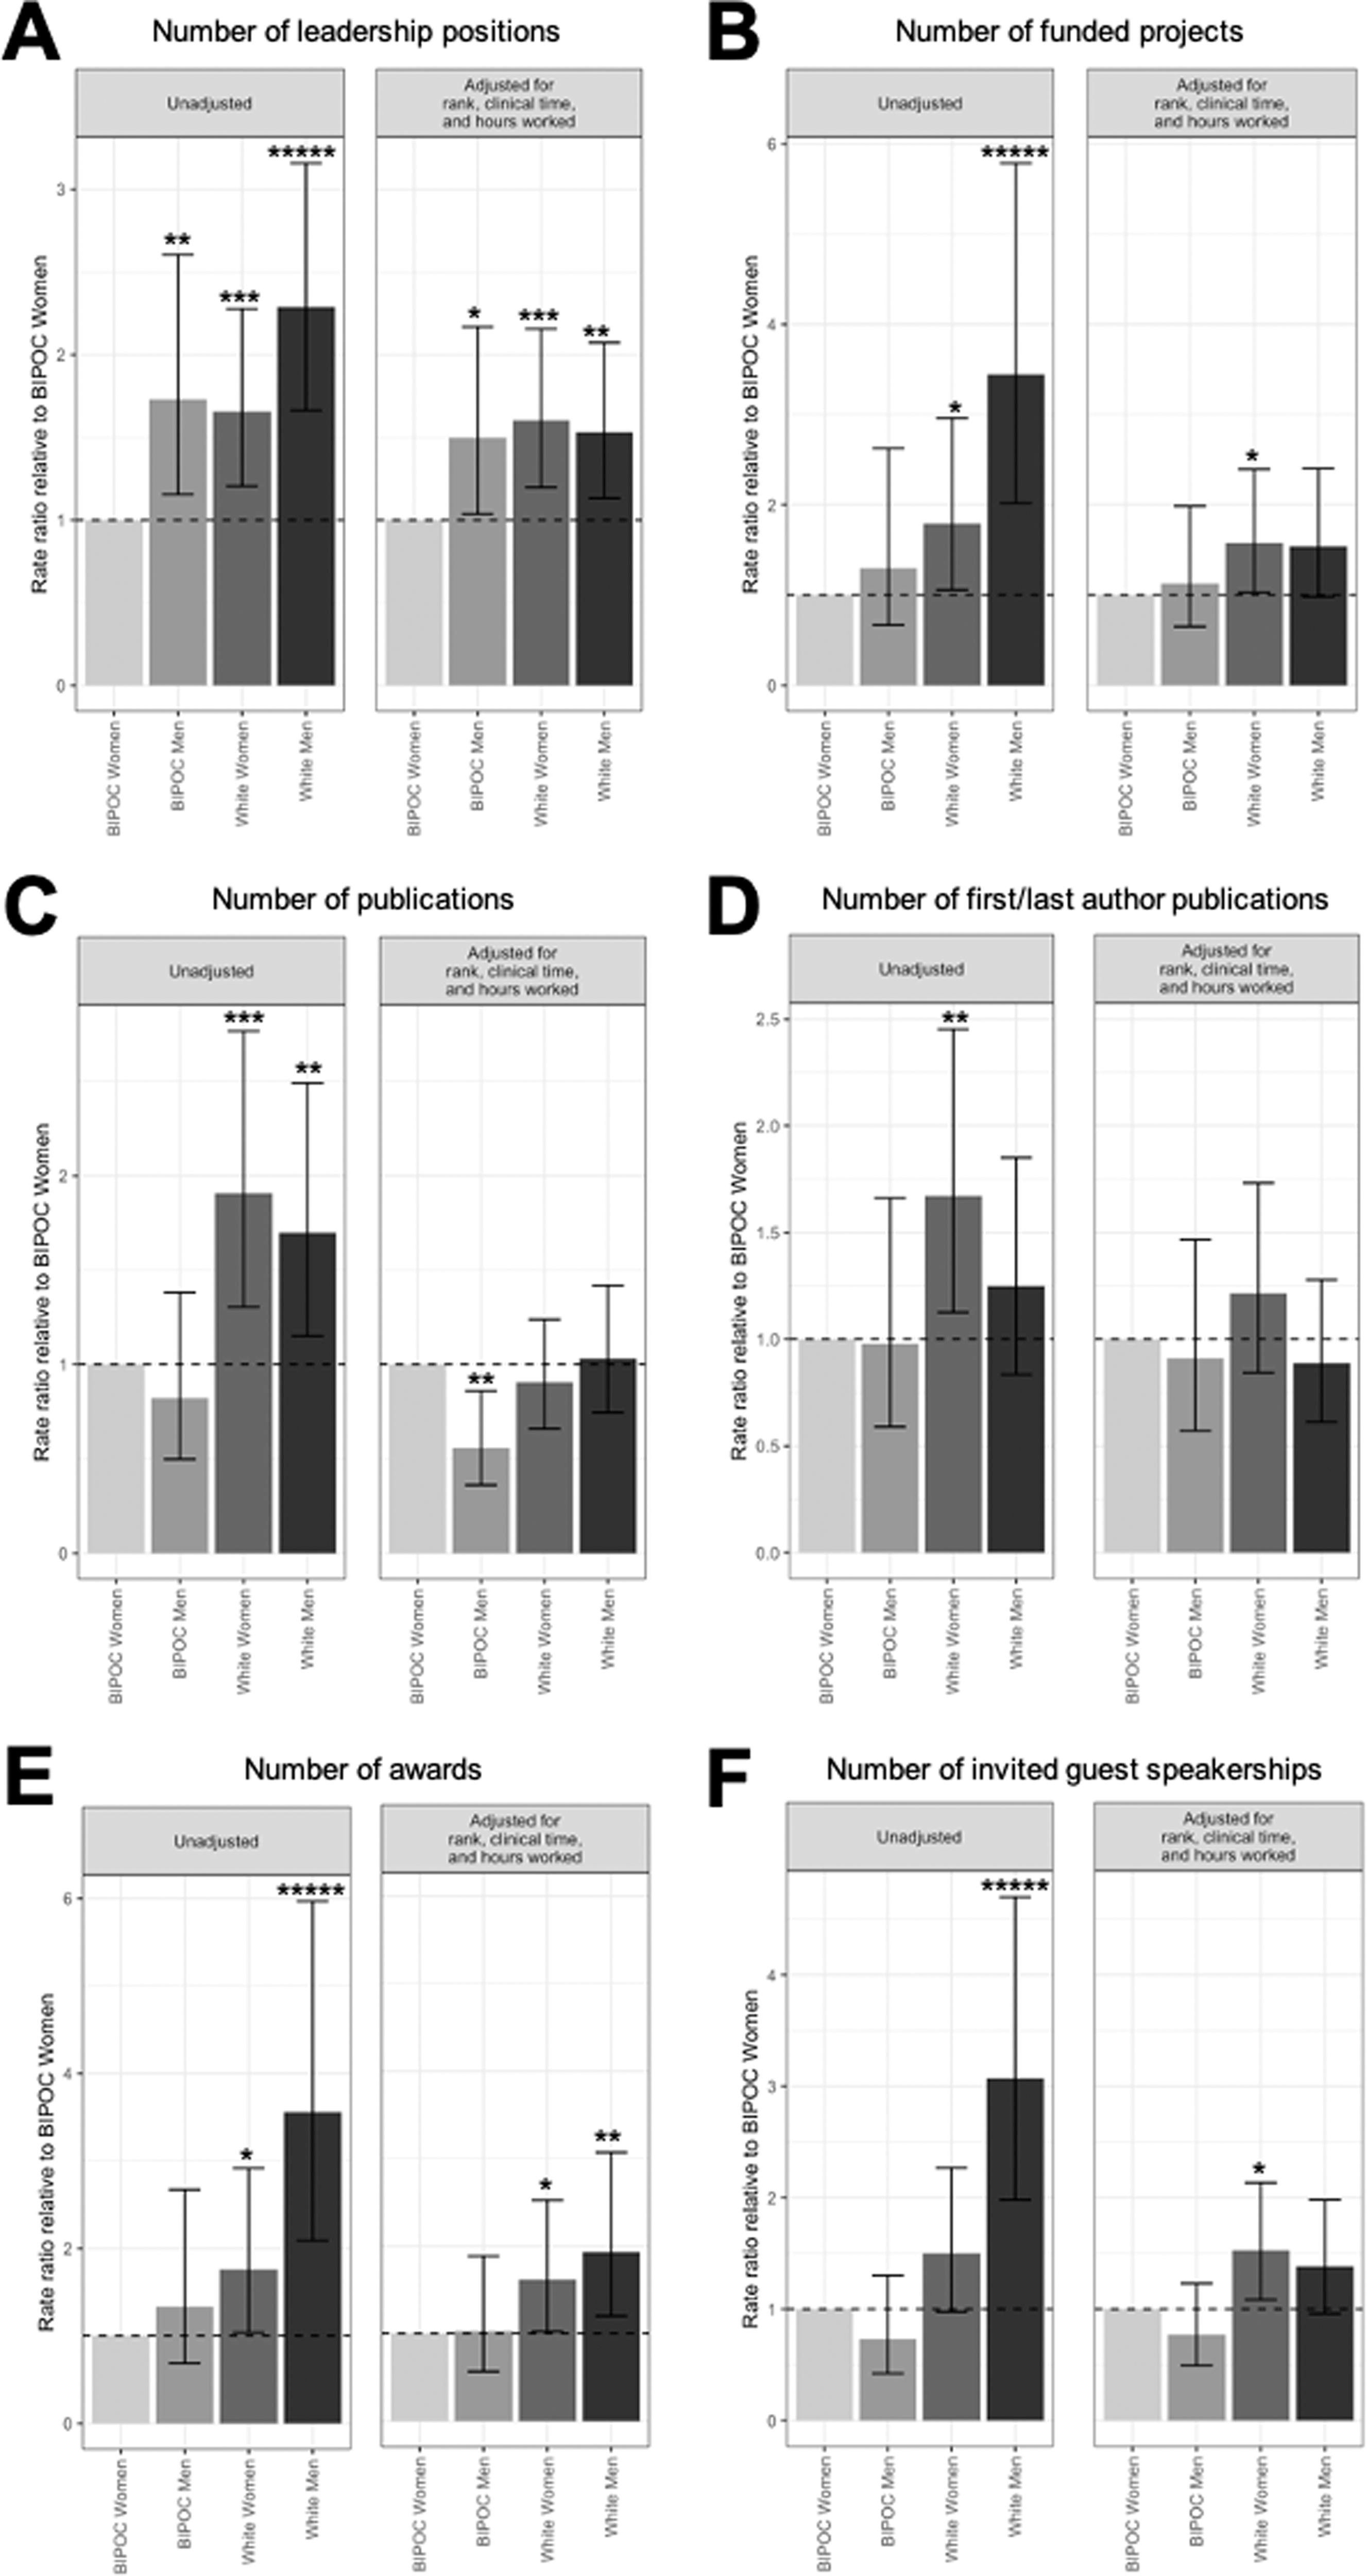
Results of regression models examining combined effects of gender and race on academic productivity measures, with reference group as Black, Indigenous, and People of Color (BIPOC) women. Rate ratios (RRs) and their confidence intervals are illustrated for the count regression output for 6 outcome variables: (
In the full model, compared to BIPOC women, White men continue to have higher odds of being full professor (ORadjusted = 3.7; p = 0.001; Fig. 2A), while White women have lower odds of being on tenure track (ORadjusted = 0.3; p = 0.009; Fig. 2B). Furthermore, White men have 53% higher (RRadjusted = 1.5; p = 0.006), White women have 60% higher (RRadjusted = 1.6; p = 0.002), and BIPOC men have 50% higher (RRadjusted = 1.5; p = 0.033) number of leadership positions compared to BIPOC women (Fig. 3A). White women have 58% higher number of funded projects (RRadjusted = 1.6; p = 0.034; Fig. 3B), while BIPOC men have 44% lower number of publications (RRadjusted = 0.6; p = 0.007; Fig. 3C) than BIPOC women. White men have 93% higher (RRadjusted = 1.9; p = 0.006) and White women have 61.4% higher (RRadjusted = 1.6; p = 0.039) number of awards (Fig. 3E), and White women have 53% higher number of guest speakerships (RRadjusted = 1.5; p = 0.014; Fig. 3F) than BIPOC women. In the full model, the odds of White men and White women having a leadership position no longer differs from BIPOC women, and the number of first/last author publications also no longer differs between White women and BIPOC women.
Discussion
Investigations on the intersectionality of gender and race/ethnicity in academic medicine are limited, and our study is the first to examine these relationships in neurology faculty. Key findings in our study related to gender disparities are consistent with the large body of work in this area, and we contribute to the growing literature on racial and ethnic gaps in neurology. Specifically, men and White faculty are more likely to be full professors than women and BIPOC neurology faculty, respectively, even after adjusting for academic rank, clinical effort, and total hours worked per week (full model). In the full model, we also show that the number of leadership positions, funded projects, awards, and guest speaker invitations is greater in White compared to BIPOC neurology faculty. Furthermore, we illustrate a number of significant results for the full model in the combined impact of race/ethnicity on academic achievements of academic neurology faculty. Specifically, compared to BIPOC women neurology faculty, White men are more likely to be full professors, White women are less likely to be tenure track, and the number of leadership positions is higher among BIPOC men, White women, and White men. Interestingly, we found that White women are statistically less likely than BIPOC women to have a tenure-track position, even after accounting for rank, clinical time, and hours worked. Reasons behind this disparity are unclear and warrant further investigation. It is possible that the difference in working hours may have impacted these findings since 14% of BIPOC women worked over 80 hours per week, compared to 5% of White women. Furthermore, the number of publications for BIPOC men is lower, number of funded projects and speaker invitations for White women is higher, and number of awards among White men and women is higher than BIPOC women. Our study highlights the greatest gaps for BIPOC women are in attaining the highest academic rank of full professor and in the number of leadership positions and awards received, despite similar levels of academic productivity.
There are many contributors to gender and racial gaps in academic neurology. These include the continuing inequities in the academic career progression for women and BIPOC individuals, which have consequences on career advancements, such as funding, promotion, and tenure. 14,21,22 Specifically, we show that even after adjusting for covariates, men are 2.2 times more likely to be a full professor than women, and White men are 3.7 times more likely to be a full professor than BIPOC women. Carr and colleagues studied the National Faculty Survey that followed 1273 faculty members in academic medicine longitudinally over 17 years at 24 US medical schools, and found women were less likely than men to achieve the rank of full professor and attain a senior rank leadership position such as dean, associate dean, provost, and department chair; and are less likely to remain in academic fields even after adjusting for publication-related productivity. 14 Richter et al. sampled 559,098 graduates from 134 US medical schools and found, even after adjustment for graduation year, race/ethnic group, and department type, compared to men, women were 24% less likely to be promoted from assistant to associate professor, 23% less likely to be promoted from associate to full professor, and 54% less likely to be appointed to department chair. 23 Ginther and colleagues showed that Asian and Black women were significantly less likely to receive R01 grant funding from the National Institutes of Health, despite having comparable qualifications to White applicants. 22 In academia, women and faculty of color are also often hired in nontenure-track positions. 24,25 Designation of tenure track allows academic faculty members to have a stronger voice, leadership opportunities, recognition, and career advancements. 24 Our findings are consistent with these previous studies illustrating increased disparities in those with intersecting identities.
Furthermore, it is important to consider individuals with two marginalized identities are more likely to experience the cumulative effects of prejudice. 26 In academia, BIPOC faculty, compared to White faculty, are more likely to experience a hostile work environment with interpersonal interactions (microaggression, implicit bias, and tokenism) and institutional oppression (sexist/racist policies in promotion, tenure, recognition, and career advancement). 24,27,28 Ruzycki and colleagues surveyed 1087 practicing physicians to evaluate perceptions of harassment and discrimination in medicine with a focus on self-identified race and gender identity. They found that the prevalence of harassment, discrimination, and bias was most common among BIPOC women (85%), with gender identity and skin color as the most commonly perceived reasons. Impressively, over 90% of BIPOC physicians in this study experienced or witnessed racial discrimination, compared to only 6% of White physicians. Nearly 70% of BIPOC women reported having to “represent their entire race or ethnicity” compared to White physicians. 29 BIPOC faculty may be considered the “token” or sole representative for their racial/ethnic group. Tokenism may lead to increased pressure to succeed, psychological stress, and negative visibility with potential for stigma for interpersonal discrimination. 24 Together, these perpetuate the continued gender and racial inequities observed in academic neurology. 24 These data also stress the need for further examination of factors that maintain the limited advancement of BIPOC women in academic neurology, as well as proposals of potential solutions to narrowing the gaps.
Limitations
The following limitations should be considered when interpreting our findings and potential implications. Results may not be generalizable to all US academic neurology centers because of limited sample size and potential bias. According to 2022 AAMC faculty data, women comprise 44% of the academic neurology faculty, whereas our survey had 55% women faculty respondents. 10 It should be noted that the proportion of White faculty respondents in our survey (63%) was similar to the 62% of White faculty indicated in the 2022 AAMC faculty data. Regardless, a more comprehensive survey of all academic neurology faculty in the future would help determine whether sample representativeness is a significant source of bias in our data.
In addition, to facilitate interpretation of the results, we combined race and ethnicity categories into two groups: BIPOC and White. Future research should differentiate race from ethnicity to provide a more fine-grained analysis of the extent to which distinct racial and ethnic groups experience differential outcomes in neurology careers. Our data also do not distinguish between physician and nonphysician (e.g., PhD) respondents. In future studies, it would be worthwhile to consider whether academic outcomes differ based on degree type. Participation was determined by neurology faculty interest and chair approval, which introduces selection bias. Results are self-reported, with potential for overestimation/underestimation in responses, although our results on gender and race/ethnic disparities are consistent with prior work. To manage survey length, we did not capture a detailed description of participant academic achievements (e.g., journal rankings, award prestige, etc.). Future research might consider using faculty curriculum vitae as a more detailed source of information about accomplishments to provide a more fine-grained analysis of differential career outcomes by group. While overall responder rate was 31%, potentially due to “survey fatigue” during the COVID-19 pandemic, it is comparable to that of previous surveys, e.g., 15% responder rate in a recent article of gender gaps in neurology research careers. 8 It should be noted that this study did not directly investigate the impact of the pandemic on career and work conditions as questions were in pre-COVID condition. In addition, the number of respondents considered underrepresented in medicine and/or who identify with sexual orientation or gender identity minority groups was too low and required data consolidation for statistical analysis. These limitations should be addressed in future work.
Conclusions and Future Directions
Many factors contribute to the career achievements for women and BIPOC neurology faculty. Our study highlights that White faculty (men and women) have generally higher rates of success in academia, particularly in the number of awards, funded projects, guest speakership invitations, and leadership roles, compared to BIPOC women. However, White men are significantly more likely to have the rank of full professor, while White women are less likely to be tenure track compared to BIPOC women in the adjusted full model. Moving forward, it is important to consider how these differential accomplishments may affect retention over time and to identify solutions that may improve gender and racial/ethnic disparities in neurology and academic medicine in general, particularly for BIPOC women. In Carr and colleague’s review of the National Faculty Survey, they also found women faculty had a lower likelihood of remaining in academic medicine than men (81% vs. 85%), and drops further to 68% after adjusting for race/ethnicity and department. 13 Although a detailed discussion is beyond the scope of this article, we can highlight some examples from the literature describing potential solutions, including effective mentorship, accountability with metrics, and in facilitating the increase of diversity and equity in leadership opportunities of professional scientific/medical societies and journals.
Related to mentorship, the National Academies of Sciences, Engineering, and Medicine (NASEM) published a report stating that mentorship should be implemented in an evidence-based manner that goes beyond the traditional mentor–mentee structure and also includes group mentorship, online communities, and social and professional networks. 30 The NASEM report provides key recommendations for effective mentorship, recognizing the importance of intersecting identities. Ward et al., (2022) also provided recent recommendations on how to improve the pipeline for women and other UIM groups, specifically in the physician–scientist workforce, focusing on mentorship and other financial resources assistance (e.g., child care stipends) for early and mid-career faculty. 31 Accountability within an organization may help identify areas of opportunity and growth. Other medical societies, for instance, the Association of Academic Physiatrists, convened a task force assessing society-related metrics (e.g., speakers, committee members, journal editors) according to gender and then intentionally aimed to increased representation and progress for women in a three-year period, an approach that may be replicated by neurology professional societies. 32 Finally, key gatekeepers such as neurology societies, journals, and academic centers have an opportunity to facilitate actionable steps to enhance diversity and equity. A commentary published by Silver et al. described a novel concept termed “interorganizational structural discrimination,” which focuses on how organizations should hold each other accountable for structural discrimination concerns that are identified as remediable and “paramount to solving DEI concerns.” 33 The commentary specifically mentioned clinical practice guidelines that are convened by professional societies and often published in affiliated journals have lower representation of women. Two recent studies highlight this remediable issue, describing that women, particularly “racialized” women, are underrepresented as authors of clinical practice guidelines. 34,35
In conclusion, as we expand upon DEI efforts in neurology, there must be accountability, equitable benchmarks, and awareness to recruit, promote, and retain women and BIPOC faculty at all levels. Future studies should further evaluate the impact of intersectionality on faculty advancement and opportunities in neurology.
Footnotes
Acknowledgments
The authors acknowledge Dr. Virginia J. Howard, Professor of Epidemiology in the School of Public Health at the University of Alabama at Birmingham, for her contribution to initial survey design. M.F. was supported by Masonic Institute for the Developing Brain and the Department of Neurology, University of Minnesota, for statistical support. This study was presented, in part, at the American Academy of Neurology 2023 Annual Meeting.
Authors’ Contributions
S.I.P., P.G., C.O.S.N., K.E.K., S.A.L., A.F.W., J.B.A., A.Y., A.H., C.Z., S.M., and V.H. contributed to the conceptualization of study design and methodology. S.I.P., S.A.L., A.H., and A.Y. organized the Red Cap Database. S.I.P., J.A., K.E.K., and P.A. contributed to the data curation and formal analysis. S.I.P., J.A., K.E.K., and P.A. contributed to writing of the original draft. S.I.P., P.G., C.O.S.N., S.A.L., J.B.A., A.H., J.K.S., A.F.W., and C.Z. contributed to the supervision of this study. S.I.P., P.G., C.O.S.N., S.A.L., J.B.A., N.A., D.H.K., S.S., M.A., H.B.A., N.S.F., K.R., S.D., S.N., J.Y.C., K.Z., R.S., C.Z., D.B., N.B., N.F., L.T., L.G., and S.M. contributed to the project administration by being site principal investigator, collecting site data, and obtaining IRB approval. S.I.P., P.G., C.O.S.N., D.H.K., J.K.S., A.F.W., K.E.K., N.S.F., S.A.L., J.B.A., C.Z., N.A., D.Y., K.R., S.D., and H.B.A. contributed to the review and editing of the final version of the article. S.P., C.O.S.N., S.A.L., J.A., P.G., and K.K. have all had direct access to and verified the underlying data.
Author Disclosure Statement
S.I.P. has received honoraria for lectureship from Hofstra University, served as expert witness and legal consultant, is on the Epilepsy Foundation of Minnesota Board of Directors, is funded by drug trials for Xenon and UCB Pharma, chairs the American Epilepsy Society Digital Advisory Committee, and serves on the University of Minnesota Center for Women and Medicine group and the American Neurological Association Ideas Task Force. P.G. received support from the Palatucci Advocacy Leadership Forum Grant by the American Academy of Neurology. NA. received honoraria for Facilitating Anti-racism discussions at Brown University. D.H.K. has received royalties from Springer, honoraria from the PRI-MED conference, and meeting/travel support from the American Academy of Neurology for the Undergraduate Education Subcommittee. S.S. has received support from Biogen and Verasci. H.B.A. receives compensation from the American Academy of Neurology for her position as Deputy Editor of the Neurology Minute podcast and is funded by the National Center for Advancing Translational Sciences, National Institutes of Health (NIH; Grant #KL2TR001421), and has received lecture honoraria from the American Epilepsy Society. N.F. has received grant funding from the Patient-Centered Outcomes Research Institute (PCORI) and NIH. K.Z. has received grant funding from Eisai (investigator-initiated study grant) and has participated on the SK Life Sciences Advisory Board. N.B. has received funding from SUNY Upstate Patient Advocacy Fund for a study not related to this article. L.T. received author royalties from UpToDate, payment/consulting fees for medical-legal consultation, and honoraria and support for conference fees for neurology/toxicology lectures, and participates on a Data Safety and Monitoring Board at Indian University for studies involving ethanol infusion. S.M. has received grant support from Cerevel Therapeutics and the Parkinson Foundation, consulting fees from Deep Brain Innovations LLC and Gray Matter Tech, Inc., honoraria for lectures or presentations from Clinical Care Options, Parkinson Foundation, and Michael J Fox Foundation, and travel support for attending the American Academy of Neurology and Michael J Fox Foundation meetings. M.F.’s effort on this project was supported by a department contract between the Masonic Institute for the Developing Brain and the Department of Neurology at the University of Minnesota. J.K.S. has received support from the Binational Scientific Foundation Grant for Culinary Medicine and textbook royalties from Textbook Essentials of PM&R and Easy EMG, has stocks from Simplified for lactation consulting, and is a Third Culture Capital venture partner. J.B.A. is funded by grants from the US Department of Defense (W81XWH-17-1-0619), the Evelyn F. McKnight Brain Institute (PI), LivaNova Inc, and NIH (R01HD102723 [PI]) for studies unrelated to this study, has received lecture honoraria from the Cleveland Clinic and travel funds from the International League Against Epilepsy, has received consultant fees from LivaNova Inc, participates on a Data Safety and Monitoring Board at the University of Alabama at Birmingham/University of Colorado Anschutz Medical Campus, serves on the American Epilepsy Society Scientific Program Committee, and serves as an associate editor for Epilepsy & Behavior Reports. All other authors report no interest to declare.
Funding Information
This project was not funded.
Supplementary Material
Supplementary data
References
Supplementary Material
Please find the following supplemental material available below.
For Open Access articles published under a Creative Commons License, all supplemental material carries the same license as the article it is associated with.
For non-Open Access articles published, all supplemental material carries a non-exclusive license, and permission requests for re-use of supplemental material or any part of supplemental material shall be sent directly to the copyright owner as specified in the copyright notice associated with the article.