
Abstract
Background:
Gender bias has been an ongoing issue in health care, examples being underrepresentation of women in health studies, trivialization of women's physical complaints, and discrimination in the awarding of research grants. We examine here a different issue—gender disparity when it comes to the allocation of research funding among diseases.
Materials and Methods:
We perform an analysis of funding by the U.S. National Institutes of Health (NIH) to ascertain possible gender disparity in its allocation of funds across diseases. We normalize funding level to disease burden, as measured by the Disability Adjusted Life Year, and we specifically consider diseases for which both disease burden and funding level are provided. We apply a power-law regression analysis to model funding commensurate with disease burden.
Results:
We find that in nearly three-quarters of the cases where a disease afflicts primarily one gender, the funding pattern favors males, in that either the disease affects more women and is underfunded (with respect to burden), or the disease affects more men and is overfunded. Moreover, the disparity between actual funding and that which is commensurate with burden is nearly twice as large for diseases that favor males versus those that favor females. A chi-square test yields a p-value of 0.015, suggesting that our conclusions are representative of the full NIH disease portfolio.
Conclusions:
NIH applies a disproportionate share of its resources to diseases that affect primarily men, at the expense of those that affect primarily women.
Introduction
There is little in the published literature when it comes to gender disparity in the allocation of research funds among diseases. A recent study of the funding of 18 different types of cancers by the National Cancer Institute found that gynecologic cancers (ovarian, cervical, uterine) ranked 10th, 12th and 14th, respectively, in funding normalized to years of life lost, whereas prostate cancer ranked 1st. 1 A study focusing on the disease myalgic encephalomyelitis/chronic fatigue syndrome (ME/CFS), ∼75% of whom afflicted are women, 2 found that disease to be the lowest funded (relative to disease burden) in the National Institutes of Health (NIH) portfolio. 3,4 In carrying out the ME/CFS study, it was observed that some of the lowest funded diseases relative to disease burden were ones that affect primarily women. We chose to examine this issue in greater depth, leading to the analysis reported herein.
Gender bias has been an ongoing issue in health care and has manifested itself in a number of different ways. Other examples include the underrepresentation of women in health studies, the trivialization of women's complaints, and discrimination in the awarding of research grants.
Historically, the underrepresentation of women in health studies and clinical trials has been pervasive.
5
A well-known example is a 1980s study of whether a daily dose of aspirin would reduce cardiovascular mortality, where all 22,071 subjects were male.
6
In 1985, the Public Health Service Task Force on Women's Health Issues released a report advising that “the historical lack of research focus on women's health concerns has compromised the quality of health information available to women as well as the health care they receive.”
7,8
In response, the NIH announced a new policy that urged researchers to include women in their clinical studies.5(p24) However, a 1990 Government Accountability Office report found that the NIH failed to communicate its policy to grant applicants and was still instructing reviewers to not consider the inclusion of women as a factor when evaluating scientific merit.
9
That same year, NIH formed the Office of Research on Women's Health, one of whose primary missions has been to ensure that NIH-funded research accounts for sex as a biological variable (see
An issue commonly faced by women is having their physical complaints trivialized or misdiagnosed as psychologically based. As noted by Tasca et al., 10 the concept of hysteria as a mental disorder attributable to women goes back 4,000 years and was commonly used to misdiagnose females until the turn of the 20th century; it took until 1980 for hysterical neurosis to be deleted from the Diagnostic and Statistical Manual of Mental Disorders. A more recent example is that of the disease myalgic encephalomyelitis (ME), also known as chronic fatigue syndrome (CFS), for which ∼75% of those affected are women. 2 After a 1984 outbreak in Incline Village, NV, the medical community, unable to identify a specific cause, described the disease as being psychogenic.5(p254) Stephen Straus, an expert virologist working at NIH, stated: “The demography of this syndrome reflects an excessive risk for educated adult white women.… A less casual appraisal, however, often uncovers histories of unachievable ambition, poor coping skills, and somatic complaints.” 11 In 2015, the Institute of Medicine (now the National Academy of Medicine) issued a comprehensive report characterizing ME/CFS as “a serious, chronic, complex, multisystem disease that frequently and dramatically limits the activities of affected patients,” 2 thereby refuting the prevailing psychogenic characterization.
An additional area of gender bias has been in the awarding of research grants. This is elucidated by Wessel 12 in her analysis of the NIH grant process, where she concludes that women indeed face gender bias, particularly when it comes to renewing grants. Kaatz et al., 13 in their analysis of NIH reviews, state: “The authors' analyses suggest that subtle gender bias may continue to operate in the post-2009 NIH review format in ways that could lead reviewers to implicitly hold male and female applicants to different standards of evaluation, particularly for R01 renewals.” Witteman et al. 14 conclude from their analysis of the Canadian Institutes of Health Research grant process that “Gender gaps in grant funding are attributable to less favourable assessments of women as principal investigators, not of the quality of their proposed research.”
In this work, we extend the analysis of Mirin et al. 4 to examine gender disparity among the full spectrum of NIH-funded diseases. That analysis used statistical regression to compare funding of diseases relative to disease burden, using NIH data, to develop an estimate of burden-commensurate funding. Actual funding was compared with burden-commensurate funding to determine which diseases are relatively underfunded or overfunded. Here, we correlate the degree of under- or overfunding with the gender prevalence of each disease.
Materials and Methods
Disease burden
Our approach for comparing funding of diseases is to use disease burden as a normalizing factor. Compared with the simpler dollars per patient measure, normalizing with respect to burden creates a more meaningful comparison by factoring in the impact of the disease.
Disease burden is most often measured in terms of morbidity (the extent of disability) and mortality (the rate and prematureness of death), although economic and sociological factors could be considered as well. 15 For the purposes of this study, we quantify burden using the Disability Adjusted Life Year (DALY), a measure that estimates the number of years lost due to an illness. The DALY was developed by the World Health Organization 16 and has been used by the NIH to compare its allocation of funding across selected diseases. 17 The DALY folds prevalence, morbidity, and mortality into a single measure that represents the sum of years lost due to disability (YLD) and years lost due to death (YLL). It can therefore be used to compare impacts of primarily disabling diseases with those of primarily deadly diseases.
The DALY can be defined using either disease incidence or prevalence. The global burden of disease (GBD) study, 18 from which the NIH obtains its burden data, uses the prevalence-based method, through which
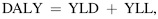
with YLD = P × DW and YLL = N × L. Here P is the prevalence, or number of people with the condition in a given year; DW is the disability weight, a number ranging from 0 to 1 that measures the fraction of lost time due to the severity of the condition; N is the number of deaths due to the condition in that year; and L is the average loss in life expectancy per death.
We use DALY values and research funding amounts provided by NIH. NIH periodically makes this information available, most recently for the year 2015. 18 The burden information provided therein is based on the work of Kassebaum et al. 19 NIH normally reports its research investments using the Research, Condition, and Disease Categorization (RCDC) System. 20 This is a computerized process that analyzes NIH's portfolio of research grants, research and development contracts, and intramural research, to categorize funding according to disease and condition. A complete list of funded projects by category is provided. Because of differences between the GBD and RCDC disease categorizations, NIH provides burden information only for disease categories that it can successfully align. The 2015 data release by NIH contains 73 such categories. Despite best efforts, the alignment is not altogether satisfactory in that some of the categories are supersets of others (e.g., headaches and migraines). Our analysis uses the categories directly as provided by NIH (we excluded malaria because NIH failed to include its burden information in the spreadsheet for distribution).
Funding versus burden
We perform least-squares regression analyses using the NIH-supplied funding and burden information to determine funding levels that are commensurate with disease burden. Because both funding and burden vary across four orders of magnitude, we obtain a superior fit to the data using a power law approximation. We already carried out such an analysis in an earlier work, 4 where we matched the 2015 burden data to 2017 funding data, the latter made available through NIH's categorical spending report. 20 We chose to use the most recent funding data available at the time to reflect the most up-to-date spending priorities. The 2015 burden information was normalized to the growth in population from 2015 to 2017.
Results of that analysis are reproduced here (Fig. 1). Each blue point represents an NIH-funded disease, with the horizontal axis measuring burden (in DALYs) and the vertical axis measuring funding. Each axis is plotted on a logarithmic scale to represent numerical variations over several orders of magnitude. Hence, the resulting power law fit to the data (shown in green) presents itself as a straight line. Because of the logarithmic scale, the vertical distance between two points measures a percentage difference between the actual funding and that commensurate with the burden of the disease.
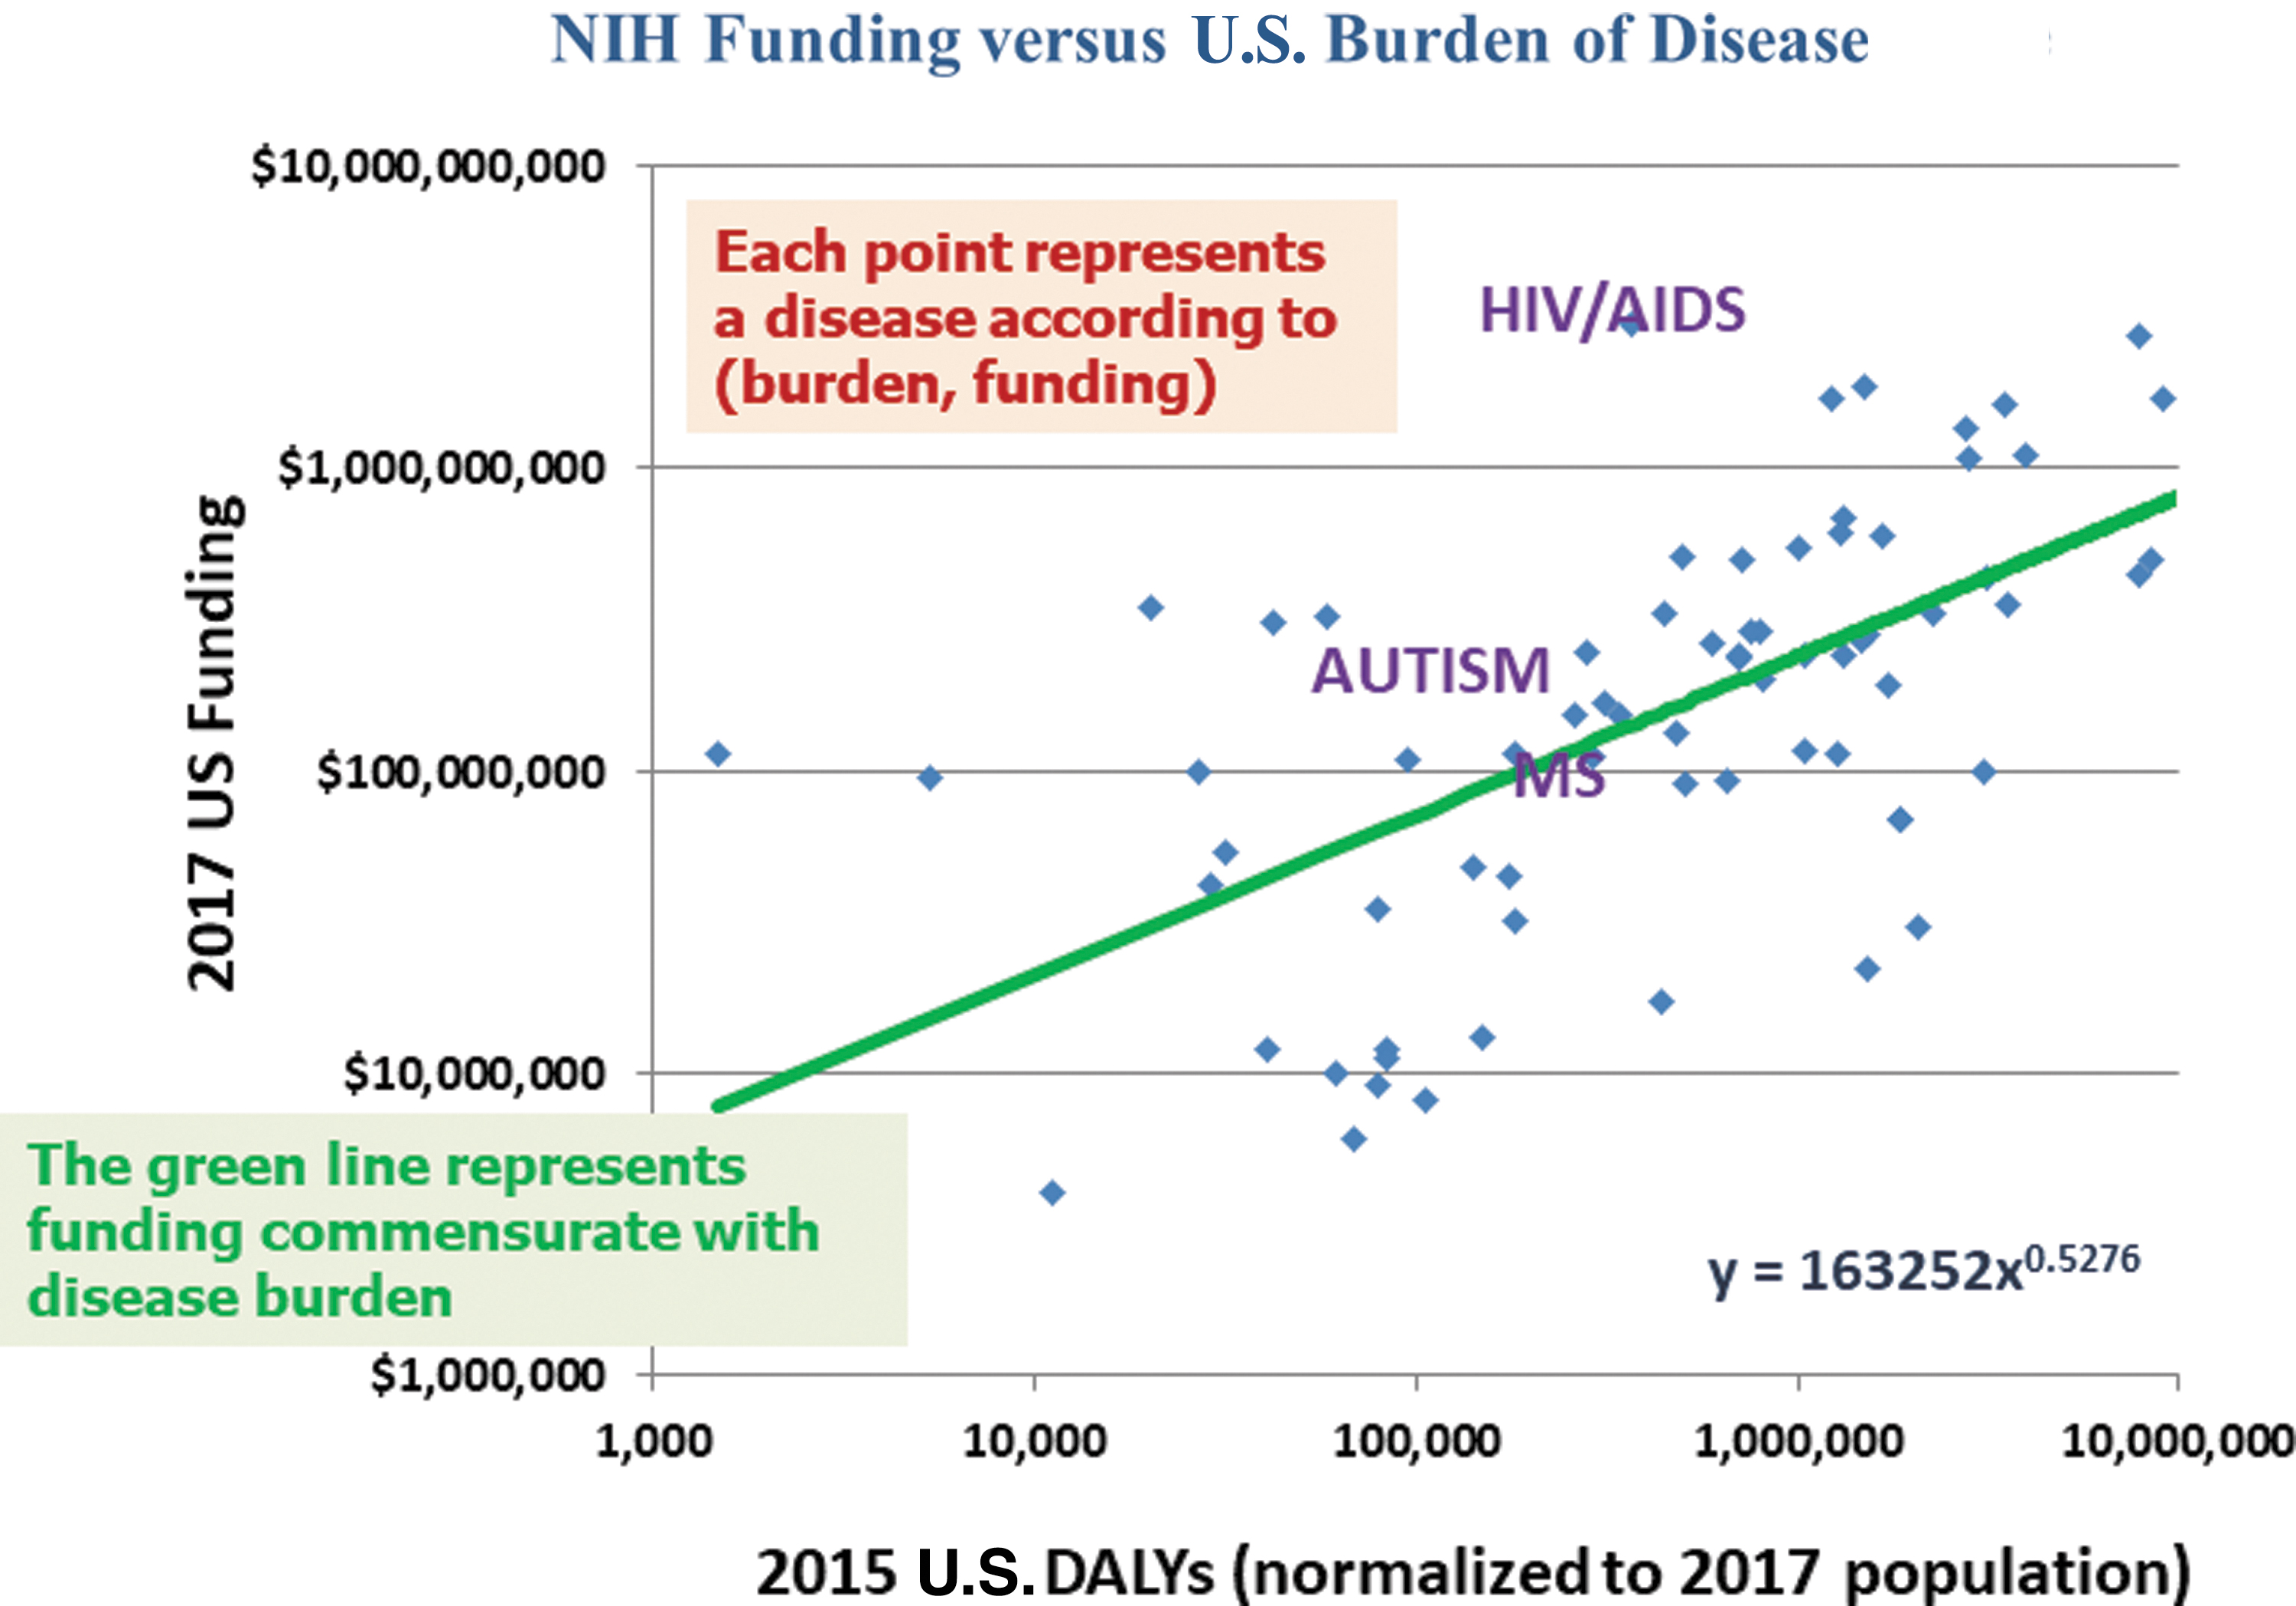
National Institutes of Health funding (2017) versus U.S. burden of disease (2015, normalized to 2017 population). The green line, produced using a power law regression analysis, represents funding commensurate with disease burden. (Figure adapted from Figure 2 of Mirin et al. 4 Reprinted with permission from IOS Press.)
Here we extend the above analysis with additional regression analyses matching the 2015 burden data to funding data from 2015 and 2019. 20 These, together with the analysis using 2017 funding, provide a perspective of how funding priorities have evolved over that 4-year period. The regression curves, of the form
are all nearly parabolic, with exponents (B) equal to 0.5144, 0.5276, and 0.5246 for years 2015, 2017, and 2019, respectively. The corresponding coefficients (A) are 0.1796, 0.1633, and 0.2049, respectively. The values of R 2 (which measures the variation of the data from the analytic fit) are all around 0.37.
All three regression analyses are based on the data provided by NIH for the 73 diseases included in its analysis of 2015 funding and burden. With burden information available for ME/CFS as well, 13 we include ME/CFS in our analysis of the regression results.
For each of the 74 diseases, we compute the ratio of actual funding to burden-commensurate funding, as represented by the green trend line (Fig. 1). We label a disease as underfunded if that ratio is <1 (its point will lie below the green line) and overfunded if that ratio is >1 (its point will lie above the green line). No ethical judgment is intended; this is merely a way of categorizing whether the funding for a particular disease is less than or greater than the value commensurate with its burden.
Gender prevalence of diseases
We evaluate whether each disease affects proportionally more American women or men, and for this purpose only we use the terminology female-dominant or male-dominant. This categorization is accomplished through an extensive literature search, with multiple sources having been identified for each disease (see Supplementary Appendix SA1). For a disease to be labeled as gender-dominant, we require that at least 60% of those afflicted be of that particular gender. This is to allow for prevalence inaccuracies and variation of information among the sources. We also identify diseases for which between 55% and 60% of those afflicted are of a particular gender and label those as semidominant. Remaining diseases are considered gender-neutral. This characterization is based strictly on prevalence and does not consider whether a disease more adversely affects a particular gender.
Results
Funding versus gender prevalence
Tables 1–5 list the 74 diseases included in this analysis. Table 1 contains the male-dominant diseases, Table 2 the female-dominant diseases, Table 3 the male-semidominant diseases, Table 4 the female-semidominant diseases, and Table 5 the gender-neutral diseases. Listed with each disease is the ratio of actual funding to that commensurate with disease burden for years 2015, 2017, and 2019 (based on the regression curve for the corresponding year). Also included are 2015 burden in DALY (millions) and 2019 funding (millions of dollars, obtained from RCDC funding source). In each table, diseases are ordered according to ratio of actual funding to that commensurate with disease burden for year 2019. A quick glance shows only one underfunded male-dominant disease (liver cancer), and more underfunded than overfunded female-dominant diseases. In addition, some of the most underfunded diseases are female-dominant (e.g., ME/CFS, migraine, headaches, anorexia, endometriosis), and some of the most overfunded are male-dominant (e.g., human immunodeficiency virus (HIV)/acquired immunodeficiency syndrome (AIDS), tuberculosis, hepatitis).
Male-Dominant Diseases, Along with Ratio of Actual to Burden-Commensurate Funding for Years 2015, 2017, and 2019, 2015 Burden (Disability Adjusted Life Year, Millions), and 2019 Funding ($M)
ADD, attention deficit disorder; DALY, disability adjusted life year; HIV, human immunodeficiency virus; AIDS, acquired immunodeficiency syndrome; NIDA, national institute on drug abuse.
Female-Dominant Diseases, Along with Ratio of Actual to Burden-Commensurate Funding for Years 2015, 2017, and 2019, 2015 Burden (Disability Adjusted Life Year, Millions), and 2019 Funding ($M)
ME, myalgic encephalomyelitis; CFS, chronic fatigue syndrome; LBW, low birth weight.
Male-Semidominant Diseases, Along with Ratio of Actual to Burden-Commensurate Funding for Years 2015, 2017, and 2019, 2015 Burden (Disability Adjusted Life Year, Millions), and 2019 Funding ($M)
Female-Semidominant Diseases, Along with Ratio of Actual to Burden-Commensurate Funding for Years 2015, 2017, and 2019, 2015 Burden (Disability Adjusted Life Year, Millions), and 2019 Funding ($M)
Gender-Neutral Diseases, Along with Ratio of Actual to Burden-Commensurate Funding for Years 2015, 2017, and 2019, 2015 Burden (Disability Adjusted Life Year, Millions), and 2019 Funding ($M)
A comparison of the macroscopic results from these funding analyses is shown in Table 6. We see, for example, that in 2019, of the underfunded diseases, 14 are female-dominant and only 1 is male-dominant. Of the overfunded diseases, 11 are male-dominant, while only 8 are female-dominant. Altogether, we identify 25 diseases that are male-favored (either female-dominant and underfunded, or male-dominant and overfunded) and just 9 diseases that are female-favored (either female-dominant and overfunded, or male-dominant and underfunded). That is, 74% of the nongender-neutral diseases favor males, and 26% favor females. This pattern is roughly static across all three budget years.
Comparison of 2015, 2017, and 2019 Funding Analyses
Deviation measures the extent to which funding differs (multiplicatively) from that which is burden-commensurate.
We next examine the magnitude of the disparity between actual funding and that which is commensurate with burden. We define the funding factor for a disease to be the ratio of the actual funding to burden-commensurate funding if the disease is overfunded, and the ratio of the burden-commensurate funding to the actual funding if the disease is underfunded. Having the funding factor always >1 allows a symmetric quantitative assessment of overfunded and underfunded diseases. 21
We define the male-favored and female-favored deviations as the average of the funding factors for the male-favored and female-favored diseases, respectively. We find that for 2019, the male-favored and female-favored deviations are 5.19 and 2.82, respectively. Not only are there almost three times as many male-favored diseases as female-favored diseases, but the degree of funding disparity for the male-favored diseases (extent to which male-dominant diseases are overfunded and female-dominant diseases underfunded) is nearly twice as large as that for the female-favored diseases. Looking across all three budget years, we do observe a slightly downward trend in the male-favored deviation (from 5.98 to 5.19) and a slightly upward trend in the female-favored deviation (from 2.40 to 2.82). That is, the deviation of funding of male-favored diseases from burden-commensurate evolves from a factor of nearly 6 to just under 5, and the corresponding evolution for female-favored diseases stays within the two- to threefold range. Neither of these evolutions is significant, although the ratio (which is a measure of gender disparity) does reduce from 2.49 to 1.84 over the 4-year period, a 26% decrease.
Extension to all NIH-funded diseases
We now examine whether this subset of 74 diseases, for which both funding and burden data are available, is representative of the full NIH portfolio of nearly 300 diseases when it comes to gender disparity of funding. We perform this evaluation using the 2019 funding data. Recall that of the underfunded diseases, 14 are female-dominant and 1 is male-dominant, and of the overfunded diseases, 8 are female-dominant and 11 are male-dominant. If there were no funding bias, then one would expect equal numbers of female- and male-dominated diseases in each category, meaning 7.5 underfunded diseases and 9.5 overfunded diseases with regard to each gender. A chi-square test gives a p-value of 0.015, strongly suggesting that our analysis is representative of the nearly 300 diseases contained in NIH's Categorical Spending report.
Inclusion of semidominant diseases
Including the semidominant diseases (those having between 55% and 60% afflicted of a particular gender) in our analysis of 2019 funding data results in four additional male-favored diseases and three additional female-favored diseases. The fraction of male-favored diseases drops from 74% to 71%. The male-favored and female-favored deviations are 5.17 and 2.73, respectively, and the chi-square test yields a p-value of 0.02.
Discussion
Summary of results
We have performed an analysis of funding by the NIH to ascertain possible gender disparity in its allocation of funds across diseases. We have restricted this analysis to diseases where both disease burden and funding level are provided and have normalized funding level to disease burden. Focusing on the most recent (2019) funding data: Of the 34 diseases that afflict proportionately more of one gender, 25 are male-favored in that they are either female-dominant and underfunded, or male-dominant and overfunded; the other 9 are female-favored. Furthermore, the disparity between actual funding and burden-commensurate funding is nearly twice as large for the male-favored diseases compared with the female-favored diseases. The small p-value of 0.015 suggests that these conclusions extend to the full NIH portfolio of diseases. Over the 2015–2019 time span, the number of male-favored and female-favored diseases remains relatively constant, with between 70% and 75% male-favored, although we do observe a downward trend in the ratio of the male-favored deviation to the female-favored deviation.
Limitations
Our effort to assess the gender prevalence of diseases was based on journal articles, government websites, medical website, university websites, newspaper articles, and other miscellaneous sources, in some cases going back more than a decade. In some cases, we initially encountered inconsistencies, and we expanded our literature search to include additional published sources to resolve these inconsistencies. We did not take into account the fact that women comprise 51% of the U.S. population and men 49%. For example, if a source cited 60% prevalence for men and 40% for women, we treated it the same as if the source had said that 60% of those afflicted were men.
As a countermeasure to inaccurate assessment of gender prevalence, we required that at least 60% of the people afflicted be of a particular gender for that disease to be labeled as gender-dominant. For a disease to be considered over- or underfunded, we required that its actual funding differs from that which is commensurate with its burden by at least 3% (this affected only one disease in each of the analyses).
Our criterion for designating a disease gender-dominant was based strictly on the prevalence of each gender afflicted. We did not consider whether a disease more adversely affects a particular gender. For example, we did not attempt to compare disease burden between the genders nor take into account socioeconomic issues. We are not aware whether such information can be mined from the global burden of disease study on which our burden data are based. We expect this would have only a minor effect on the results.
This study utilized the most recent U.S. burden data (2015) made available by the NIH at the time of this writing. There was hence a temporal mismatch when analyzing 2017 and 2019 funding in the context of 2015 burden. However, such information could be used to infer whether NIH was adjusting its funding priorities based on the available burden information.
Disease burden as a funding criterion and NIH funding priorities
NIH has pointed out that in addition to disease burden, its funding decisions consider scientific merit, scientific opportunity, portfolio balance, and budgetary considerations. 22 One would expect that disease burden would weigh heavily among these factors to ensure that the most burdensome diseases receive an equitable share of funding. A study by Gillum et al. 23 of 2006 NIH funding did find a correlation between funding and disease burden, but with DALY accounting for only one-third of the funding level variation (not markedly different from the results of the study reported herein). In the 2015 testimony before the Senate Appropriations Committee, Francis Collins, Director of NIH, stated: “Generally we look at the public health burden and it is a very-well-established way to do that. We also look at scientific opportunity because it's not going to be successful to throw money at a problem if nobody has an idea about what to do about it. We look at what our peer review process is telling us about the excellence of the science.” 24 Some might argue that there is always something to be learned about a disease—that if indeed very little is known, one could explore a variety of avenues to generate hypotheses that can then be tested; this would seem relevant particularly for diseases that are highly burdensome.
Dr. Collins made mention of the excellence of the science. With few exceptions, research proposals to work on a particular disease are weighed against proposals relating to other diseases, with an evaluation done based on scientific merit (see
The lack of disease prioritization was addressed in the 2015 Senate testimony of Francis Collins, in which the support for Alzheimer's was compared with that of HIV/AIDS. 24 Dr. Collins pointed out that each of the 27 institutes and centers had its own strategic plan, but they had not been synthesized into an overarching document to guide priority decisions. Senator Moran stated his expectation that NIH would make the best decisions possible regarding how funding is allocated so that the Congress would not have to step in to provide direction. This resulted in the formulation of an NIH-wide strategic plan covering FY2016–2020. 25 That plan called for disease burden as an important but not sole factor for setting funding priorities. As this is a high-level plan, it is difficult to tell how NIH's method of portfolio evaluation and guidance has evolved, and whether an improved procedure has been put in place to prioritize funding according to disease.
The approach of evaluating proposals based on scientific merit and hoping that the resulting portfolio somewhat reflects disease burden can only lead to fruition by coincidence. One idea is for NIH to use the RCDC and burden data to perform a funding versus burden analysis to identify shortfalls and excesses and evaluate the rationale for these discrepancies. This information could then be used to guide the funding process for coming years.
The same can be said when it comes to addressing gender disparity in funding. An important first step is for NIH to acknowledge that a problem does exist before they can seek to ameliorate it. NIH could invoke a methodology of its choosing (such as that contained herein) to analyze correlations between funding and affected gender. NIH could then set aside funding oriented toward underfunded diseases that affect primarily women. Another approach, although more complicated, would be to award bonus points to proposals in designated gender-disparity-reducing areas.
The role of stigma
A factor not brought out by Dr. Collins is that of stigma. In an article by Johnson 26 discussing NIH funding priorities, Claiborne Johnston, Dean of the Dell Medical School in Austin, Texas, in discussing chronic obstructive pulmonary disease (often caused by smoking) and liver disease (often caused by drinking) states: “we tend to underfund things where we blame the victim.” A number of diseases that are more common in women fall into this category. As pointed out by Dusenbery,5(p223) endometriosis, one of the most underfunded female-dominant diseases, was stereotyped as being brought on by women's life choices. We pointed out earlier that ME/CFS, also one of the most underfunded female-dominant diseases, was incorrectly deemed psychogenic and stigmatized for decades. In the case of multiple sclerosis, which affects predominately women, it took until the twentieth century to not be viewed as caused by hysteria5(p141); even now, its funding level is less than that commensurate with its disease burden.
Conclusions
We have demonstrated that NIH applies a disproportionate share of its resources to diseases that affect primarily men, at the expense of those that affect primarily women. Furthermore, we see at best marginal improvement in this trend over the 2015–2019 period.
One of the stated goals of NIH is “to exemplify and promote the highest level of scientific integrity, public accountability, and social responsibility in the conduct of science” (see
Footnotes
Acknowledgment
We wish to thank Leah R. Williams for her invaluable comments and suggestions.
Author Disclosure Statement
No competing financial interests exist.
Funding Information
No funding was received for this article.
Supplementary Material
Supplementary Appendix SA1
References
Supplementary Material
Please find the following supplemental material available below.
For Open Access articles published under a Creative Commons License, all supplemental material carries the same license as the article it is associated with.
For non-Open Access articles published, all supplemental material carries a non-exclusive license, and permission requests for re-use of supplemental material or any part of supplemental material shall be sent directly to the copyright owner as specified in the copyright notice associated with the article.