
Abstract
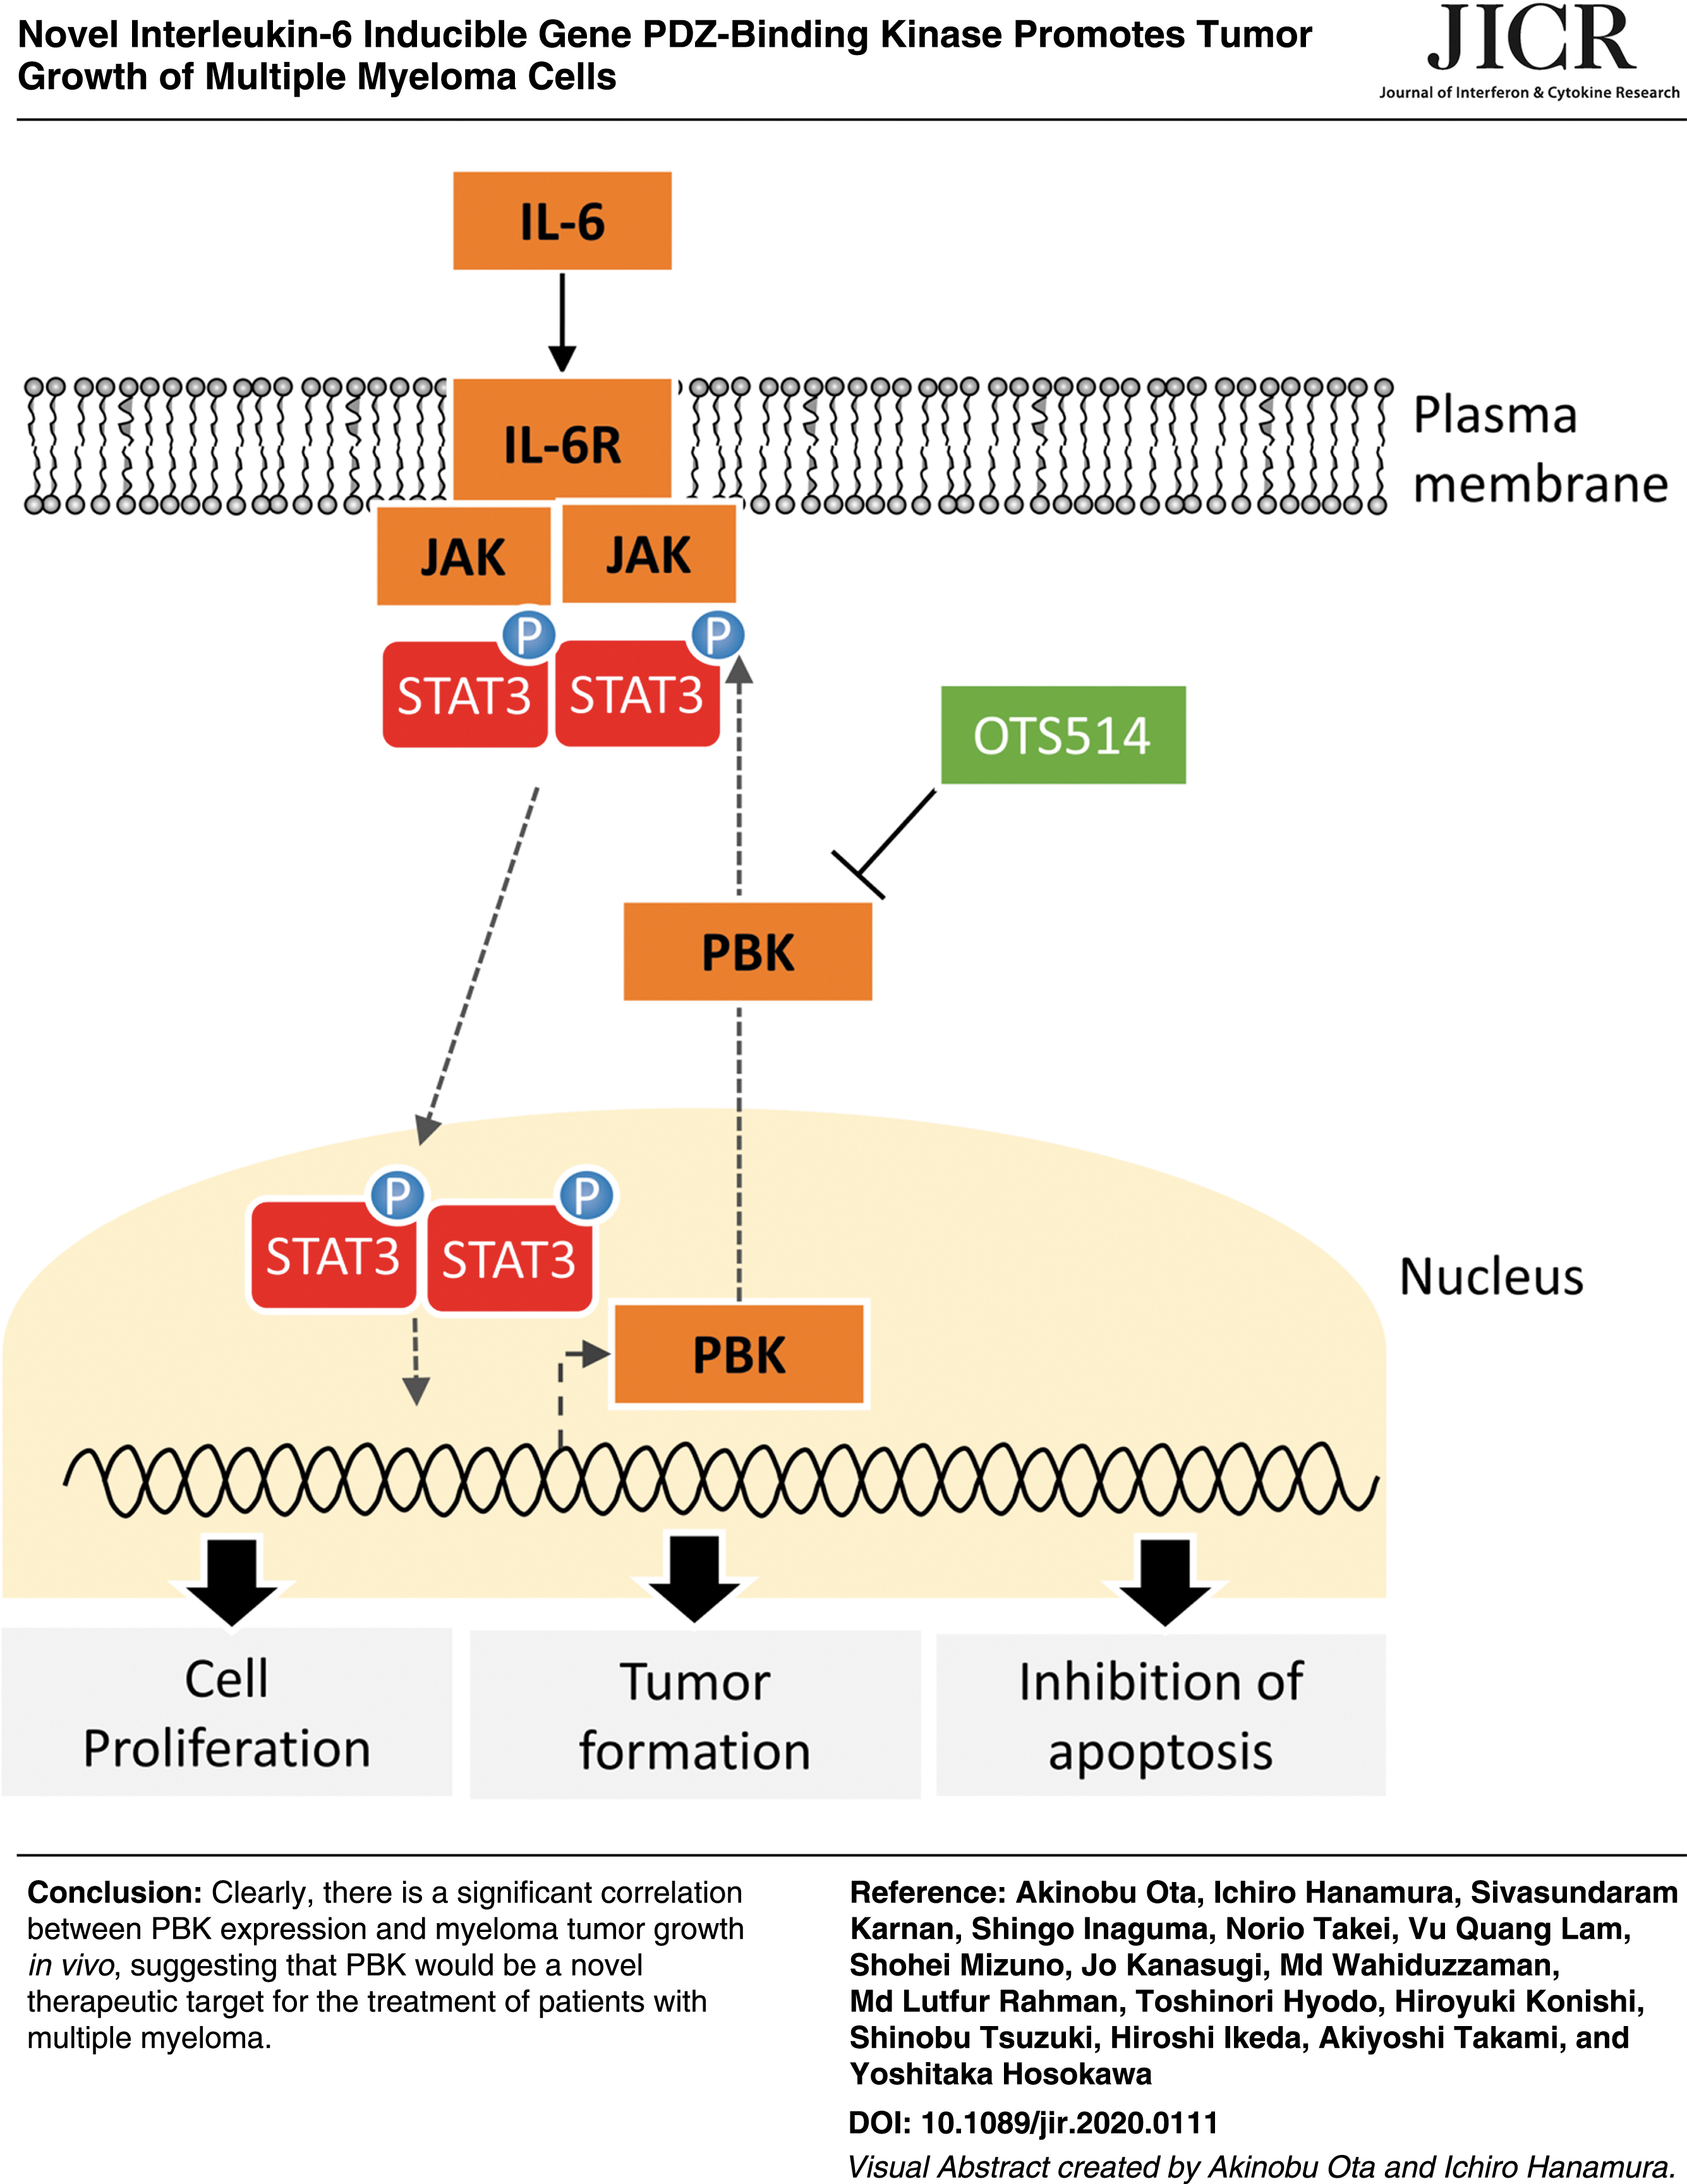
Multiple myeloma (MM) remains an intractable hematological malignancy, despite recent advances in anti-MM drugs. Here, we show that role of PDZ binding kinase (PBK) in MM tumor growth. We identified that interleukin-6 (IL-6) readily increases PBK expression. Kaplan–Meier analysis showed that the MM patients with higher expression of PBK have a significant shorter survival time compared with those with moderate/lower expression of PBK. Knockout of PBK dramatically suppressed in vivo tumor growth in MM cells, while genome editing of PBK changing from asparagine to serine substitution (rs3779620) slightly suppresses the tumor formation. Mechanistically, loss of PBK increased the number of apoptotic cells with concomitant decrease in the phosphorylation level of Stat3 as well as caspase activities. A novel PBK inhibitor OTS514 significantly decreased KMS-11-derived tumor growth. These findings highlight the novel oncogenic role of PBK in tumor growth of myeloma, and it might be a novel therapeutic target for the treatment of patients with MM.
Introduction
Multiple myeloma (MM) is a hematological malignancy caused by the abnormal expansion of bone marrow-derived plasma cells (Anderson and others 2011; Kumar and others 2017; Moreau and others 2017). MM primarily develops in the bone marrow microenvironment, where the bone marrow stromal cells support the survival and proliferation of MM cells by mediating expression of extracellular matrix proteins, cell surface molecules, and humoral factors, including interleukin-6 (IL-6) (Kawano and others 1998; Kishimoto 2010).
Recent accumulating evidence obtained using novel genomic approaches indicates the diversity of MM cells within individual patients and the complex pathophysiology of MM during its progression (Keats and others 2012; Kumar and others 2017). Although new classes of drugs have successfully prolonged the quality of life of MM patients, MM can subsequently progress into incurable bone marrow-independent diseases, such as extramedullary myeloma and plasma cell leukemia. Several prognostic factors and risk stratification that are based on cytogenetic abnormalities and biomarkers have been defined to predict the disease progression and prognosis (Boyd and others 2012; Mikhael and others 2013; Chng and others 2014). Therefore, novel therapeutics are required immediately to further improve the survival of patients with high-grade MMs.
PDZ-binding kinase (PBK), also known as T cell-originated protein kinase (TOPK), was initially identified as a mitotic kinase for mitogen-activated protein kinase (MAPK) and is involved in cytokinesis and spermatogenesis (Gaudet and others 2000; Matsumoto and others 2004; Fujibuchi and others 2005; Abe and others 2007; Park and others 2010). High expression of PBK is closely associated with patient survival and/or invasive phenotype of cancer, including hepatocellular carcinoma, gastric cancer, esophageal squamous cell carcinoma, prostate cancer, and oral cancer (Brown-Clay and others 2015; Chang and others 2016; Kwon and others 2016; Ohashi and others 2016, 2017; Yang and others 2017). It has been reported that PBK expression is controlled by E2F Transcription Factor 1 (E2F1), c-Myc, and forkhead box M1 (FoxM1) transcriptional factor, all of which are involved in cell proliferation (Hu and others 2013; Chen and others 2015; Yang and others 2017). Given the accumulating evidence showing the involvement of PBK in tumor progression, it would be of interest to investigate the role of PBK in the development of MM. However, the association of PBK expression with tumor proliferation of MM remains poorly understood.
In this study, we sought to examine the effect of PBK in the tumor growth of MM cells. To identify the genes related to myeloma cell growth, we performed comprehensive gene expression analysis using IL-6-independent human MM cell lines. Additionally, we obtained the gene expression data of a public cohort and verified the association of PBK expression with the overall survival (OS) of MM patients. To investigate the effect of PBK on the proliferation of MM cells, we generated human MM isogenic cell clones using genome editing technique. Furthermore, we proposed the molecular mechanism by which PBK plays a pivotal role in the survival of MM cells.
Materials and Methods
Reagents
RPMI-1640, penicillin–streptomycin solution, and trypsin-EDTA solution were purchased from Wako Pure Chemical Industries, Ltd. (Osaka, Japan). Thiazolyl Blue Tetrazolium Bromide (MTT) was purchased from Sigma-Aldrich (Tokyo, Japan). Mouse monoclonal anti-PBK antibody (B-10) was obtained from Santa Cruz Biotechnologies (Dallas, TX). Stat3 inhibitor SH-4-54 and a PBK inhibitor OTS514 were obtained from Selleck Chemicals, Inc. (Houston, TX).
Cell culture
Human MM cell lines, KMS-11, RPMI8226, KMM1, and FLAM-76, were obtained from the Japanese Collection of Research Bioresource Cell Bank. Human MM cell line, OCI-My5, was obtained from the Leibniz Institute DSMZ (Braunschweig, Germany). Human MM cell line, UTMC-2, was kindly provided by Dr. Shuji Ozaki (Tokushima Prefectural Central Hospital, Tokushima, Japan) (Ozaki and others 1994). IL-6-dependent MM cell line, ANBL-6, was kindly provided by Dr. Diane F. Jelinek (Mayo Clinic, Rochester, MN) (Jelinek and others 1993). Human MM cell lines, NCU-MM1 and AMU-MM1, were established at Nagoya City University Medical School and Aichi Medical University of Medicine, respectively (Iida and others 2000; Nagoshi and others 2012).
Gene expression analysis
IL-6-dependent cell lines, ANBL-6 and FLAM-76, were seeded in a six-well plate (5 × 10⁵ cells/well), and the cells were incubated for 48 h in the absence of IL-6. Following incubation for 48 h, the cells were treated with IL-6 (10 ng/mL) for 24 h. Total RNA was extracted by using NucleoSpin RNA with DNase treatment (TaKaRa Bio, Inc., Shiga, Japan). The experimental procedure for the complementary DNA (cDNA) microarray analysis was based on the manufacturer's protocol (Agilent Technologies, Santa Clara, CA), and has been described previously (Wahiduzzaman and others 2018). The raw microarray data have been submitted to the GEO database at NCBI (GSE115558). Gene set enrichment analysis (GSEA) was performed according to the instructions.
Quantitative reverse transcription–polymerase chain reaction analysis
Quantitative reverse transcription–polymerase chain reaction analysis was performed using SYBR Green I, as previously described (Takahashi and others 2013). Glyceraldehyde-3-phosphate dehydrogenase (GAPDH) was used as an internal control. The primers used in this study have been described in Supplementary Table S1.
Immunohistochemistry
Immunohistochemistry was performed to investigate the expression of PBK using anti-PBK antibody (B-10; Santa Cruz Biotechnologies). Human myeloma tissue slide was obtained from US Biomax, Inc. (Derwood, MD). Sequential sections of formalin-fixed, paraffin-embedded tissue samples were subjected to immunohistochemical staining and Hematoxylin/Eosin staining. Immunohistochemistry was performed using a Ventana BenchMark XT automated immunostainer with the iView (Roche Diagnostics, Basel, Switzerland) Detection Kit. Photographs were taken using a bright field microscope (BX-43; Olympus, Tokyo, Japan).
Western blot analysis
Western blot analysis was performed as described previously (Hossain and others 2015). The antibodies used in this study have been described in Supplementary Table S2. Immune complexes were detected using ImmunoStar LD (Wako Pure Chemical Industries, Ltd.) in conjunction with a LAS-4000 image analyzer (GE Healthcare, Tokyo, Japan). The full-length blots are included in Supplementary Fig. S1.
Luciferase reporter assay for PBK promoter activity
The 1216- (−1216 to +116) and 405- (−191 to +116) human PBK promoter region was amplified from genomic DNA of KMS-11 cells with KOD plus Neo polymerase (TOYOBO, Tokyo, Japan). The primer information has been indicated in Supplementary Table S1. The amplified DNA fragments were cloned into the pGL3 basic vector (Promega). Luciferase promoter activity assay was measured as described previously (Wahiduzzaman and others 2018).
PBK knockout using the clustered regularly interspaced short palindromic repeats-Cas9 system
Clustered regularly interspaced short palindromic repeats (CRISPR)-Cas9 system was used to disrupt the expression of PBK gene, as described elsewhere (Ota and others 2017). pSpCas9(BB)-2A-GFP (PX458) and lentiCRISPR v2 were gifts from Feng Zhang (Addgene plasmids No. 48138 for PX458 and No. 52961 for lentiCRISPR v2) (Ran and others 2013; Sanjana and others 2014). The single-guide RNA (sgRNA) sequence for PBK Exon 3 and Exon 5 were 5′-GAGGCCGGGATATTTATAGT and 5′-CGCTATCTGAGCAGCGCTCA, respectively. For lentivirus preparation, 293T cells (4 × 10⁶ cells/dish) were seeded in a 10 cm dish 1 day before transfection. Lentiviral lentiCRISPR v2 containing PBK sgRNA, viral packaging vector psPAX2 (a gift from Didier Trono; Addgene plasmid No. 12260), and viral envelope vector pCMV-VSV-G (a gift from Bob Weinberg; Addgene plasmid No. 8454) (Stewart and others 2003) were diluted at a ratio of 4:3:2 in Opti-MEM medium (Thermo Fisher Scientific K.K., Tokyo, Japan).
Cell viability (MTT) assay
The MM cells were seeded in 96-well culture plates (1 × 10⁴ cells/well) and were then incubated with culture medium. After incubation for 72 h, MTT assay was performed as described previously (Wahiduzzaman and others 2018). The absorbance at 545 nm was measured using a SpectraMAX M5 spectrophotometer (Molecular Devices, Sunnyvale, CA).
Soft agar colony formation assay
The soft agar colony formation assay was carried out as described previously (Wahiduzzaman and others 2018). The parental KMS-11 cells and KMS-11/PBK−/− cell clones (1 × 10³ cells/well) were cast in 2 mL of top layer comprising 0.4% agarose (Bacto agar; BD Biosciences) and poured on top of a 2 mL bottom layer containing 0.6% agarose in six-well plates. After incubation for 14–17 days, the colonies were stained with MTT solution (5 mg/mL) in phosphate-buffered saline. Photographs were taken using a bright field microscope (IX-73; Olympus).
Annexin V assay
The Annexin V assay was carried out as described previously (Wahiduzzaman and others 2018). The MM cells were seeded in six-well culture plates (5 × 10⁵ cells/well). Next, the cells were incubated with culture medium for 48 h, followed by incubation with Annexin V (Ax)-FITC and Propidium Iodide (PI; 10 μg/mL) at 25°C room temperature for 15 min. Finally, fluorescence intensities were determined by fluorescence-activated cell sorting (FACS) using a FACSCantoII (BD, Franklin Lakes, NJ).
Cell cycle analysis for sub-G1 population
The Cell cycle analysis for sub-G1 population was carried out as described previously (Wahiduzzaman and others 2018). The MM cells (5 × 10⁵ cells/well) were seeded and incubated as described above. For FACS analysis, the cells were collected at 48 h after treatment and fixed in 70% ethanol overnight at −30°C. After fixation, the cells were treated with RNase A (100 μg/mL) and stained with PI (100 μg/mL). The percentages of cells in the sub-G1 phase were measured using FlowJo software (Tree Star, Inc., Ashland, OR).
Measurement of caspase-3/7 activity
The caspase -3/7 assay was performed using an Apo-ONE Homogeneous Caspase-3/7 Assay Kit (Promega KK, Tokyo, Japan) according to the manufacturer's instructions and as described previously (Wahiduzzaman and others 2018). Briefly, cells (1 × 10⁴ cells/well) were seeded in a 96-well culture plate and were incubated for 24 h. Caspase-3/7 reagent (100 μL) containing Z-DEVD-R110 was added to each well. Fluorescence intensity (499 nm excitation and 521 nm emission) was measured using a SpectraMax M5 spectrophotometer (Molecular Devices).
Xenograft experiment
The use of animals for the study was approved by the Ethics Committee on the Institute of Animal Experiments of Aichi Medical University (No. 2018-67). All the experiment protocols for using mice in the study were followed according to relevant guidelines and regulation of animal care. Female FOX CHASE severely compromised immunodeficient (SCID) C.B-17/lcr-scid/scidJcl mice (6- to 8-week-old) were purchased from CLEA Japan, Inc. (Tokyo, Japan) and bred in accordance with the institution guidelines. Briefly, KMS-11 or 2 × 10⁷ cells were injected subcutaneously into Scid mice. In mice injected with KMS-11 cells, when the tumor size had reached 500 mm3, OTS514 (10 mg/kg, every 2 days) was intraperitoneally administered. Tumors and body weights were measured every 3 or 4 days. Tumor volume (mm3) was calculated by using the modified ellipsoid formula 1/2 (length × width2). At the same time, body weight was measured, and (1) when a weight increase of 10% or more and/or (2) when a tumor size increase of more than 2,000 mm3 was observed as compared with noncancer-bearing mice of the same age, euthanasia was performed as a measure for reducing pain as early as possible. The central disruption (cervical dislocation) method was used as the method of euthanasia under anesthesia with isoflurane. After that, the cancer tissue was collected, total RNA and protein were extracted, and used for biochemical analysis. To minimize the number of animals used per experiment, we typically set the number of mice as 6 (up to 10), unless otherwise stated.
Statistical analyses
Statistical analyses were performed using SPSS software, version 23.0 (SPSS, Inc., Chicago, IL). Kaplan–Meier analysis was performed with EZR (Saitama Medical Center, Jichi Medical University, Saitama, Japan), which is a graphical user interface for R (Kanda 2013).
Results
IL-6 transcriptionally upregulates expression of PBK in human myeloma cells
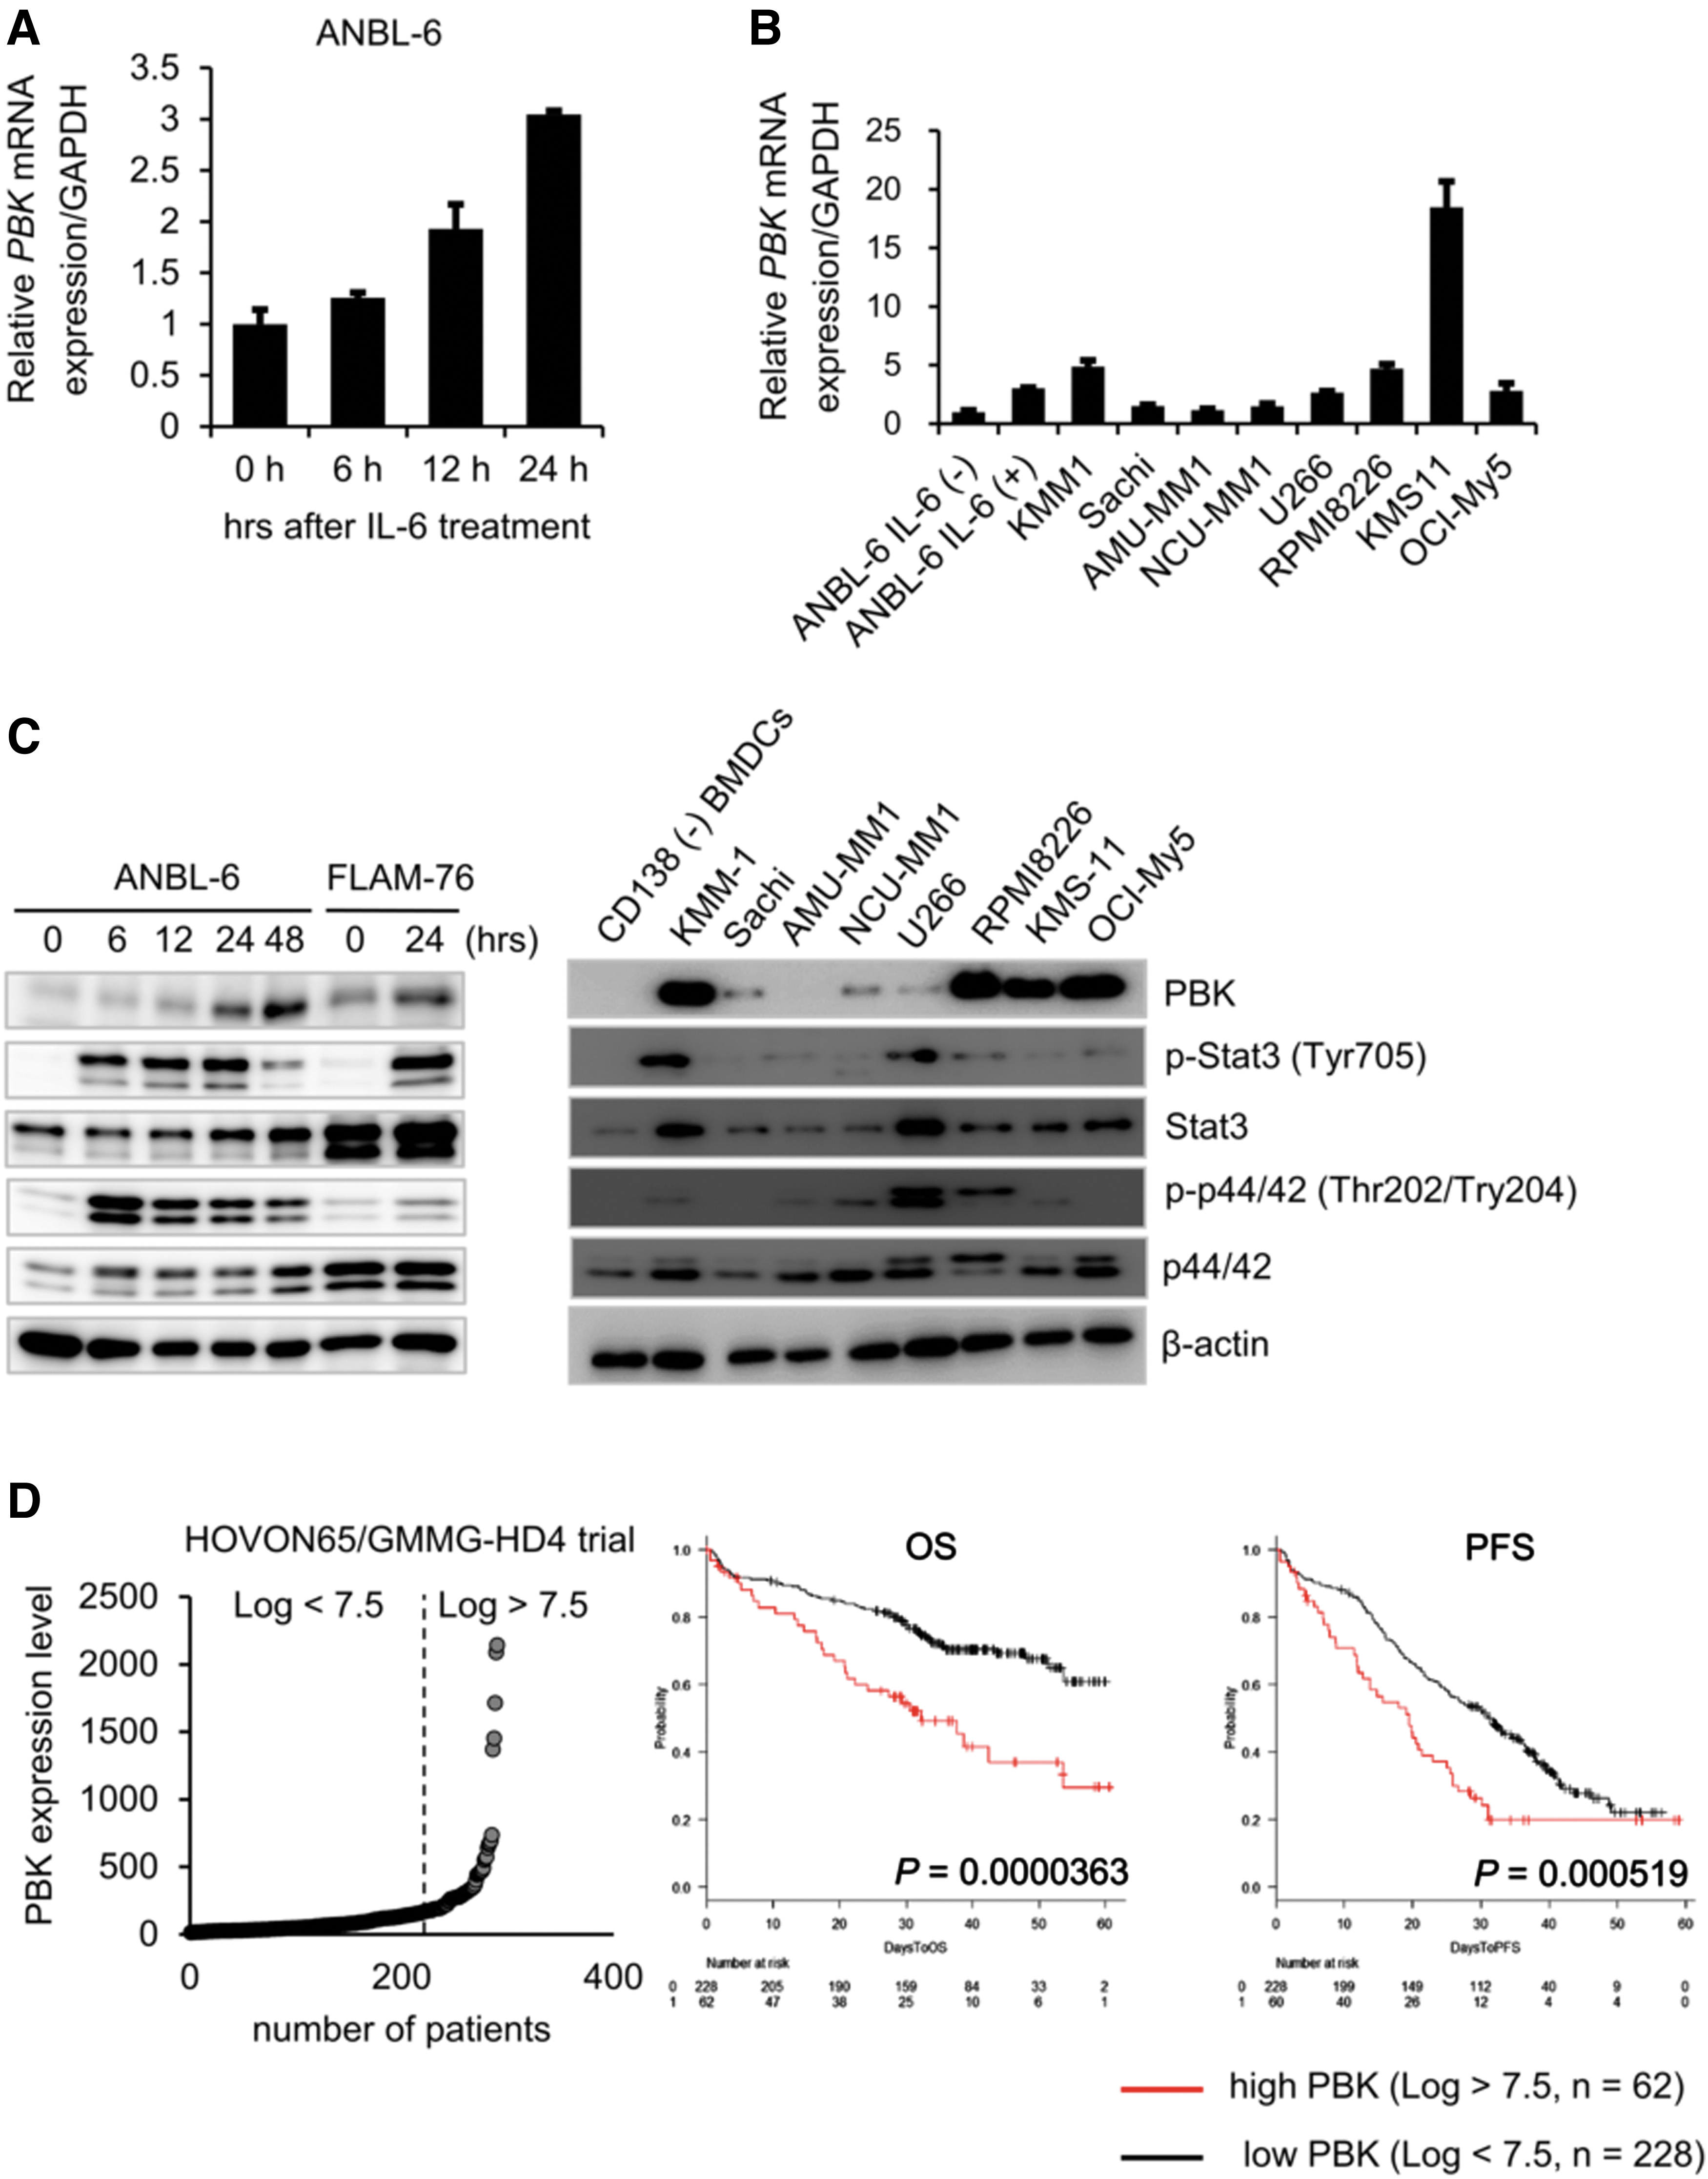
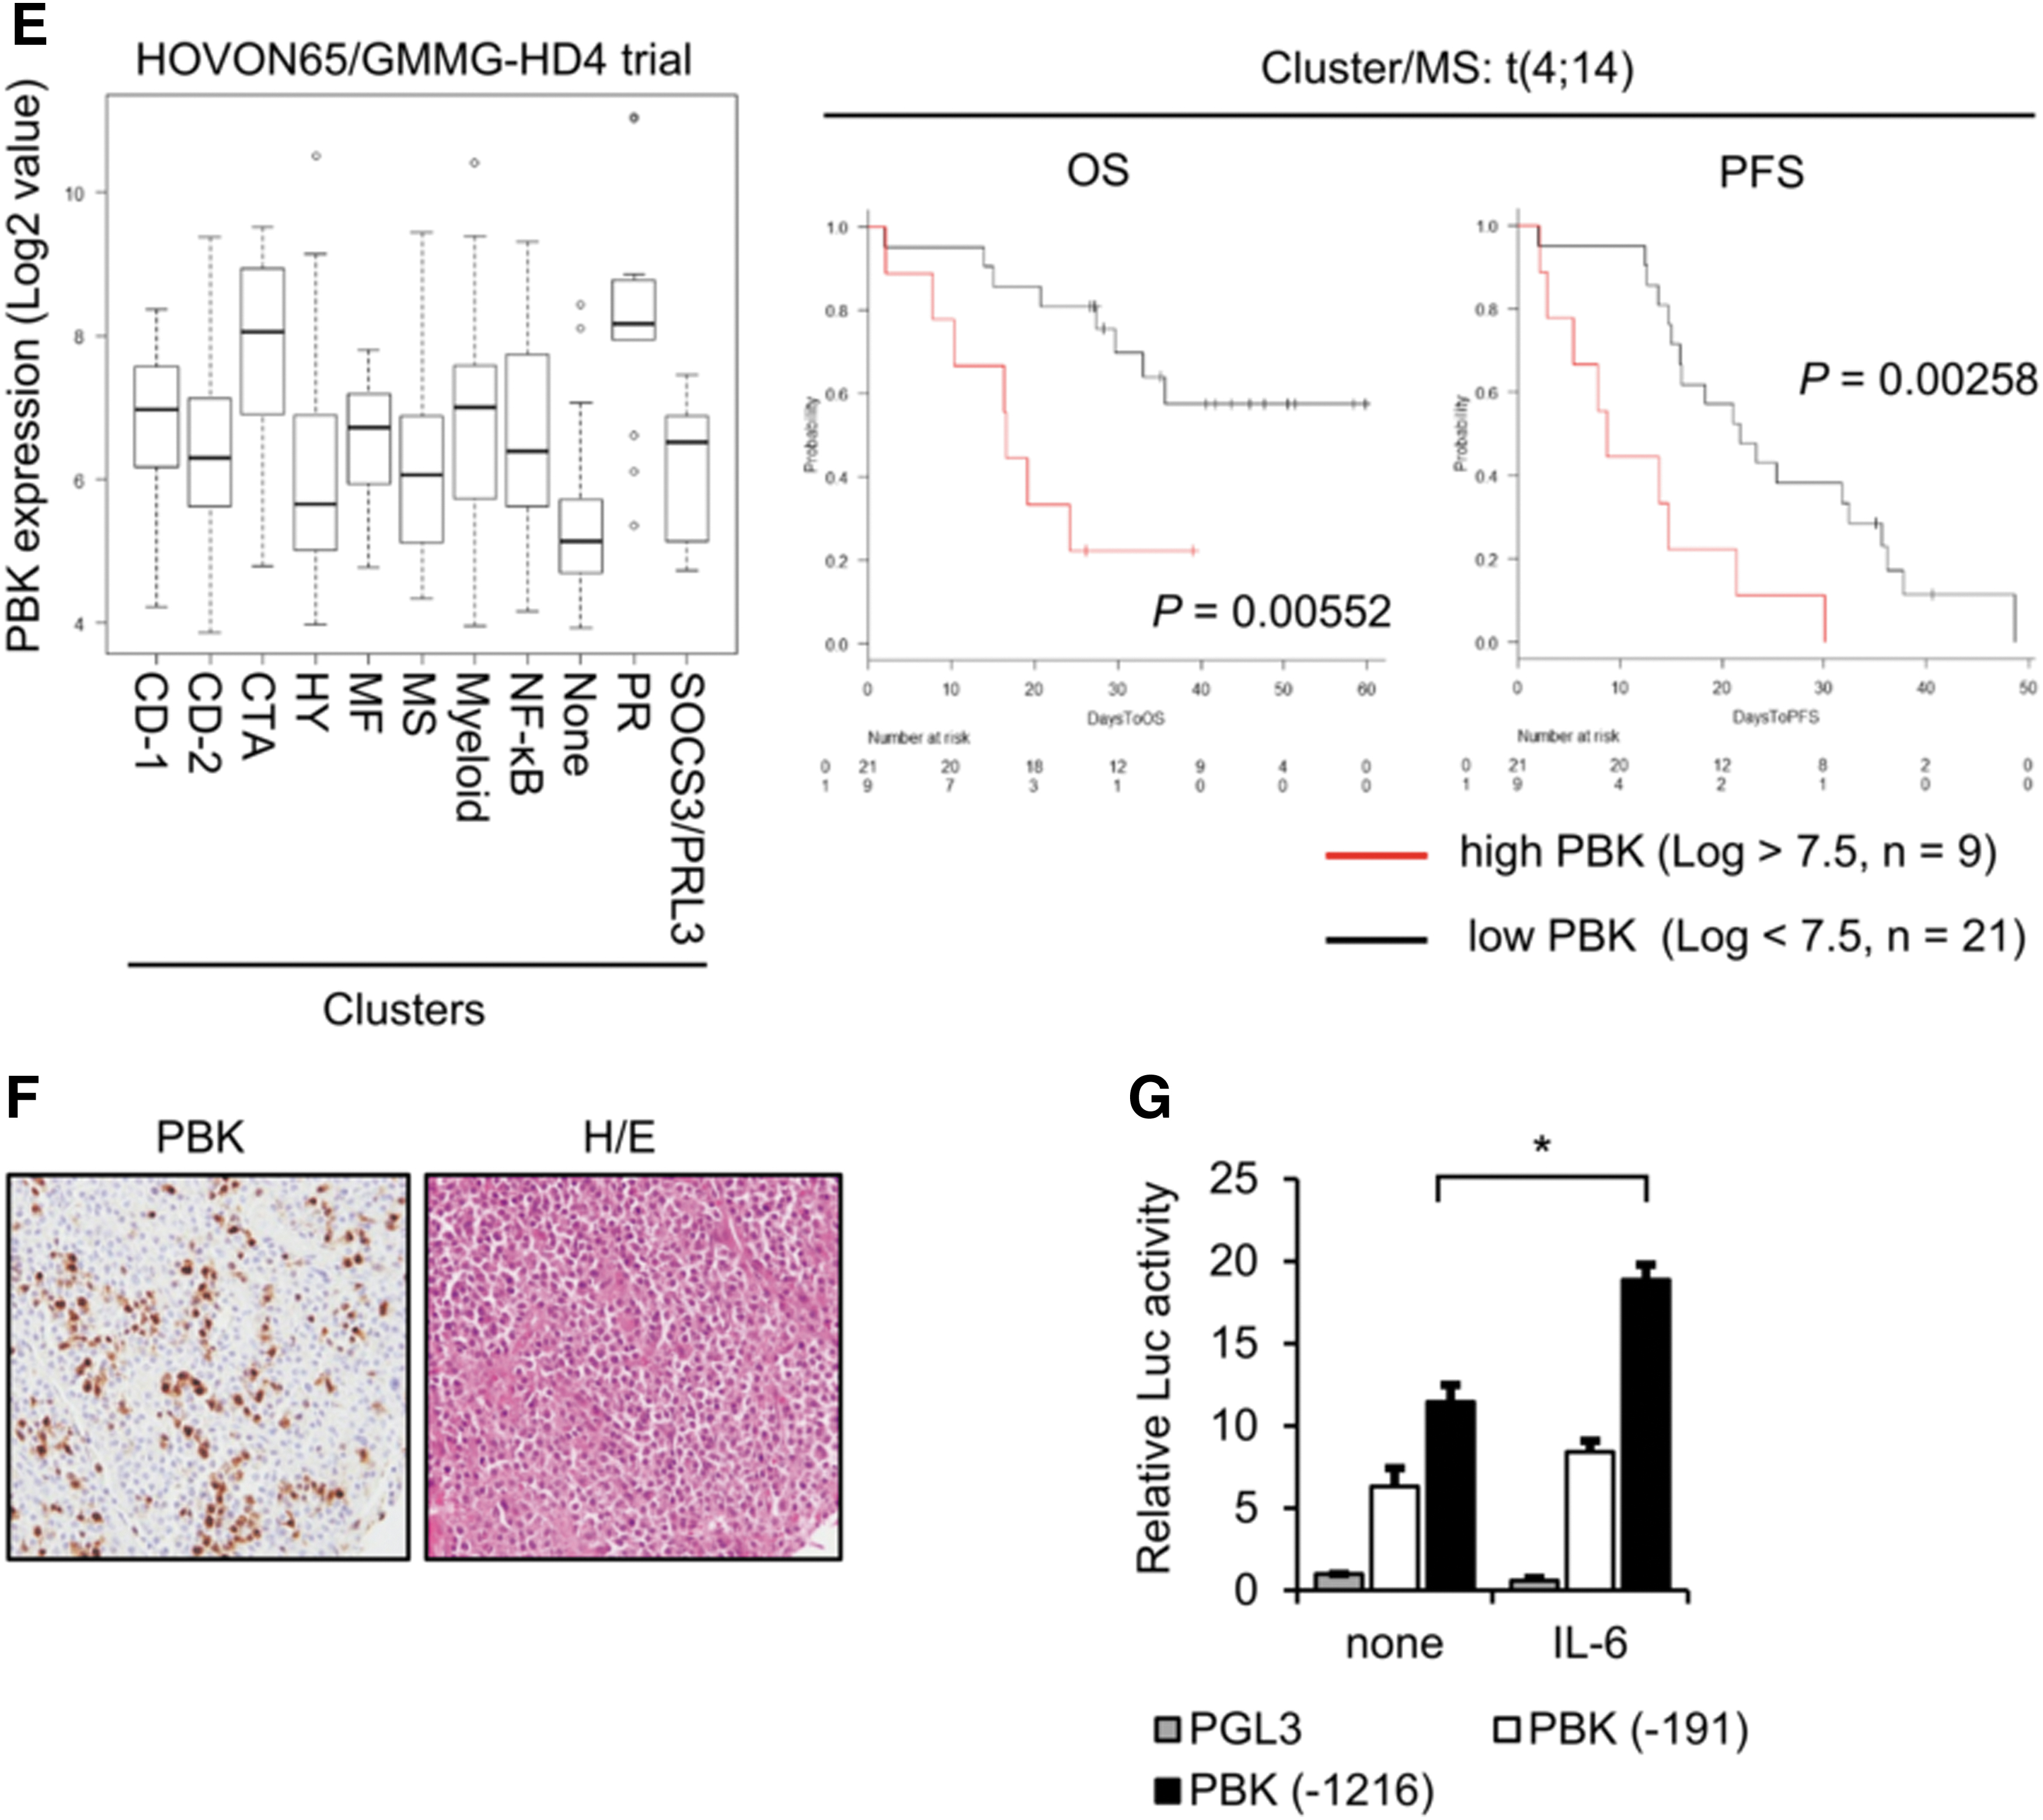
IL-6 is well known to play a pivotal role in both survival and growth of MM cells (Kawano and others 1998). To investigate IL-6 inducible genes, which are associated with MM cell growth and related to prognosis of MM patients, we first examined the effect of IL-6 on gene expression changes in IL-6-dependent cell lines ANBL-6 and FLAM-76. We found that messenger RNA (mRNA) expression levels of several genes, including known IL-6-inducible gene SPP1, increased following 24 h of IL-6 treatment (Table 1). Among the genes, we found that the expression of PBK, a serine/threonine kinase, significantly increased in ANBL-6 cells in a time-dependent manner (Fig. 1A). We also detected strong mRNA expression of PBK in IL-6-independent MM cell lines (Fig. 1B). Furthermore, Western blot analysis showed that PBK expression increased in IL-6-treated ANBL-6 and FLAM-76 cells, whereas strong PBK expression was detected in a subset of MM cell lines but not in bone marrow-derived CD138-negative cells (Fig. 1C). We also observed that in both IL-6-treated MM cells and IL-6-independent cell lines, where PBK expression was detected, phosphorylation levels of both Stat3 and Erk (p44/42) concomitantly increased (Fig. 1C). To further validate the expression of PBK in MM, a public cohort of 290 patients, HOVON-65/GMMG-HD4 (GSE19784) was analyzed (Supplementary Table S3) (Kuiper and others 2012; Broyl and others 2010). According to the log2 value of PBK probe (219148_at), patients were divided into 2 groups: high (log2 value >7.5, n = 62) and low (log2 value <7.5, n = 228) PBK expression. Of note, high PBK expression was significantly associated with both OS (P = 0.0000363) and progression-free survival (PFS; P = 0.000519) (Fig. 1D), PBK expression may be associated with tumor growth of MM. To further define the impact of PBK expression on disease progression, OS, and PFS, we examined the association between PBK expression and the International Staging System (ISS) or the gene cluster groups in the HOVON trial using statistical analyses. We found that PBK expression levels significantly increased in ISS stage II (P = 0.047) and stage III (P = 0.011) compared with ISS stage I (Table 2), which suggests that PBK expression may be associated with disease progression of MM. In addition, the Kruskal–Wallis test with 11 gene expression clusters revealed that high PBK expression is observed in the clusters of cancer testis antigens (CTA) and the proliferation-associated genes (PR) (Supplementary Table S4 and Fig. 1E). Importantly, we found that high PBK expression was significantly associated with both OS (P = 0.00552) and PFS (P = 0.00258) in the MS cluster showing translocation t(4;14), which is one of the prognostic parameters of patients with MM. In addition, we found that high PBK expression was significantly associated with PFS (P = 0.0254) in the MF cluster showing translocation t(14;16) or t(14;20) (Supplementary Fig. S2). Furthermore, one-way analysis of variance showed that PBK expression is significantly associated with the ISS stages in the MS groups, but not other groups (I versus III, P = 0.0056; Supplementary Fig. S2). These results indicate that PBK expression may have significant impact as a poor prognostic marker and may be independent from other prognostic parameters, such as t(4;14). We next examined the protein expression of PBK in MM using immunohistochemistry and Western blot analysis. Immunohistochemistry showed that PBK expression was specifically detected in the PBK+/+ KMS-11 cells but not in the genetically modified PBK−/− KMS-11 cells (Supplementary Fig. S3). Immunohistochemistry showed that PBK expression was detectable in both nucleus and cytoplasm of myeloma cells in the tissues of MM patients (Fig. 1F). Our database analysis showed that chromosomal copy number in PBK gene locus increased in the series of MM cell lines (gain, 23%; Supplementary Fig. S4). Furthermore, luciferase reporter gene assay showed that IL-6 treatment significantly increased PBK promoter activity in ANBL-6 cells expressing PBK (-1216)-luciferase (luc) but not in cells expressing PBK (-191)-luc and control luc (Fig. 1G). These results suggest that PBK gene expression could be induced by stimulation of IL-6 in MM cells.
Upregulation of PBK expression in MM cells.
Upregulated Genes After Interleukin-6 Treatment in Interleukin-6-Dependent Multiple Myeloma Cell Lines
Bold values show the FC in gene expression of PBK at 24 h after IL-6 stimulation in IL-6-dependent MM cell lines.
FC was calculated using cDNA microarray data as followed: dividing the Log2 values of IL-6-treated cells (24 h) by the untreated cells. The raw microarray data have been submitted to the GEO database at NCBI (GSE115558).
cDNA, complementary DNA; FC, fold change; IL-6, interleukin-6.
Relationship Between Clinical Characteristics and Gene Expression of PDZ-Binding Kinase in the HOVON-65/GMMG-HD4 Clinical Trial
PBK expression low, log2 <7.5; PBK expression high, log2 >7.5. The statistical analysis was performed using one-way ANOVA with pairwise comparison (Turkey).
ANOVA, analysis of variance; ISS, International Staging System; NA, not analyzed; PBK, PDZ-binding kinase; SD, standard deviation.
Disruption of PBK expression suppresses tumor cell growth in vitro and in vivo
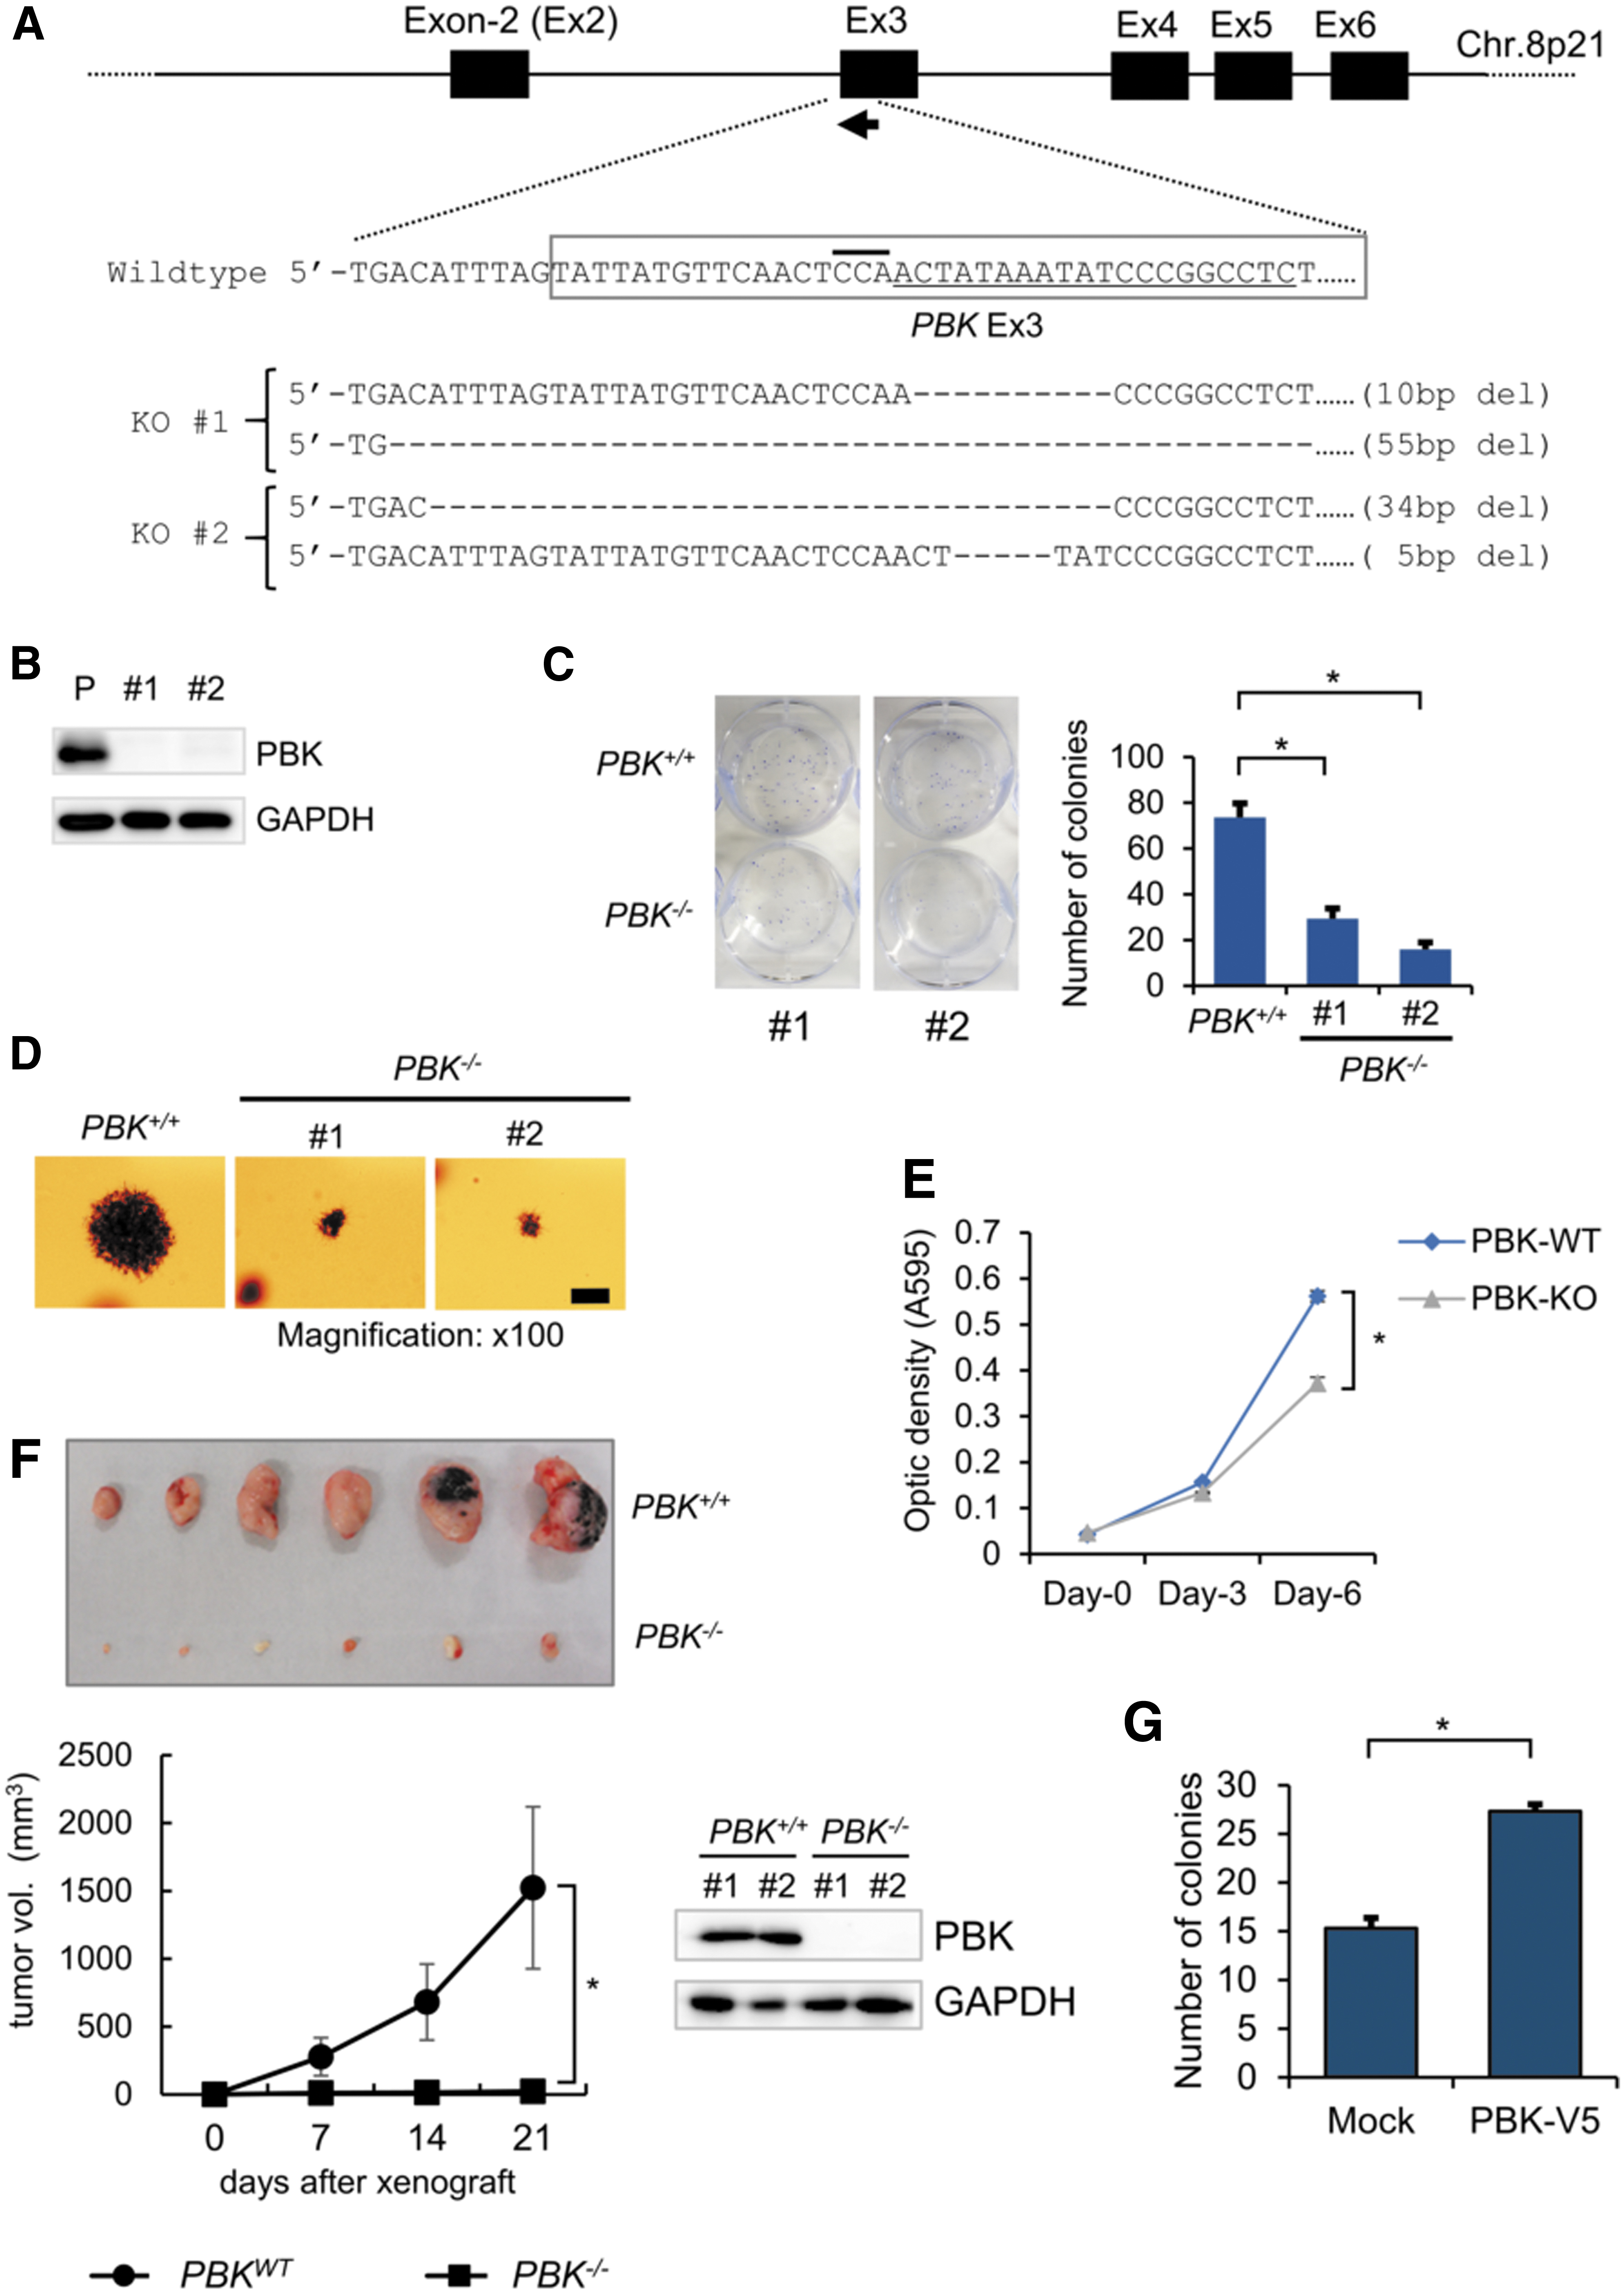
Since our analysis of clinical data suggests that PBK might be involved in tumor progression, we examined the effect of PBK expression on MM cell growth both in vitro and in vivo. We generated PBK knockout (PBK−/− ) cell clones using a MM cell line KMS-11 and CRISPR/Cas9 system by targeting PBK exon3 (Fig. 2A). Our strategy successfully disrupted PBK gene and generated 2 independent cell clones (Fig. 2A). Western blot analysis showed high PBK expression in parental KMS-11 cells but not in PBK−/− cell clones (Fig. 2B). Using the generated clones, we assessed the cell proliferation and clonogenicity by MTT assay, colony formation assay, and adherent-independent soft-agar colony formation assay. We found that cell proliferation was significantly suppressed (data not shown), the number of colonies significantly decreased (Fig. 2C), and the size of colonies and cell proliferation were highly reduced (Fig. 2D, E) in the PBK−/− cell clones compared with parental KMS-11 cells. Therefore, we next performed xenograft experiments using immunodeficient SCID mice to examine the effect of PBK on tumor growth in vivo. Of note, the tumor volume substantially reduced in the PBK−/− KMS-11 cell-derived tumor (Fig. 2F), compared with the PBK+/+ KMS-11 cell-derived tumor. Moreover, rescuing PBK expression in PBK−/− KMS-11 cells significantly increased the number of colonies in vitro (Fig. 2G). These results strongly suggest that PBK might play an important role in the tumor growth of MM.
The effect of PBK on the tumor growth in KMS-11 cells.
Loss of PBK rather than its genotype is associated with tumor growth of MM
Human PBK gene possesses single nucleotide polymorphism (SNP) rs3779620, which accompanies with an amino acid change from asparagine (A320, N107) to serine (A320G, N107S). Allele frequencies of A/A and A/G occupy more than 97% in both United States and Europe populations, while less than is 86% in Asian populations (Supplementary Table S5). Since the PBK/rs3779620 genotype of KMS-11 is a rare allele G/G, we sought to examine the effect of PBK/rs3779620 genotype on tumor growth of MM cells. To this end, we generated PBK gene knockin cell model using a MM cell line OCI-My5 (A/A at rs3779620) by targeting PBK Exon-5. Subsequently, CRISPR/Cas9-mediating genome editing successfully established PBKA/A , PBKG/G , and PBK−/−- cell clones (Fig. 3A). Western blot analysis showed PBK protein expression in both the PBKG/G and PBKA/A cell clones but not in the PBK−/− OCI-My5 cell clone (Fig. 3B). Therefore, we examined the effect of PBK genotype on tumor growth using the cell clones in vivo and found that the rates of tumor engraftment as well as tumor growth were not significantly but slightly different between PBKG/G and PBKA/A cell clones (increased in PBKA/A ), whereas tumor growth of PBK−/− OCI-My5 cell-derived tumor was greatly suppressed compared with those of both PBKG/G and PBKA/A cell clones (Fig. 3C). This result suggests that PBK expression, rather than a PBK genotype rs3779620, may be closely associated with tumor growth of MM cells. It might be also important to note that allele frequencies of A/A occupy 90% in the MM cell lines used in this study (Supplementary Table S6).
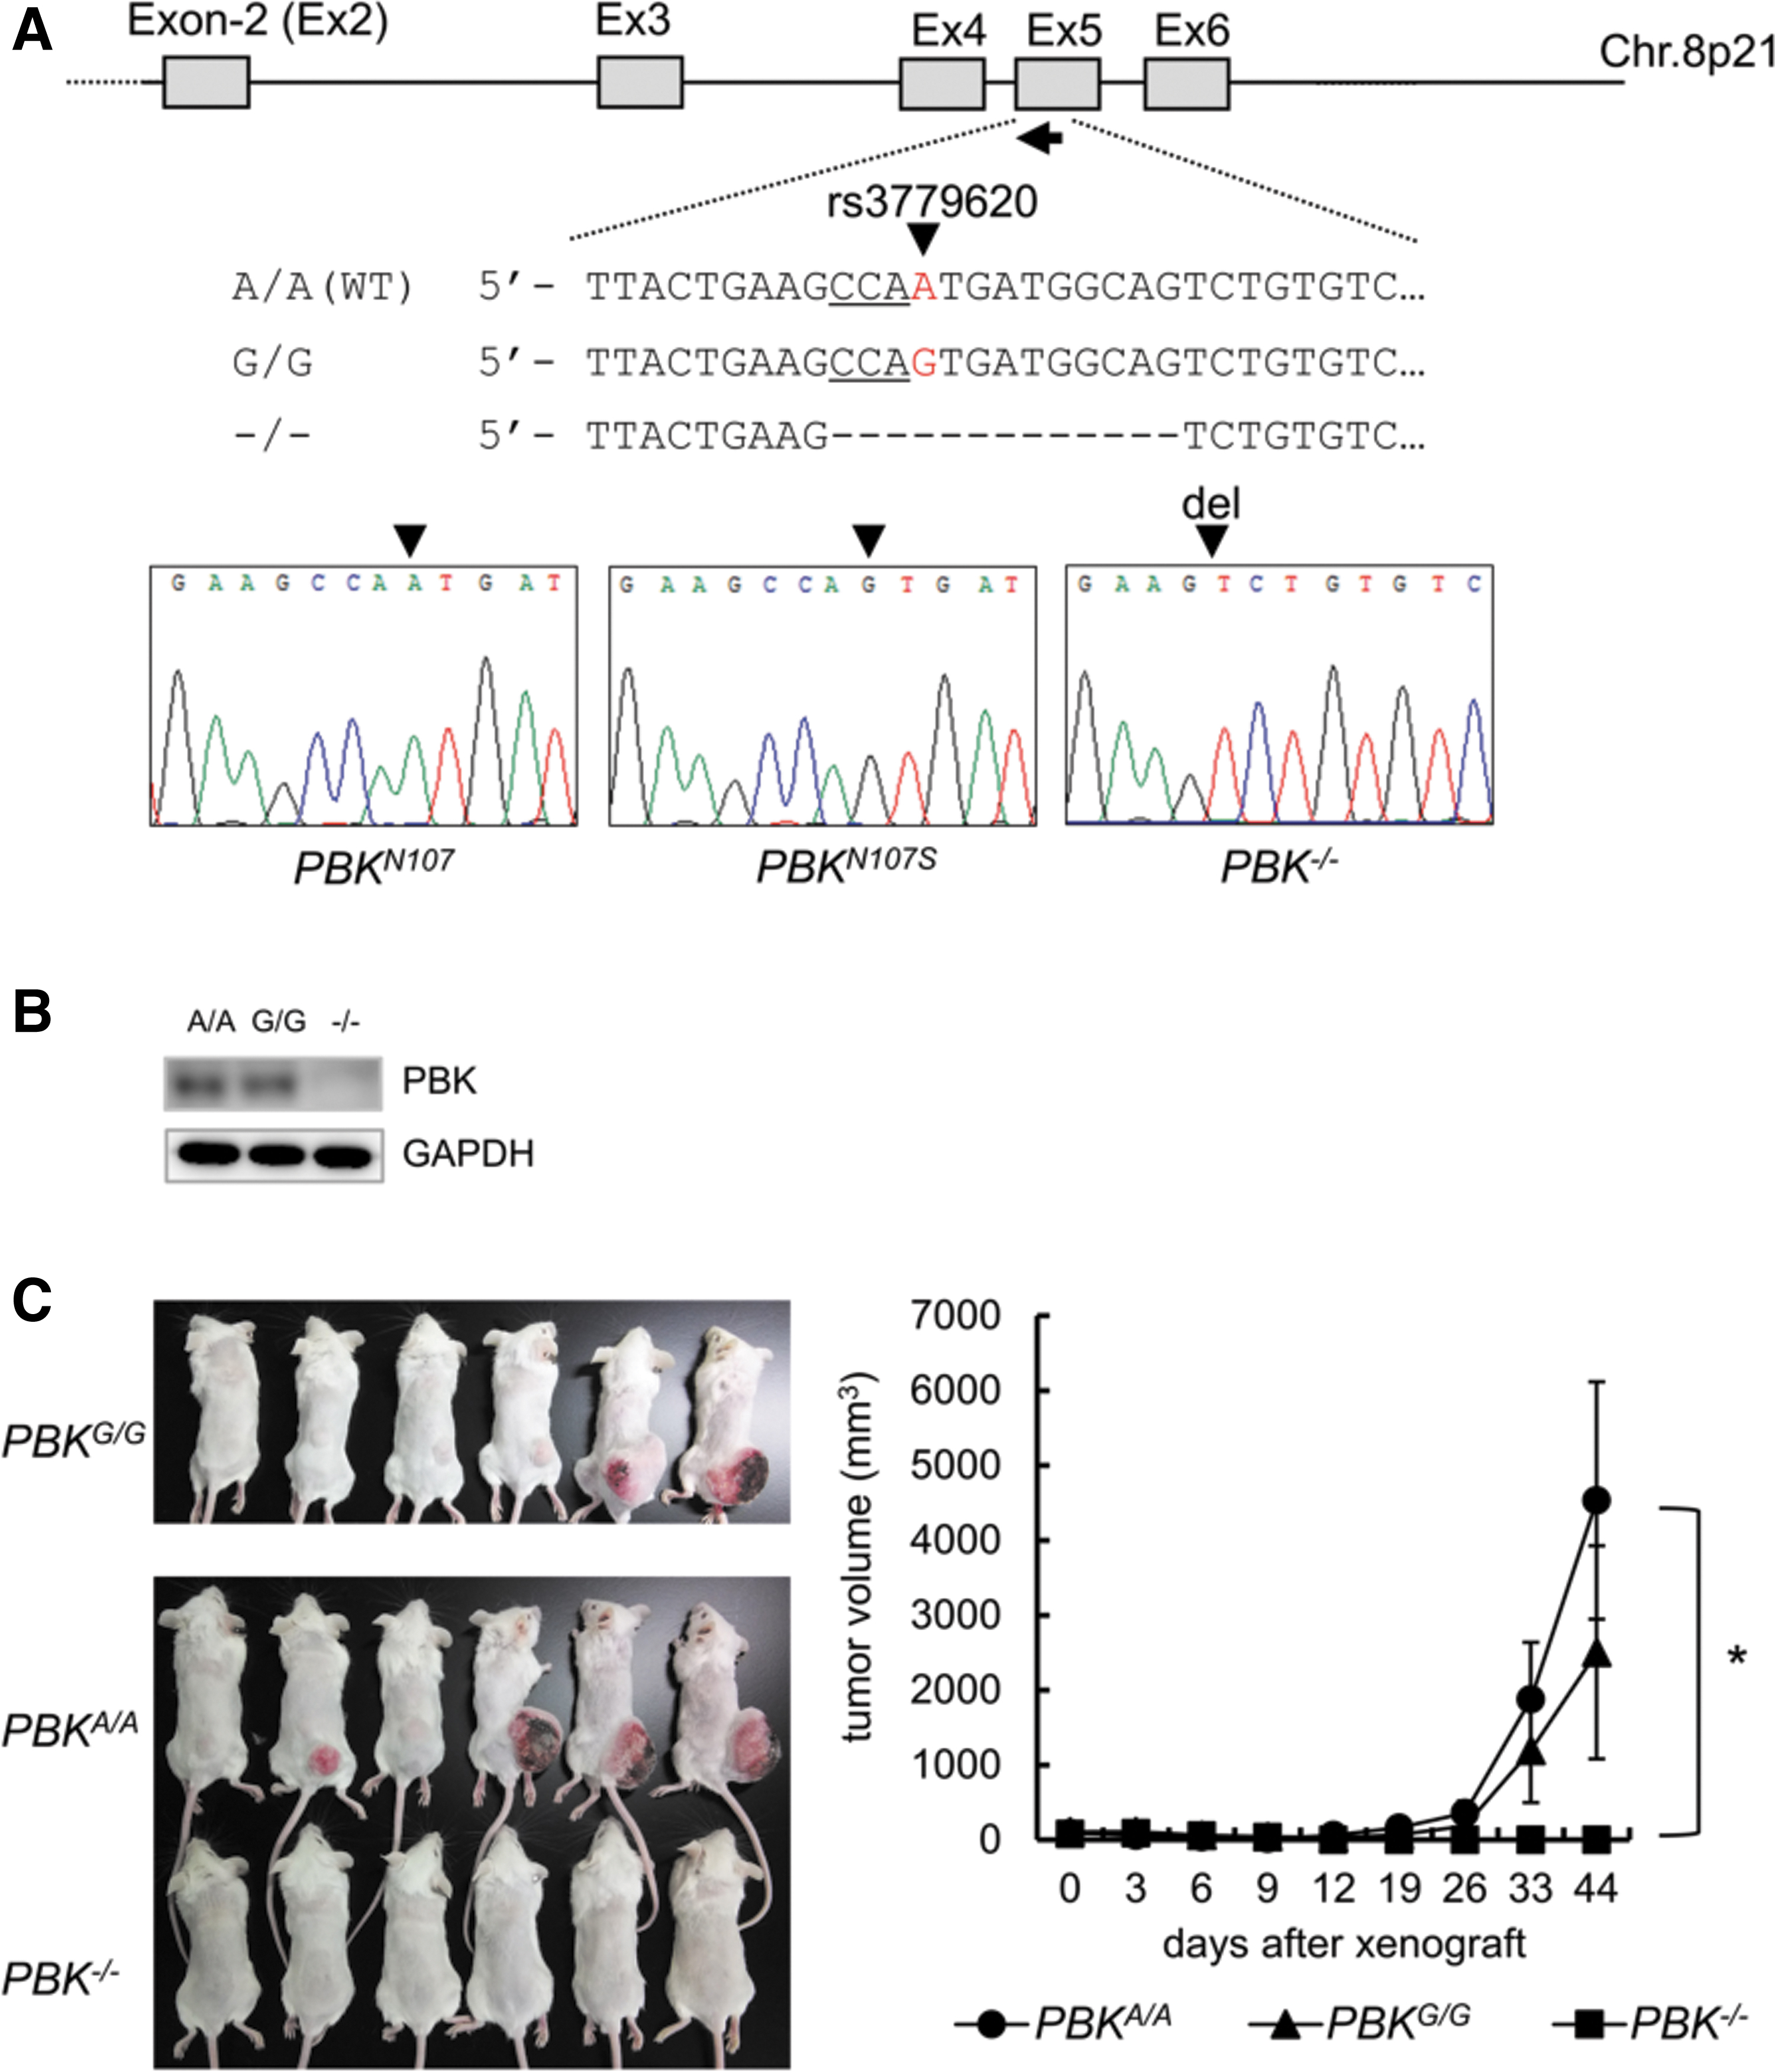
Effect of PBK expression and its genotype rs3779620 on the tumor growth in OCI-My5 cells.
Disruption of PBK increases apoptosis of MM cells
Since loss of PBK expression greatly reduced tumor growth of MM cells, we hypothesized that inhibition of PBK expression might be involved in the survival of MM cells. To examine the effect of PBK expression on apoptosis, we performed the Annexin V/PI double staining-based flow cytometry analysis using PBK+/+ and PBK−/− MM cell clones. To this end, we additionally established the PBK−/− cell clone using a human MM cell line RPMI8226 (Supplementary Fig. S5a, b). We found that proliferation was slightly, but not significantly, slower in both the PBK−/− RPMI8226 (84.1% ± 1.7 at day 6, P < 0.05; 90.1% ± 1.9% at day 3, not significant, compared WITH PBK+/+ cells) and OCI-My5 cells (51% ± 1.2% at day 3; 92.7% ± 1.6% at day-6, P < 0.05, compared with PBK+/+ cells) (Supplementary Fig. S5c). We also performed an adherent-independent soft-agar colony formation assay, and found that colony size is reduced in the PBK−/− OCI-My5 clone compared with PBKA/A and PBKG/G OCI-My5 clones. In contrast, there are almost no differences in colony size between PBK−/− and PBK+/+ RPMI8226 clones (Supplementary Fig. S5d). Interestingly, FACS analysis showed that the number of AxV+/PI+ cells significantly increased in the PBK−/− KMS-11 and RPMI8226 cell clones compared with PBK+/+ cells (Fig. 4A). In addition, caspase-3/7 assay showed that the relative caspase-3/7 activities significantly increased in the PBK−/− RPMI8226 and OCI-My5 cell clones compared with the PBK+/+ cells (Fig. 4B). Furthermore, PI staining-based cell cycle analysis showed that the percentage of sub-G1 population increased in all the PBK−/− KMS-11 and RPMI8226 cell clones compared with those in PBK+/+ cells (Fig. 4C). These results suggest that PBK expression might be related to the survival of MM cells.
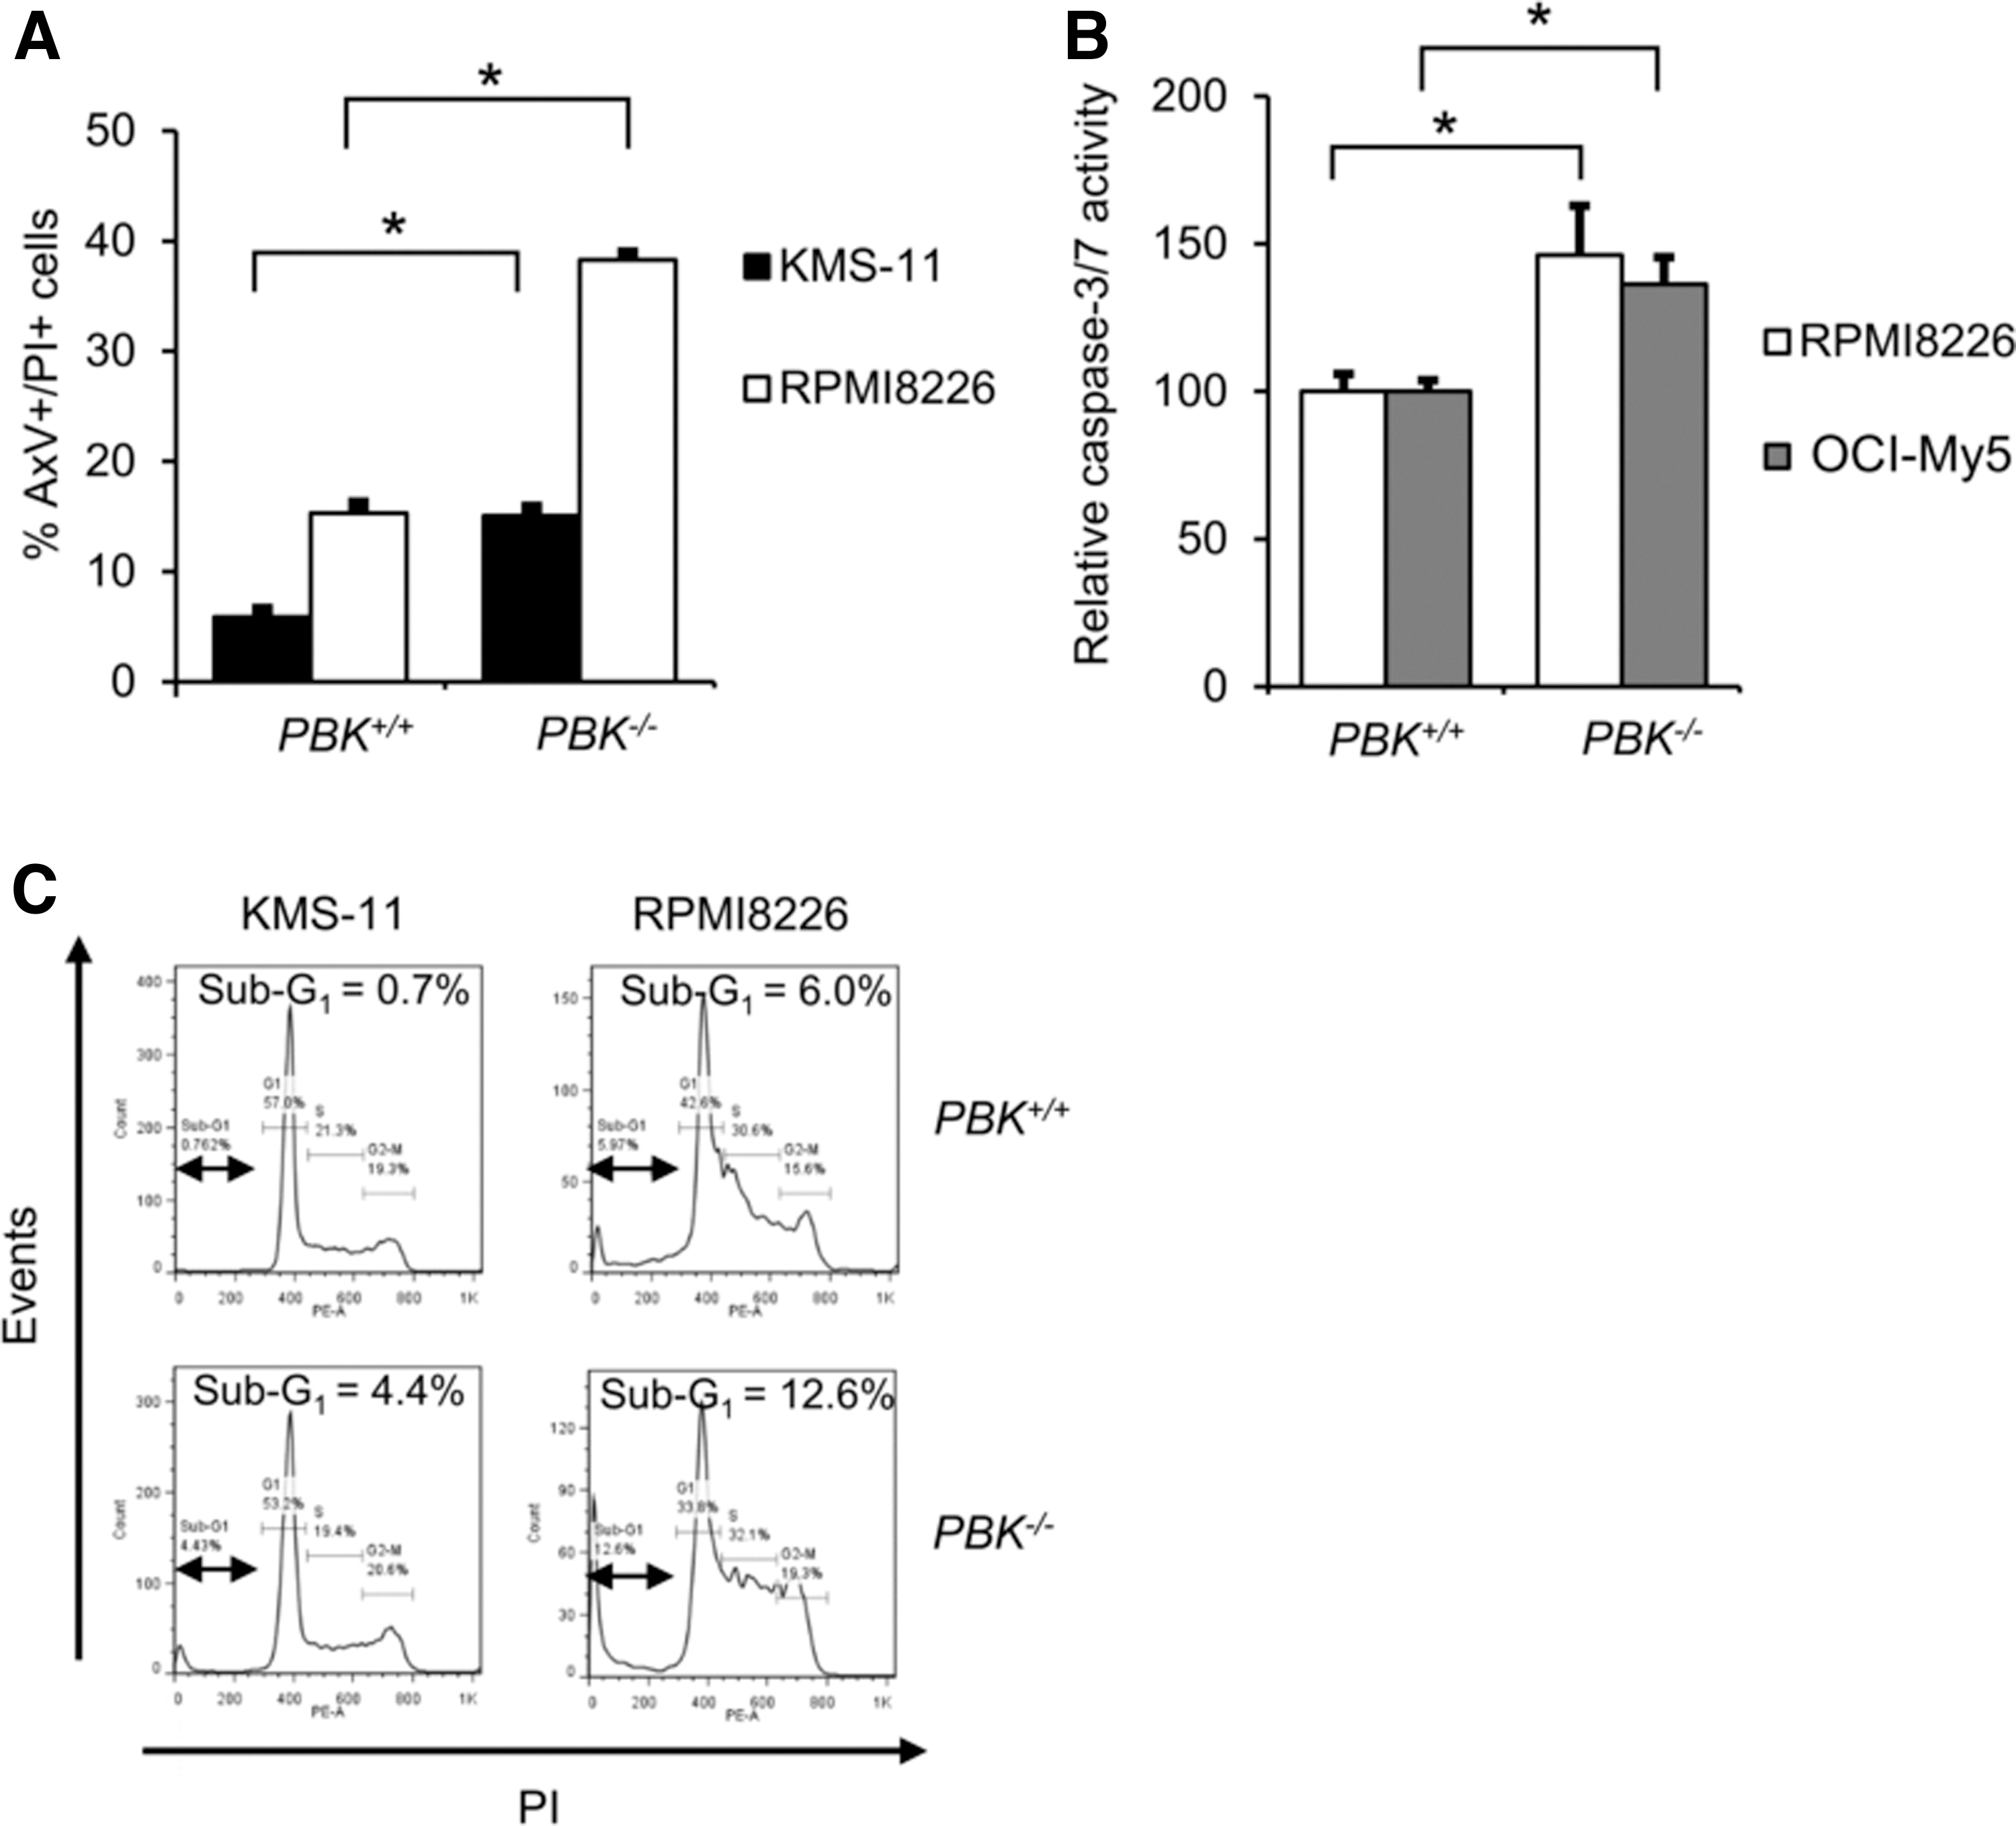
Effect of PBK expression on apoptosis of MM cells.
PBK expression is associated with Stat3 phosphorylation level and IL-6-Stat3 signaling axis
We next examined the effect of PBK disruption on cellular signaling in MM cells using Western blot analysis. Of note, phosphorylation levels of Stat3 highly decreased in the PBK−/− KMS-11 and OCI-My5 cells compared with that in PBK+/+ cells (Fig. 5A). In contrast, no significant changes in the phosphorylation levels of MAPKs and Akt, Myc protein expression, and IRF4 mRNA expression were observed in the RPMI8226 and KMS-11 cell clones (Supplementary Figs. S5b and S6A, B). We also found that β-catenin, the activity of which was reported to be associated with PBK expression, decreased in the PBK−/− OCI-My5 and RPMI8226 cell clones compared with wild-type (WT) cell clones. (Supplementary Fig. S7a). Since Stat3 signaling confers resistance to apoptosis in MM cells (Catlett-Falcone and others 1999), we examined the effect of exogenous PBK expression on the phosphorylation of Stat3. To this end, we generated cells expressing lentivirus-based PBK tagged with V5 in the PBK−/− KMS-11 and OCI-My5 cells. Western blot analysis showed that the phosphorylation levels of Stat3 (Tyr705) clearly increased in the PBK−/− cells expressing PBK-V5 compared with the control cells (Fig. 5B). To investigate whether phosphorylation of PBK itself affects PBK-induced phosphorylation of Stat3, we transiently transfected EGFP-PBKWT or EGFP-PBKT9A mutant in 2 other human MM cell lines U266 and UTMC-2. Western blot analysis showed that the phosphorylation of Stat3 increased in cells expressing either EGFP-PBKWT or EGFP-PBKT9A compared with cells expressing EGFP alone (Fig. 5C). To examine whether pharmacologic inhibition of Stat3 recapitulates silencing of PBK, we examined the effects of SH4–54 on PBK expression in IL-6-independent MM cell lines. This assay showed that PBK expression readily decreased concomitantly with phosphorylation levels of Stat3 in RPMI8226, UTMC-2, and OCI-My5 cells (Supplementary Fig. S7b). This suggests that Stat3 signaling may play an important role in PBK expression in IL-6-independent MM cells. To further investigate whether PBK kinase activity and/or PDZ-binding domain was related to the phosphorylation of Stat3, we transiently transfected EGFP-PBKWT, kinase dead mutant EGFP-PBKK64A,K65A, or EGFP-PBKK320A mutant into U266 cells. Interestingly, increased phosphorylation of Stat3 was observed in cells expressing EGFP-PBKK320A as well as in EGFP-PBKWT, but not in cells expressing EGFP-PBKK64A,K65A (Fig. 5D). Moreover, GSEA analysis of Hallmark gene sets in the PBK−/− KMS-11 cells and their xenografted tumor demonstrated significant downregulation of genes related to IL-6-Stat3 signaling both in vitro and in vivo, whereas no significant changes in the Wnt-β-catenin signaling pathway (Fig. 5E and Supplementary Table S7). Since our GSEA showed downregulation of genes related to IL-6-Stat3 signaling in PBK −/− KMS-11 cells, we hypothesize that decreases in CD130 (IL6ST) expression may lead to a decrease in IL-6 signaling, and a subsequent decrease in phosphorylation of Stat3. Pearson's correlation analysis revealed that there is a low, but significant, negative correlation between PBK and CD130 expression in a public cohort of 290 patients, HOVON-65/GMMG-HD4 (r = −0.128, P < 0.03; Supplementary Fig. S8). Gene expression analysis showed that the disruption of PBK does not alter the expression levels of other IL-6-related molecules, such as CD130, oncostatin M (OSM), IL-11, and leukemia inhibitory factor (LIF) (Supplementary Fig. S9). These results strongly suggest that PBK expression and its kinase activity may be related to the phosphorylation of Stat3.
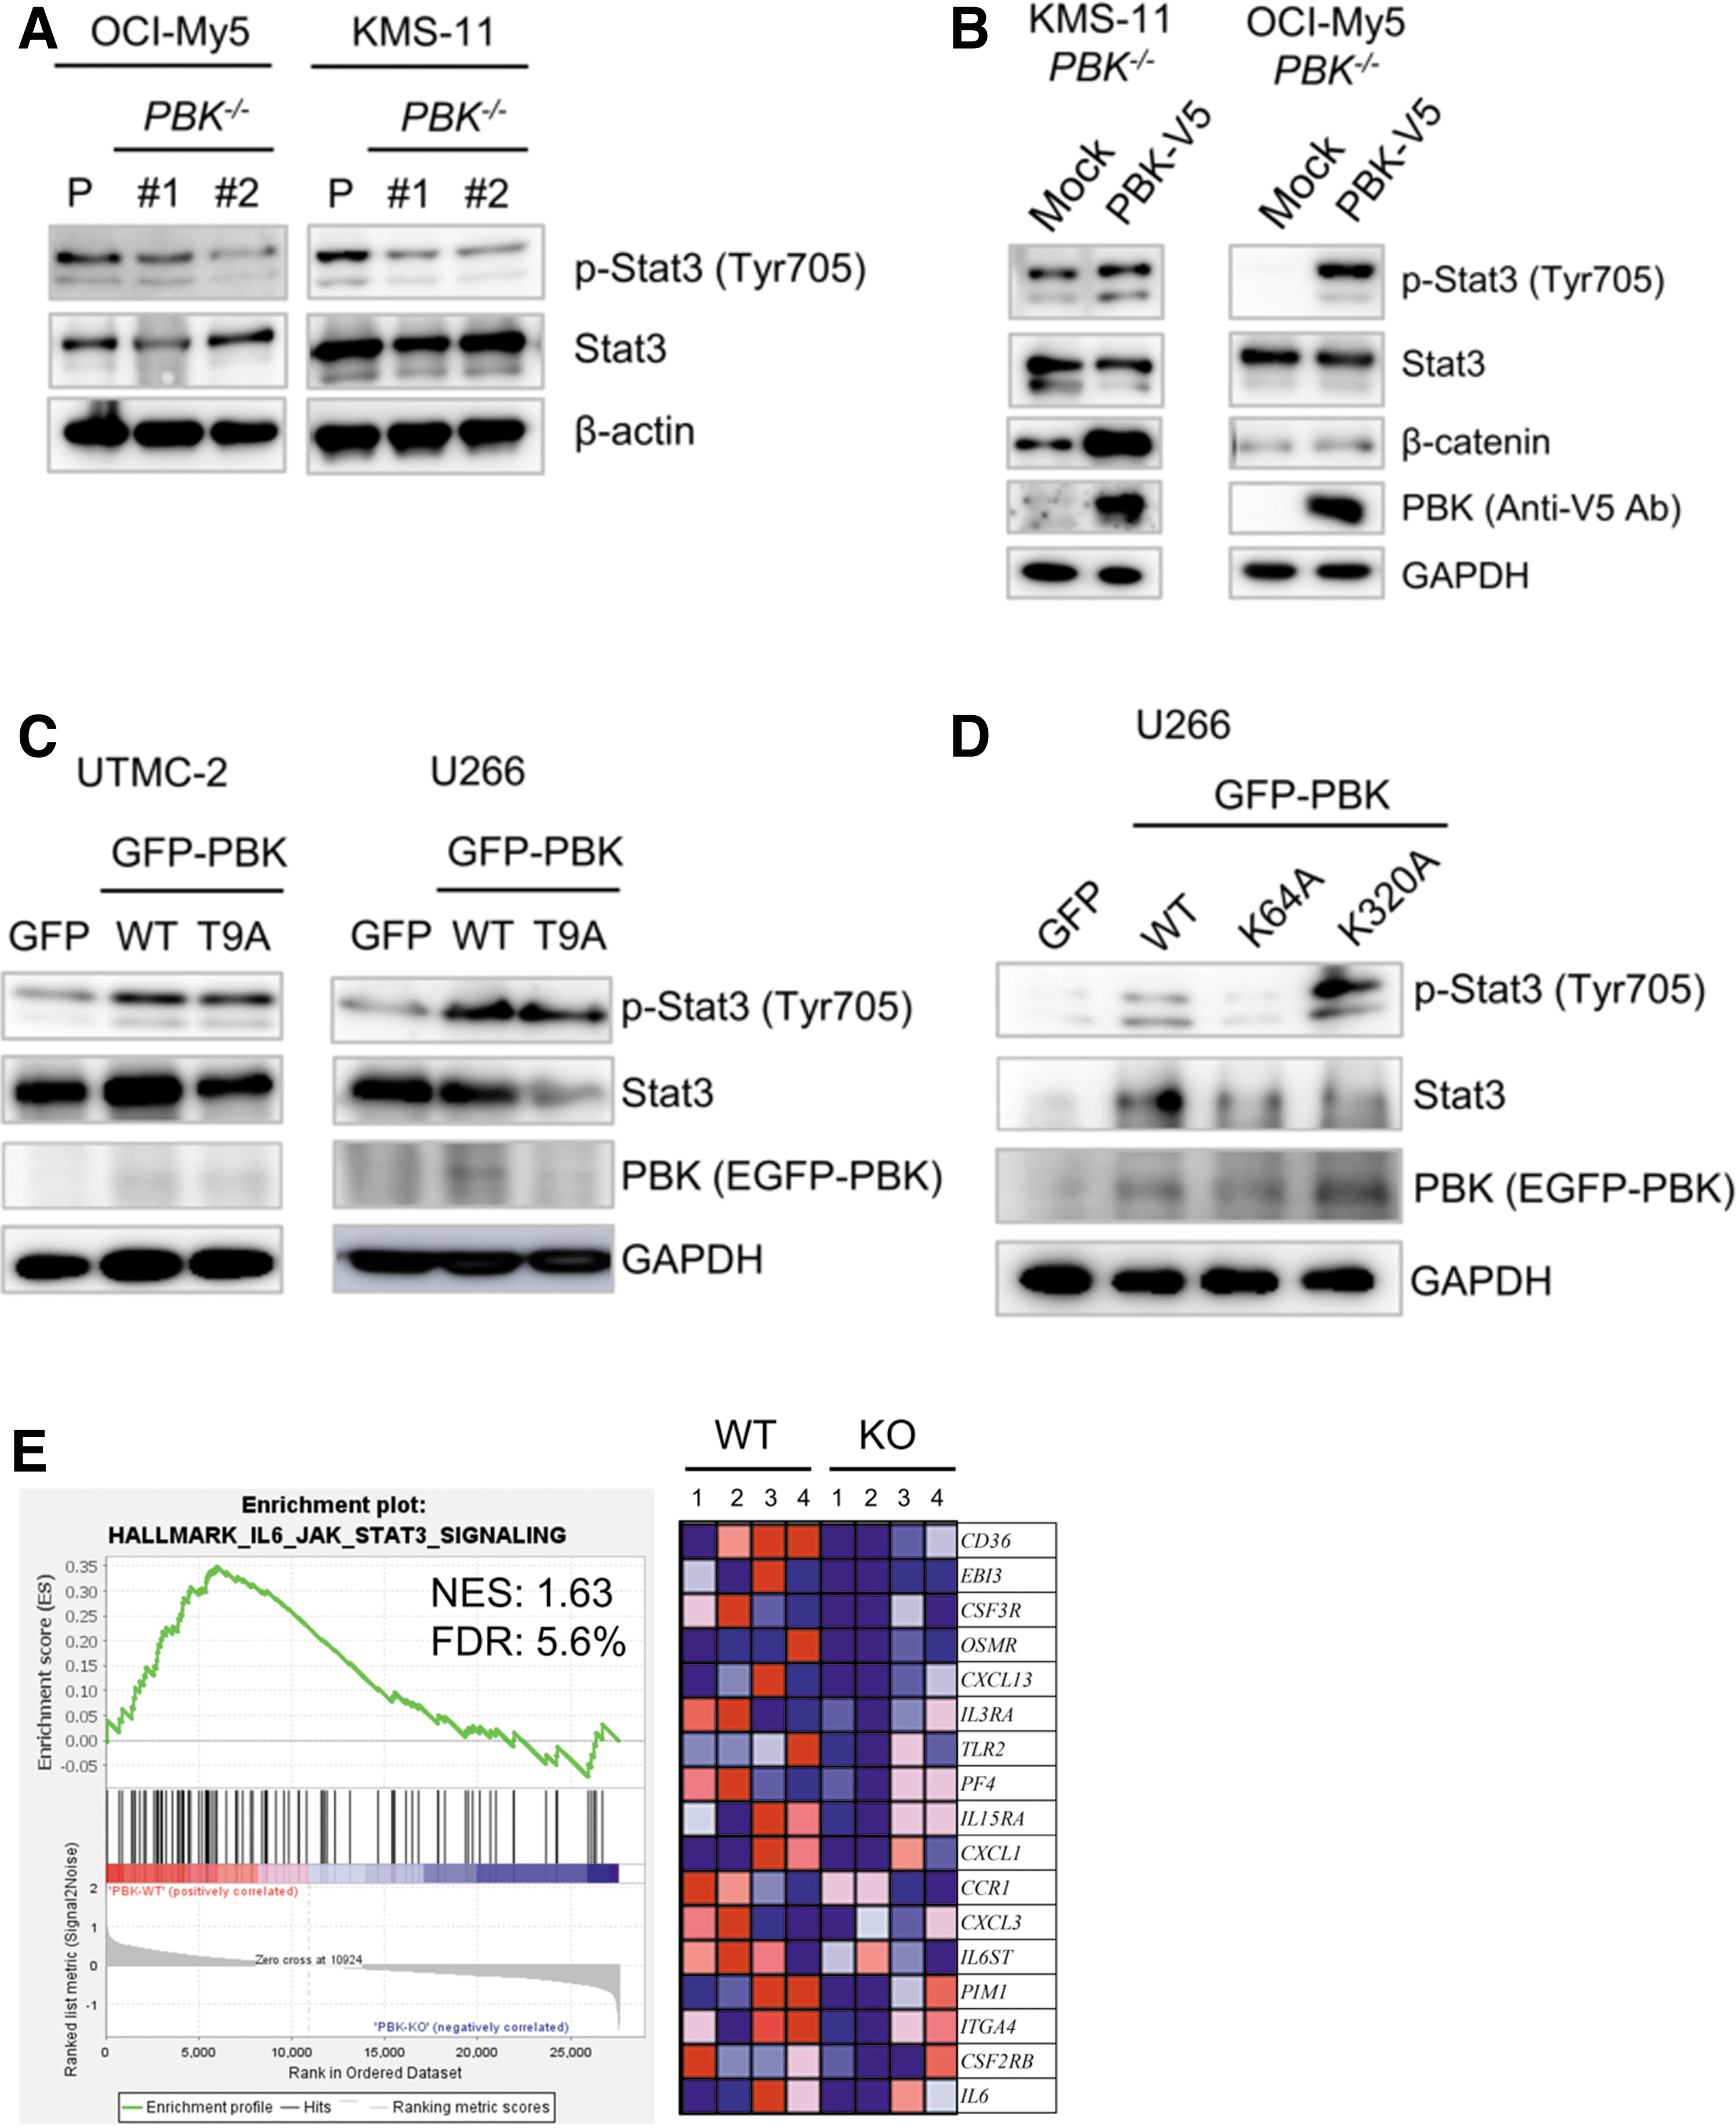
The effect of PBK expression on cellular signaling in MM cells.
To examine the effects of anti-MM drugs, such as bortezomib (BOR), lenalidomide (LEN), and pomalidomide (POM), on the survival of PBK−/− MM cells, an MTT assay was used. The MTT assay showed that cell survival percentages significantly increased after BOR treatment in the PBK−/− KMS-11 and OCI-My5 cells (Supplementary Fig. S10A), whereas they were not altered after treatment with either LEN or POM (Supplementary Fig. S10B, C).
A specific PBK inhibitor OTS514 suppresses KMS-11-induced tumor cell growth in vivo
Since knockout of PBK dramatically reduced tumor growth of MM cells in vivo, we examined the effect of a novel PBK-specific inhibitor OTS514 on KMS-11-induced tumor growth in vivo. The xenografted mice were intraperitoneally injected with vehicle (saline solution) or OTS514 (10 mg/kg) every 2 days, until the volume of each tumor reached from 400 to 500 mm3. Interestingly, intraperitoneal injection of OTS514 (10 mg/kg) significantly suppressed the tumor growth, compared with vehicle treatment (Fig. 6A, B). Additionally, no significant loss of body weight was observed in mice treated with OTS514 (Fig. 6C). Western blot analysis showed that the phosphorylation levels of Stat3 and β-catenin decreased in the OTS514-injected tumors compared with the vehicle-injected tumors (Fig. 6D). Furthermore, the expression of cleaved PARP increased in the OTS514-treated tumors compared with the vehicle-treated tumors (Fig. 6D). Similar results were observed in vitro when KMS-11 and OCI-My5 cells were treated with OTS514 (Fig. 6E). Collectively, these results strongly indicate the possibility that PBK plays an important role in the tumor growth of MM cells.
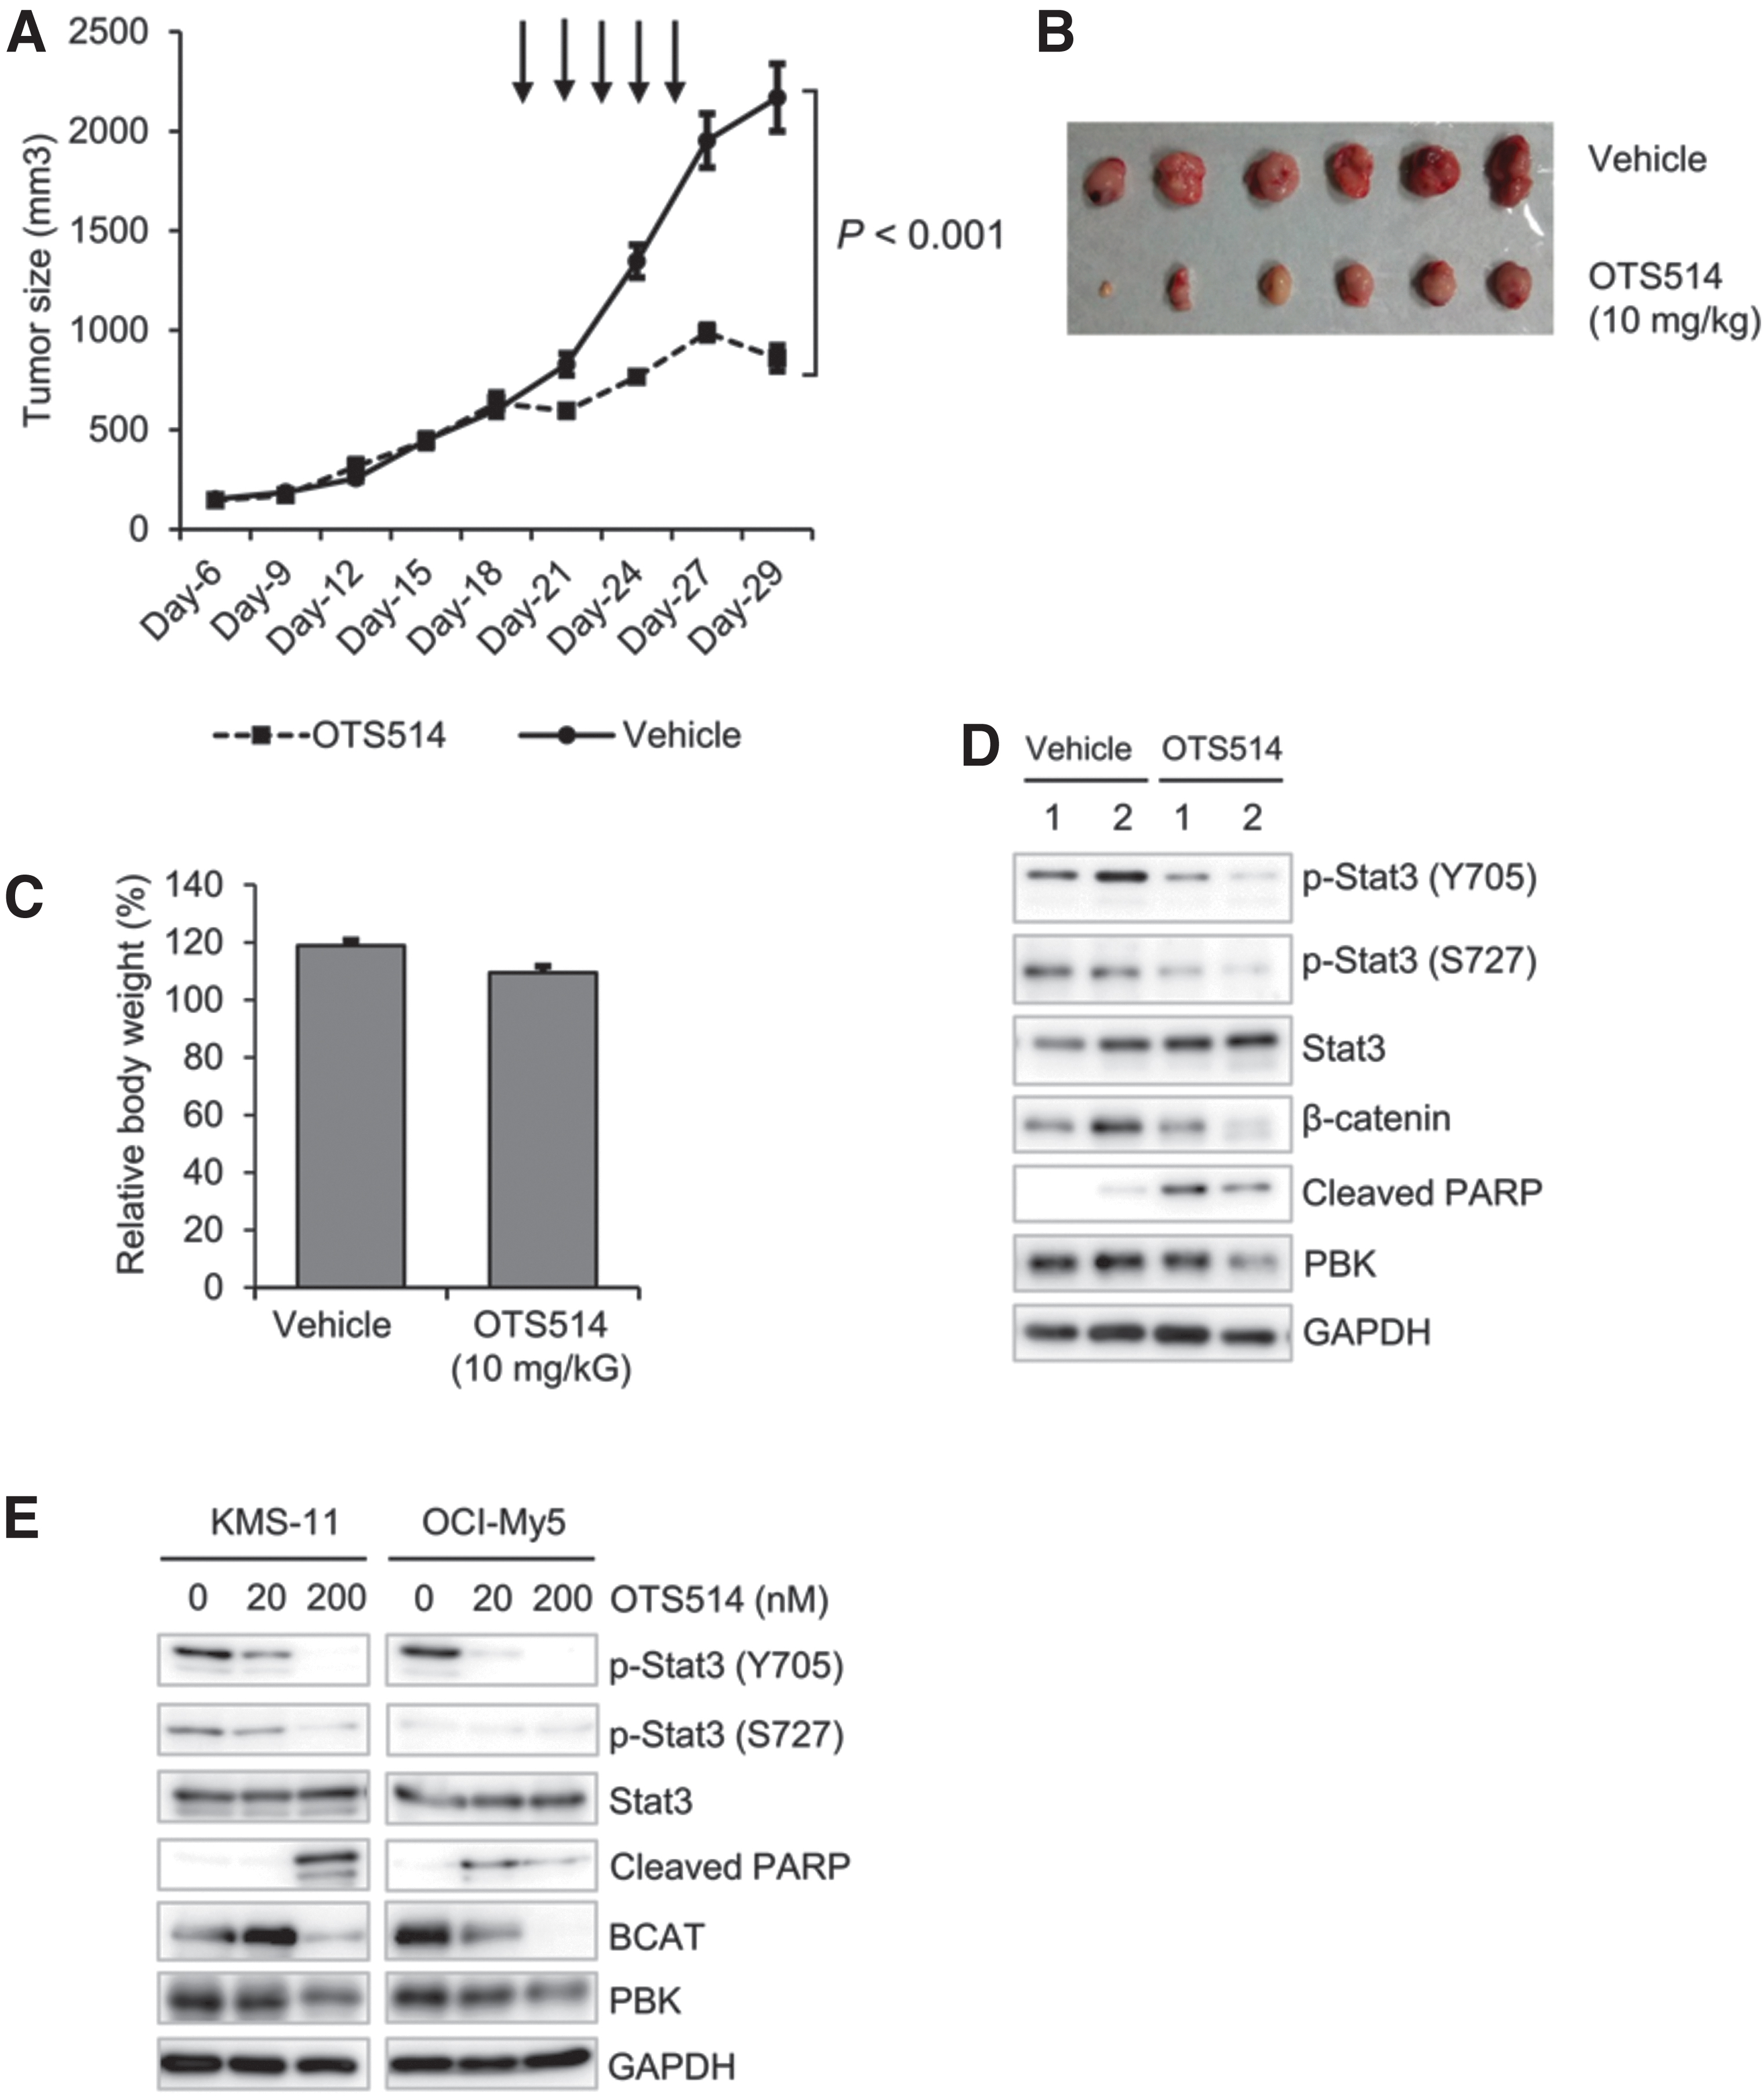
The effect of PBK inhibitor OTS514 on KMS-11 cell-derived tumor growth.
Discussion
The clinical outcome of patients with MM has gradually improved due to the advent of new classes of anti-MM drugs. Oncologists are expecting to achieve further improvement in novel therapeutics, such as combinatorial strategies with recently developed antibody-based and/or immune-based therapies. Despite such advances in therapeutic strategies, the clinical outcome of patients with MM remains incurable. The present study is the first to report that high PBK expression is associated with shorter survival of patients with MM. We found that disruption of the PBK gene dramatically reduced tumor growth of MM cells both in vitro and in vivo, regardless of its genotype rs3779620. Furthermore, a specific PBK inhibitor, OTS514, significantly suppressed growth of KMS-11-derived tumor without causing body weight loss. Mechanistically, the number of apoptotic cells was observed to increase in PBK−/− MM cells with concomitant increase in caspase-3/7 activity. Moreover, the phosphorylation level of Stat3 decreased in PBK−/− MM cells, whereas it increased following expression of WT PBK but not kinase-dead PBK.
Upregulation of PBK expression has been reported in several types of solid cancers, including esophageal squamous cell carcinoma, gastric carcinoma, prostate carcinoma, oral cancer, glioma, and ovarian cancer (Matsuo and others 2014; Brown-Clay and others 2015; Chang and others 2016; Ikeda and others 2016; Kwon and others 2016; Ohashi and others 2016, 2017; Quan and others 2017; Yang and others 2017). Yang and others (2017) recently reported that increased PBK expression was associated with larger tumor size, presence of vascular invasion, lymph node metastasis, and poor overall and disease-free survival in two independent cohorts of 879 patients with hepatocellular carcinoma. Ohashi and others (2016, 2017) reported that overexpression of PBK/TOPK contributes to tumor development and poor outcome of both esophageal squamous cell carcinoma and gastric cancer. It has also been reported that PBK expression was related to high recurrence of prostate cancer (Chen and others 2015). In this study, we found that high expression level of PBK was significantly associated with both OS and PFS of patients with MM. We also showed that loss of PBK dramatically decreased the tumor growth of MM cells using a xenograft model. These results suggest that PBK expression level is closely associated with tumor malignancies in patients with MM.
On the other hand, our MTT assay showed that the cell survival percentage significantly increased after treatment with anti-MM drug BOR in the PBK−/− OCI-My5 and RPMI8226 cells. Since bortezomib inhibits proteasome activity, PBK expression may be associated with proteasome activity, which is activated in MM cells (Edwards and others 2009). Additional studies to assess the relationship between drug susceptibilities of patients with MM and PBK expression are needed to understand the involvement of PBK in the progression and pathogenesis of MM in clinical settings.
The molecular mechanism by which cancerous cells regulate the expression of PBK is still obscure. Hu and others (2013) reported that c-Myc and E2F1 drive PBK/TOPK expression in high-grade malignant lymphomas. In this study, we found that IL-6 increased PBK expression at both the mRNA and protein levels in IL-6-dependent MM cell lines. Our reporter gene assay showed that IL-6 treatment significantly increased the PBK promoter activity, suggesting that PBK may be a novel IL-6-inducible gene in MM cells. We showed that the number of apoptotic cells significantly increases in the PBK−/− RPMI8226 clone compared with the PBK+/+ clone, and we did not observe a significant growth delay in RPMI8226 cells, which lacks t(4;14). Based on our data, along with the public cohort that shows that PBK expression is significantly associated with poor prognosis in MM patients with t(4;14), it is possible that the involvement of PBK in tumor growth is more obvious in MM cells with t(4;14). The t(4;14) translocation is known to cause the concomitant overexpression of 2 genes, fibroblast growth factor receptor 3 (FGFR3) and multiple myeloma SET domain (MMSET), both of which exert growth advantage effects (Keats and others 2003, 2005; Santra and others 2003; Huang and others 2018). As such, PBK may cooperate with FGFR3 and/or MMSET to promote tumor growth of MM cells. Further studies are required to elucidate the relationship between PBK-induced tumor cell growth and chromosomal abnormalities in MM cells. Increased PBK expression was observed in IL-6-independent MM cell lines. In this study, we showed that the Stat3 inhibitor SH4-54 decreases PBK expression, whereas the PBK inhibitor OTS514 and PBK depletion decrease phosphorylation levels of Stat3 in the MM cells. In addition, our GSEA revealed that IL-6-Jak-Stat3 signaling is significantly inactivated in the PBK−/− KMS-11-derived tumors. These results indicate that PBK expression may form a positive feed-forward regulation with Stat3 to promote tumor growth of MM. PBK was initially identified as a serine/threonine MAPK kinase (MAPKKs) with similarities to MEK1/2 (Abe and others 2000), which could phosphorylate Stat3 at Ser727 (Lim and Cao, 2001; Huang and others 2014). Our data on OTS514 suggest decreased phosphorylation of Stat3 at Ser727, whereas our data on Tyr705 suggest that PBK may regulate Stat3 activity by modulating Stat3 phosphorylation. Additional studies are required to understand whether PBK is directly involved in the phosphorylation of Stat3. We also found that the genomic copy number of the PBK locus at chromosome 8q21.1 increased in human MM cell lines, including KMS-11 with high PBK expression, whereas there is no correlation between the copy number of the PBK gene locus and protein expression levels in U266 and RPMI8226 cells. Therefore, it could be possible that PBK overexpression is partly caused by gene amplification.
Stat3 plays a pivotal role in the survival of MM cells (Takeda and others 1997; Alas and Bonavida 2003; Bharti and others 2004; Brocke-Heidrich and others 2004; Jung and others 2017; Huang and others 2018). Our data showed that knockout of PBK expression decreased, and rescue of its expression in PBK−/− cells increased the phosphorylation level of Stat3. In addition, the phosphorylation of Stat3 was suppressed by OTS514 treatment both in vitro and in vivo. Furthermore, WT PBK, but not its kinase dead mutant PBKK64AK65A, increased Stat3 phosphorylation. We also found that loss of PBK significantly increased caspase-3 activity as well as the number of apoptotic cells. Recently, Ohashi and others (2016) reported that PBK knockdown increases both early and late apoptotic cells in TP53-mutated —but not TP53-intact—esophageal squamous cell carcinoma cells. Since patients with biallelic inactivation of the TP53 gene showed poor prognosis in patients with MM (Shah and others 2018), it is preferable to utilize a PBK inhibitor to treat patients with a biallelic loss of TP53 in clinical settings. It has been reported that PBK exerts oncogenic activity in hepatocellular carcinoma cells through activation of the beta-catenin signaling pathway (Yang and others 2017). Thus, we examined the effects of PBK disruption on beta-catenin expression in MM cells. A Western blot analysis showed that beta-catenin expression readily decreased in PBK−/− MM cells, whereas GSEA showed no significant changes in the expression levels of genes that are related to beta-catenin in the KMS-11-derived tumors. These results suggest that the PBK-Stat3 axis is more likely to be associated with PBK-induced tumor growth of MM. These results strongly suggest that PBK and Stat3 may cooperatively regulate the survival of MM cells.
In this study, we showed that the frequencies of nonsynonymous SNP rs3779620 in the PBK gene varies among ethnic groups. We generated isogenic gene knockin MM cell clones and examined the effects of the PBK genotype rs3779620 on tumor growth of OCI-My5 in vivo. Our xenograft experiment showed that the tumor growth of PBK−/− OCI-My5 cell-derived tumors was greatly suppressed compared with those of both PBKG/G and PBKA/A cell clones, whereas the tumor growth rate of PBKA/A cells was insignificantly but slightly higher compared with PBKG/G . Given our finding that decreased PBKG/G KMS-11 cells and PBKA/A in OCI-My5 cells greatly decreases tumor growth, PBK expression may play an important role for tumor growth of MM. Additional studies are needed to clarify the association of rs3779620 with tumor progression and/or drug susceptibility in MM cells.
It has been recently reported that oral administration of the specific PBK inhibitor, OTS514, prolongs OS in human ovarian cancer abdominal dissemination xenograft model (Ikeda and others 2016). Another PBK inhibitor, HI-TOPK-032, suppressed tumor growth in a colon cancer xenograft model (Kim and others 2012). In this study, we showed that intraperitoneal administration of OTS514 significantly suppressed tumor cell size in the xenograft model developed using the human MM cell line, KMS-11. Importantly, administration of OTS514 did not result in significant loss of body weight in xenografted mice used in this study. However, Matsuo and others (2014) have reported that OTS514 potentially causes certain toxicity in hematopoiesis. They also showed that liposomal OTS964, a demethylated derivative of OTS514, exhibits favorable antitumor activity without any toxicities in the xenograft (Matsuo and others 2014). Although our data did not show the severe toxicity of OTS514 in vivo, it might be a better option to utilize liposomal OTS964 to gain the antimyeloma effect by mediating inhibition of PBK activity. Hence, data suggest that the antiproliferative effect of OTS514 may preferentially act toward tumorigenic cells. On the other hand, Lin and others (2019) reported the off-target effects of OTS514, which preferentially target the kinase activity of the cyclin-dependent kinase 11 (CDK11)). In this study, our finding that PBK−/− MM cells are more sensitive to treatment with OTS514 indicates that molecular targets of OTS514 may not always be restricted to only PBK (Supplementary Fig. S11). Thus, it would be interesting to compare the antitumor effects of OTS514 between PBK+/+ and PBK−/− cells in vivo.
This study has some limitations. First, most of our observations were obtained from a single MM cell line, KMS-11. Second, our data does not always explain the detailed molecular mechanism by which PBK loss decreases tumor growth of MM cells. Third, the PBK inhibitor, OTS514, may exhibit an off-target effect in MM cells. Since PBK expression is inducible by IL-6, and is associated with the levels of phosphorylated Stat3, it is possible that PBK plays an important role in IL-6-Stat3 signaling, potentially cooperating with regulatory molecules, including PIAS proteins, SOCS proteins, phosphatases, and microRNAs (Johnson and others 2018).
In conclusion, this study is the first to demonstrate that high expression of PBK is closely associated with shorter survival of patients with MM, and promotes tumor growth of MM cells, at least in part, through enhancing cell survival with concomitant increase in the phosphorylation of Stat3. Although we have not utilized cells derived from primary MM patients, our results suggest that PBK expression could be a novel prognostic marker for patients with MM. Furthermore, compound treatment in vivo raises the interesting possibility that PBK inhibitor, OTS514, might have clinical potential as a novel therapeutic for patients with MM possessing high PBK expression. Additional studies are warranted to improve our understanding of the role of PBK in the pathophysiology of MM and to develop a novel molecular-targeted therapy for patients with relapsed or refractory MM.
Footnotes
Authors' Contributions
A.O. designed experiments, performed research, and wrote the article; I.H. designed research, analyzed data, and wrote the article; S.K. performed research; S.I. performed research and analyzed data of immunohistochemistry; N.T. performed research on gene expression analysis; V.Q.L. performed research and analyzed data; S.M. and J.K. contributed vital new reagents or analytical tools; M.W., M.L.R., and T.H. analyzed data.; H.K. wrote the article; S.T. designed experiments; H.I. analyzed data of immunohistochemistry; A.T. designed research; Y.H. designed experiments and edited the article.
Acknowledgments
The authors would like to thank Dr. M. Okumura for his assistance with animal care. They thank Mr. Makoto Naruse, Ms. Natsumi Kodama, and colleagues at the Division of Advanced Research Promotion, Institute of Comprehensive Medical Research at Aichi Medical University for providing their technical assistance. The authors appreciate Ms. K. Tanimizu for her technical assistance with immunohistochemistry. They also thank Ms. K. Hasegawa and Ms. A. Nakamura for their valuable secretarial assistances. They would like to thank Editage for English language editing.
Author Disclosure Statement
The authors declare no competing interests.
Funding Information
This work was partly supported by Grants-in-Aid for Scientific Research (KAKENHI) from the Japan Society for the Promotion of Science (15K19561 to A.O., 19K08825 to I.H., A.O., S.K., 18K08342 to A.O. and I.H., 17K07263 to H.K., S.K. and T.H.), the Research Grant from The Hori Science and Arts Foundation (to A.O.), YOKOYAMA Foundation for Clinical Pharmacology (YRY-1709 to A.O.), Nagao Memorial Fund (to A.O.), Japanese Society of Myeloma Research Award (to A.O.), Bristol-Myers Squibb (to I.H.), Celgene (A.O., I.H.), and The Japanese Society of Hematology Research Grant (I.H.).
Supplementary Material
Supplementary Figure S1
Supplementary Figure S2
Supplementary Figure S3
Supplementary Figure S4
Supplementary Figure S5
Supplementary Figure S6
Supplementary Figure S7
Supplementary Figure S8
Supplementary Figure S9
Supplementary Figure S10
Supplementary Figure S11
Supplementary Table S1
Supplementary Table S2
Supplementary Table S3
Supplementary Table S4
Supplementary Table S5
Supplementary Table S6
Supplementary Table S7
References
Supplementary Material
Please find the following supplemental material available below.
For Open Access articles published under a Creative Commons License, all supplemental material carries the same license as the article it is associated with.
For non-Open Access articles published, all supplemental material carries a non-exclusive license, and permission requests for re-use of supplemental material or any part of supplemental material shall be sent directly to the copyright owner as specified in the copyright notice associated with the article.