
Abstract
Background:
Wixela Inhub (trademarks of Viatris, Inc.) is a dry powder inhaler (DPI) that delivers a fixed-dose combination of fluticasone propionate and salmeterol and is approved as a generic equivalent to Advair Diskus (trademarks of GlaxoSmithKline plc) for the treatment of asthma and chronic obstructive pulmonary disease (COPD). The dosing performance of DPIs is dependent on the patient's inspiratory capability, which may be impacted in disease populations such as those with severe COPD. The objective of this study was to evaluate the in vitro dose delivery of fluticasone propionate and salmeterol from the Inhub inhaler with in vivo inhalation profiles of severe COPD patients, using two types of breathing simulator with different modes of operation.
Materials and Methods:
Two breathing simulators (Si-Plan and Copley BRS3100) were used with United States Pharmacopoeia (USP) <601> apparatus 5 (Next Generation Impactor and accessories) to measure the total emitted dose and fine particle mass of fluticasone propionate and salmeterol for Wixela Inhub (250/50 mcg) using 13 severe COPD patient inhalation profiles.
Results:
Wixela Inhub demonstrated low flow dependency across the range of COPD patient profiles tested (peak inspiratory flow rate 60.8–84.9 L minute−1), when assessed by total emitted dose and fine particle mass. The results were similar to literature results reported for fluticasone propionate from the Diskus inhaler, tested using a proprietary breathing simulator and Andersen Cascade Impactor. Comparison between the breathing simulators showed no significant difference in fluticasone propionate results, but a small difference was observed between the breathing simulators for salmeterol total emitted dose and fine particle mass.
Conclusions:
This study demonstrates that severe COPD patients are likely to achieve a consistent inhaled dose from Wixela Inhub, with low flow dependency observed within this patient population. In addition, both breathing simulators, which differ significantly in design, produced similar results for fluticasone propionate, but yielded slightly (but statistically significant) different results for salmeterol.
Introduction
The primary objective of this study was to determine the in vitro performance of Wixela Inhub (fluticasone propionate and salmeterol inhalation powder) using breathing simulators to reproduce inhalation profiles from severe chronic obstructive pulmonary disease (COPD) patients. The data described herein were compared with that reported in the literature for fluticasone propionate from the Diskus inhaler.(1) As a secondary objective, comparison was made between two different breathing simulators, which differ in their operating principles.
Combination treatment with the inhaled corticosteroid, fluticasone propionate, and the long-acting ß2 agonist, salmeterol, is an effective therapy for the management of COPD.(2) Wixela Inhub is a dry powder inhaler (DPI) containing fluticasone propionate and salmeterol (as xinafoate salt), available in three strengths (100/50 mcg, 250/50 mcg, and 500/50 mcg).(3) Wixela Inhub is approved by the U.S Food and Drug Administration (FDA) as a generic equivalent of Advair Diskus for the treatment of asthma and COPD.(3) Advair Diskus is also a fixed-dose DPI, which delivers fluticasone propionate and salmeterol as a combination.(4) FDA approval of Wixela Inhub required an extensive package of bioequivalence studies, comprising in vitro studies at multiple flow rates,(5) in vivo pharmacokinetic studies,(6) and an in vivo clinical endpoint study,(7) together with studies demonstrating usability and robustness of the inhaler.(8) These studies were carried out in accordance with product-specific guidance,(9) and reflect the specific challenges identified by the FDA in demonstrating bioequivalence for locally acting drugs delivered from DPIs.(10)
The de-aggregation and delivery of the powder to generate a lung-deposited dose with DPIs, such as Diskus and Inhub, rely on the patient's inspiratory effort.(11) Patient flow rates are determined by the airflow resistance of the inhaler and the patient's inspiratory capabilities, which may be affected by age and disease. For this reason, it is important to understand whether patients achieve sufficient flow rates to obtain an adequate lung dose when using an inhaler.
Patient inhalation flow profiles through the Inhub device were measured in a clinical study reported by Cooper et al.(5) Seventy-eight subjects (healthy adults, adults and children with asthma, and adults with severe COPD) were included in the study. An Inhalation Profile Recorder was used to measure the flow profiles. This contained a pressure transducer that measured the pressure drop (in kPa) created at the mouthpiece of the device when a subject inhaled through it. Measurements were taken every 100 milliseconds, allowing the inhalation profile (a plot of pressure drop against time) to be constructed. Pressure drop data were converted to flow rate data using the equation √Pd = RQ, where Pd is the pressure drop (in KPa), Q is the flow rate (in L/minute), and R is the specific airflow resistance, R in kPa0.5 L−1 minute.(11)
The peak inhaled flow rates measured for subjects with the Inhub inhaler were lower than with the Diskus inhaler, reflecting higher resistance of the Inhub inhaler. However, all subjects achieved peak inhaled flow rates greater than the minimum flow rate of 30 L minute−1 used in the in vitro bioequivalence studies in which the performance of the Wixela Inhub was characterized and shown to be equivalent to that of Advair Diskus. Among the adult subjects in the study, lowest peak inhaled flow rates were achieved by those with severe COPD. In this group, the mean peak inhaled flow rate was 70 L minute−1.
The in vitro bioequivalence studies required for U.S. approval of Wixela Inhub(5) were carried out according to the United States Pharmacopoeia (USP <601>),(12) whereby a vacuum pump and critical flow controller are used to generate a fixed flow rate through the device and the apparatus. An alternative approach to standard cascade impactor measurements is to use a cascade impactor in conjunction with a breathing simulator, which generates an in vitro flow profile through the device, representing how patients inhale through a DPI in vivo.(1,13,14)
One approach to breath simulation, exemplified by the Si-Plan breathing simulator (see Fig. 1 for schematic), uses a computer-controlled piston and bellows to replicate the patient inhalation profile and draw the dose from the inhaler, through an induction port, into a sampling chamber. Once the inhalation is complete, valves are switched, which isolates the inhaler and draws the dose from the sampling chamber through a cascade impactor at a constant flow rate. A vent is present in the valve at the top of the sampling chamber to equilibrate air pressures. A similar breathing simulator, termed The Electronic Lung, was used (attached to an Andersen Cascade Impactor) by Burnell et al. to characterize the in vitro performance of fluticasone propionate in the Diskus inhaler, and Budesonide in the Turbuhaler inhaler (trademark of AstraZeneca plc), using inhalation profiles from COPD patients.(1) It was reported that the Diskus achieved a relatively consistent dose, irrespective of flow rate, while dosing from the Turbuhaler was more flow dependent.
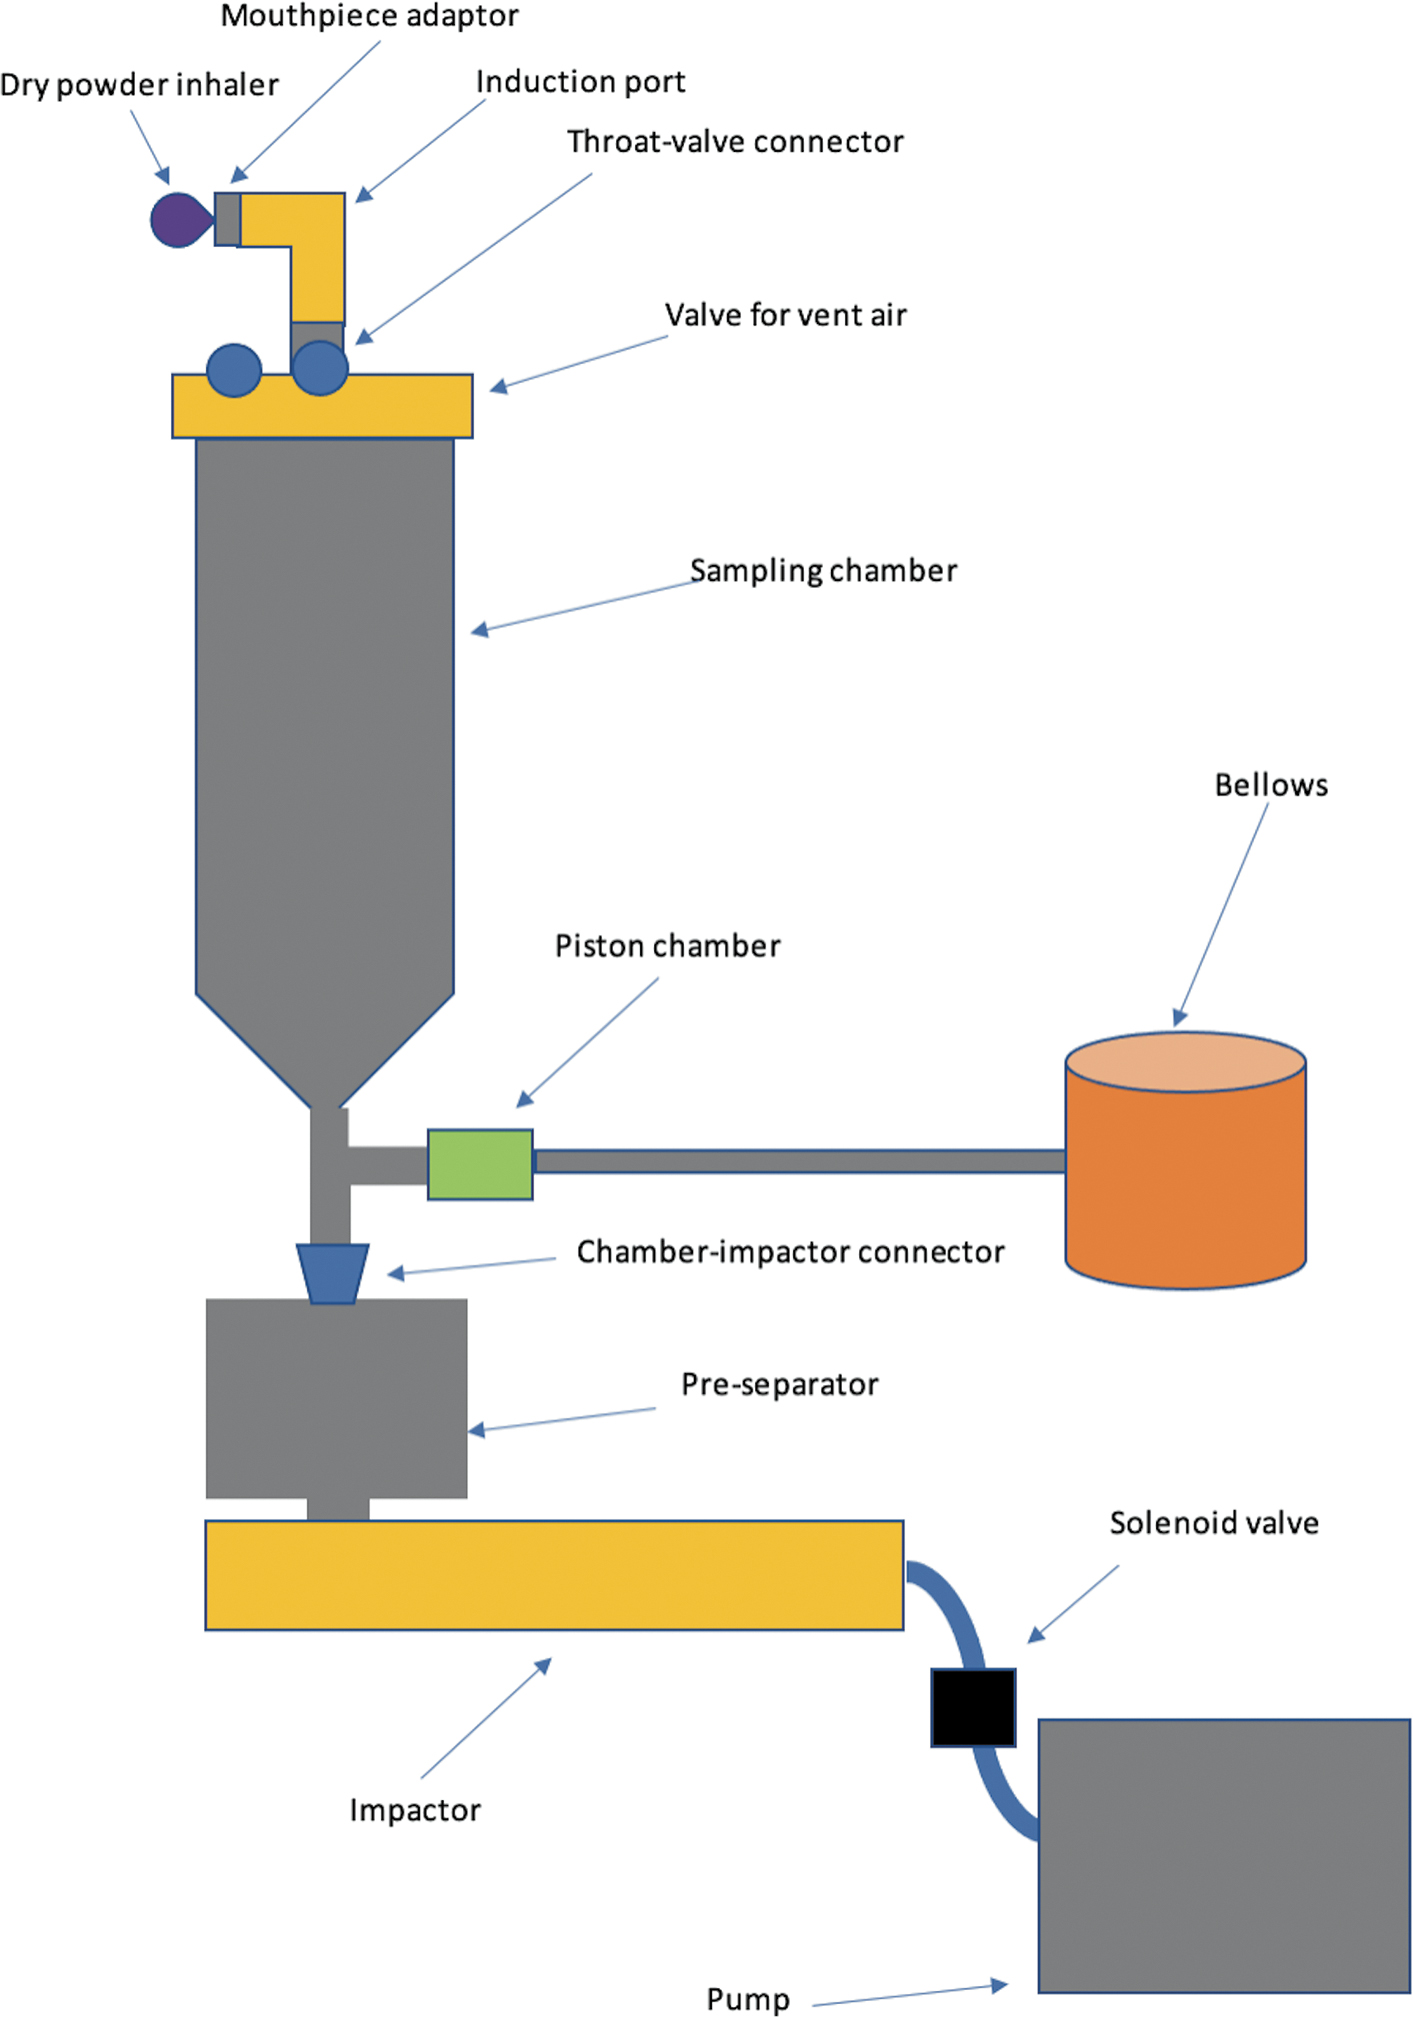
Diagram of the Si-Plan breathing simulator equipment setup, and its separate components (not to scale).
More recently, breathing simulators have been described,(14–16) which utilize a mixing inlet between the induction port and the pre-separator (described in Fig. 2). The mixing inlet allows for a constant flow rate (flow “X” in Fig. 2) to be achieved through a cascade impactor, while varying flow rates, which represent the breath profile (flow “Y”), can be applied to the DPI. This effect is achieved by utilizing a supplementary compressed air supply (flow “X-Y”) from an air compressor to the mixing inlet. Constant Flow “X” is delivered from this compressed air supply, while the breath profile (flow “Y”) is withdrawn from it. When an inhalation profile is replayed, the net supplementary air supply (flow “X-Y”) balances the air drawn by the pump and the breathing simulator, resulting in the DPI being subjected to the inhalation profile, while maintaining constant airflow through the cascade impactor. The Copley BRS 3100 (trademark of Copley Scientific Limited, Nottingham, United Kingdom) used in this study is a commercially available breathing simulator, which uses the mixing inlet approach.
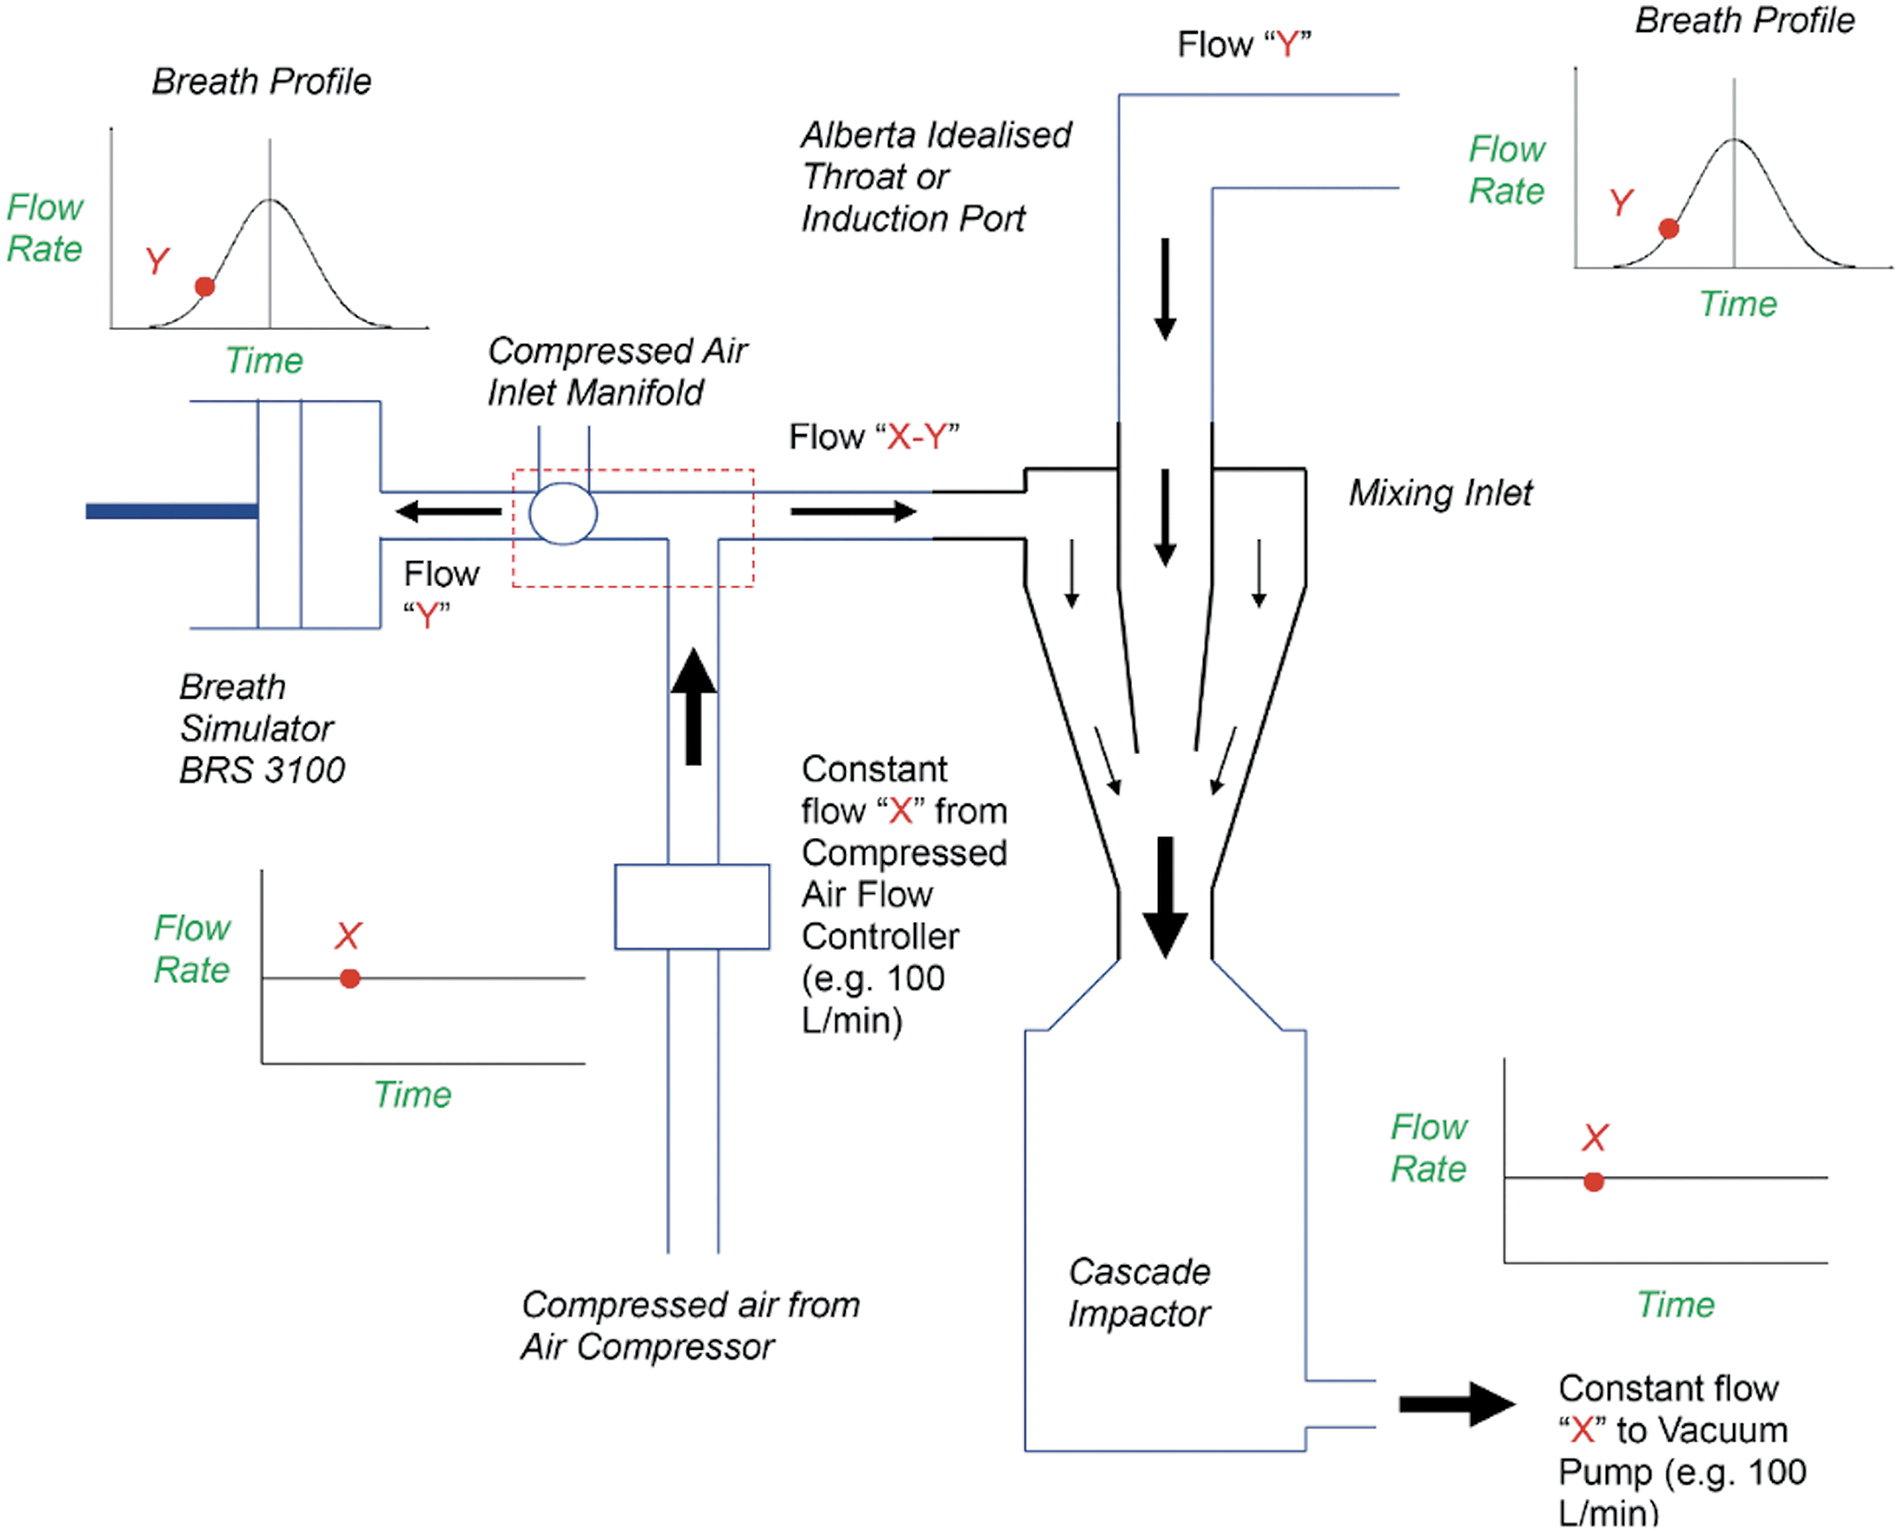
Diagram describing how the Copley BRS 3100 utilizes a mixing inlet to allow constant flow through the cascade impactor, while subjecting the device to a breath profile(16) (permission given to use image by Copley Scientific Limited [Nottingham, United Kingdom]).
In the studies reported here, the in vitro performance of Wixela Inhub was assessed using inhalation profiles from severe COPD patients. Two breathing simulators were used: the Si-Plan breathing simulator and the Copley BRS 3100.
Materials and Methods
Patient inhalation profiles
Inhalation profiles from 13 of the severe COPD patients recorded in the studies described by Cooper et al.(5) were used for this study. Of the three profiles recorded for each subject, the median profile (in terms of peak inspiratory flow rate) was used. The peak inspiratory flow rate and peak pressure drop associated with each flow profile are shown in Table 1. Figure 3 shows the profiles plotted as peak pressure drop against time. Each profile (pressure drop–time for the Si-Plan and flow rate–time for the Copley BRS 3100) was uploaded into the breathing simulator and used to recreate the inhalation profile through the device.
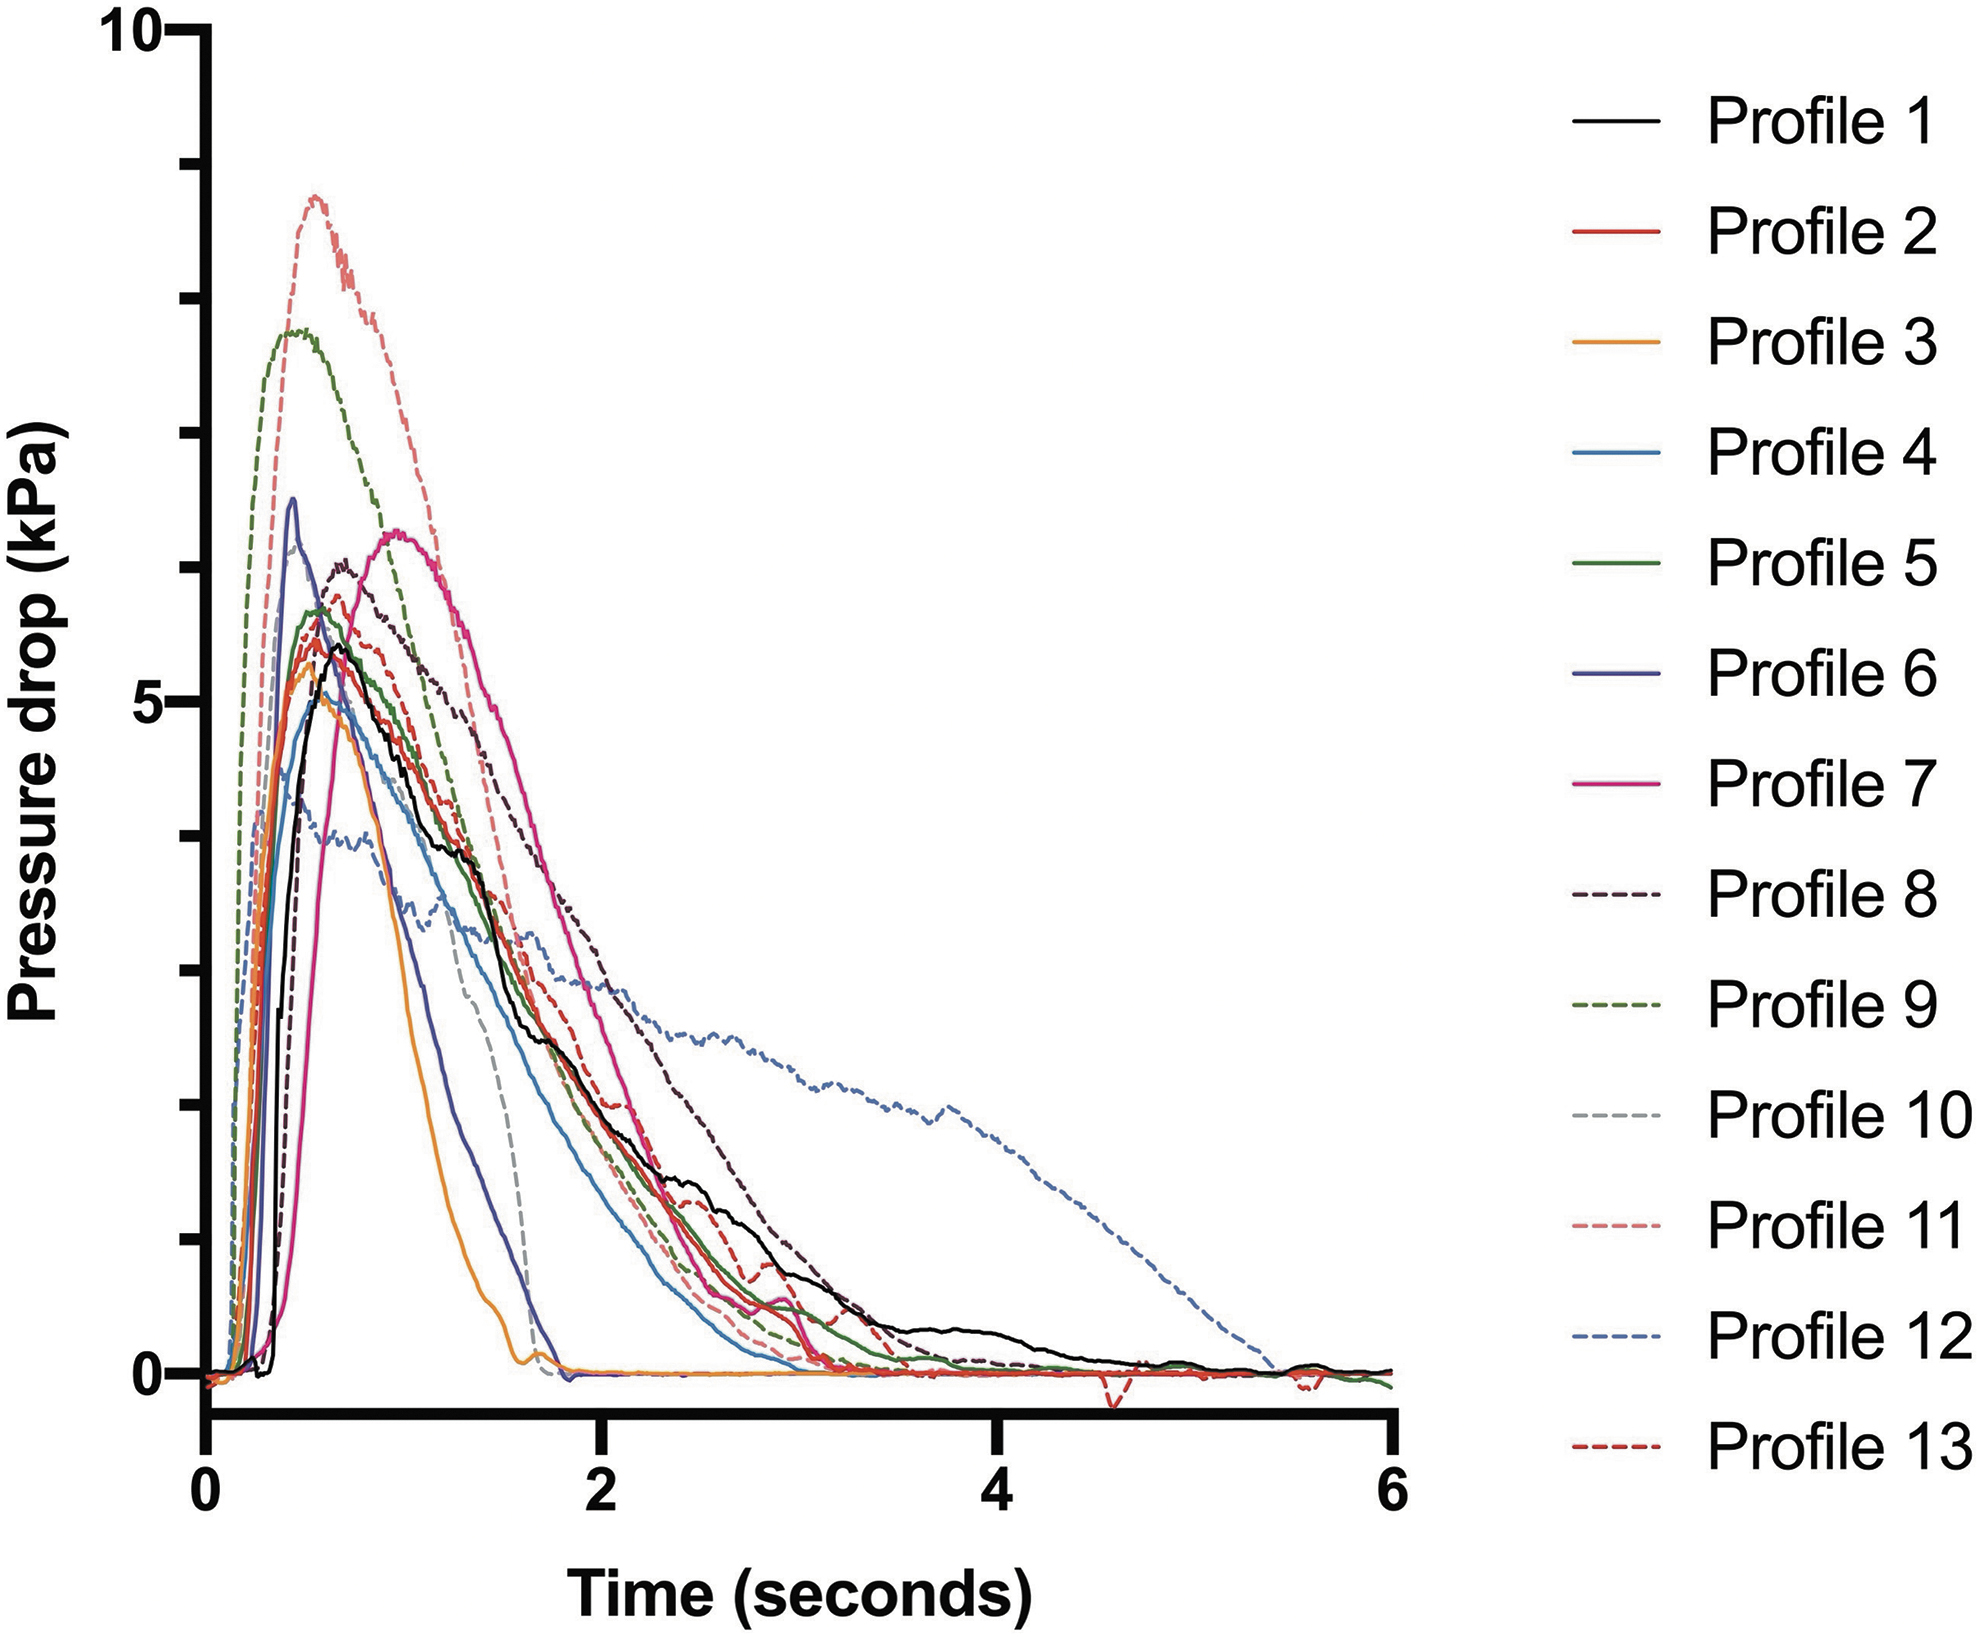
Plot of pressure drop (kPa) against time (seconds) for the 13 severe COPD patient inhalation profiles used in this study. COPD, chronic obstructive pulmonary disease.
Peak Inspiratory Flow Rate and Peak Pressure Drop Recorded for 13 Different Inhalation Profiles Recorded by Severe Chronic Obstructive Pulmonary Disease Patients
The profiles were reproduced by the breathing simulators.
Test protocol
For each breathing simulator, each inhalation profile was tested 3 times (total 39 tests per breathing simulator), using seven devices in total. A single dose was used per test, and the order of the 39 tests was randomized. This protocol was carried out on the Si-Plan breathing simulator and the Copley BRS 3100 using USP <601> Apparatus 5 (Next Generation Impactor and standard accessories).(12) For both breathing simulators, the Next Generation Impactor stage cups were coated with silicone oil [1% v/v Poly(dimethylsiloxane-co-methyl-phenylsiloxane) solution in cyclohexane]. The total emitted dose and fine particle mass of fluticasone propionate and salmeterol were reported and plotted against peak inspiratory flow rate.
Cascade impactor testing using the Si-Plan breathing simulator
The Si-Plan breathing simulator was programmed to generate pressure drop profiles, which, in turn, generated the inspiratory flow profiles through the device. All inhalation profiles were reproduced with >90% fidelity, as determined by the computer software. After applying the inhalation profile to the device, the valve switched and a constant flow rate (60 L minute−1) flowed through the Next Generation Impactor for 2 minutes. The large internal volume (11 L) of the sampling chamber meant that it was necessary to draw air through the impactor for the 2 minutes, to ensure full evacuation of the dose. Once the pump was switched off, all surfaces within the system (including the impactor) were rinsed with water: methanol (30:70 v/v), according to a validated method. The test samples recovered from this were then assayed for fluticasone propionate and salmeterol by reversed-phase liquid chromatography using an Agilent 1100 HPLC with C8 Luna(2) (100Å 100 × 4.6 mm 5 μm particle size) column, with mobile phase comprising 0.6% trifluoroacetic acid solution in water-acetonitrile-methanol (45:32.5:22.5 v/v/v). The flow rate was 1.5 mL/minute and ultraviolet (UV) detection was acquired at 245 nm. The HPLC method was validated according to ICH Q2(R1) guidelines(17) and demonstrated linearity in the concentration range 0.03–15 μg/mL for fluticasone propionate (R2 = 0.9999) and 0.01–1.2 μg/mL for salmeterol xinafoate (R2 = 0.9999). The quantitation limit for an injection volume of 100 μL was 0.02 μg/mL for fluticasone propionate and 0.01 μg/mL for salmeterol xinafoate. Precision of this method was characterized by a relative standard deviation (RSD) of ≤0.18%. Using this validated method, the total emitted dose and fine particle mass of the dose were calculated.
Cascade impactor testing using the Copley BRS 3100 breathing simulator
The Copley BRS 3100 breathing simulator was programmed to apply inspiratory flow profiles to the device. This was tested daily, to ensure that the inhalation profiles were reproduced closely. The supplementary compressed air and impactor flow rates were set to match (±1 L minute−1) the peak inspiratory flow rate for each inhalation profile to ensure that the breathing simulator could fully reproduce the peak inspiratory flow rate of each profile. A vacuum pump and critical flow controller (Copley TPK) were used to generate a constant flow rate through the Next Generation Impactor. For each inhalation profile, the impactor flow rate was set to match the compressed air flow rate (the peak inspiratory flow rate for each profile ±1 L minute−1) so that zero flow through the inhaler would occur before the start of the inhalation. A flow meter was attached to the mouthpiece adapter to confirm this, before attaching the Inhub device. The computer software was used to start each inhalation. Once the inhalation was complete (6 seconds for all profiles), both the compressed air and the vacuum pump were switched off. Following this, the mouthpiece adapter, induction port, pre-separator, Copley mixing inlet (for Next Generation Impactor), and impactor stages were rinsed with buffer solution: methanol (40:60 v/v). The buffer solution was 20 mM NaH2PO4.2H2O containing 17.5 mM sodium dodecyl sulfate (SDS). The rinsing solution was different to that used with the Si-Plan breathing simulator testing to ensure compatibility with the chromatography method used. The recovered test samples were then assayed for fluticasone propionate and salmeterol by reversed-phase liquid chromatography, using a Waters Acquity ultra performance liquid chromatography (UPLC) with Waters Acquity ACQUITY UPLC BEH C18 Column, 130Å, 1.7 μm, 2.1 × 50 mm, with mobile phase comprising of 20 mM NaH2PO4.2H2O:Methanol (40:60 v/v) plus 7 mM SDS. The flow rate was 1.0 mL/minute and UV detection was acquired at 240 nm, switching to 220 nm at 1.5 minutes. The UPLC method was validated according to ICH Q2(R1) guidelines(17) and linearity was demonstrated in the concentration range 0.1–10.0 μg/mL for fluticasone propionate (R2 > 0.9999) and 0.05–0.80 μg/mL for salmeterol xinafoate (R2 > 0.9999). The quantitation limit for an injection volume of 20 μL was 0.02 μg/mL for fluticasone propionate and 0.01 μg/mL for salmeterol xinafoate. Precision of this method was characterized by an RSD of ≤0.23%. Using this validated method, the total emitted dose and fine particle mass of the dose were calculated.
Determination of total emitted dose and fine particle mass
The total emitted dose for fluticasone propionate and salmeterol was determined by calculating the sum of the mass on all components of each breathing simulator, induction port, pre-separator, and cascade impactor stages. Published Diskus data(1) reported fine particle mass as stages 2–7 on the Andersen cascade impactor (corresponding to aerodynamic diameter of 0.43–5.8 μm). To allow comparison of the Next Generation Impactor data generated in this study with the previously reported data for Diskus, the fine particle mass in this study was estimated by interpolation to the same size range (0.43–5.8 μm). Interpolation was carried out using linear regression of cumulative mass of drug deposited on the stages versus logarithmic effective cutoff diameter of the respective stages. Total emitted dose and fine particle mass were expressed as % labeled dose based on the dosage strength, for example, 50 μg salmeterol and 250 μg fluticasone propionate.
Statistical analyses
Statistical analysis of cascade impactor deposition data was carried out using Microsoft Excel version 16.45 (Redmond, WA). Mean and standard deviation values were calculated for the individual stage deposition for each breathing profile. The mean, standard deviation, and range values were calculated for all individual determinations on each breathing simulator.
Regression analysis was carried out using Prism software version 9.0 (San Diego, CA) to assess the significance of the trends in total emitted dose and fine particle mass with peak inhaled flow rate.
Analysis of variance (ANOVA) (mixed effects model) was performed using Minitab software version 18.0 (State College, PA) to analyze the total emitted dose and fine particle mass data obtained from the Si-Plan and Copley BRS 3100 breathing simulators.
Results
The inhalation profiles illustrated in Figure 3 highlight the differences seen between patients' inhalation characteristics. Differences can be seen in terms of not only peak pressure drop but also profile shape and profile time. These differences illustrate the utility of breathing simulators as a means to assessing potential dose performance in patients as a patient-focused method, as opposed to using fixed flow rates.
The mean deposition data obtained using each inhalation profile are summarized in Tables 2 and 3 for the Si-Plan breathing simulator and Tables 4 and 5 for the Copley breathing simulator. The Si-Plan results include deposition data for the breathing simulator itself, which is the sum of deposition on the sampling chamber, piston chamber, valve, and throat-valve connector. For the Copley BRS 3100, deposition on the mixing inlet was recovered with the mouthpiece adapter/induction port fraction.
Mass of Fluticasone Propionate Deposited on Each Component of the Si-Plan Breathing Simulator and Next Generation Impactor, for Each Inhalation Profile
Values are shown as mean (SD). Next Generation Impactor operated at 60 L minute−1.
BS, breathing simulator deposition; FPM, fine particle mass, interpolated to 0.43–5.8 μm; MA/IP, mouthpiece adapter+induction port; MOC, micro-orifice collector; PS, preseparator; S1 through S7, NGI stages 1 through 7; SD, standard deviation; TED, total emitted dose.
Mass of Salmeterol Deposited on Each Component of the Si-Plan Breathing Simulator and Next Generation Impactor, for Each Inhalation Profile
Values are shown as mean (SD). Next Generation Impactor operated at 60 L minute−1.
Mass of Fluticasone Propionate Deposited on Each Component of the Copley BRS 3100 Breathing Simulator and Next Generation Impactor, for Each Inhalation Profile
Values are shown as mean (SD). Next Generation Impactor operated at the peak inhaled flow rate for each inhalation profile (Table 1).
MA/IP/MI, mouthpiece adapter+induction port+mixing inlet.
Mass of Salmeterol Deposited on Each Component of the Copley BRS 3100 Breathing Simulator and Next Generation Impactor, for Each Inhalation Profile
Values are shown as mean (SD). Next Generation Impactor operated at the peak inhaled flow rate for each inhalation profile (Table 1).
Note that the deposition data on individual stages cannot be compared directly between the breathing simulators or between the individual profiles using the Copley breathing simulator, because the cascade impaction was carried out at a fixed flow rate of 60 L minute−1 on the Si-Plan instrument, but at the peak inhaled flow rate of each profile on the Copley instrument, the stage-effective cut-diameters vary with flow rate.
The total emitted dose and fine particle mass results for the 13 inhalation profiles are summarized in Tables 6 and 7, respectively. The mean, range, and standard deviation values for each breathing simulator were calculated from the 39 individual determinations (3 replicates of 13 inhalation profiles).
Summary of Total Emitted Dose Data for Wixela Inhub, Showing Overall Mean, with Range and Standard Deviation of Individual Determinations
% Labeled dose calculated based on dosage strength (50 μg salmeterol, 250 μg fluticasone propionate).
Summary of Fine Particle Mass (0.43–5.8 μm) Data for Wixela Inhub, Showing Overall Mean, with Range and Standard Deviation of Individual Determinations
% Labeled dose calculated based on dosage strength (50 μg salmeterol and 250 μg fluticasone propionate).
Wixela Inhub gave a total emitted dose for fluticasone propionate and salmeterol of ∼102% and 103% target emitted dose, respectively, when using severe COPD patient inhalation profiles on the Si-Plan breathing simulator. When using the Copley BRS 3100, the total emitted dose for fluticasone propionate and salmeterol was ∼102% and 105% target emitted dose, respectively. These results show that high emitted dose was produced from the device and that high analytical recovery was achieved.
Discussion
In vitro performance of Wixela Inhub
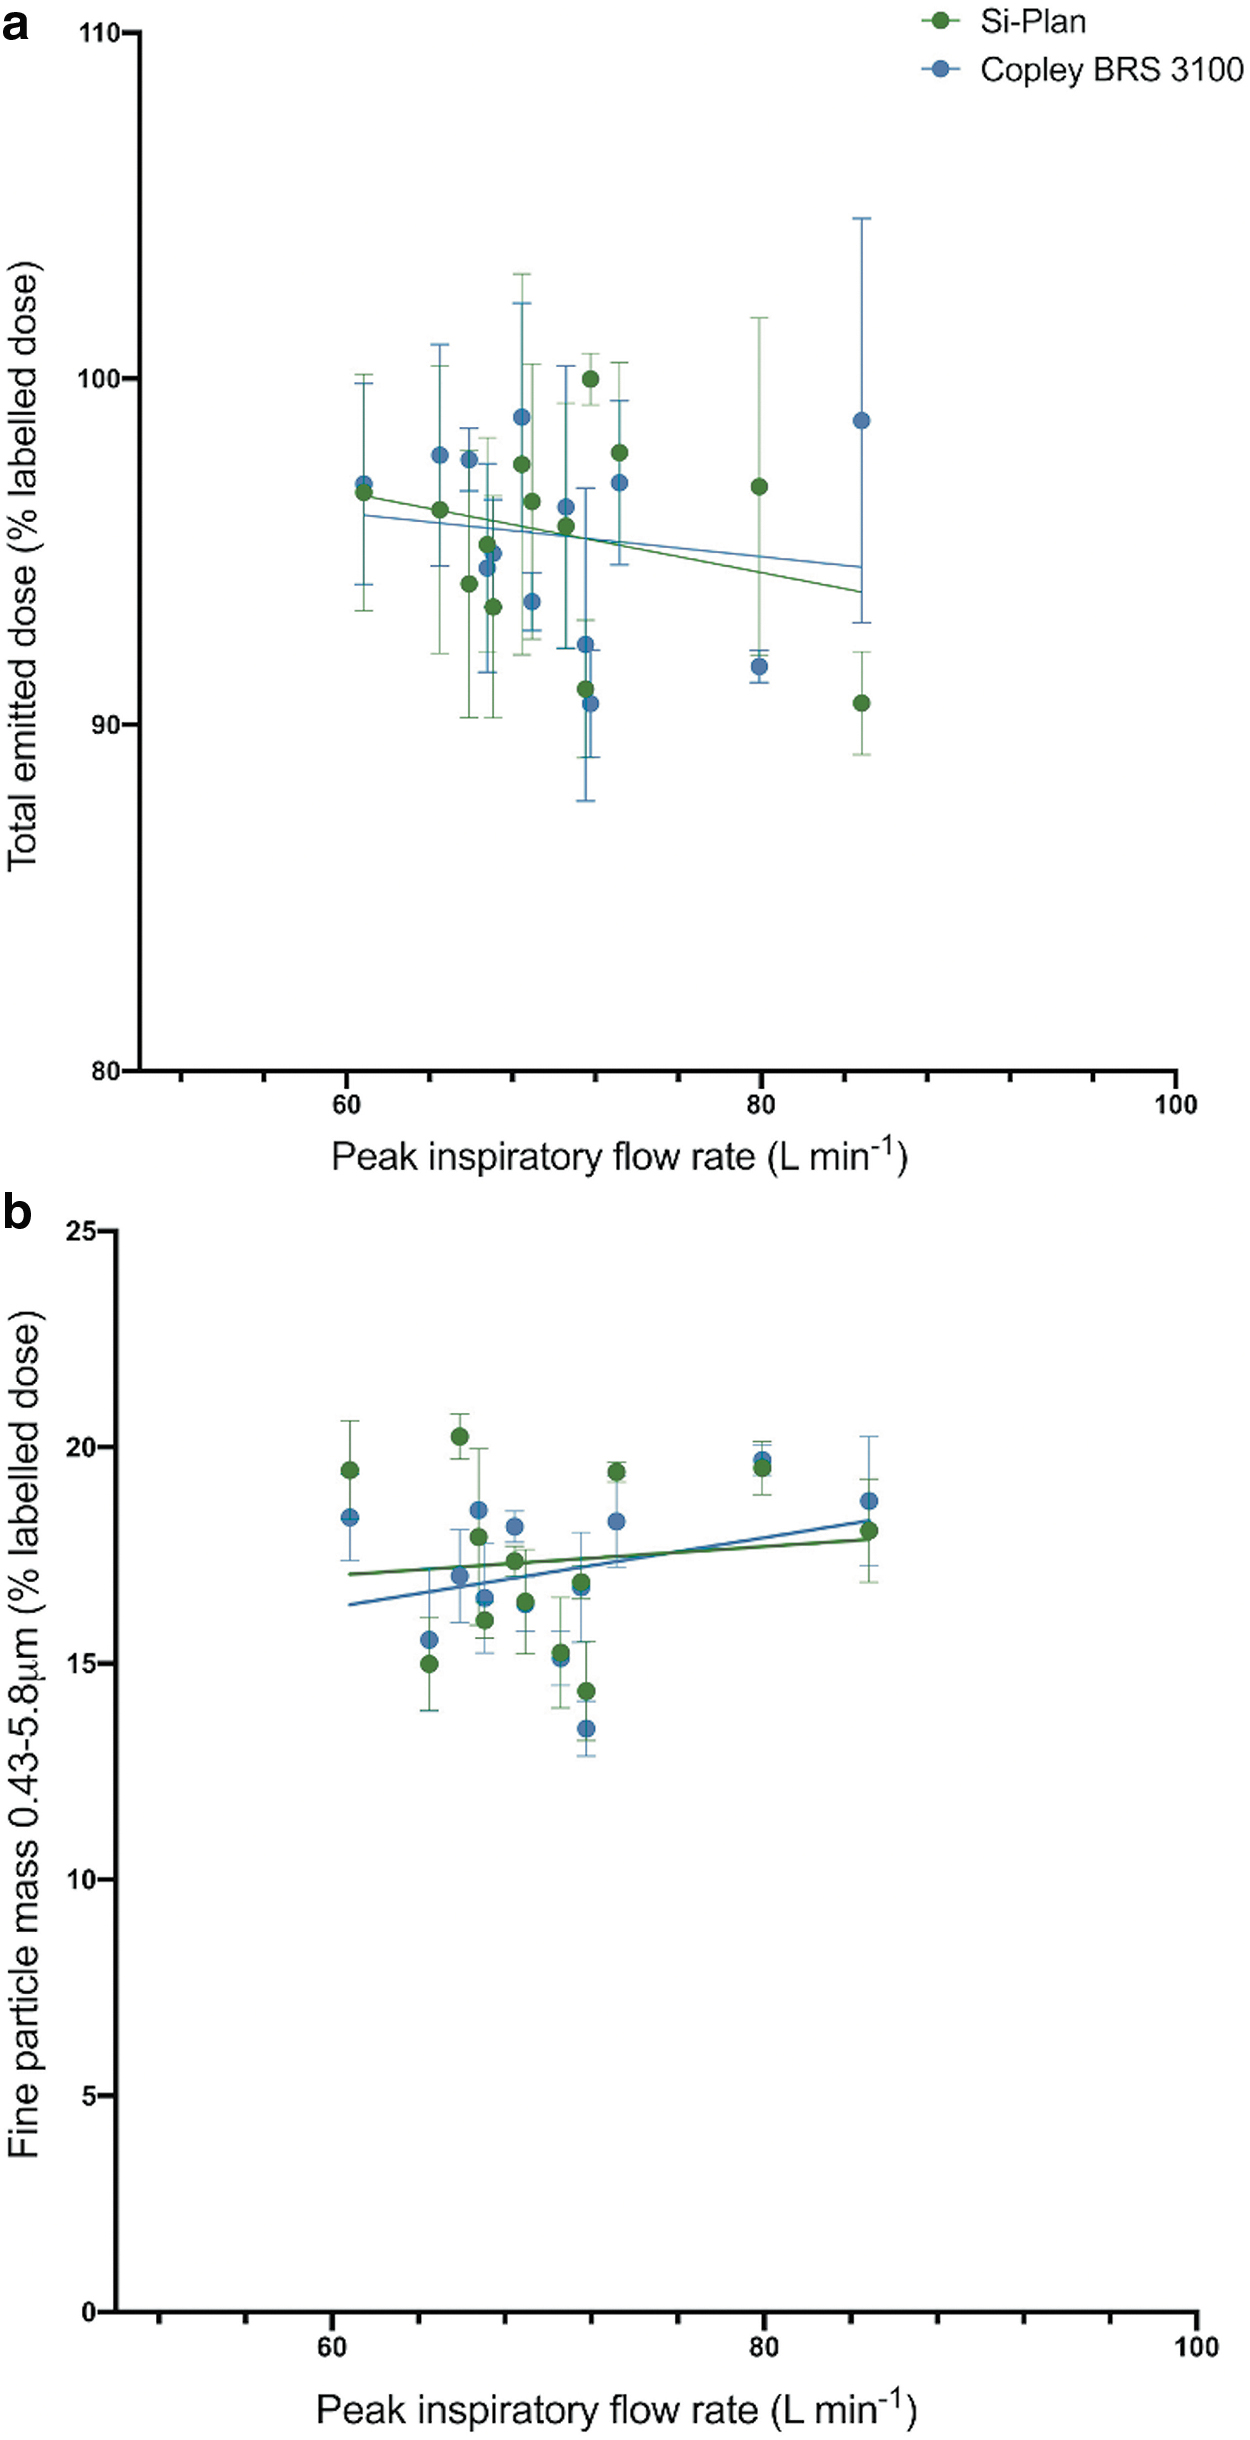
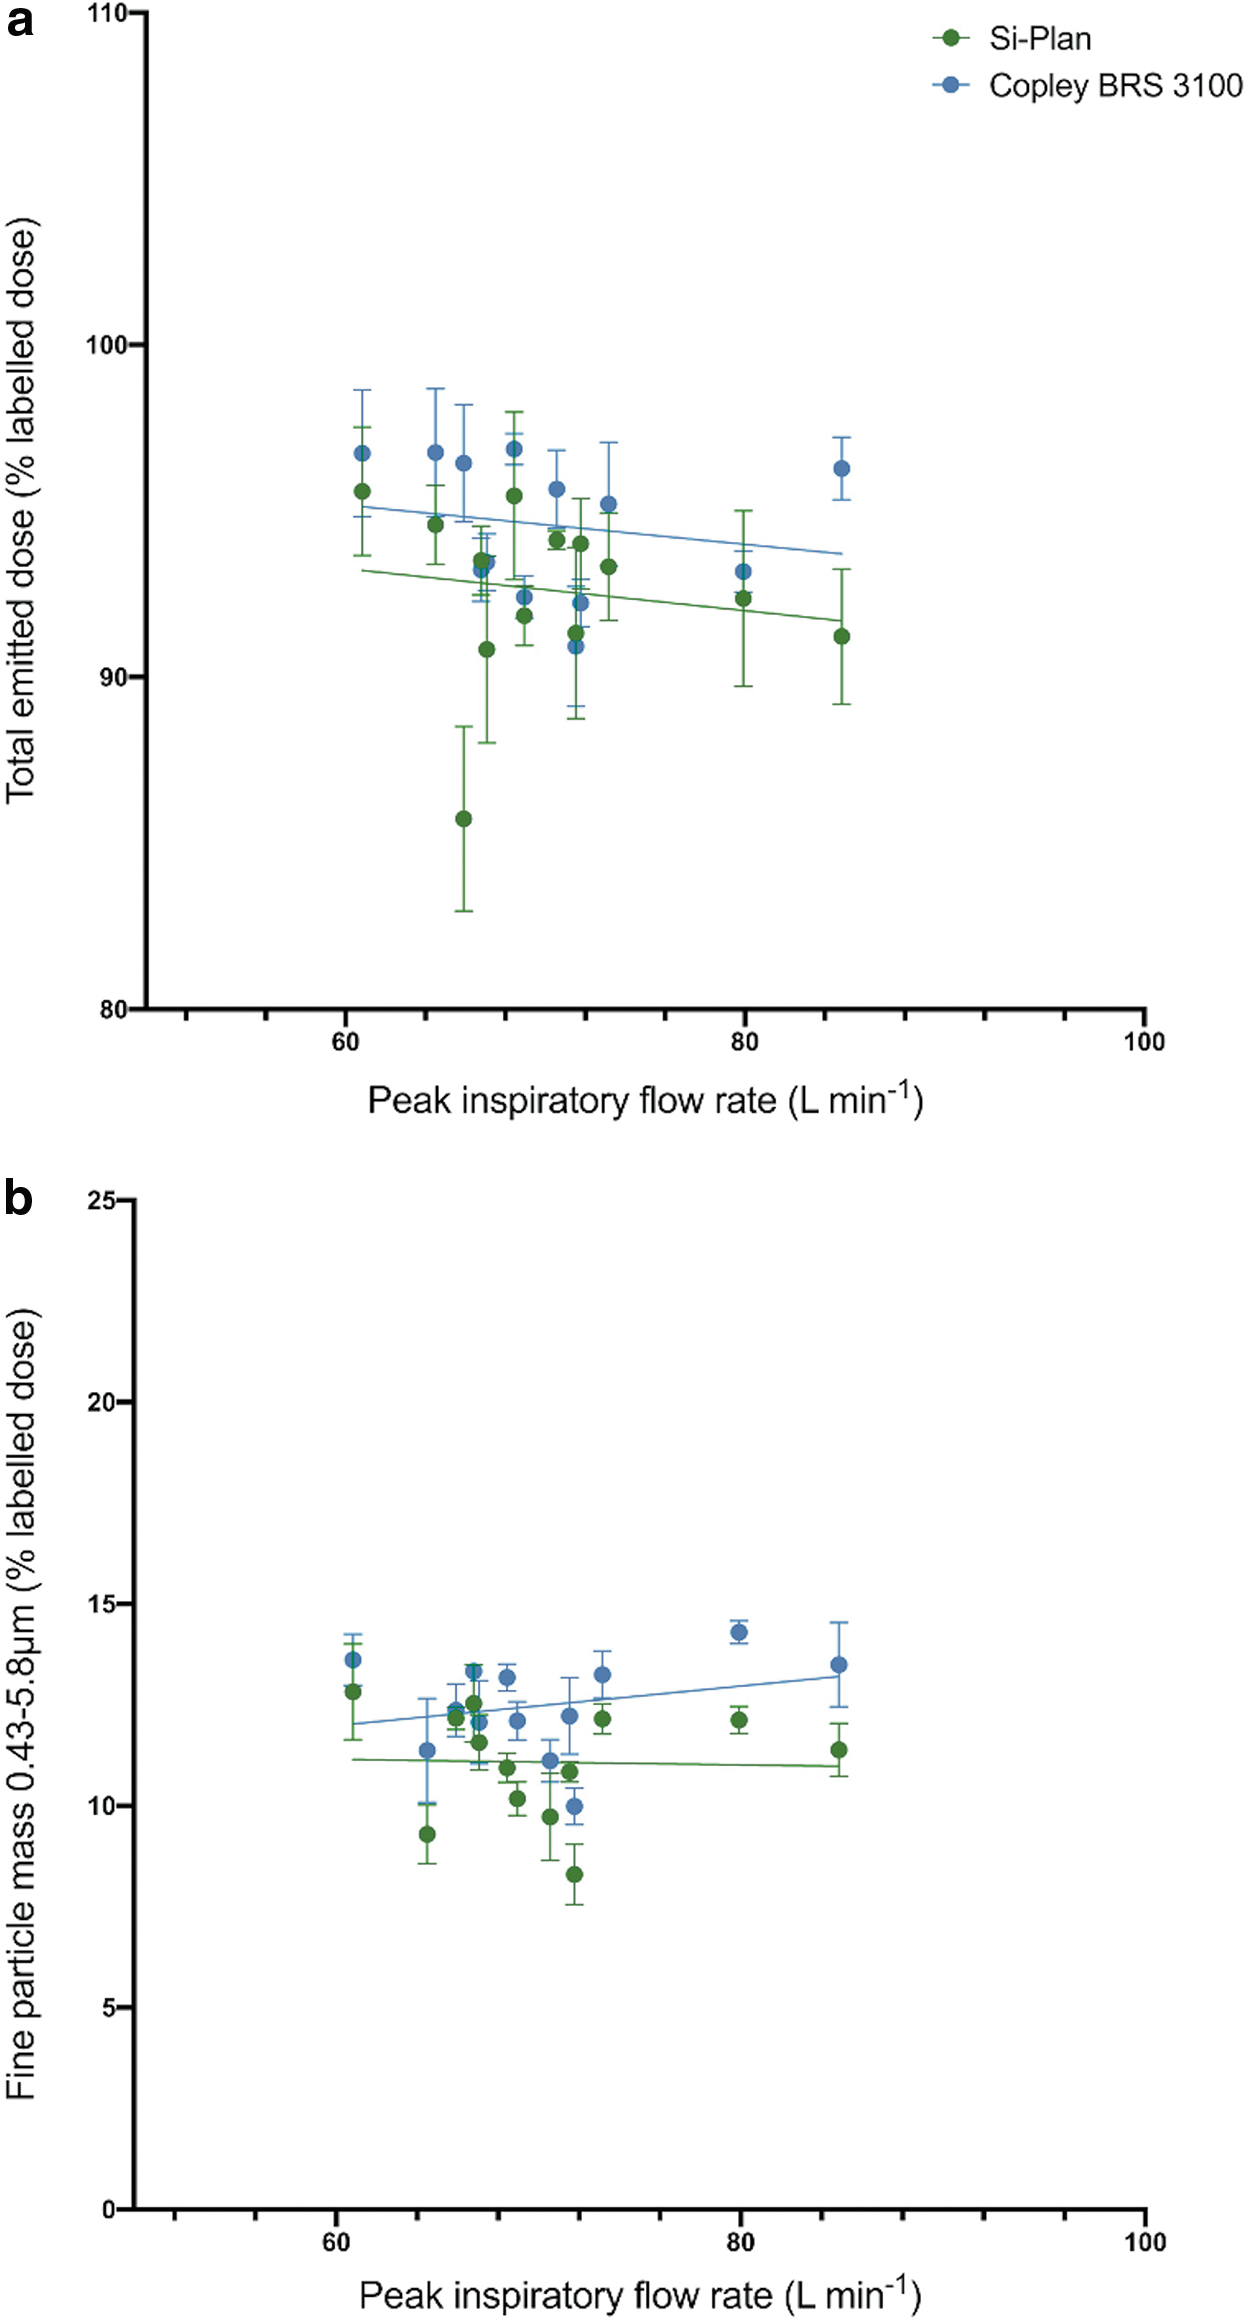
The flow dependency of the Wixela Inhub was assessed by considering the variation in total emitted dose and fine particle mass with the peak inhaled flow rate of the inhalation profiles. Figure 4a and b show fluticasone propionate total emitted dose and fine particle mass, respectively. Figures 5a and b show salmeterol total emitted dose and fine particle mass, respectively. In each figure, data from the two breathing simulators are compared.
Variation of fluticasone propionate total emitted dose
Variation of salmeterol total emitted dose
The plotted results in Figures 4–5 show that peak inspiratory flow rate has little, or no effect on total emitted dose and fine particle mass, over the range tested (60.8–84.9 L minute−1) when using the two breathing simulators. Regression slope analysis (shown in Table 8) showed that the gradients of the trendlines for both parameters with flow rate using both breathing simulators did not deviate significantly from zero. This is an important observation, as the low flow dependence of Wixela Inhub means that consistent dosing may be achieved across a broad range of patient inhalation profiles. The low flow dependency observed is consistent with the in vitro dose performance testing of Wixela Inhub at fixed flow rates, reported by Cooper et al.,(5) and is similar to the flow dependency of the Diskus device, reported by Burnell et al.(1)
Regression Slope Analysis of Fluticasone Propionate and Salmeterol Flow-Dependence Data
The fluticasone propionate results for Inhub (summarized in Tables 6 and 7) are similar to the total emitted dose and fine particle mass data for fluticasone propionate from the Diskus inhaler, published by Burnell et al.,(1) in which the Electronic Lung device was used. For Diskus, mean fluticasone propionate total emitted dose was reported as 238.2 mcg with a range of 217.9–264.1 mcg. Mean fluticasone propionate fine particle mass was reported as 43.8 mcg, with a range of 25.6–58.4 mcg.
Comparison of breathing simulators
The two breathing simulators used differ significantly in their mechanical operation and design. For example, the sampling chamber of the Si-Plan has a large surface area, which could generate artifacts. The Si-Plan also has many component parts, which drug product must be recovered from. The Si-Plan breathing simulator is much more time-consuming and labor-intensive to use, but enabled the operation of the cascade impactor at a fixed flow rate of 60 L minute−1. On the other hand, the Copley BRS 3100 utilizes a mixing inlet to maintain a fixed flow rate (which differs depending on the inhalation profile) across the whole system; this is the only additional part to recover drug product from when compared to a standard NGI. The Si-Plan breathing simulator is programmed to generate a pressure drop profile, whereas the Copley BRS 3100 is programmed to generate a flow profile. The Si-Plan breathing simulator therefore generates a flow profile that depends on resistance of each device tested, whereas the Copley BRS 3100 profiles use a nominal value for resistance. However, this is unlikely to have a significant effect on the results, as the resistance value of the Inhub device exhibits a high level of consistency.(5)
There was considerable deposition on the breathing simulator components of the Si-Plan instrument detailed in Tables 2 and 3, with up to 89 μg fluticasone propionate and 19 μg salmeterol (up to ∼40% of the total emitted dose). The drug recovered from the mixing inlet of the Copley breathing simulator was not determined separately as it was recovered and analyzed with the induction port fraction.
Despite the deposition on the breathing simulator components, statistical analyses of the mean results in Tables 2–5 showed no significant difference in fluticasone propionate total emitted dose (238.8 μg vs. 238.7 μg, p = 0.949) and fine particle mass (43.4 μg vs. 42.8 μg, p = 0.310) between the Si-Plan and Copley BRS 3100 breathing simulators. However, some difference was observed between the two breathing simulators for salmeterol total emitted dose (46.3 μg vs. 47.3 μg, p < 0.05) and fine particle mass (5.5 μg vs. 6.2 μg, p < 0.05). The difference in salmeterol total emitted dose (1.0 μg, 95% CI, 0.5–1.5 μg) is statistically significant, but is only 2% of the total dose. The 0.7 μg difference in salmeterol fine particle mass is also statistically significant (95% CI 0.5–0.9 μg) and is ∼12% of the fine particle mass. It is suspected that the relative complexity of the Si-Plan breathing simulator (multiple components and higher internal surface area) leads to reduced recovery of fine particles from real samples, which is relatively more impactful for salmeterol because of its lower dose, but this could not be demonstrated in recovery experiments. It must also be noted that the two breathing simulators were tested at different times in different laboratories and were, therefore, outside of intermediate precision parameters. The operating difficulties of the Si-Plan breathing simulator (large size and multiple components) lend to difficulties in low-level recoveries when directly compared to the relatively simple operation of the Copley BRS 3100.
A possible limitation of this study is that the standard metal right-angled (USP) NGI induction port was used with both breathing simulators. The use of different induction port/throat designs with increased physiological relevance has been described in breathing simulator experiments reported elsewhere.(14,18,19) Such approaches have shown promise for increasing the in vivo predictability of in vitro performance measurements of inhalers.(19) Therefore, investigation of throat geometries may be the subject of further studies. However, the aim of this study was to investigate the effect of peak inspiratory flow rate on the performance of the Wixela Inhub, and so the use of multiple throats would have greatly increased the complexity of the study.
Conclusion
The in vitro performance data obtained in this study suggest that severe COPD patients using Wixela Inhub produce inspiratory flow rates sufficient to achieve a consistent inhaled dose, with low in vitro flow dependency observed within the patient population. The data obtained are similar to that previously reported for fluticasone propionate from the Diskus inhaler. Two breathing simulators, differing significantly in design, showed no significant difference in fluticasone propionate result. Slightly (but statistically significant) lower results for total emitted dose and fine particle mass were obtained for salmeterol using the Si-Plan breathing simulator.
Footnotes
Acknowledgments
The authors acknowledge Frank Chambers (Inhalytic Ltd.) for method development and data verification support. The authors also wish to acknowledge The Medway Centre for Pharmaceutical Sciences at the University of Greenwich for provision of facilities and technical expertise.
Authors' Contributions
All authors, including the co-authors, are responsible for a significant part of the article. All authors and co-authors have contributed to writing the article, reviewing it, and revising its intellectual and technical content. Any author whose name appears on this article assumes responsibility and accountability for the results.
Author Disclosure Statement
T.S. is an employee of University of Greenwich. M.K., A.C., and A.P. are employees of Viatris, Inc. A.C. and A.P. own shares in Viatris, Inc.
Funding Information
This study was supported by Viatris, Inc., Sandwich, Kent, United Kingdom.
Reviewed by:
Michael Hindle
Guenther Hochhaus