
Abstract
Background:
Determination of aerosol aerodynamic particle size distributions (APSD) from dry-powder inhalers (DPIs), following quality control procedures in the pharmacopeial compendia, requires that the flow through the measurement apparatus, comprising induction port, optional pre-separator, and cascade impactor, starts from zero on actuation of the inhaler, using a solenoid valve to apply vacuum to the apparatus exit. The target flow rate, governed by the inhaler resistance, is reached some time afterward. Understanding the behavior of the DPI design-specific flow rate-rise time curve can provide information about the kinetics of the initial powder dispersion in the inhaler and subsequent transport through the APSD measurement equipment. Accurate and precise measures of the internal volume of each component of this apparatus are required to enable reliable relationships to be established between this parameter and those defining the flow rate-rise time curve.
Methods:
An improved method is described that involves progressive withdrawal of an accurately known volume of air from the interior passageways of the apparatus-on-test that are closed to the outside atmosphere. This approach is applicable for determining internal volumes of components having complex internal geometries. Filling some components with water, along with volumetric or gravimetric measurement, has proven valuable for the induction port and for checking other measurements.
Results:
Values of internal volume are provided for the USP (United States Pharmacopeia)/PhEur (European Pharmacopoeia) induction port, the Next-Generation Impactor (NGI™) with and without its pre-separator, and various Andersen 8-stage cascade impactor configurations with and without their pre-separators.
Conclusion:
These data are more accurate and precise, and therefore update those reported by Copley et al.
Introduction
Pharmacopeial methods(1,2)
Problems arise in this testing strategy because of the following limitations:
the physical processes associated with the particle transport process through the cascade impactor and subsequent size fractionation based on differing particle inertia are defined only for steady air flow,(5) and not during the start-up and shut-down phase of the procedure; the relationship between flow rate and release of particles from the passive DPI is different for every inhaler design and is largely associated with the flow resistance of the device(6); therefore, the air flow start-up transient affects each DPI differently.
The shut-down phase is likely unimportant, because by then, after sampling the 4 L of volume specified in the pharmacopeial compendia for this performance test,(1,2) all of the dispersed particulate will have been transported through, and collected by the measurement apparatus, whichever cascade impactor design is used.(7) However, the situation is entirely different at start-up, where the precise trajectory of flow rate with elapsed time can potentially influence both powder dispersion into the aerosol and subsequent transport of the aerosol through the apparatus.(3)
Hitherto, there has been a sparsity of data to guide the user community on the start-up flow kinetics for passive DPI testing following pharmacopeial procedures. The primary purpose of a recently undertaken multi-laboratory investigation, sponsored by the European Pharmaceutical Aerosol Group (EPAG), was to establish the variation in volumetric flow rate as a function of time from initiation of sampling by various aerosol collection apparatuses currently in widespread use for DPI performance testing.(8,9) These studies have confirmed the intuitively obvious dependence of the flow transient duration on the internal volume of the test system as well as on the flow resistance of the inhaler. However, the internal volumes of the various measurement apparatuses (e.g., cascade impactor, pre-separator, United States Pharmacopeia [USP]/European Pharmacopoeia [PhEur] induction port) must be well defined, to establish quantitative relationships between the parameters governing the start-up kinetics.
In a preliminary study, published in 2005 by Copley et al.,(10) a technique was developed for measuring the volume of the test systems, one that relied on the fact that pressure (P) times volume (V) is a constant in a closed system (ideal gas law). The pressure was measured in a closed system that included the impactor components along with an air-tight syringe whose plunger could be withdrawn to specified volume increments. The P-V data were analyzed to deduce the unknown volume of the test system by using the several different syringe volumes that generated a range of internal pressure values. In this way, the intricacies of the internal geometry of the impactor components were included in the measurement of the total volume, without having to be completely understood. Since then, the need for a nonlinear analysis of the data became clear as opposed to the linear approach that was undertaken for the 2005 study. Separately, the reported internal volume of the USP/PhEur induction port, stated therein to be 85 mL, came under scrutiny because this value is 25% larger than the range of values between 66 and 68 mL provided by other investigators. In consequence, the 85-mL value is now regarded as erroneously large. Given this background, the EPAG researchers therefore decided that better experimental methods and data analysis methods were needed for measuring internal volumes of the several components of the most widely encountered apparatuses defined in the pharmacopeial compendia for the determination of inhaler aerosol APSD. The purpose of this study is, therefore, twofold:
Materials and Methods
The inhaler performance test apparatuses evaluated for internal volume were the Next-Generation Impactor (NGI™) and the Andersen 8-stage nonviable cascade impactor (ACI), both as described in the PhEur(1) and USP,(2) including the USP/PhEur induction port and appropriate pre-separators. The ACI has several configurations for testing DPIs at the specified flow rates of 28.3, 60, and 90 L/min,(11,12) and each of these were therefore included. Further, many of these configurations are pertinent to the apparatus configurations evaluated in the EPAG DPI flow rate-rise time study.(8,9)
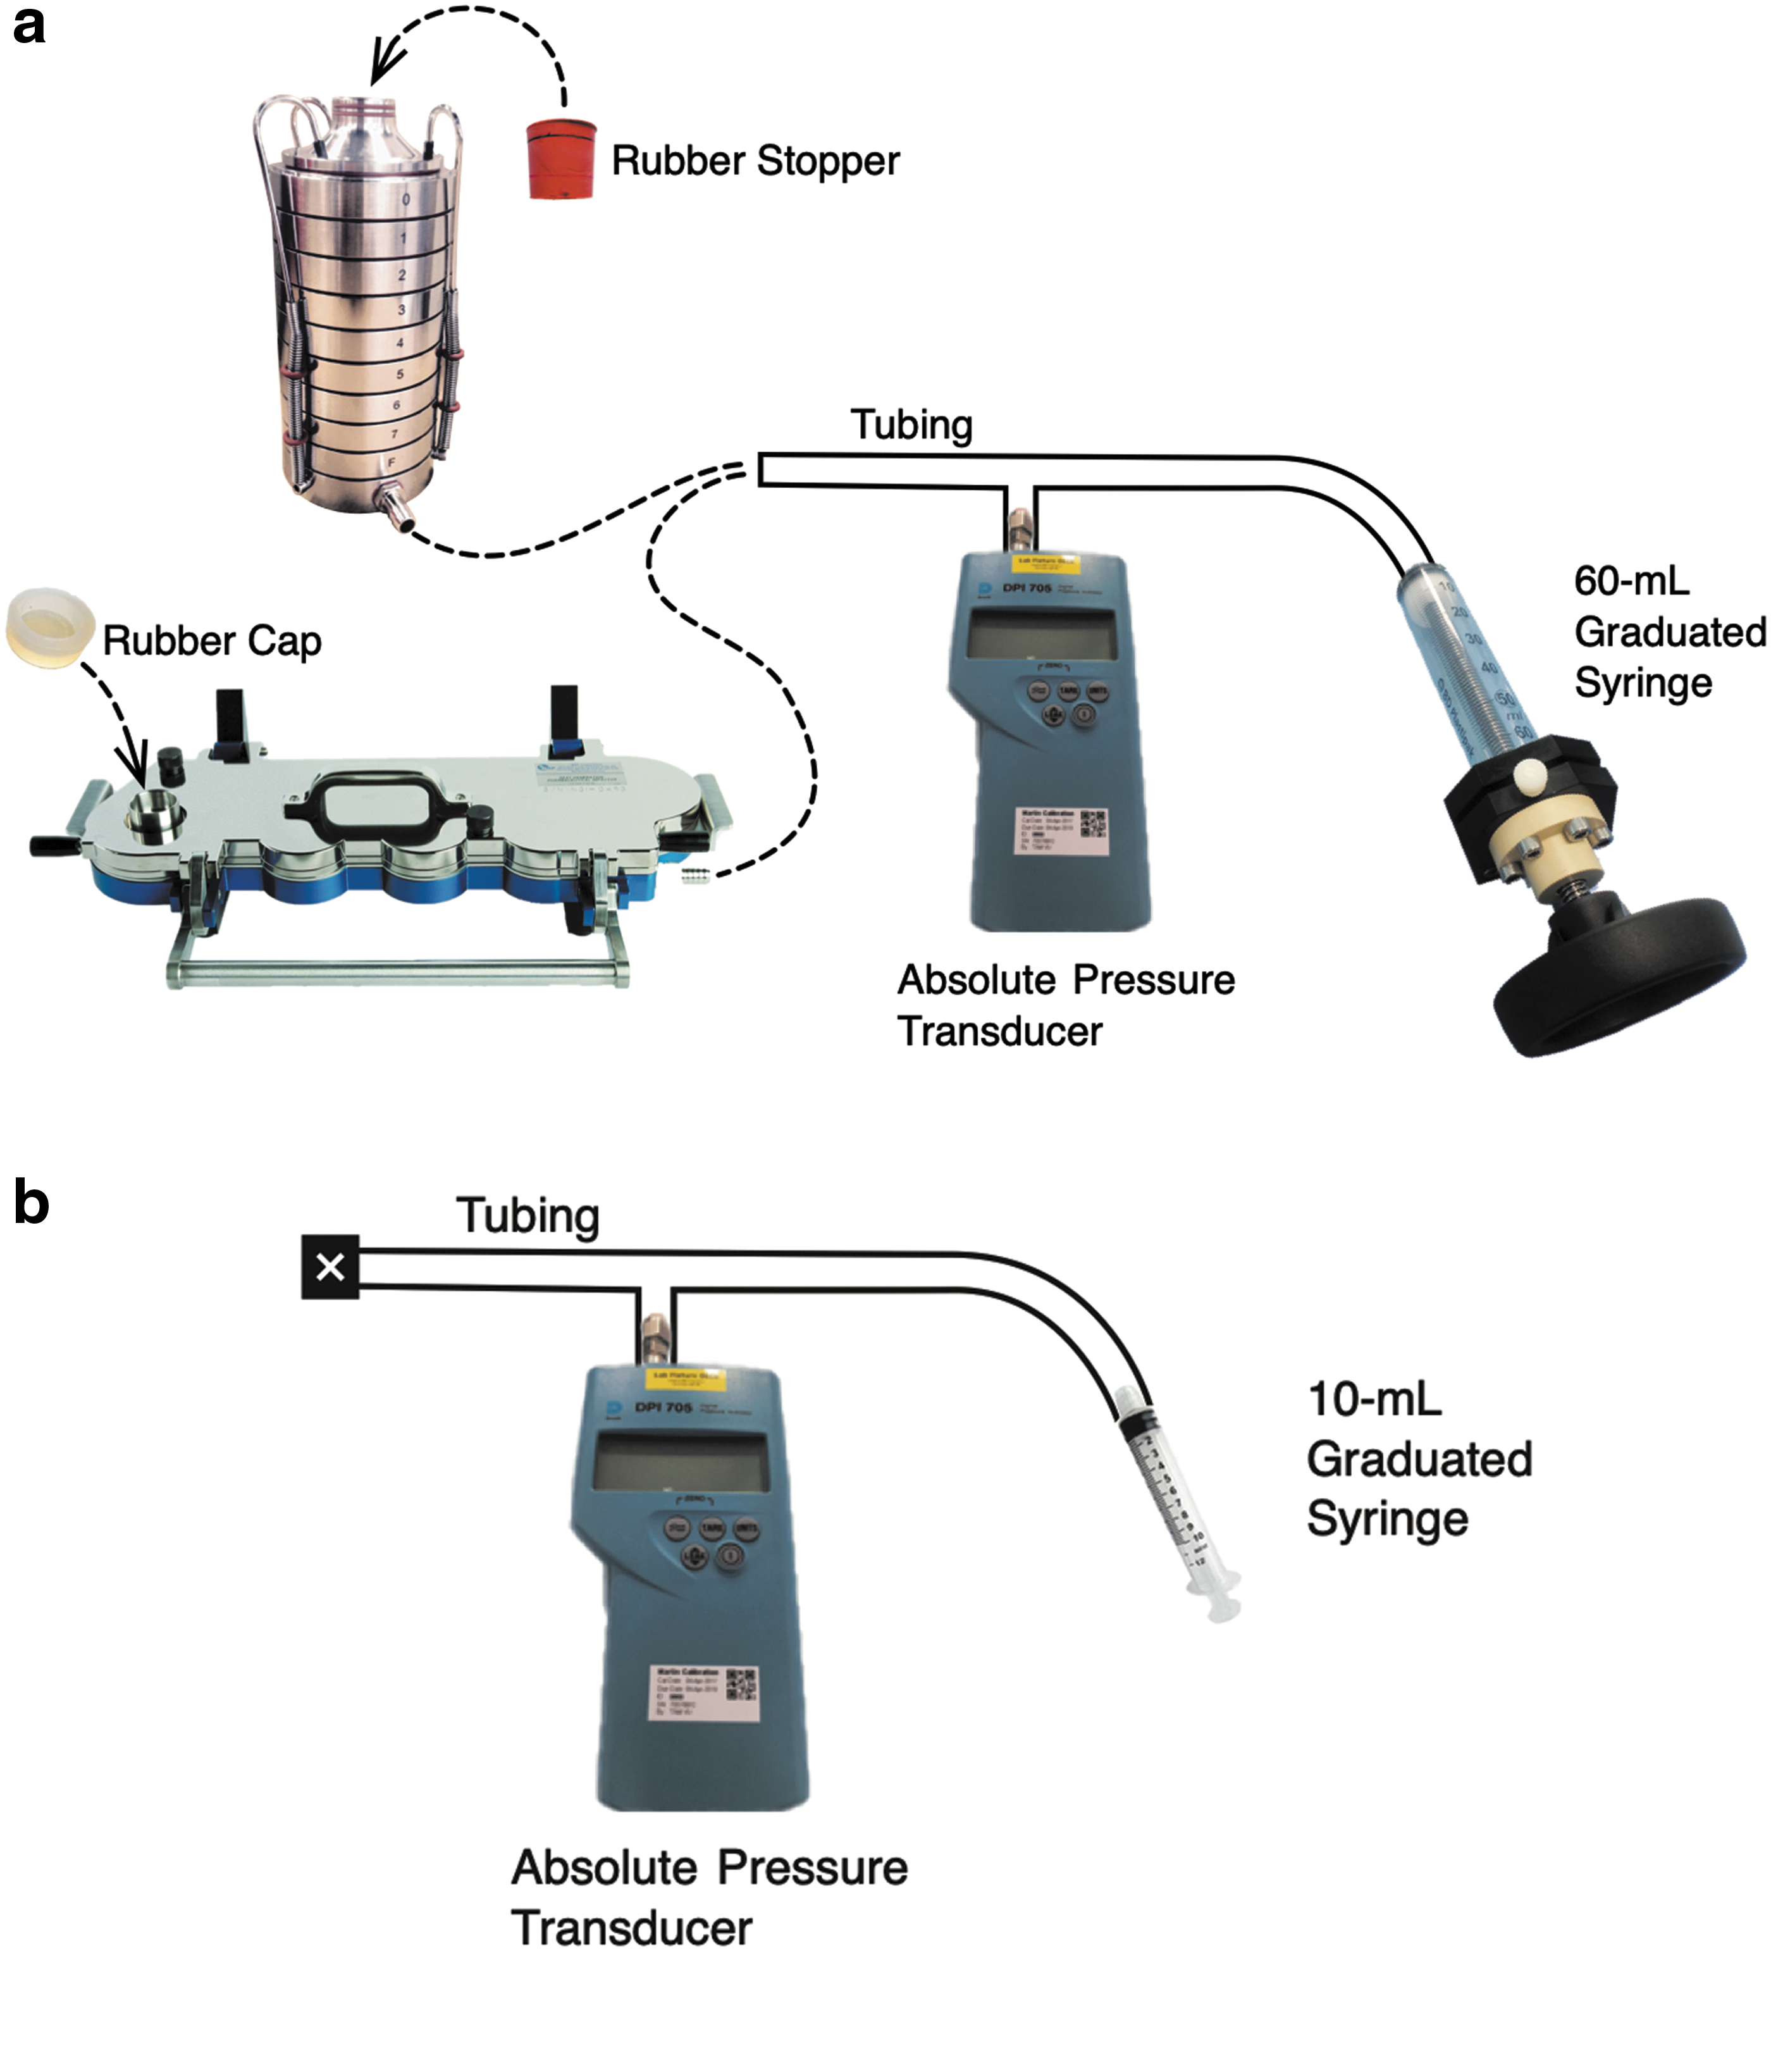
The primary method for measuring internal volumes was by following the P-V behavior in a closed system. In this method, the apparatus-on-test was connected to an ordinary tubing “T-piece” to which necessary measurement equipment could be attached (Fig. 1). This equipment comprised an absolute pressure transducer (Model 705; Druck Ltd., Groby, Leicester, United Kingdom) and an air-tight plastic syringe (Plastipak; Becton-Dickinson and Co., Wokingham, Berkshire, United Kingdom). Repeat measurements were conducted by detaching the syringe from the tubing, pushing the air out of the syringe, and reattaching the tubing. Two syringes were employed with volumes of 60 and 10 mL, graduated in 10- and 1-mL increments, respectively. The 60-mL syringe, with a custom-built threaded plunger shown in Figure 1, was chosen for measuring the volume of the impactors with and without their pre-separators. The 10-mL syringe was chosen for measuring the volume of the measurement apparatus itself with NO impactor components included (i.e., the system “dead” volume).
The method of closing the inlets to each impactor comprised an elastomer cap for the NGI with or without pre-separator and an elastomer stopper for the several ACI configurations. The cap did not occupy any of the NGI internal volume measured. However, the stopper protruded slightly into the inlet of each ACI configuration under evaluation (with either expansion cone or pre-separator as entry to the impactor). The stopper was therefore marked while it was in place, so that the volume of occupied space inside the impactor could be calculated. The stopper occupied ∼3–4 mL for all configurations other than the 90-L/min design with pre-separator. The stopper occupied ∼13 mL for this 90-L/min configuration. These values were added to the measured internal volumes to determine the complete internal volumes.
The routine procedure for measuring the volume of the impactor with or without pre-separator involved recording the pressure with the 60-mL syringe plunger fully inserted, then progressively withdrawing the syringe plunger in increments of 10 mL, and finally recording the stable system pressure at each point. Two sets of tests were performed at different times, a minor factor, but nevertheless for the sake of completeness we have designated the identifiers “set A” and “set B,” when referring to the two different periods. In both sets of data, the system set-ups were identical (i.e., comprising the same connecting tubing with the same pressure transducer). The accuracy of the 60-mL syringe used for data set A was checked by dispensing water into a beaker on a suitably precise gravimetric balance and was found to be within 0.2 mL of the expected value. To determine the apparatus dead volume, the impactor and pre-separator were removed from the test system, and the 10-mL syringe plunger was attached, first fully inserted, and finally withdrawn to volumes of 2, 5, 7, and 10 mL, recording the system pressure at each point.
Three replicate measurements were undertaken at each test condition. Every time the syringe was withdrawn further, thereby changing the internal pressure, the pressure was determined within seconds of executing the withdrawal and then measured again 1 minute later. This procedure allowed real-time quantification of any detectable leak. No leak was detected throughout the test program.
The equation relating P and V in a closed system, namely P*V = constant, has the form of a rectangular hyperbola, requiring the techniques of nonlinear least-square analysis to deduce the volume when the syringe plunger is set at the reference start condition of zero volume withdrawn (V0). This volume includes the impactor components and the test tubing and connections (the dead volume). The volume of the impactor components was then determined by subtracting the dead volume (typically 32 mL). The appropriate nonlinear data analysis method for calculating the internal volume of each impactor apparatus is described in detail in Appendix A1. Here, we also describe alternative nonlinear methods, an approximate linearized method, and the error made in the data analysis in the previous study(10); we have compared the results arising from all of these data analysis methods.
The expected internal volume of the compendial induction port by itself was calculated from the nominal dimensions given in the PhEur(1) and also in the USP(2) (details in Appendix A2). The internal volume of one USP/PhEur induction port was also determined experimentally by filling with water and decanting the water into a graduated cylinder for quantification. The goal of the measurement was to determine the volume that is active during an inhaler test (i.e., with the internal surfaces exposed to the passage of aerosol rather than forming part of the coupling to the remainder of the apparatus). Consequently, the design chosen for the testing was the induction port that fits the NGI [MSP Corporation, Shoreview, MN; see fig. 9 of Marple et al.(13)]. It is possible with this induction port to determine its internal volume by securing a length of sealing tape tightly to close off one end before slowly filling the other end with water, taking care not to trap air bubbles. The method is referred herein as the “water-fill” technique.
This “water-fill” technique was also used as a check on the P-V data quality. With the NGI, the “impactor plus pre-separator” volume and the “impactor alone” volume, when measured by P-V behavior, should differ by the actual volume of the pre-separator. A separate method of measuring the NGI pre-separator volume was devised to test this reasonable expectation. First, the aluminum insert of an NGI pre-separator was removed from the pre-separator, and an elastomer cap was placed on the female-tapered inlet of this “empty” NGI pre-separator. The pre-separator was then placed upside down on a gravimetric balance and filled with water to measure its volume (the upside-down orientation assisted with eliminating air bubbles). The volume of the insert itself was calculated by separately weighing it and dividing by its density (2.70 g/cm3). The volume of the insert was then subtracted from the volume of the empty pre-separator to yield the volume of the normal, in-use NGI pre-separator. This test of the data quality could be performed only with an NGI and its pre-separator. An equivalent test with the ACI would have been complicated by the presence of the inlet cone that resides on this impactor design when there is no pre-separator. Also, when this pre-separator was not on the impactor, there was difficulty in either effecting a seal at the connecting end or, if it was inverted, trapping air in the body of the pre-separator.
Results and Discussion
Tables 1 and 2 list the volumes (mean ± SD, n = 3) determined for each impactor apparatus measured, for configurations involving the NGI and the various configurations of the ACI for use at different target flow rates, respectively, and also show the values reported by Copley et al.,(10) where such data are available. The measured volumes were typically 5% smaller than those of the 2005 study; the reason for the divergence is not clear, although the data reduction method employed by Copley et al.(10) can produce this magnitude of discrepancy (Appendix A1). The volumes of several of the ACI configurations were separately assessed by one of the manufacturers (Copley Scientific Ltd., Nottingham, United Kingdom, data not shown), and their computer-aided design (CAD) software values were marginally smaller by no more than 4% compared with the values measured in this study. Given the limitations of the techniques as a whole, these CAD-based values therefore corroborate the current values of internal volume, rather than those reported in 2005. Finally, the uncertainty in the measurements with the closed-system method was in the range from 1% to 2%, a result that conveys confidence in the current data and the importance of using the mathematically correct nonlinear data analysis method that allows for the calculation of the uncertainty in the calculated results (Appendix A1).
Internal Volumes of Components and Groups of Components Related to Testing with the Next-Generation Impactor for Inhaler Aerosol Aerodynamic Particle Size Distribution
NGI and its pre-separator reported separately by Copley et al.(10)
NGI, Next-Generation Impactor; PhEur, European Pharmacopoeia; USP, United States Pharmacopeia.
Internal Volumes of Components and Groups of Components Related to Testing with the Andersen Cascade Impactor for Inhaler Aerosol Aerodynamic Particle Size Distribution
28.3-L/min ACI and 28.3-L/min pre-separator reported separately by Copley et al.(10)
Mean value for the three configurations; uncertainties remain for each configuration.
28.3- and 60-L/min configurations.
28.3-L/min configuration.
Ninety-liter per minute configuration.
ACI, Andersen cascade impactor.
Other features of the current procedure represent important improvements over the approach taken by Copley et al.(10) In particular, the overall accuracy was improved by making a quantitative measurement of the dead volume of the measurement apparatus itself, a measurement enabled with a syringe with a capacity of just 10 mL. In the previous work, the dead volume had been estimated as consisting only of the sum of the contributions from the tubing making the connections in the system, thereby neglecting the dead volume inside the Druck 705 pressure transducer and the dead space contained in the various connectors themselves. Another refinement was the introduction of a check for leakage of ambient air into the apparatus-on-test at the time each and every data point was acquired. This verification comprised determining the pressure after withdrawing the syringe plunger to a new setting and re-measuring the pressure 1 minute afterward. The pressure reading did not change by more than 0.1% during this 1-minute period, indicating that the requirement of a closed system was maintained throughout the volume determination process. And a final refinement to the method was careful accounting for volume taken up by the rubber stopper used in the testing of the ACI configurations.
The internal volume of the induction port (mean ± SD, n = 3) was determined to be 67 ± 1 mL, using the water-filling method. This value agrees with the value of 67.3 mL calculated (Appendix A2) from the nominal dimensions given in the PhEur(1) and the USP.(2) Further investigation revealed that the previously reported internal volume of this component of 85 mL(10) had been based on an early prototype and should therefore no longer be considered representative for this component.
The volume of the NGI pre-separator was determined gravimetrically by filling it with water, and the volume was 804 mL, absent the insert. In these water-fill measurements, the NGI pre-separator (PS) was upside down on the gravimetric balance with the female end placed onto an elastomer cap that did not protrude into the pre-separator. In this way, no adjustment had to be made for the volume taken up by a rubber stopper. Water flows easily into the NGI PS male inlet when the PS is upside down, and care was therefore taken not to trap air bubbles near the male taper outlet (which was left open to judge the point when a complete fill was obtained). The insert itself weighed 160.1 g, corresponding to a volume of 59.3 mL (aluminum; density 2.70 g/cm3), and yielded an internal volume of 745 mL for the NGI pre-separator as it is normally configured, with the insert located inside. This value agrees within 1% of the volume estimated by subtracting the “NGI alone” result from the “NGI plus pre-separator” result (732 mL). To compare this value of 732 mL with the measured PS volume of 745 mL, the fit of the pre-separator into stage 1 of the NGI has to be considered. The female tapered inlet to stage 1 of the NGI accepts the male tapered outlet of the PS when in use for testing inhaler devices and that is how it was placed for the P-V testing. The volume of the female-tapered inlet to stage 1 was determined to be ∼18 mL (Appendix A2). Hence, when the NGI PS attaches to the NGI, the expected resulting volume is the PS volume plus the “NGI alone” volume MINUS 18 mL. Hence, subtracting the “NGI alone” result from the “NGI with pre-separator” result leads to an estimate of 750 mL for the PS volume. This 750-mL estimate of the internal volume of the PS agrees with the 745 mL measured by the water-fill method, thereby building confidence in the accuracy of the internal volume measurements using the P-V method.
Table 1 includes a summary of the internal volumes of common arrangements of the components associated with the NGI. The induction port, when added to the NGI added 67 mL, but because the male tapered outlet of the induction port took up the 18-mL volume of the inlet to stage 1, the internal volume of the NGI with its induction port calculates to 1172 mL (67 + 1123 – 18 mL). The corresponding internal volume for the NGI and induction port with its PS is 1904 mL (67 + 1855 – 18 mL). The square root of the sum of the squares of the individual uncertainties was used to estimate the overall uncertainties attributed to these calculated values.
The internal volumes of the three configurations of the ACI (28.3-, 60-, and 90-L/min), when there is a cone on top (no pre-separator), were the same, within the experimental uncertainty (Table 2). At first glance, one might conclude that there is an upward trend (840, 842, and 845 mL). A trend toward greater internal volume might seem logical because of the larger nozzles of the stages in the 60- and 90-L/min configurations [see tables 2-4 and 2-5 of Mitchell and Roberts(12)]. However, the stages removed when converting from the 28.3-L/min configuration to the 60-L/min configuration and then to the 90-L/min configuration possess thinner nozzle plates than those added to the top of the Andersen [see table 1 of Vaughan(14)], an attribute that decreases the available internal volume. Approximate geometric calculations of these two competing factors support the observed result. Given this measure of agreement, it is recommended that each impactor configuration be regarded as having an internal volume of 840 mL. However, the best practice is to retain the separate uncertainty values reported for each configuration (Table 2), because their magnitudes were found to be different for the three configurations.
When the pre-separator components of the ACI take the place of the inlet cone, the internal volume determined for the 28.3-L/min configuration was the same as that measured for the 60-L/min configuration, within experimental error (Table 2). The listed value for the 28.3-L/min configuration is the average of one point from data set A (1017 ± 11 mL) and one point from data set B (1009 ± 8 mL). The fact that these values for the 28.3-L/min configuration from sets A and B agree within experimental error helps corroborate the method, because the ACI components evaluated for these two data sets were different (same design but different serial numbers), and the individual 60-mL syringes used in the P-V measurements were different. The pre-separator inlet passageway for the 28.3-L/min configuration is smaller by 8 mL than the inlet passageway for the 60-L/min configuration (Appendix A2). However, the addition of stage −1 and removal of stage 7 (the change from 28.3-L/min configuration to the 60-L/min configuration) decreases the internal volume by less than 10 mL [estimated from Mitchell and Roberts,(12) as noted earlier]. Consequently, geometric considerations support the observation that these two configurations have the same internal volume, within the experimental accuracy.
The 90-L/min configuration with its pre-separator was ∼40 mL larger in internal volume compared with the other two configurations (Table 2). A major portion of this difference can be attributed to the larger internal volume of the pre-separator inlet passageway (∼30 mL larger; Appendix A2). The internal volume of the bottom half of the 90-L/min pre-separator is also slightly larger than that of the 60- or 28.3-L/min version to accommodate the larger dimensions of the 90-L/min inlet component. Finally, the 90-L/min ACI stack was estimated to contain about the same internal volume as the other two configurations. Overall, however, geometric considerations indicate that the 40-mL larger volume of the 90-L/min configuration determined by the P-V method is reasonably accurate.
Care is needed when interpreting the data contained in Table 2. First, there are three entries where internal volume values are presented for the ACI alone. These impactors, by design, have an entrance cone on top of the stack of size-fractionating stages [fig. 6 and 6b of USP chapter <601>(2)]; this cone is removed when the pre-separator is placed on top of the impactor. Therefore, it would be incorrect to subtract the internal volume of the ACI from the internal volume of the ACI with pre-separator and designate the resulting value “the pre-separator volume.” For this reason, no value for “the pre-separator” is given in Table 2. Such a subtraction was the basis of the volume for the pre-separator of the ACI reported by Copley et al.,(10) causing a misleading estimate of the pre-separator volume for this impactor.
Second, the USP/PhEur induction port(2) that fits onto the ACI contains ∼9.5 mL of volume in the space that fits onto the ACI [fig. 6a of USP chapter <601>(2); also segment 7 in Appendix Fig. A2]. However, it is important to note that this volume is not available during an inhaler test. Hence, Table 2 reports only 67 mL for the internal volume of the induction port, and only this volume is added to the calculated volumes of the ACI component groups.
Finally, the entire internal volume of a test system, including the inhaler device itself and the tubing and equipment that connects the impactor components to the vacuum source, should be included in any assessment of the entire system internal volume, for example, to evaluate the effect of apparatus internal volume on the rise time to target flow rate in the context of DPI testing. However, since the magnitudes of these additional volumes are user specific, they have not been included in this study.
Conclusion
The present forensic investigation has provided a definitive set of accurate and precise measures of inhaler aerosol APSD apparatus internal volumes. Water displacement (“water fill method”) was used to determine the internal volume of the USP/PhEur induction port and to test the quality of the P-V data (NGI with and without pre-separator). The progressive increase in the internal volume of a closed system by syringe plunger movement (P-V method) was used to measure the more complex corresponding volumes associated with the NGI, both with and without pre-separator, and also for various configurations of the ACI, also with and without pre-separator. A variety of geometric considerations, especially for the induction port, provide reasonable support for the observed experimental results. The data reported herein can be used to define the internal volumes of the various sampling systems described in the pharmacopeial compendia to determine inhaler aerosol APSD that include either cascade impactor design.
Footnotes
Acknowledgments
This work was undertaken as part of a plan of work being coordinated by the Impactor Sub-Team of the European Pharmaceutical Aerosol Group (EPAG).
Author Disclosure Statement
D.L.R., J.P.M., and F.C. are private consultants to the inhaler industry with no ownership or financial relationship regarding any of the apparatuses described herein. M.C. is the owner and CEO of Copley Scientific Ltd. (Nottingham, United Kingdom), a manufacturer and distributor of these apparatuses.
Funding Information
No funding was received for this article.
Appendix
Reviewed by:
Keith Ung
Anthony Hickey