
Abstract
Objective:
This study aims to identify unique characteristics of depression based on Gas Discharge Visualization (GDV) technology.
Methods:
A total of 120 participants with depressive symptoms (Group A) and 56 healthy controls (Group B) were assessed using GDV technology to identify energy value differences. Statistical analysis identified specific markers useful in confirming a diagnosis of depression.
Results:
Group A showed significantly lower energy values than Group B in all systems except the respiratory and urogenital systems (p < 0.05). Conversely, higher energy values were observed in the respiratory system’s throat, larynx, and trachea in Group A (p < 0.05). Within Group A, the lowest energy values were in the head, cardiovascular, and immune systems (p < 0.01), while the highest were in the respiratory and urogenital systems (p < 0.01). In the head, energy values were lower in the eyes (p < 0.05). Within the endocrine system, the thyroid showed the highest energy, and the epiphysis the lowest (p < 0.05). The transverse colon and duodenum exhibited the lowest energy in the digestive system (p < 0.001). The spine-lumbar zone and kidneys showed lower energy in their respective systems (p < 0.001). The throat, larynx, and trachea displayed the highest energy in the respiratory system (p < 0.001).
Conclusion:
GDV technology can be utilized for the auxiliary diagnosis of depression: Energy values are the lowest in the head, cardiovascular, and immune systems, and highest in the respiratory and urogenital systems. Lower energy values in the eyes within the head, with the thyroid and epiphysis marking the highest and lowest energy values in the endocrine system. The sacrum and the kidneys exhibited lower energy values within their respective systems, the transverse colon and duodenum had the lowest energy values within the digestive system. The throat, larynx, and trachea showed the highest energy values within the respiratory system.
Introduction
Depression, a common yet serious mental disorder, is characterized by persistent low mood, sadness, or feelings of helplessness. It also involves a loss of interest and pleasure in everyday activities, often accompanied by severe self-devaluation. 1 The global prevalence of depression is increasing, with current estimates suggesting that approximately 340 million people worldwide are affected. 2 Nevertheless, the rate at which individuals seek medical advice for depression is notably low. In China, for example, fewer than 10% of those affected pursue medical consultation. 3 This issue is exacerbated by high rates of misdiagnosis and missed diagnoses, 4 partly due to the lack of objective, predictive, and specific indicators for diagnosing depression.
According to the Chinese Classification of Mental Disorders, Third Edition (CCMD-3), depression is characterized by the following ten symptoms: (1) low mood; (2) loss of interest or pleasure; (3) decreased energy or fatigue; (4) psychomotor retardation or agitation; (5) low self-esteem, self-reproach, or feelings of guilt; (6) difficulty in concentrating or perceived decreased thinking ability; (7) recurrent thoughts of death or suicidal ideation, or behavior; (8) sleep disturbances, such as insomnia, early morning awakening, or hypersomnia; (9) reduced appetite or significant weight loss; (10) decreased sexual desire. If an individual experiencing persistent low mood exhibits four or more symptoms, including impaired social functioning that persists for over 2 weeks, and if conditions such as organic mental disorders or substance dependence have been excluded, a diagnosis of depression may be considered. 5
In diagnosing depression, clinicians typically employ interviews, questionnaires, and objective imaging tests to collect data from individuals suspected of having the disorder. The assessment includes a thorough evaluation of the individual’s personal and family history, as well as social and environmental factors. By comparing the symptoms presented with established diagnostic criteria, clinicians can ascertain whether the individual fulfills the diagnostic requirements for depression. 6 Objective diagnostic techniques for depression commonly include electroencephalography (EEG), functional magnetic resonance imaging (fMRI), and combined EEG-fMRI, which are prevalent in clinical settings.7,8 Recently, the diagnostic potential of facial expressions and voice patterns for depression has been increasingly investigated. 9 However, these innovative approaches have not yet become widely adopted in clinical practice.
Although the diagnostic criteria for depression in conventional medicine are quite specific, they are still inherently subjective. Diagnostic approaches that rely on surveys and self-assessment scales necessitate high levels of cooperation from individuals suspected of having depression. Given the typically fragile psychological state of these individuals, their self-reported emotions and behaviors are often subject to distortions by subjective perceptions, memory biases, and cognitive distortions, thus compromising the objectivity of these assessments.10,11 Self-assessment scales may not be suitable for certain populations, such as illiterate individuals. 12 Furthermore, cultural differences significantly affect the expression of emotions and psychological distress. 13 These issues further complicate the accurate diagnosis of depression. Although imaging studies mitigate subjective bias, their effectiveness is limited as they often detect functional abnormalities only at advanced stages, which is particularly problematic during the prodromal and initial stages of depression when subtle organic changes are not pronounced enough for detection by standard clinical diagnostic techniques. 14 These limitations can lead to misdiagnoses or missed diagnoses of depression in clinical settings. Therefore, it is crucial to develop objective, specific, and real-time diagnostic techniques for depression.
Gas Discharge Visualization (GDV) technology, which is grounded in biophysics and utilizes the principles of the photoelectric effect, is employed to observe and analyze the human energy field. 15 This technology uses specialized sensors and software to scan the fingertips, producing images that are subsequently processed through specific algorithms. These algorithms convert the images into data that provide an assessment of an individual’s health status. By analyzing deviations from normal data patterns, it is possible to gain insights into the individual’s health condition. 16
GDV data characteristics can distinguish deviations between diseased and healthy states in both physiological and psychological conditions.17–21 This technology detects energy changes at early stages of diseases, 17 aiding clinicians in early diagnosis. Its high sensitivity allows it to detect even minor changes in body energy.22,23 In addition, GDV technology provides real-time feedback, enabling rapid assessments of patient status before and after treatment, which is crucial for conducting clinical control studies. 24
The analysis of the energy field with GDV technology demonstrates three main characteristics: Objectivity: GDV technology processes and presents results as images and data via complex algorithms after testing is complete. Real-time capability: The straightforward testing method allows for the immediate generation of reports on various body indices. Predictive nature: GDV technology can detect subtle changes in the body’s energy at the early stages of diseases, thereby informing further diagnostic and treatment strategies. This study leverages these characteristics of GDV technology to identify unique data features associated with depression, aiming to provide robust data support for objective, early, and real-time diagnosis of depression.
Methods
Experimental section
The Institutional Review Board approval
Institutional Review Board approval for consent, based on the Declaration of Helsinki as revised in 2013, was granted by the Medical Ethics Committee of the Beijing University of Chinese Medicine and the Fourth People’s Hospital of Liaocheng. Participants were informed that the study results might be published in medical books or journals and used for educational purposes. They were asked to sign a consent form, which emphasized that their participation was voluntary and that they could withdraw at any time.
Research objective
To identify the unique characteristics of depression with the assistance of GDV technology.
Study subjects
Group A: Depressive symptom cohort. This group includes individuals who are officially diagnosed with depression and those who display symptoms consistent with the diagnostic criteria for depression as outlined in the CCMD-3 but have not been officially diagnosed. The selection of target samples is based on the predictive nature of GDV technology.
Group B: Healthy control group.
Inclusion and exclusion criteria
Inclusion criteria
Group A: Participants must meet the following inclusion criteria: (1) diagnosed with depression according to the diagnostic criteria outlined in the CCMD-3; (2) aged 18 years or older; (3) gender unspecified; (4) willing to cooperate with the research requirements.
Group B: Participants must meet the following criteria: (1) aged 18 years or older; (2) gender unspecified; (3) no significant psychological distress or only occasional, mild psychological symptoms that can be self-managed within two weeks.; (4) willing to cooperate with the research requirements.
Exclusion criteria
Participants diagnosed with other mental disorders or severe physical illnesses are excluded.
Participants with pacemakers are excluded.
Participants with fingertip defects are excluded.
Participants who are menstruating, pregnant, or breastfeeding are excluded.
Research instruments
Bio-well GDV device:
Specific Operating Procedures: Data collection is performed using the Bio-well GDV device, which scans the fingertips of all 10 fingers of each participant sequentially. This process captures the energy values from each finger, with energy measured in Joules (J). The analysis software version 6.0.7.27, included with the Bio-well GDV device, is used to analyze the data collected from the fingertips.
Research duration
The study was conducted from February 20, 2024, to March 30, 2024, covering a total period of approximately 6 weeks.
Research locations
Group A: The Fourth People’s Hospital of Liaocheng.
Group B: Beijing University of Chinese Medicine.
Indicators
Energy values, across “nine systems” (head, cardiovascular, respiratory, endocrine, musculoskeletal, digestive, urogenital, nervous, and immune systems) and their respective sub-zones.
Research method
Using GDV technology, energy values will be collected from Groups A and B. Inter-group comparisons will identify any statistically significant differences between the groups. If such differences are found, further intra-group comparisons will be conducted to elucidate the distinct data characteristics within each group. These unique characteristics constitute the specific markers for diagnosing depression with GDV technology.
Statistical methods
Energy values obtained from Groups A and B using GDV will be analyzed with SPSS software, version 27.0. Statistical methods, including non-parametric tests and the Holmes-Bonferroni method, will be used to identify unique characteristics for the auxiliary diagnosis of depression. Non-parametric tests will be employed when comparing only two groups, while the Holmes-Bonferroni method will be applied for multiple-group comparisons. A p-value of less than 0.05 will be considered statistically significant.
Results
This research included a total of 176 participants, with 120 individuals in Group A and 56 in Group B.
Energy values across nine systems in Groups A and B
Inter-group comparisons were conducted between Groups A and B. Statistically significant differences in energy values were observed in the cardiovascular, endocrine, musculoskeletal, digestive, nervous, immune systems, and the head (p < 0.001, p < 0.05), with Group A consistently showing lower energy values than Group B. Results are shown in Table 1.
Multiple Comparisons of Energy Values across “Nine Systems” in Groups A and B (Mean ± SD [J], F Values, and p-Values)
Due to the violation of the sphericity assumption, the repeated measures ANOVA was adjusted using the Greenhouse-Geisser correction.
Indicates a comparison with head, p < 0.05.
Indicates a comparison with cardiovascular system, p < 0.05.
Indicates a comparison with respiratory system, p < 0.05.
Indicates a comparison with endocrine system, p < 0.05.
Indicates a comparison with musculoskeletal system, p < 0.05.
Indicates a comparison with digestive system, p < 0.05.
Indicates a comparison with urogenital system, p < 0.05.
Indicates a comparison with nervous system, p < 0.05.
Indicates a comparison with immune system, p < 0.05.
Inter-zone comparisons were conducted separately for the nine systems in both Group A and Group B. The results indicate no statistically significant differences in energy values in Group A between the head and both the cardiovascular and immune systems (p > 0.05). However, when compared to other systems, both the head, cardiovascular system, and immune system showed significant differences, with statistical significance (p < 0.001, p < 0.01), and they displayed the lowest energy values among the nine systems in Group A. The respiratory and urogenital systems showed no statistical differences between each other (p > 0.05). However, they exhibited significant differences when compared to other systems, demonstrating statistical significance (p < 0.001, p < 0.01). Moreover, the two systems displayed the highest energy values among the nine systems in Group A. The remaining systems in Group A had intermediate energy values. In Group B, the results indicate no statistically significant differences between the head and both the cardiovascular and immune systems (p > 0.05). However, there was no specific system or combination of systems that exhibited either the highest or the lowest energy values among the nine systems. The results are shown in Figure 1.

Column graph showing energy values across the nine systems.
Energy values of the head in Groups A and B
The head comprises four zones: the eyes; ears, nose, and maxillary sinuses; jaw and teeth; and the cerebral zone (cortex). Inter-group comparisons were conducted between Groups A and B. The results showed that in all four zones, the energy values of Group A were significantly lower than those of Group B (p < 0.001, p < 0.01). The results are shown in Table 2.
Multiple Comparisons of Energy Values Across Zones in “Head” of Groups A and B (Mean ± SD [J], F Values, and p-Values)
Due to the violation of the sphericity assumption, the repeated measures ANOVA was adjusted using the Greenhouse-Geisser correction.
Indicates a comparison with eyes, p < 0.05.
Indicates a comparison with “ears, nose, maxillary sinuses”, p < 0.05.
Indicates a comparison with “jaw, teeth”, p < 0.05.
Indicates a comparison with cerebral zone (cortex), p < 0.05.
Inter-zone comparisons were conducted separately for the four zones in Groups A and B. In Group A, the results indicated that multiple comparisons among the four zones revealed statistically significant differences between each zone and the others (p < 0.001, p < 0.05). In Group B, the results indicated that the energy values in the jaw and teeth were significantly higher than in the other three zones, and those in the cerebral zone (cortex) were significantly lower, with all comparisons showing statistical significance (p < 0.001, p < 0.01

Column graph showing energy values for each zone of the head.
Energy values of the cardiovascular system in Groups A and B
The cardiovascular system comprises four zones: the cardiovascular zone, the heart, the cerebral zone (vessels), and the coronary vessels. Inter-group comparisons were conducted between Groups A and B. The results indicated that significant differences were observed in all four zones, with statistical significance (p < 0.001), and the energy values in Group A were significantly lower than those in Group B. The results are shown in Table 3.
Multiple Comparisons of Energy Values across Zones in Cardiovascular System of Groups A and B (Mean ± SD [J], F Values, and p-Values)
Due to the violation of the sphericity assumption, the repeated measures ANOVA was adjusted using the Greenhouse-Geisser correction.
Indicates a comparison with cardiovascular, p < 0.05.
Indicates a comparison with heart, p < 0.05.
Indicates a comparison with cerebral zone (vessels), p < 0.05.
Indicates a comparison with coronary vessels, p < 0.05.
Inter-zone comparisons were conducted separately for the four zones in Groups A and B. The results showed that in both groups, the energy values in the cardiovascular zone were the highest, significantly higher than the other three zones, with statistically significant differences (p < 0.001). The results are shown in Figure 3.

Column graph showing energy values for each zone of the cardiovascular system.
Energy values of the respiratory system in Groups A and B
The respiratory system comprises four zones: the throat, larynx, and trachea; the mammary glands; and the thorax zone. Inter-group comparisons were conducted between Groups A and B. The results indicate that in the “throat, larynx, trachea,” the energy values for Group A were significantly higher than those for Group B, with statistically significant differences (p < 0.05). In the thorax, the energy values for Group A were significantly lower than those for Group B, with statistically significant differences (p < 0.001). The results are shown in Table 4.
Multiple Comparisons of Energy Values across Zones in Respiratory System of Groups A and B (Mean ± SD [J], F Values, and p-Values)
Indicates a comparison with “throat, larynx, trachea”, p < 0.05.
Indicates a comparison with mammary gland, p < 0.05.
Indicates a comparison with thorax, p < 0.05.
Inter-zone comparisons were conducted separately for the three zones in Groups A and B. The results indicate that in both groups, multiple comparisons among the three zones revealed statistically significant differences between each pair of zones. In Group A, all zones differed significantly (p < 0.001), and in Group B, the same significant differences were observed (p < 0.001, p < 0.05). In both Groups A and B, the energy values in the thorax were significantly lower than in the other two zones (p < 0.001). In Group A, the “throat, larynx, trachea” had the highest values, with all differences statistically significant (p < 0.001, p < 0.05). Conversely, in Group B, the energy values of the “throat, larynx, trachea” were lower than the mammary gland (p < 0.05). The results are shown in Figure 4.

Column graph showing energy values for each zone of the respiratory system.
Energy values of the endocrine system in Groups A and B
The endocrine system comprises seven zones: the hypothalamus, the epiphysis, the pituitary gland, the thyroid gland, the pancreas, the adrenal glands, and the spleen. Inter-group comparisons were conducted between Groups A and B. The results indicate that in the zones of the hypothalamus, the epiphysis, the pituitary gland, and the spleen, the energy values in Group A were significantly lower than those in Group B with statistically significant differences (p < 0.001). The results are presented in Table 5.
Multiple Comparisons of Energy Values across Zones in Endocrine System of Groups A and B (Mean ± SD [J], F Values, and p-Values)
Due to the violation of the sphericity assumption, the repeated measures ANOVA was adjusted using the Greenhouse-Geisser correction.
Indicates a comparison with hypothalamus, p < 0.05.
Indicates a comparison with epiphysis, p < 0.05.
Indicates a comparison with pituitary gland, p < 0.05.
Indicates a comparison with thyroid gland, p < 0.05.
Indicates a comparison with pancreas, p < 0.05.
Indicates a comparison with adrenal, p < 0.05.
Indicates a comparison with spleen, p < 0.05.
Inter-zone comparisons were conducted for the seven zones in Groups A and B. The results indicate that in Group A, the energy values in the epiphysis were the lowest compared to the other zones, with statistically significant differences (p < 0.001). Conversely, the energy values in the thyroid gland were the highest, showing statistically significant differences when compared to the other zones (p < 0.001, p < 0.05). In Group B, no single zone exhibited the highest or lowest energy values with statistically significant differences when compared to other zones. Instead, the distribution of energy values across the various zones was more uniform. The results are shown in Figure 5.

Column graph showing energy values for each zone of the endocrine system.
Energy values of the musculoskeletal system in Groups A and B
The musculoskeletal system comprises five zones: the spine-cervical zone, the spine-thorax zone, the spine-lumbar zone, the sacrum, and the coccyx, pelvis minor zone. Inter-group comparisons were conducted between Groups A and B. The results indicate that, except for the coccyx, and pelvis minor zone, the energy values in the other four zones in Group A were significantly lower than those in Group B, with statistically significant differences (p < 0.001, p < 0.05). The results are presented in Table 6.
Multiple Comparisons of Energy Values across Zones in Musculoskeletal System of Groups A and B (Mean ± SD [J], F Values, and p-Values)
Due to the violation of the sphericity assumption, the repeated measures ANOVA was adjusted using the Greenhouse-Geisser correction.
Indicates a comparison with spine-cervical zone, p < 0.05.
Indicates a comparison with spine-thorax zone, p < 0.05.
Indicates a comparison with spine-lumbar zone, p < 0.05.
Indicates a comparison with sacrum, p < 0.05.
Indicates a comparison with “coccyx, pelvis minor zone”, p < 0.05.
Inter-zone comparisons were conducted separately for the five zones in Groups A and B. The results show that there were no statistically significant differences between the spine-cervical zone and the spine-thorax zone in both groups (p > 0.05). Similarly, in both groups, the spine-lumbar zone showed significant differences when compared individually to each of the other zones, with each comparison reaching statistical significance (p < 0.001). In Group A, multiple comparisons revealed that the spine-lumbar zone, sacrum and coccyx, and pelvis minor zone each showed statistically significant differences compared to other zones within the group (p < 0.001). In Group B, no statistically significant differences were found between the sacrum and the coccyx, pelvis minor zone (p > 0.05). The results are shown in Figure 6.
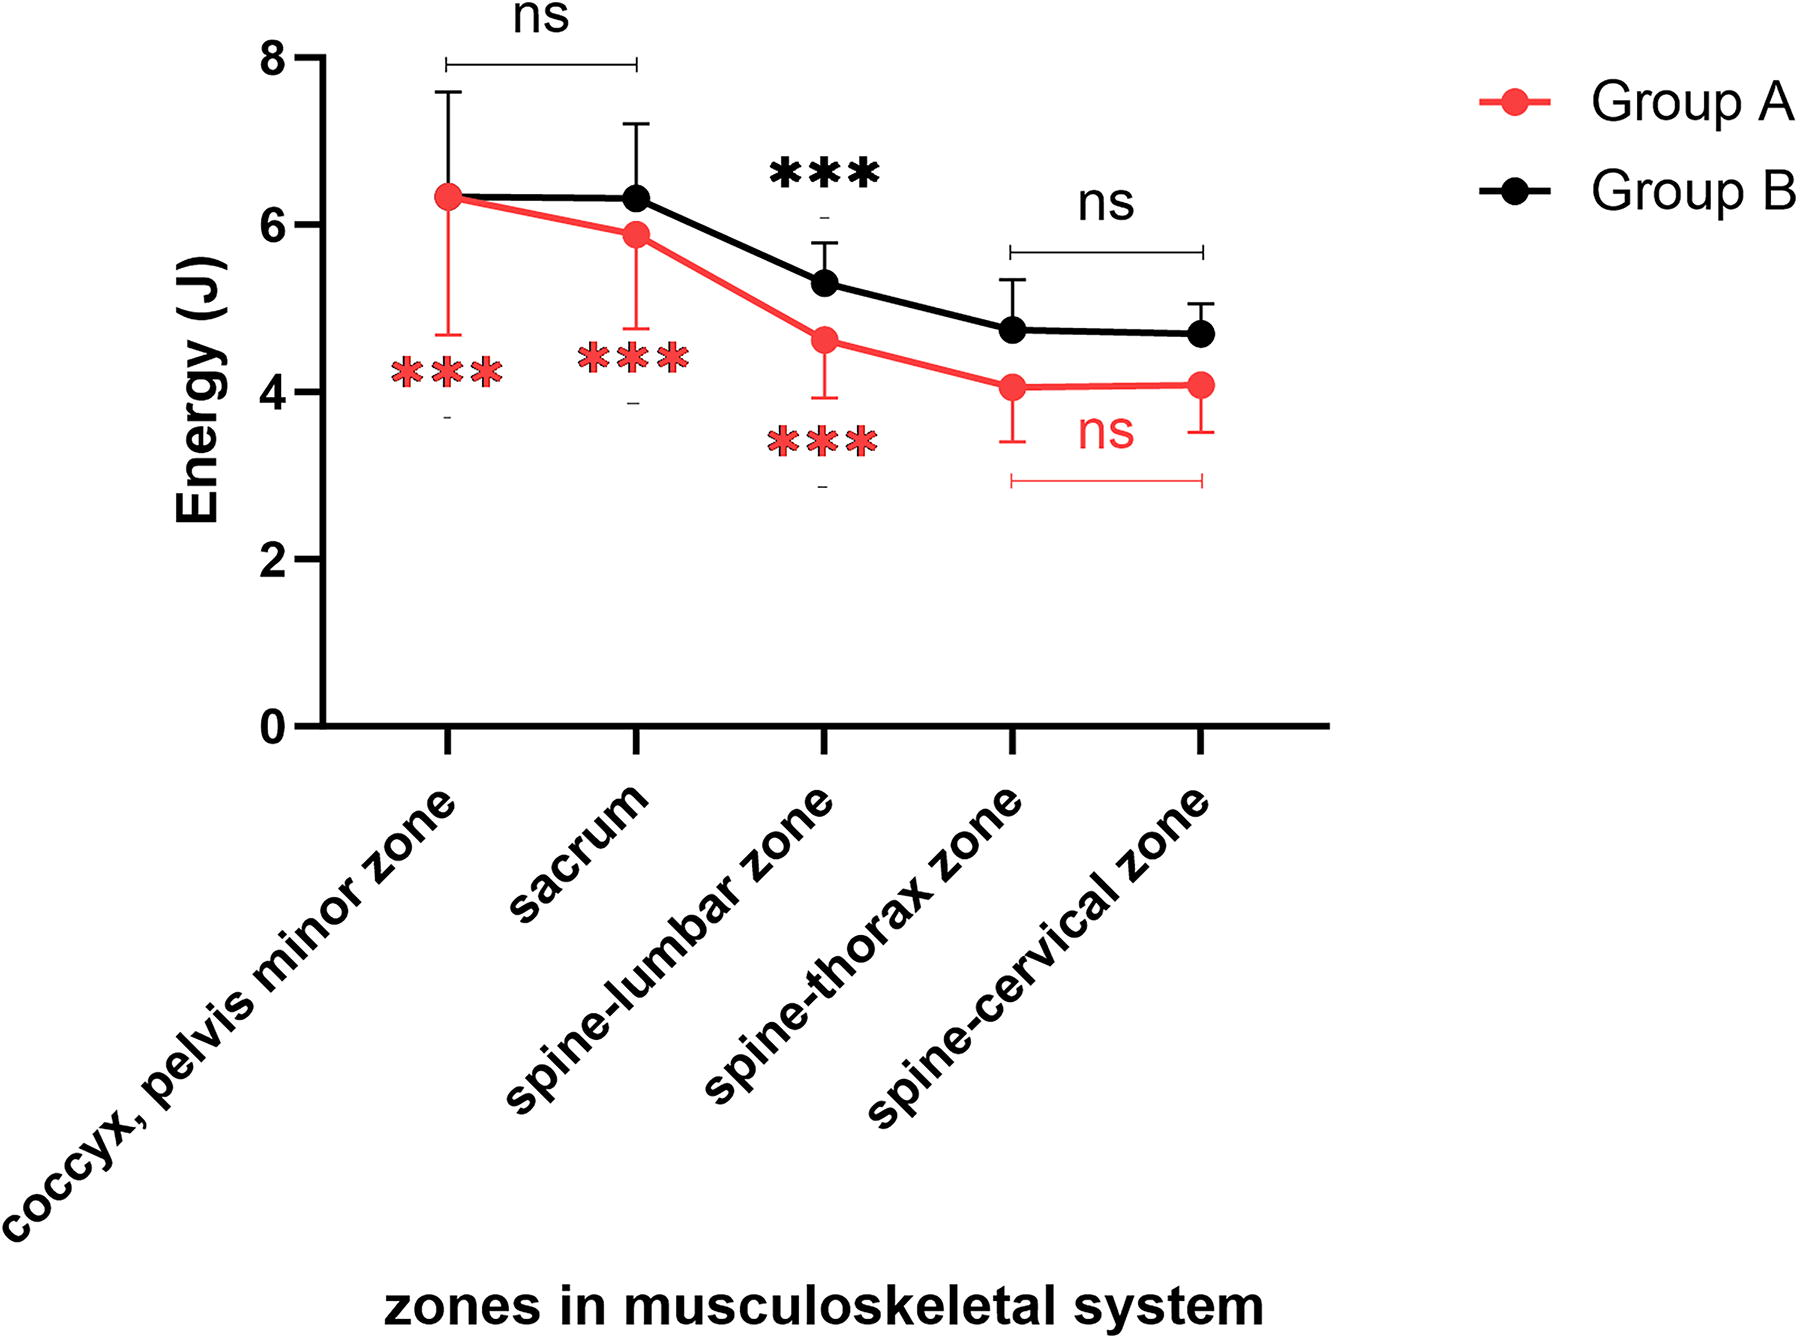
Line graph with markers showing energy values for each zone of the musculoskeletal system.
Energy values of the digestive system in Groups A and B
The digestive system comprises 14 zones: descending colon, sigmoid colon, rectum, blind gut, ascending colon, transverse colon, duodenum, ileum, jejunum, liver, pancreas, spleen, gallbladder, appendix, and abdominal zone. Inter-group comparisons were conducted between Groups A and B. The results indicate that except for the rectum, the blind gut, the jejunum, the liver, and the “pancreas, spleen”, the energy values in the other nine zones in Group A were significantly lower than those in Group B, with statistically significant differences (p < 0.001, p < 0.01, p < 0.05). The results are shown in Table 7.
Multiple Comparisons of Energy Values across Zones in Digestive System of Groups A and B (Mean ± SD [J], F Values, and p-Values)
Due to the violation of the sphericity assumption, the repeated measures ANOVA was adjusted using the Greenhouse-Geisser correction.
Indicates a comparison with descending colon, p < 0.05.
Indicates a comparison with sigmoid colon, p < 0.05.
Indicates a comparison with rectum, p < 0.05.
Indicates a comparison with blind gut, p < 0.05.
Indicates a comparison with ascending colon, p < 0.05.
Indicates a comparison with transverse colon, p < 0.05.
Indicates a comparison with duodenum, p < 0.05.
Indicates a comparison with ileum, p < 0.05.
Indicates a comparison with jejunum, p < 0.05.
Indicates a comparison with liver, p < 0.05.
Indicates a comparison with “Pancreas, spleen”, p < 0.05.
Indicates a comparison with gallbladder, p < 0.05.
Indicates a comparison with appendix, p < 0.05.
Indicates a comparison with abdominal zone, p < 0.05.
Inter-zone comparisons were conducted separately for the 14 zones in Groups A and B. In Group A, the energy values in the transverse colon and duodenum were the lowest, significantly differing from other zones (p < 0.001), yet no significant difference was found between these two zones (p > 0.05). In Group B, no single zone or combination of zones exhibited the highest or lowest energy values with statistically significant differences compared to other zones. The results are shown in Figure 7.
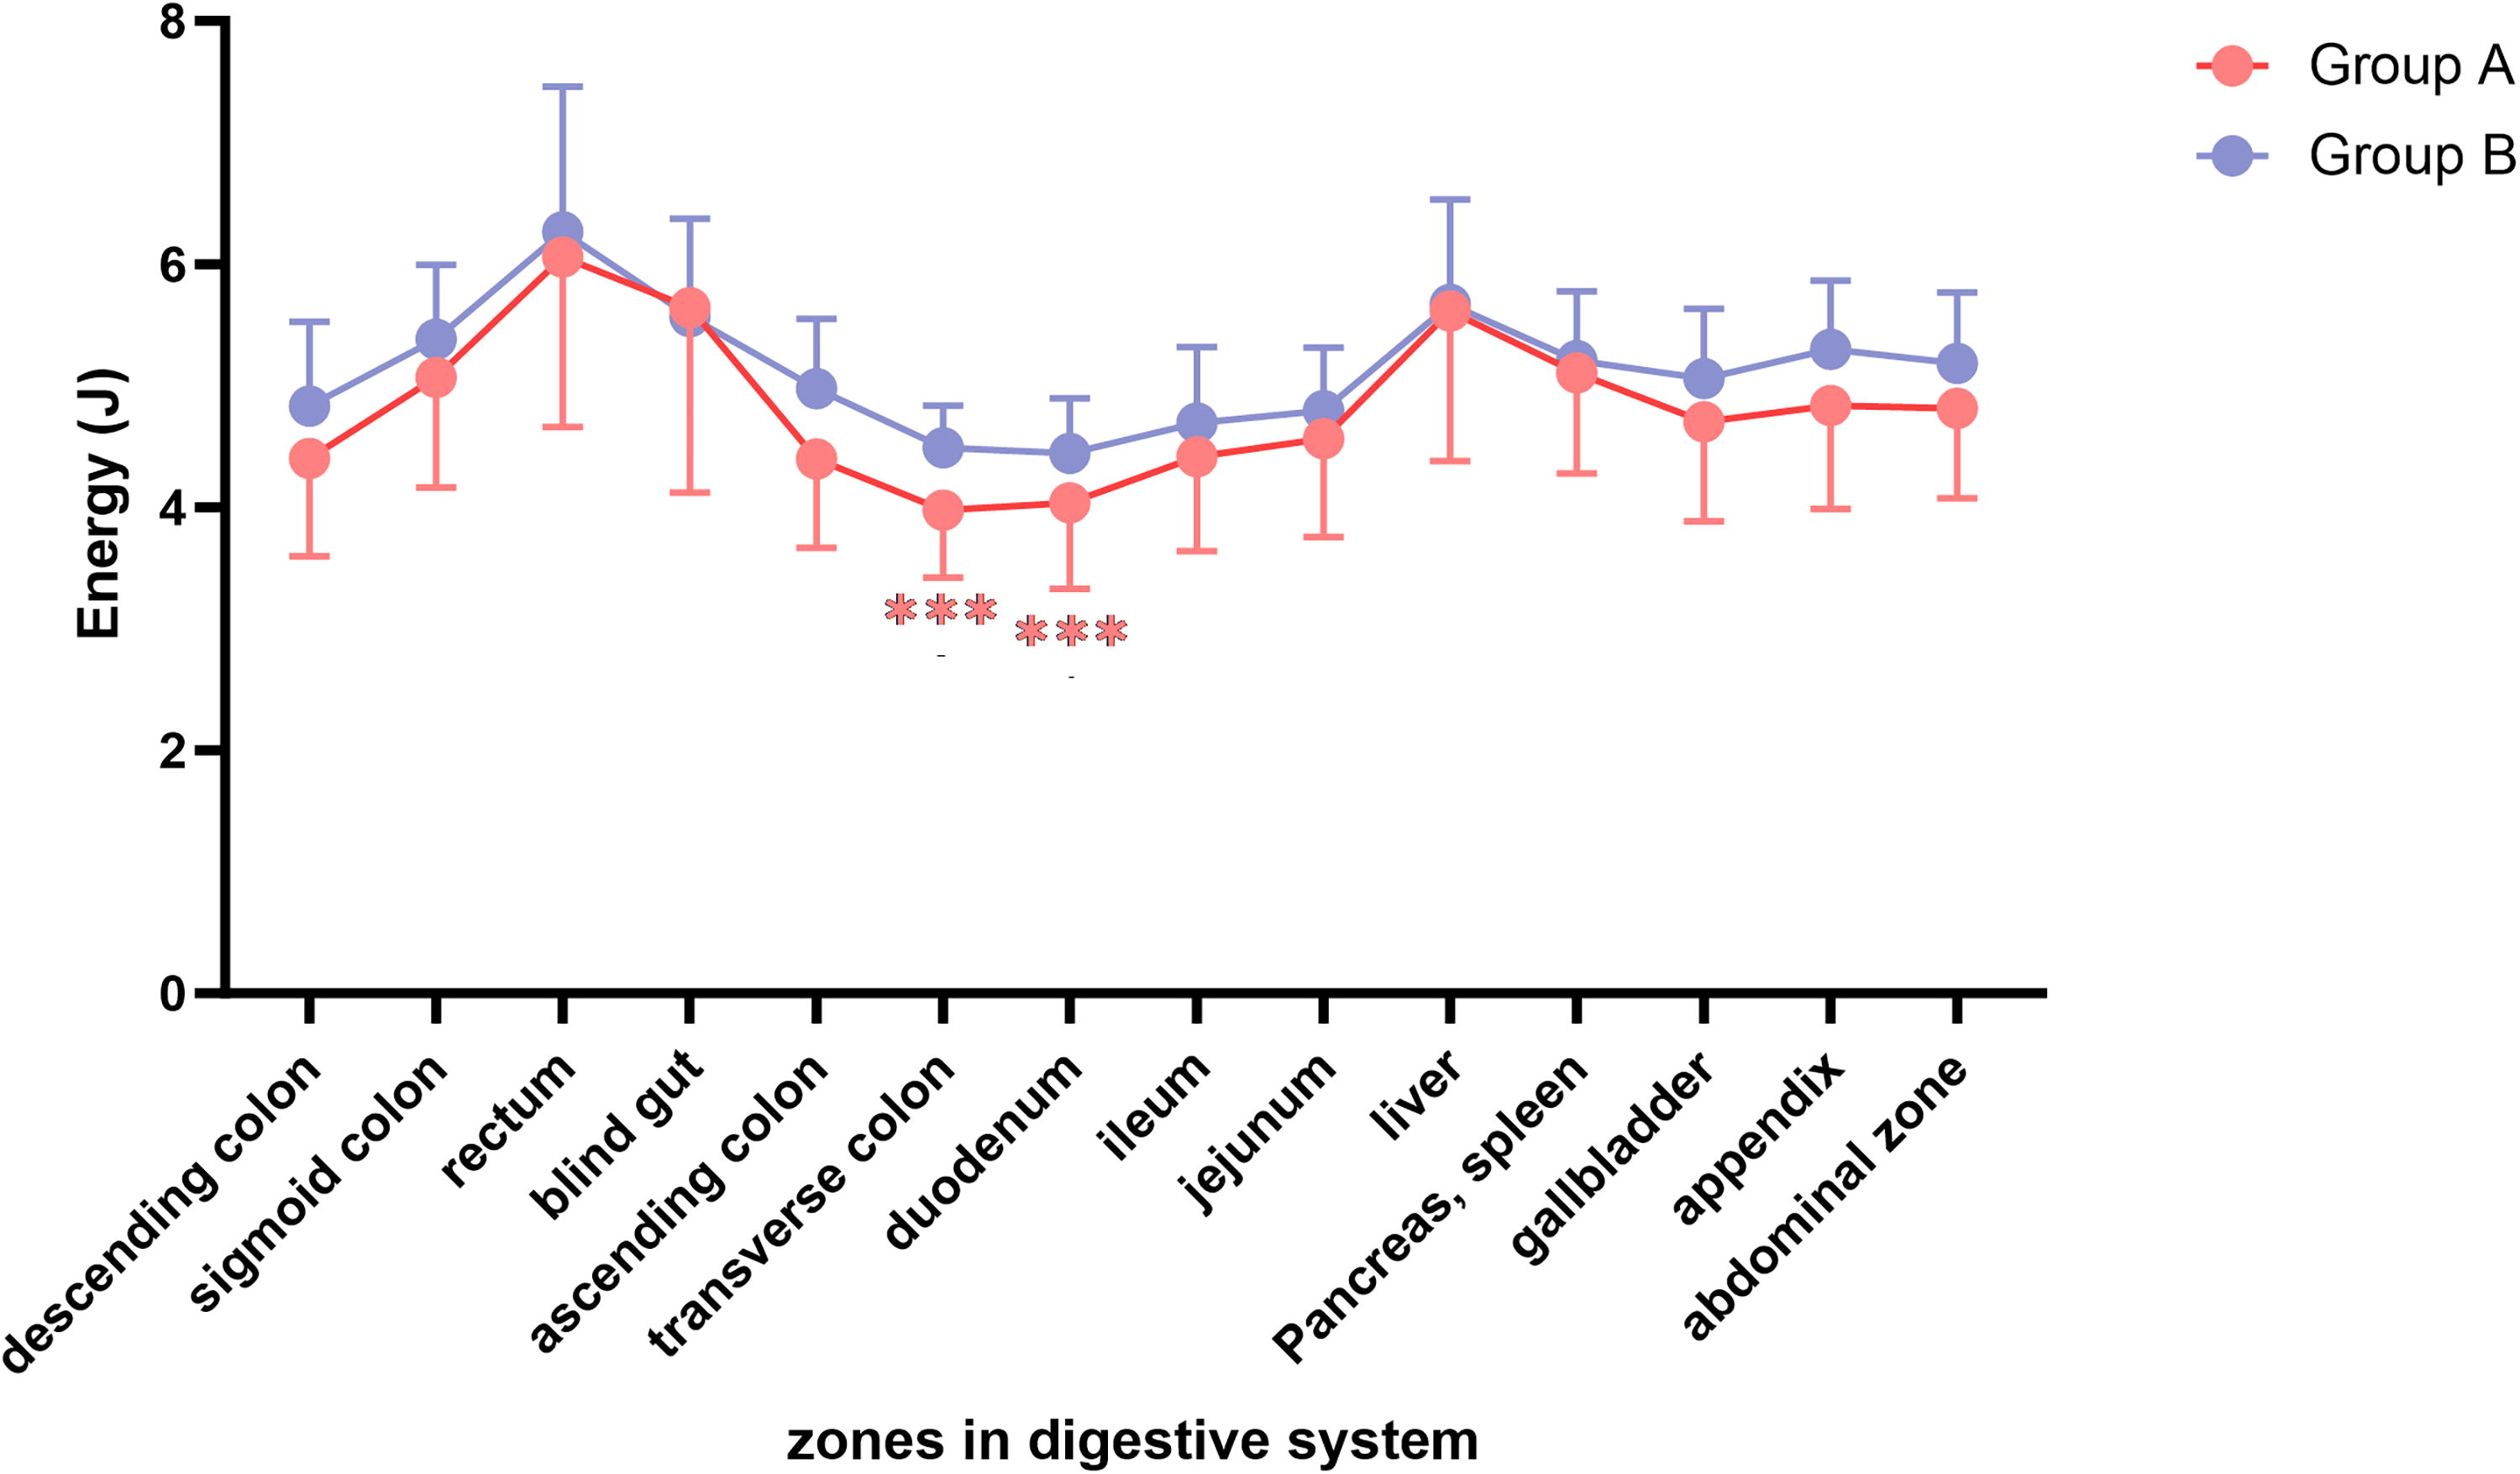
Line graph with markers showing energy values for each zone of the digestive system.
Energy values of the urogenital system in Groups A and B
The male urogenital system comprises three zones: the urogenital, the kidney, and the prostate. The female urogenital system includes only two zones: the urogenital and the kidney, and does not contain the prostate zone. To ensure a complete sample size, this study does not include energy values from the prostate in the statistical analysis. Inter-group comparisons were conducted between Groups A and B. The results indicate that in the urogenital zone, there were no statistically significant differences between Groups A and B (p > 0.05). However, in the kidney zone, significant differences were observed (p < 0.05), with Group A having lower energy values than Group B. The results are shown in Table 8.
Energy Values for Each Zone in the Urogenital System of Groups A and B (Nonparametric Analysis) (Mean ± SD [J], Z Values, and p-Values)
The Mann–Whitney U test was used to compare differences both between groups and among zones within each group.
Inter-zone comparisons were conducted separately for the two zones in Groups A and B. The results show that in Group A, significant differences were observed between the urogenital and the kidney zones (p < 0.01), with the energy values in the kidney being notably lower than those in the urogenital zone. In Group B, no statistically significant differences were found between the urogenital and the kidney zones (p > 0.05). The results are shown in Figure 8.

Column graph showing energy values for each zone of the urogenital system.
This study has some limitations that may impact the interpretation of the results. The small sample size of the healthy control group may not fully represent the broader population. Also, the self-reported health status of participants could omit undiagnosed conditions that influence outcomes. In addition, the medication taken by participants with depressive symptoms may potentially influence the GDV readings. These issues highlight the need for larger, more controlled studies to confirm these findings and broaden their applicability.
Discussion
The depressive symptom cohort (Group A) includes participants with depressive symptoms, while the healthy control group (Group B) consists of healthy participants. Across all zones of the head and cardiovascular system, energy values in the depressive symptom cohort are lower than those in the healthy control group. Similarly, in the respiratory system’s thorax zone, the musculoskeletal system’s spine-cervical zone, the spine-thorax zone, the spine-lumbar zone, and the sacrum, the endocrine system’s hypothalamus, epiphysis, pituitary gland, and spleen, the digestive system’s descending colon, sigmoid colon, transverse colon, ascending colon, appendix, duodenum, ileum, gallbladder, and abdominal zone, the urogenital system’s kidneys, the nervous system, and the immune system, energy values are also lower in the depressive symptom cohort compared to the healthy control group. Conversely, in the respiratory system’s “throat, larynx, trachea” zone, energy values are higher in the depressive symptom cohort. This finding is particularly significant in this study, as the depressive symptom cohort generally exhibits lower energy values overall, yet in the respiratory system’s “throat, larynx, trachea” zone, the energy values are higher than those of the healthy control group. The statistically significant distinctions noted above are derived from inter-group comparisons between the depressive symptom cohort and the healthy control group. Based on these statistically significant distinctions, inter-group comparisons between the depressive symptom cohort and the healthy control group are essential for assessing the risk of depression using GDV technology. In this study, without these comparisons, it would be difficult to confirm an individual’s depression status.
In practical applications of GDV technology for identifying depression, the typical procedure involves independently assessing individuals suspected of depression, thus making inter-group comparisons infeasible. It is crucial, therefore, to conduct intra-group comparisons both within the depressive symptom cohort and healthy control group, as well as inter-zone comparisons within each group, to identify unique characteristics of the depressive symptom cohort, particularly traits not present in healthy control group. Consequently, even without inter-group comparisons to healthy individuals, the risk of depression can be confirmed based solely on unique characteristics observed within the symptomatic individuals.
In this study, inter-zone comparisons were conducted separately within the depressive symptom cohort and the healthy control group. When comparing various zones within the depressive symptom cohort and the healthy control group, clear similarities and differences in data characteristics are observed within each group. Notably, it is these distinct differences that are crucial in distinguishing the depressive symptom cohort from the healthy control group.
Energy distribution exhibits both similarities and differences between the depressive symptom cohort and the healthy control group. In the head, the highest energy values are consistently observed in the jaw and teeth zone for both groups. However, significant differences emerge in other zones: in the healthy control group, energy values in the eyes, the “ears, nose, and maxillary sinuses” are substantially higher than those in the cerebral zone (cortex). Conversely, in the depressive symptom cohort, energy levels in these areas, including the cerebral zone, are lower. Thus, the most pronounced differences in energy values within the head occur in the eyes and the “ears, nose, and maxillary sinuses”. The difference between the two zones and the cerebral zone (cortex) is reduced, particularly in the eyes zone, which not only shows a decreased difference with the cerebral zone (cortex) but also lower energy values compared to the “ears, nose, and maxillary sinuses” zone. This contrasts with a healthy control group, where there is no significant difference in energy values between the eyes and the “ears, nose, and maxillary sinuses” zones. In addition, another consistency is observed in the cardiovascular, where energy distribution trends are similar across all zones between the depressive symptom cohort and the healthy control group.
Differences in energy distribution between the depressive symptom cohort and the healthy control group are notably pronounced across various zones within specific systems. In the depressive symptom cohort, the energy value of the “throat, larynx, and trachea” zone in the respiratory system is the highest among the three zones. In contrast, within the healthy control group, the energy value of the “throat, larynx, and trachea” zone is intermediate among the three zones. In the depressive symptom cohort, within the endocrine system, the thyroid has the highest energy values, while the pineal gland has the lowest. Likewise, the transverse colon and duodenum in the digestive system and the kidney in the urogenital system exhibit the lowest energy levels. These unique energy profiles are absent in the healthy control group. In addition, in the musculoskeletal system, both the healthy control group and the depressive symptom cohort exhibit a general decrease in energy values along the spine from bottom to top. However, the rate of decrease is significantly faster in the depressive symptom cohort, highlighting a key difference between the two groups.
In summary, the depressive symptom cohort exhibits distinct energy distribution characteristics across various systems, which are unique to this group and not observed in the healthy control group. Therefore, the presence of these specific features in individuals suspected of having depression, when assessed using GDV technology, can confirm the diagnosis independently of comparisons with healthy controls. This approach allows for a direct assessment based on the unique data characteristics of the individuals suspected of depression, thereby streamlining the diagnostic process.
Conclusions
GDV technology can be utilized for the auxiliary diagnosis of depression: Energy values are the lowest in the head and cardiovascular systems and immune system, and highest in the respiratory and urogenital systems. Lower energy values were observed in the eyes within the head, with the thyroid and epiphysis showing the highest and lowest energy values in the endocrine system, respectively. The sacrum and the kidneys exhibited lower energy values within their respective systems, while the transverse colon and duodenum had the lowest energy values within the digestive system. Conversely, the throat, larynx, and trachea showed the highest energy values within the respiratory system.
Footnotes
Acknowledgment
The authors thank the participants for providing all the information.
Institutional Review Board Statement
The present study has successfully undergone ethical review by the Medical Ethics Committee of Beijing University of Chinese Medicine and the Fourth People’s Hospital of Liaocheng and has obtained ethical approval.
Informed Consent Statement
Written informed consent has been obtained from the participants for both the initial and revised versions of this article, allowing its publication.
Authors’ Contributions
G.F.: conceptualization, methodology, formal analysis, data curation, and writing—original draft. L.L.: project administration, writing—review, editing. H.Q.: investigation resources, supervision, validation. All the authors have accepted responsibility for the entire content of this article and approved submission.
Author Disclosure Statement
The authors declare no conflict of interest related to this article.
Funding Information
There was no funding for the preparation of this case report.
Abbreviations Used
References
Supplementary Material
Please find the following supplemental material available below.
For Open Access articles published under a Creative Commons License, all supplemental material carries the same license as the article it is associated with.
For non-Open Access articles published, all supplemental material carries a non-exclusive license, and permission requests for re-use of supplemental material or any part of supplemental material shall be sent directly to the copyright owner as specified in the copyright notice associated with the article.