
Abstract
Recombinant adeno-associated viruses (AAVs) are clinically relevant vectors for gene therapy that persist largely as extrachromosomal episomes but also infrequently integrate into host genomes. Valoctocogene roxaparvovec is an approved AAV-based gene therapy for severe hemophilia A. We present a molecular characterization of the vector integration profiles in 5 human biopsy samples from valoctocogene roxaparvovec clinical trials as well as in samples from valoctocogene roxaparvovec–treated nonhuman primates (NHPs). The number of genomic integrations was substantially below the previously reported number of transgene-expressing cells, and integration profiles were similar between human and NHP samples. The integration profiles were polyclonal, similarly distributed across the genome, and demonstrated a small bias toward regions of open chromatin and actively transcribed genes, with no relative enrichment in cancer-associated genes. These observations were replicated between species and support the concept that preclinical assessment of AAV vector integration in NHPs is representative of outcomes in humans.
INTRODUCTION
Adeno-associated virus (AAV) vectors persist as stable, nonintegrated episomes that support long-term gene expression. 1 –3 However, a minor fraction of vector copies integrate into the host genome, as previously described in rodents, 4 –7 dogs, 8 nonhuman primates (NHPs), 9,10 and humans. 9,11,12 Gene therapy trials with integrating γ-retroviral vectors were associated with severe adverse events such as leukemia, 13 –19 but AAV vectors have demonstrated an improved safety profile. 4,9,11,20
Hemophilia A is a bleeding disorder caused by a deficiency of coagulation factor VIII (FVIII) protein 21 with a prevalence of 17.1 cases per 100,000 males. 22 Valoctocogene roxaparvovec is an AAV serotype 5–based gene therapy with a liver-selective promoter and human FVIII-SQ transgene 23,24 approved for the treatment of severe hemophilia A (FVIII <1 IU/dL) 21 in Europe 25 and the United States. 26
For the first time, we present data using target enrichment sequencing (TES) to describe vector integration profiles in liver biopsy samples from 5 humans after infusion of an approved AAV-based gene therapy (valoctocogene roxaparvovec) and compare them with the integration profiles of samples from 12 NHPs. One liver biopsy was collected from each human between 0.5 and 4.12 years postgene therapy, offering insights into the vector integration profiles after gene therapy over a multiyear time period. The observed integration frequency can also be compared to the fraction of transgene-expressing cells in the same biopsies, 27 providing insight into whether successful AAV gene therapy is driven by integrated or episomal transgene expression.
MATERIALS AND METHODS
Liver needle biopsy samples were obtained from 5 participants in 3 different clinical trials, 0.5–4.12 years after receiving 4 × 10¹³ vector genomes (vg)/kg (1 participant) or 6 × 10¹³ vg/kg (4 participants) valoctocogene roxaparvovec (Supplementary Table S1; Supplementary Data S1). Male cynomolgus monkeys (NHPs) received 0, 2 × 10¹³, or 6 × 10¹³ vg/kg valoctocogene roxaparvovec via intravenous injection, and liver samples were collected at sacrifice at 13 or 26 weeks postdose (Supplementary Table S2; Supplementary Data S1). DNA was extracted from liver needle biopsies (humans) or left medial lobe (NHPs) and divided into 3 technical replicates. ProtaGene CGT GmbH was contracted by
For the Polyclonal–Monoclonal Distance (PMD) tool analysis, the properties of Rényi’s entropies were used to construct a clonality plane based on 2 measures of diversity: richness and evenness. Richness is the logarithm of total IS present within a sample, and evenness is the rarity of the most common IS within that sample.
RNA sequencing for all samples was performed by Azenta Life Sciences. The assay for transposase-accessible chromatin with sequencing (ATAC-seq) analysis for NHP samples was performed by Quick Biology Inc. Previously published human liver ATAC-seq results were accessed through the Gene Expression Omnibus accession number GSE164942, and human liver gene expression results were obtained from the GTEx project 2017 median tissue transcripts per million dataset. 30
To assess statistical significance for the quantity and proximity of IS to genomic features such as transcription start sites (TSS) and regions of open chromatin, the total number of IS detected per sample was then used in 10,000 independent simulations to randomly and uniformly distribute the IS across the genome. For each simulation, the IS found near a genomic feature could then be assessed. Enrichment was calculated as the ratio of the observed fraction of IS and the median value of the simulated distribution; values less than 1 indicate depletion, and values greater than 1 indicate enrichment of IS. One-sided p-values were calculated as 1 minus the percentile of the observed proportion within the simulated distribution. p-Values ≤0.05 were considered statistically significant. The z scores were calculated with the following equation: z = (observed proportion − simulated mean)/simulation standard deviation. Complete details for all methods can be found in the Supplementary Data S1.
RESULTS
IS frequency
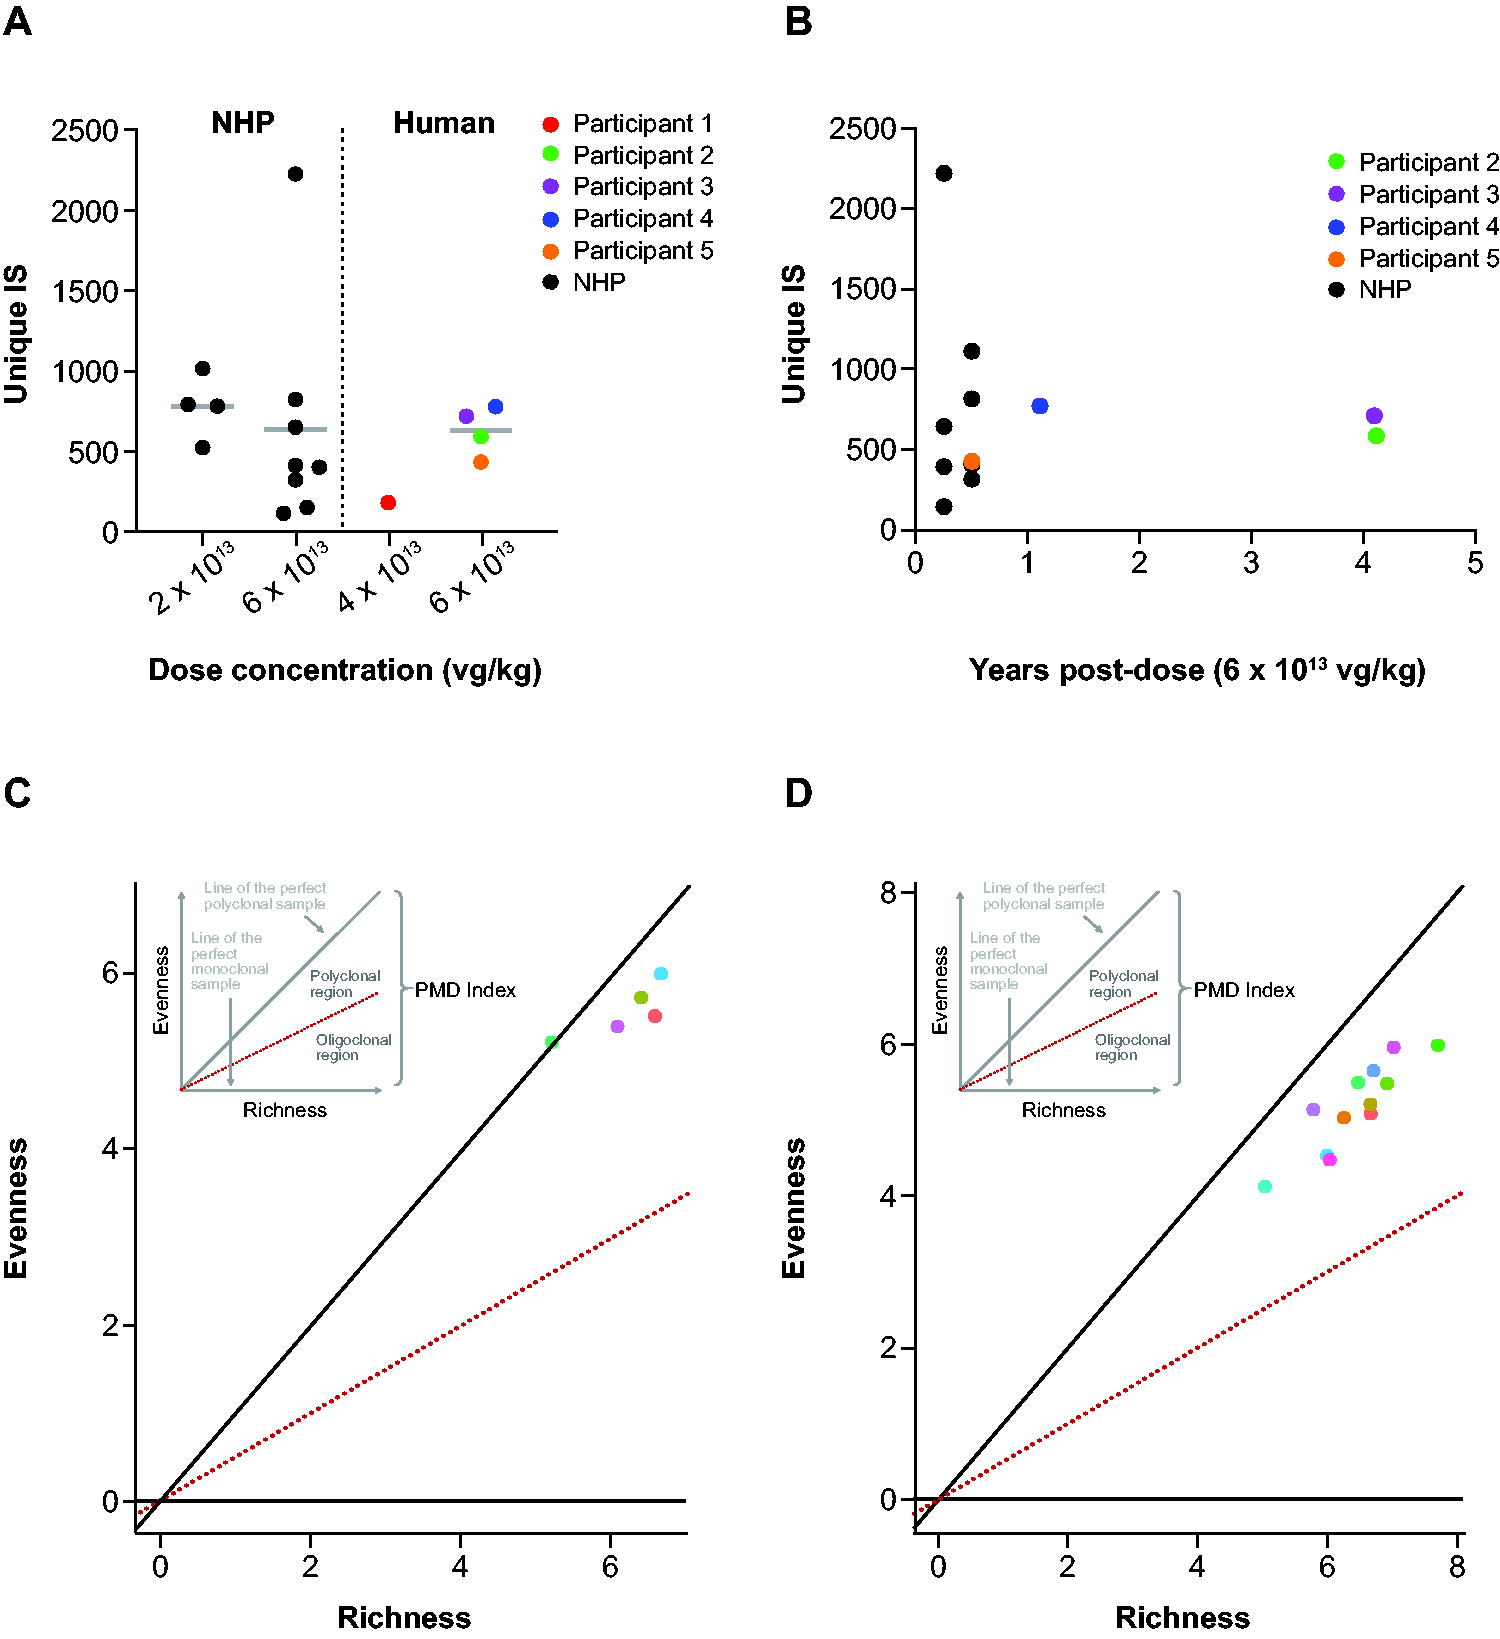
For the 5 human liver biopsy samples, the number of unique IS detected per sample ranged from 182 to 778 (Supplementary Table S1; Fig. 1A). The majority (98.7%) of IS were identified by a single sequence read, and the maximum number of sequencing reads detecting a unique IS was 3. Although the sample size was small, the number of unique integrations did not increase with time (Fig. 1B). The results for NHP liver samples, regardless of dose or collection time, were generally similar and are presented together as a single group. For NHP samples, the number of unique IS detected per sample ranged from 153 to 2,221 (Fig. 1A). For both the human and NHP samples, the number of IS and the mean vector copy number were then used to estimate the number of unique IS per cell (IS/cell) and per vector genome (Supplementary Data S3 and Supplementary Table S3). For the human and NHP samples, approximately 99% of vector genomes persisted in episomal forms (Supplementary Data S3 and Supplementary Tables S4 and S5).
Dynamics of vector integration in NHPs and humans.
The TES method used for the vector integration analysis specifically identifies the junction between the vector and genome, with DNA sequencing information captured at a maximum of approximately 200 nucleotides from the junction site. Therefore, a limitation of the TES method is that the sequence of the IS >200 nucleotides away from the junction between the vector and genome is not determined. Accordingly, whether any particular IS includes a partial vector, full vector, or concatemer cannot be determined. Junctions in the body of the vector were evenly distributed along its length, including in the promoter, coding sequence, and polyA regions.
The number of sequencing reads detecting a unique IS contained within a sample can be used as an indirect readout for clonal expansion (i.e., if the vector integration triggers proliferation of a cell, that unique integration event, or fingerprint, will be detected by DNA sequencing repeatedly in each replicated cell). For humans, the 10 most abundant IS were detected by a maximum of 2–3 sequence counts (Supplementary Table S6). For NHPs, among the 10 most abundant IS, the sequence counts ranged from 2 to 7. Most IS were detected by a single sequencing read in both species, suggesting vector integrations are not associated with substantial clonal outgrowth.
Evaluation of clonality
Clonal enrichment was further evaluated using a PMD tool, as described previously. 31 This analysis again relies on the principle that an integration event triggering clonal expansion will correspond with detection of that integration event repeatedly in cellular progeny, also harboring the integration in their genome. In 1 human sample, each IS was detected by a single sequencing read, while the other 4 human samples had individual IS detected by 2 or 3 sequencing reads. These cases where the evenness and richness of the data are close in proximity align near the maximum value for polyclonality and indicate minimal detection of homeostatic cellular proliferation of liver cells 32 (Fig. 1C). Given the tight distribution around detection of most IS by 1 independent sequencing read and that only rarely were IS detected by 2 or 3 independent sequencing reads for a sample, an integration detected by 6 or more independent sequencing reads would be a rare event. From the Poisson distribution, the cumulative probability summed across the entire dataset would still be less than 1% of observing such an event due to random fluctuation. Of note, each individual TES sample interrogates about 100,000 genomes. Thus, clonal expansions representing 1 cell in 10,000 would be readily detected and appear as outliers in either the independent sequence count or the PMD analysis. Both the IS frequency and polyclonality were similar across time and species (Fig. 1D). There were no unusual clonal enrichments caused by the vector integration in either the human or NHP samples. Importantly, there was no evidence of time-dependent alterations in clonality. Therefore, 3- to 6-month studies in NHPs may serve as a reasonable assessment period for AAV-based vector integration studies, equivalent to 4 years after vector administration in humans.
Correlation of IS frequency and chromosome dynamics
We observed a general relationship between the number of IS per chromosome and chromosome size in humans and NHPs, similar to previous analyses. 9 Furthermore, the proportion of IS present within open chromatin windows, as defined by ATAC-seq, was greater than expected by chance (Fig. 2A and B). There was a slightly greater enrichment in the NHP samples that could be influenced by species-specific differences in the depth, assembly, and annotation quality of the ATAC-seq datasets. The IS were also enriched within the open chromatin windows regardless of the proximity to a TSS (Supplementary Fig. S1A and B).
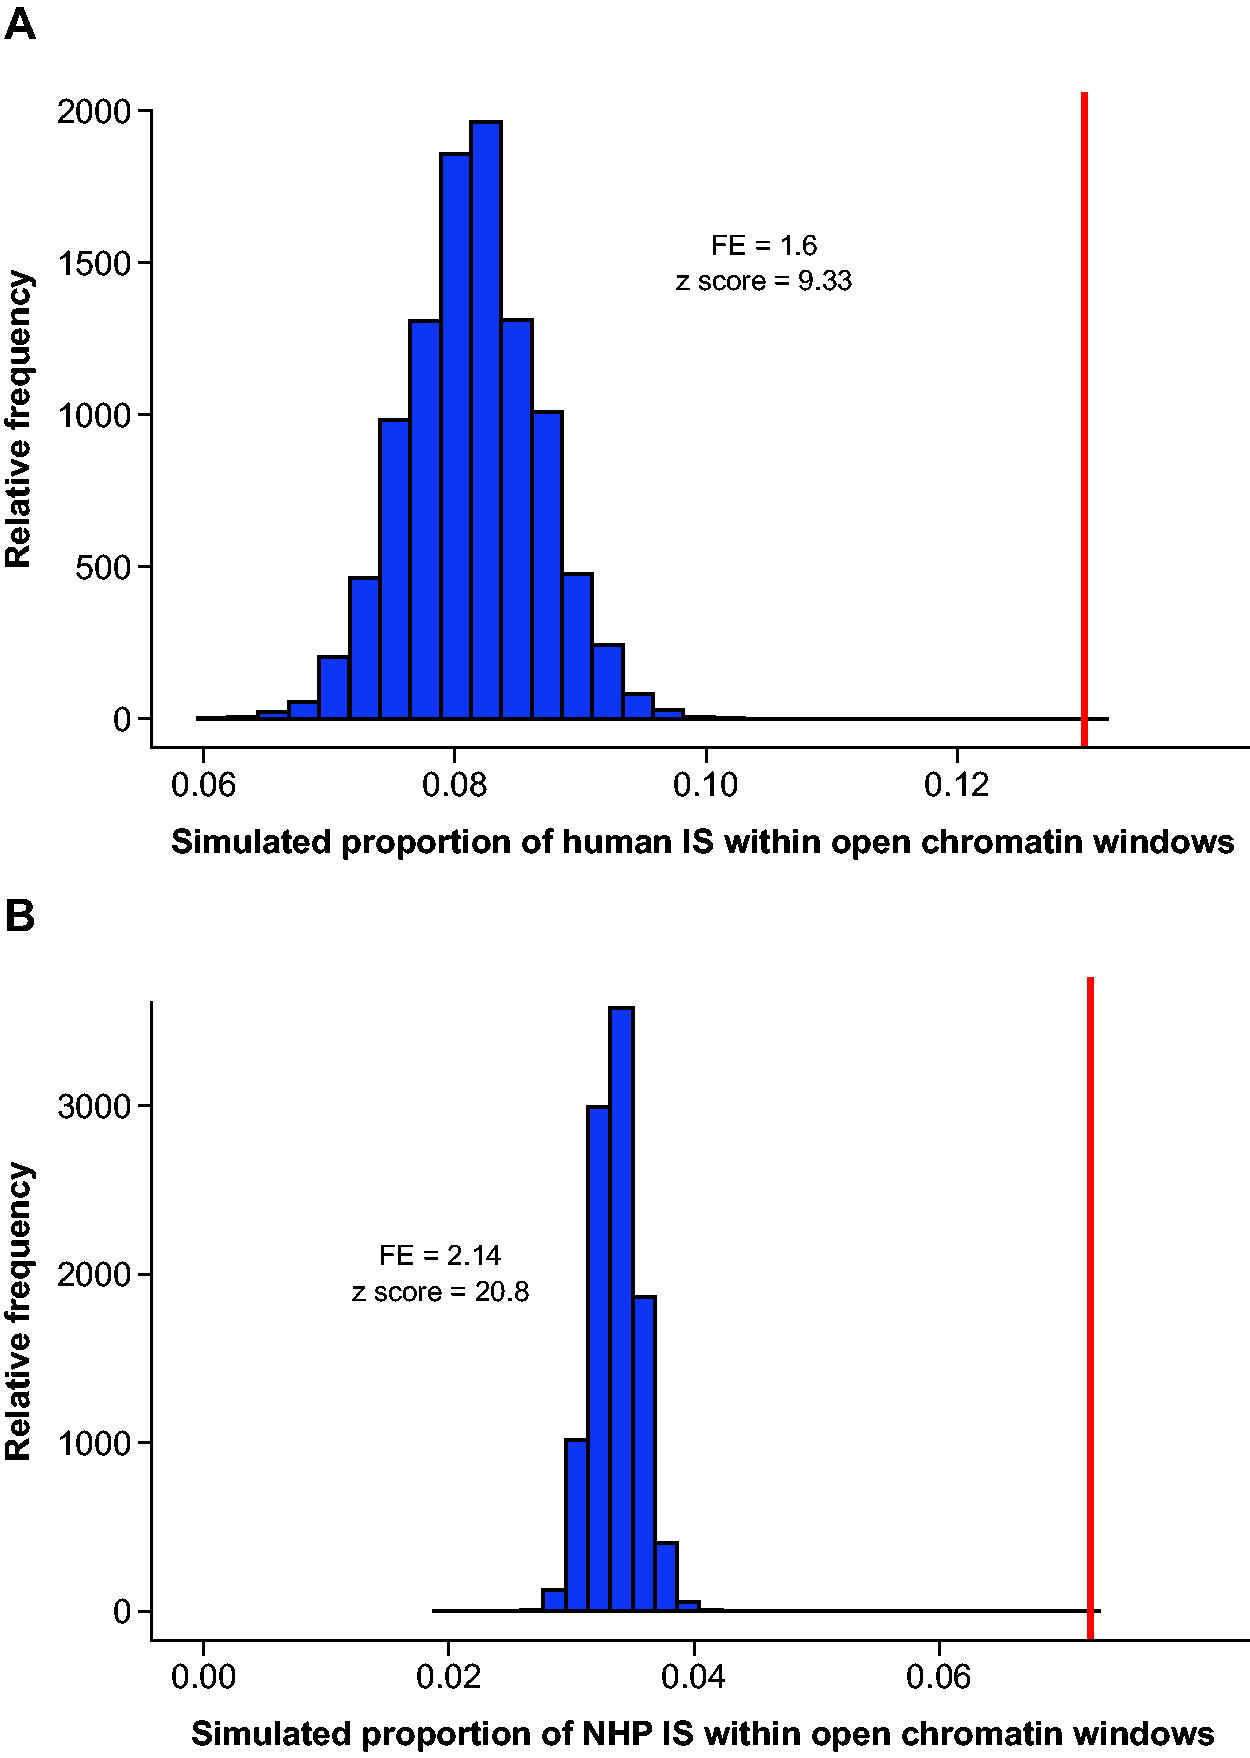
The proportion of total IS within regions of open chromatin for
Next, we evaluated the impact of various chromosomal features on IS frequency. For both human and NHP samples, the number of IS generally correlated with chromosome length (Fig. 3A and B). However, a trend toward tighter correlations was observed when IS frequencies were plotted against liver-specific gene expression per chromosome (Fig. 3C and D) or accessible chromatin density per chromosome (Fig. 3E and F). As expected, given their interrelatedness, we also found a correlation between actively transcribed genes and regions of open chromatin (Fig. 3G and H), despite uncontrolled variables due to different coverage depth of the different datasets. The human ATAC-seq analysis used a large public dataset, and the NHP liver ATAC-seq analysis used a smaller internal dataset from 13 animals and a reference genome that is less well annotated. Additionally, more IS were detected in NHPs than in humans, which increased statistical power to detect integration enrichment.
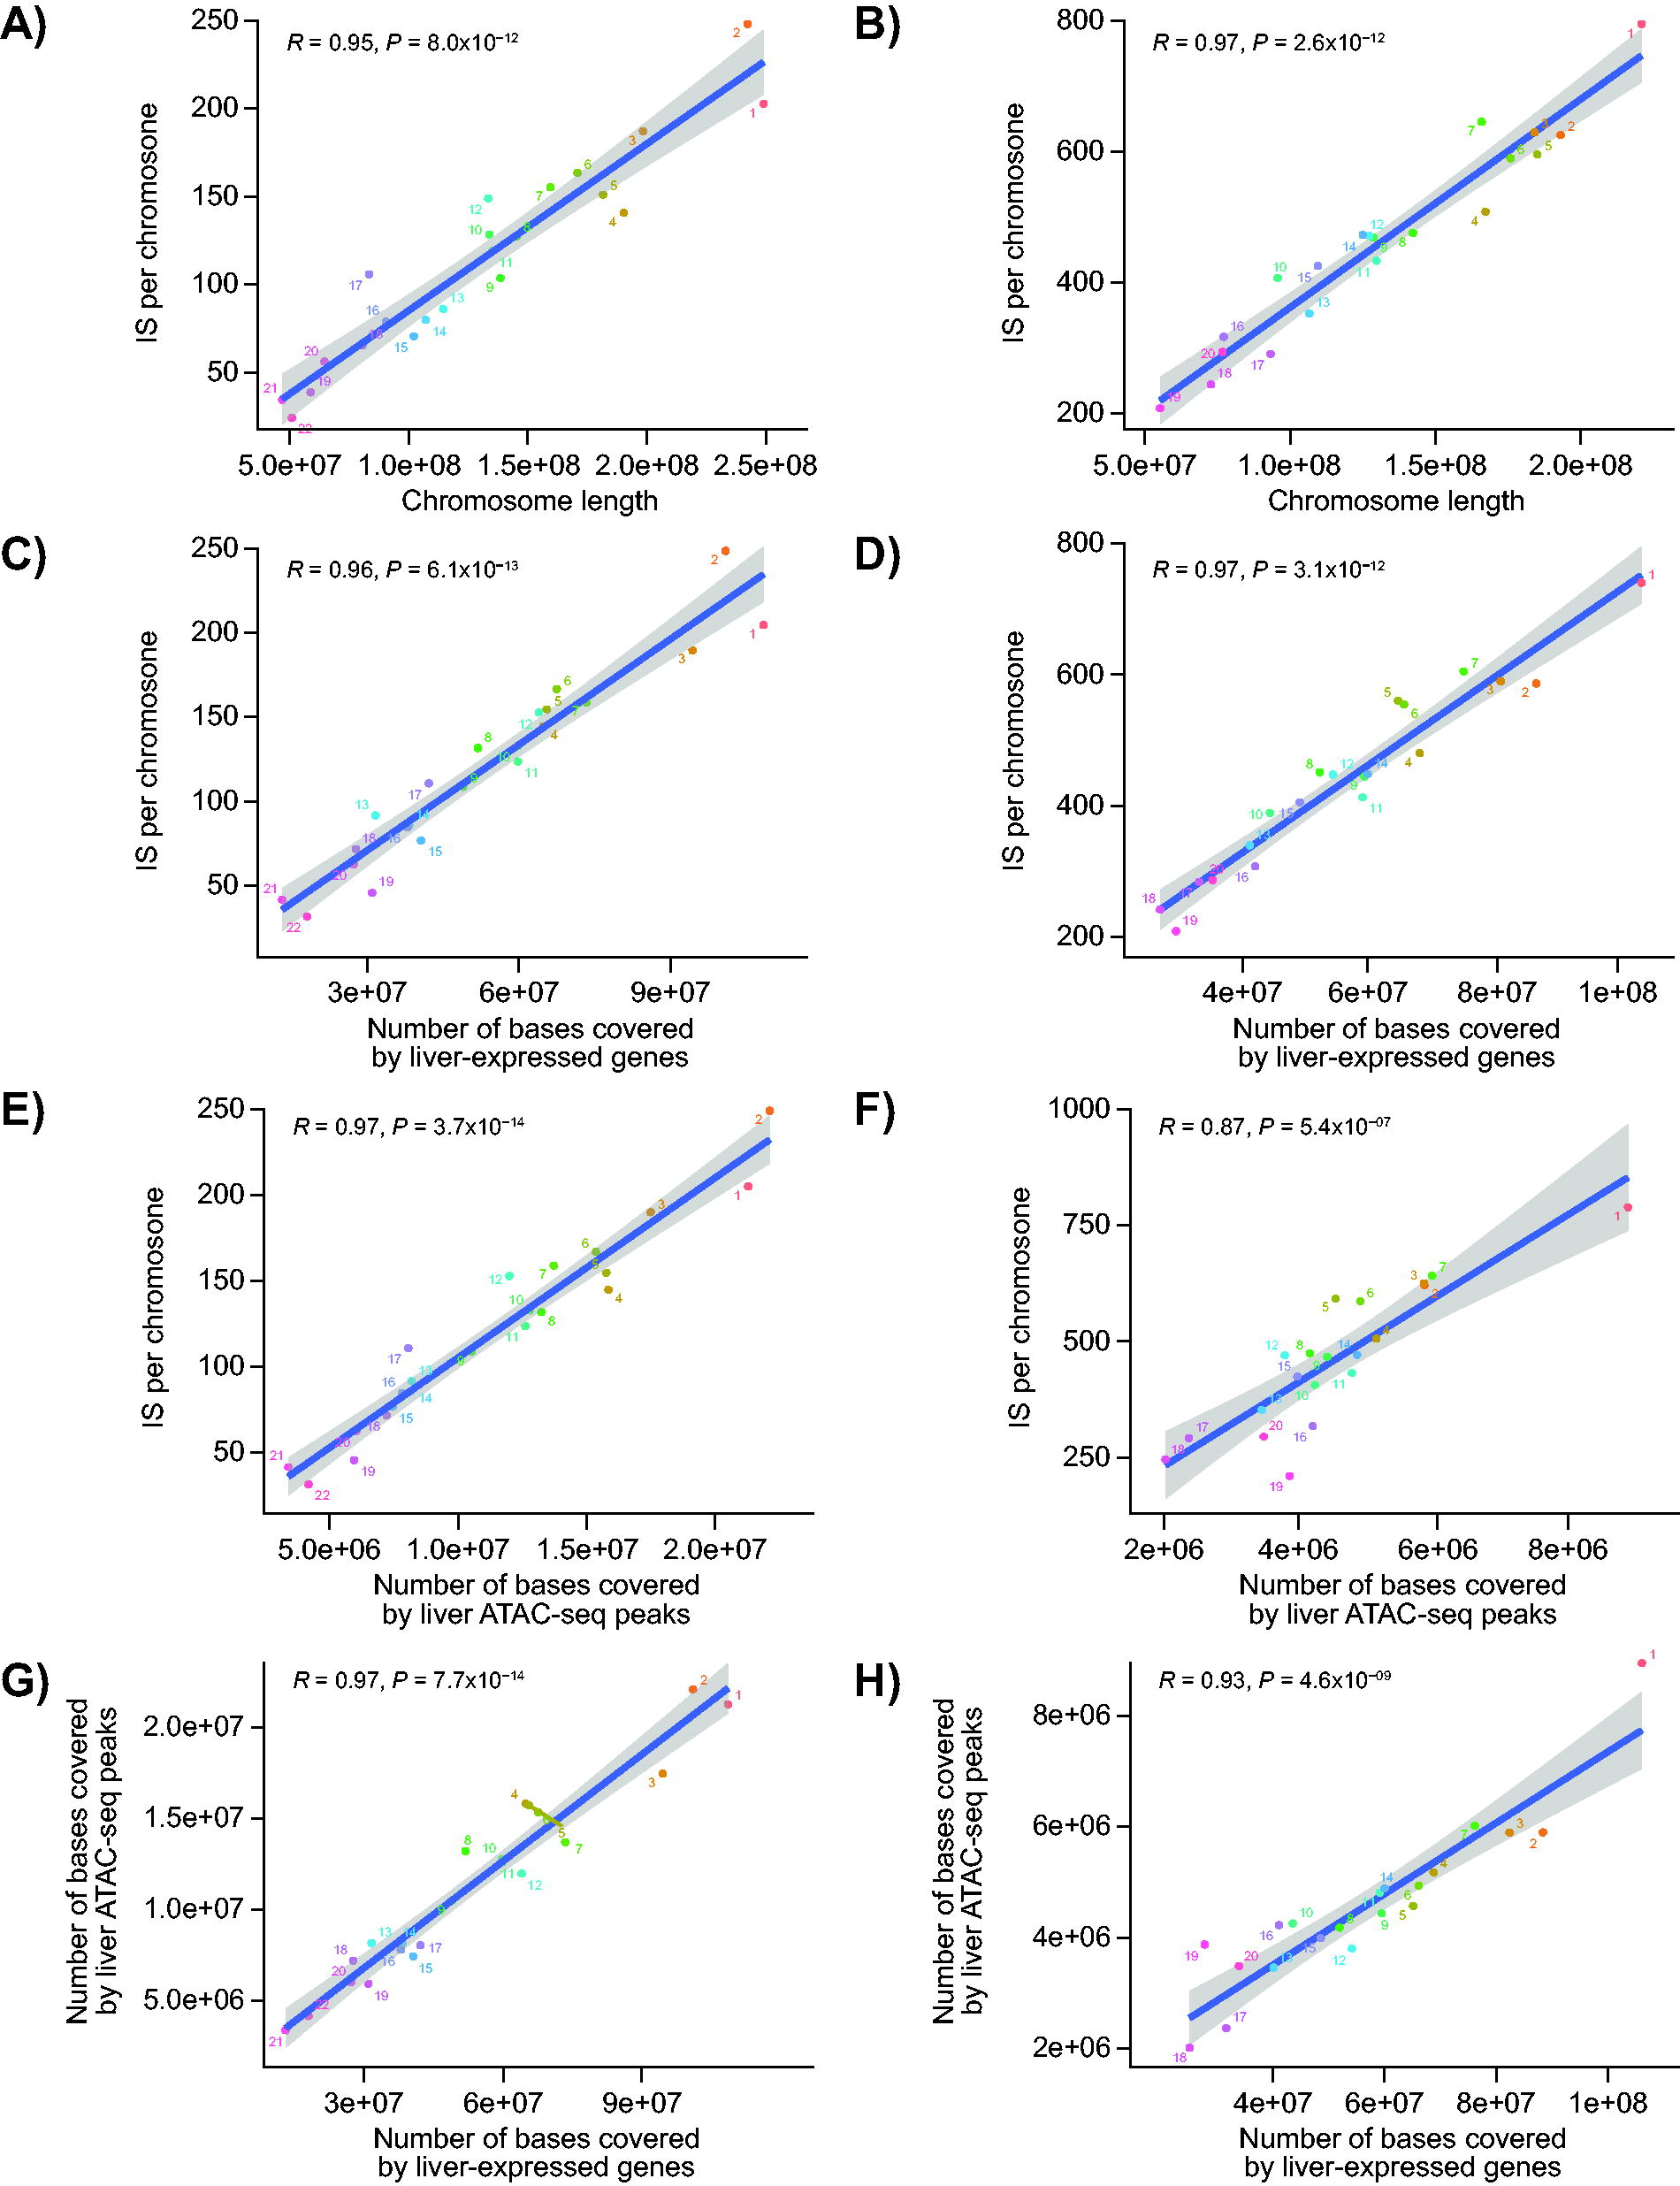
For autosomes, correlation of the number of IS with
While we first examined the proportion of IS detected in narrowly defined open chromatin windows, we also characterized whether they occur in the general vicinity of ATAC-seq peaks (i.e., open chromatin). Accordingly, we measured the distance from each IS to the nearest ATAC-seq peak and found a slight bias toward regions of open chromatin, regardless of the open chromatin’s proximity to a TSS (Supplementary Fig. S2).
Common integration site analysis
Common integration site (CIS) analysis is a method used to characterize potential vector integration hotspots by identifying regions of the genome where IS are enriched across individual samples and unlikely to occur by chance. In line with the bias toward open chromatin, 2 genes identified by the CIS analysis overlapped in both species: ALB and SERPINA1 (Table 1), 2 of the most highly expressed genes in the liver. 30
Overlap in the Top 10 Genes Closest to Common Integration Sites Between Human and NHP Samples
Chr, chromosome; CIS, common integration site; NHP, nonhuman primate; nt, nucleotide.
Mapping integration sites present within 10 kb of a transcription start site
We next examined whether integrations are enriched near the TSS for protein-coding genes (Supplementary Fig. S3). For the human samples, the IS present within 10 kb of a TSS for protein-coding genes accounted for 12.24% of total IS. Despite this, the 331 observed IS present within these regions were still more than the 282 IS that would be expected by chance (p = 0.0012, fold enrichment = 1.17). Furthermore, the relative proximity of IS to gene bodies was greater than expected by chance (Supplementary Fig. S4).
The frequency of IS within 10 kb of a TSS was then assessed conditioned on a gene’s expression level and whether it was a cancer-associated or non-cancer-associated gene. The Genotype-Tissue Expression (GTEx) project 2017 median tissue transcripts per million dataset 30 was used to group genes based on their expression level, and cancer-associated genes were defined according to the human COSMIC Cancer Gene Census database v98. 33 The simulations demonstrated no significant enrichment of IS within 10 kb of the TSS for cancer-associated genes in humans (p = 0.26, fold enrichment = 1.17; Fig. 4), and even when expanding the genomic window to IS present within 100 kb of a cancer-associated gene, the IS were detected by a low number of sequencing reads (Supplementary Data S3). However, there was a significant enrichment for non-cancer-associated genes in humans (p = 0.0007, fold enrichment = 1.19; Fig. 4).
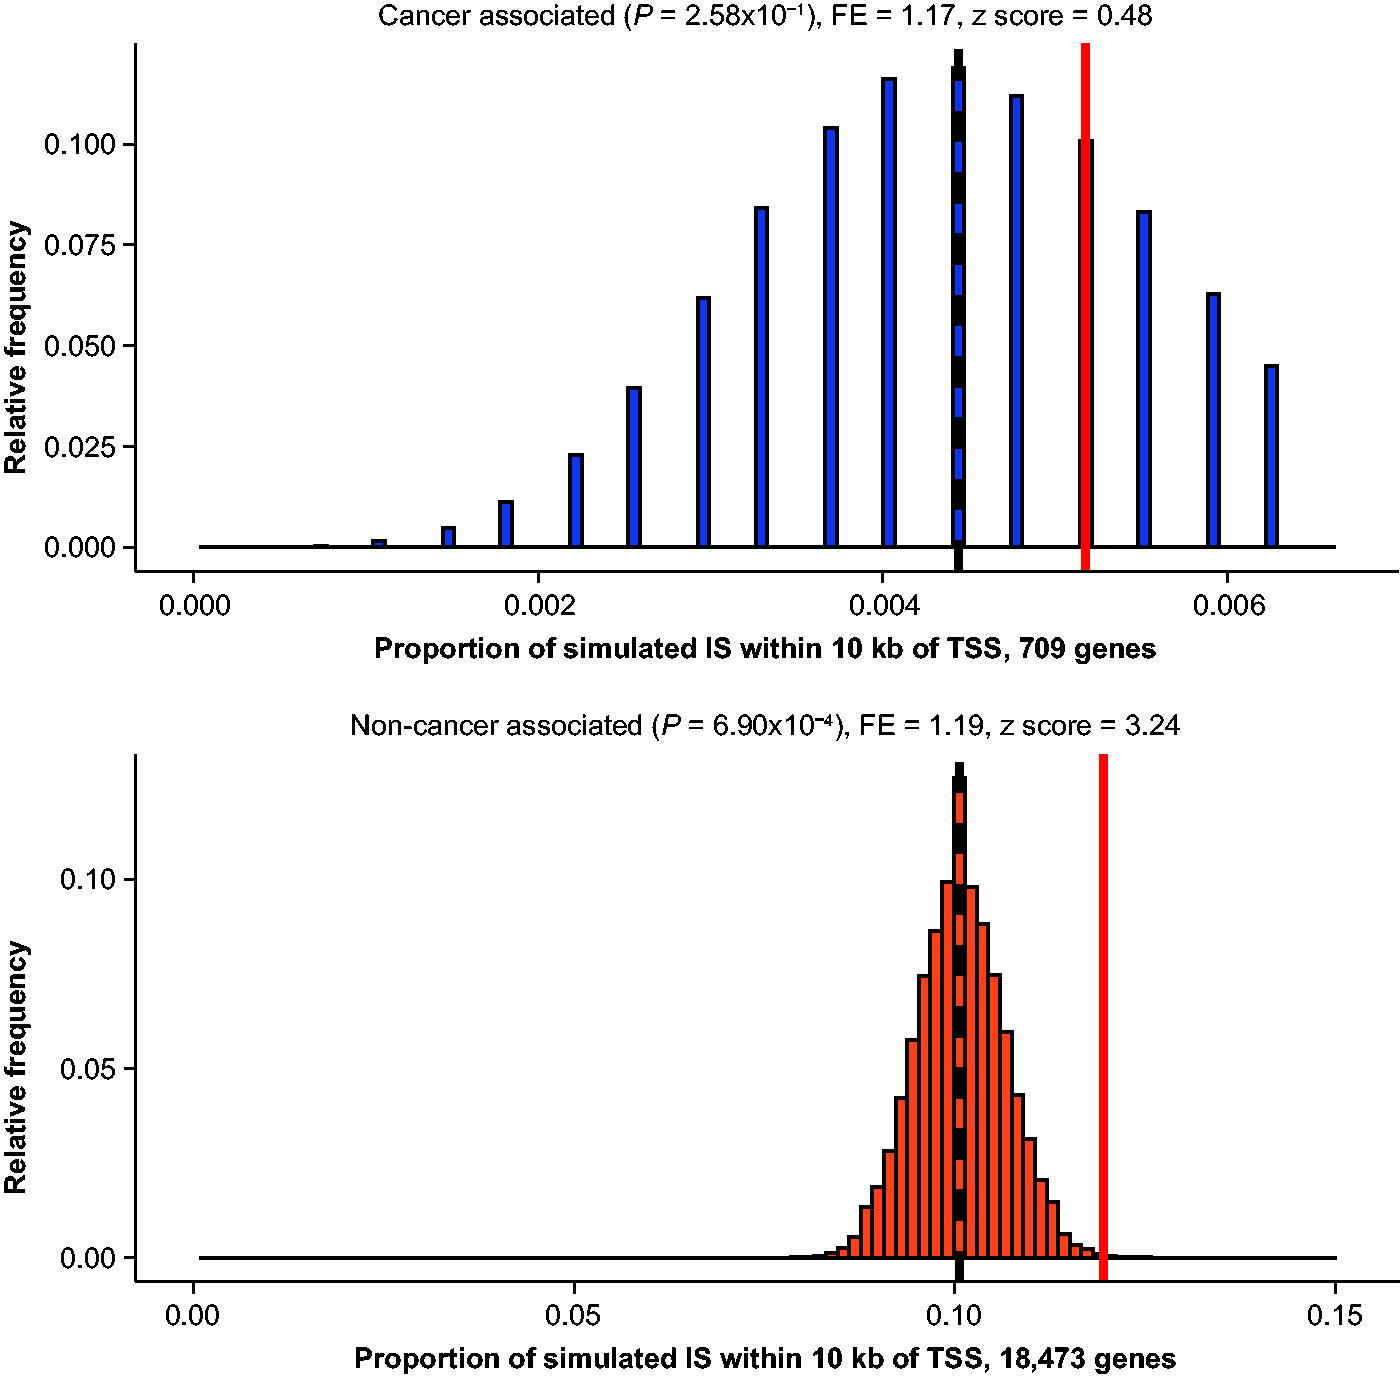
Proportion of simulated and observed IS within 10 kb of a TSS for cancer-associated and non-cancer-associated genes in humans. The red line represents the proportion of observed IS that fall within 10 kb of a TSS for a cancer-associated or non-cancer-associated gene. The histograms represent the distribution of integrations that would be expected by chance, and the black dashed line is the median simulated proportion. TSS, transcription start site.
When all genes were grouped based on their expression level alone (no separation based on cancer association), the frequency of IS within 10 kb of a TSS was greater near genes highly expressed in the liver, compared with moderate or no expression, in both human and NHP samples (Fig. 5). For the human samples, this statistically significant enrichment was found for highly expressed, non-cancer-associated genes (p < 0.0001, fold enrichment = 1.46), but not for cancer-associated genes regardless of expression level (Supplementary Data S3 and Supplementary Figs. S5, S6, S7 and S8). Collectively, these results demonstrate a mild enrichment of IS near the TSS of genes, with the magnitude of enrichment influenced by the gene’s expression level (Supplementary Tables S7 and S8). However, while we observed no increase in IS in the cancer-associated gene sets studied here, the low number of IS detected in the 5 human biopsies cannot exclude biases that might be observed with much larger datasets.
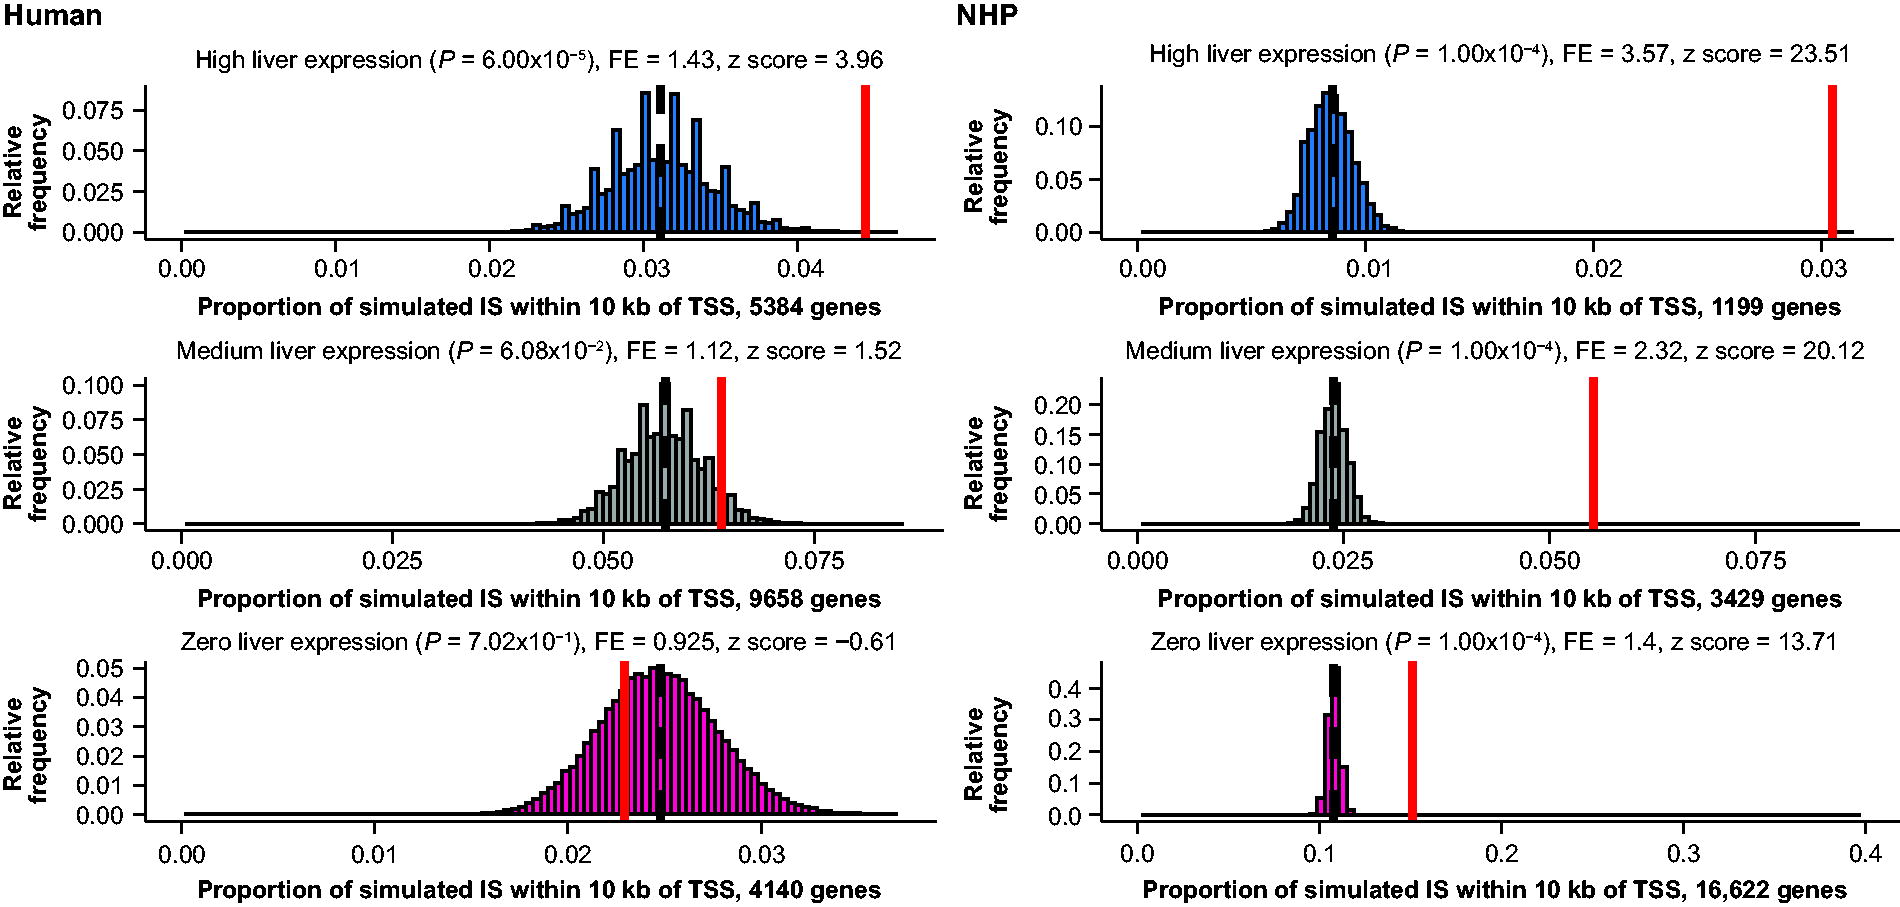
Integration enrichment within 10 kb of TSS for protein-coding genes is similar between humans and NHPs when correlated with gene expression. The red line represents the proportion of observed integrations that fall within 10 kb of a TSS for a protein-coding gene. The histograms represent the distribution of integrations that would be expected by chance, and the black dashed line is the median simulated proportion. Genes were grouped into high (≥90th percentile), medium (>60th and <90th percentile), and zero liver expression based on percentiles of each gene’s TPM using the GTEx project 2017 median tissue TPM dataset. 30 GTEx, Genotype-Tissue Expression; TPM, transcripts per million.
DISCUSSION
Valoctocogene roxaparvovec is a gene therapy evaluated in a phase 3 and a phase 1/2 clinical study 23,24,28,34,35 and approved by the European Medicines Agency and US Food and Drug Administration for severe hemophilia A. 25,26 Combined, these studies offer published data from approximately 145 participants with a minimum of 4 years of posttreatment follow-up. 35 Here, we present molecular characterization of the vector integration profiles of liver biopsies from 5 participants in the valoctocogene roxaparvovec clinical trials as well as liver samples from 12 treated NHPs. Similar numbers of unique IS were detected across all human and NHP liver samples. The genomic distribution of IS was also comparable between species, and there was no increase in the frequency of vector integration observed over time, similar to the observation in NHPs that were not subject to repeated biopsies. 36
The presented analysis contrasts with previous suggestions that long-term transgene expression may be driven by integrated vector genomes. 37 In a prior NHP study, most vector genomes and RNA expression were lost over the first 2 years and the RNA in situ hybridization signal positive nuclei were often in the 0.01% to 1% range while integrations were in the 1 × 10⁻³ to 1.6 × 10⁻² IS/cell range. 37 Although the integration rate presented here is only slightly lower at 3.09 × 10⁻⁴ IS/cell (lowest NHP) to 5.71 × 10⁻³ IS/cell (highest human), the total vector copy number (Supplementary Table S3) remains 1,000-fold higher compared to the IS/cell up to 4 years after administration of valoctocogene roxaparvovec.
The internally derived vector copy number from the TES analysis is similar to the vector copy number derived from a prior analysis by Fong et al. that examined different tissue sections derived from the same biopsy samples for participants 1 through 3. 27 Importantly, Fong et al. used a different method of quantitation that used droplet digital polymerase chain reaction (ddPCR) with primers designed to cross the inverted terminal repeat (ITR) fusion region of circularized AAV episomes. The samples were also treated with an enzyme digest that would have removed all integrated, linear DNA sequences (PS-DNase). 27 The ddPCR method may miss some episomes that are lacking the full ITR fusion sequence, and it may double count other concatemerized episomes with 2 or more ITR fusions. However, the similar numbers found by these independent ddPCR- and TES-based methods support the conclusion that the TES-derived vector copy number is largely based on detection of episomal vectors, as opposed to integrated vector, and collectively strengthens the resulting observation that the number of IS/cell is consistently a factor of 1,000-fold lower than the vector copy number per cell. Therefore, the 3 human samples from the phase 1/2 trial have demonstrated the persistence of high episomal vector genomes (PS-DNase resistant) and double-digit levels of vector-containing and vector-expressing hepatocytes (Supplementary Table S3). 27 These data combined suggest there are a minimum of 10-fold more cells expressing FVIII than the number that contain integrations. The long-term maintenance of FVIII expression reported for participants who received valoctocogene roxaparvovec in the phase 1/2 28 and phase 3 trials, 35 combined with the low number of integrations compared to expressing cells, supports the conclusion that there is functional long-term transgene expression from episomes as previously reported. 1 –3 Other data supporting vector expression from the previous publication by Fong et al. include the approximate fractions of FVIII DNA staining hepatocytes and RNA staining scaled from total RNA in situ hybridization signal and the number of individually counted cells in 2 of the samples. 27 Samples from participants 4 and 5 in the present study were not analyzed for expression by Fong et al.
For both the human and NHP samples, the IS were broadly distributed across the genome and mildly enriched near the TSS of genes. The degree of enrichment was associated with expression level and open chromatin status. The NHP and human datasets overlap in terms of IS/cell, fold enrichment near TSS, bias toward open chromatin, and evenness in the clonality analysis. However, no substantial enrichment of IS occurred near cancer-associated genes. Importantly, the TES methodology identifies a wider range of integrations than are identified with inverted terminal repeat-end-directed methods. 29 For example, had there been non-ITR integrations into proto-oncogenes in the human or NHP samples, such as have been found in mouse studies, 20 the TES methodology could have identified those and also identified substantial clonal expansions. Neither vector insertion into proto-oncogenes in human samples nor substantial clonal expansion in human or NHP samples was seen. Furthermore, the overall frequency of vector integration with valoctocogene roxaparvovec is similar to the frequency of wild-type AAV integration. 38
The rates of clonality and IS profiles did not overlap with those observed in extremely rare cases of liver cancer, possibly associated with insertion of the 3′ untranslated region of wild-type AAV serotype 2 that contains liver-selective promoter activity. 39 This vector sequence is not present in valoctocogene roxaparvovec or most other recombinant AAV therapies, and no increase in malignancy has been observed. In more than 150 participants with more than 650 patient-years as of January 1, 2024, only 2 malignancy-related serious adverse events have been reported in participants after valoctocogene roxaparvovec infusion. 28,40 A participant in the phase 1/2 trial during year 6 postdose was diagnosed with grade 2 acinar cell carcinoma of the parotid gland, 28 and a participant from the phase 3 trial was diagnosed with B-cell acute lymphoblastic leukemia almost 3 years postdose. 40 Neither malignancy was derived from the liver, which is the intended target for the valoctocogene roxaparvovec transgene and its liver-selective promoter. Genetic testing with TES in the parotid case and ddPCR on highly enriched tumor cells in the leukemia case demonstrated the malignancies were unlikely related to valoctocogene roxaparvovec. 28,40
In this study, no evidence of clonal enrichment was detected beyond what would be expected for normal liver proliferation rates. 41 The liver is a regenerative organ and contains a subset of cells that proliferate as part of the normal homeostatic process. 41 Therefore, it is expected that some cells would have undergone several rounds of cellular division given the time of liver biopsy collection, including 1 sample collected approximately 4 years after valoctocogene roxaparvovec infusion. Clonal expansion, but not tumor formation, was reported 10 years after AAV-based gene therapy in a hemophilia A dog model. 8 It is unclear if that level of clonal expansion is any greater than would be expected based on the normal rates of cellular proliferation during the extended time frame of that study. For example, nucleic acid sequencing of normal tissues in humans has demonstrated evidence of life-history-dependent expanded clones in the absence of tumor formation. 42,43 Future studies characterizing vector integration with longer time horizons will likely find clonal expansion after gene therapy. However, these studies will need to carefully weigh the outcomes of gene therapy, with respect to IS frequency, against an evolving understanding of what normal rates of clonality are in aged tissues such as the liver. 43,44
Needle biopsies sample only a small portion of the liver tissue, and the TES method is limited to less than 1 µg of input; therefore, these data represent only a sampling of the total potential integration events. Given the low frequency of integrations and the small number of human biopsy samples (N = 5), it is expected that other biopsies obtained from the same liver would contain integrations in additional locations. Still, the semi-random distribution characteristics observed in the NHP and human liver biopsies described here should be broadly applicable, with other biopsies expected to contain integrations randomly distributed throughout the genome with a slight bias toward open chromatin and actively transcribed genes. More importantly, the results also demonstrate the relevance of short-term (3- to 6-month) studies in NHPs to reproduce the IS patterns and oligoclonality of gene therapy in humans with a 4-year time period and set a baseline for expected background oligoclonality in this time frame. However, the comparatively short-term duration of this study is an important limitation. The long-term theoretical risk of insertion-driven tumorigenesis after gene therapy remains undefined. Long-term monitoring of gene therapy patients, possibly in independent patient registries, will be essential to collecting a more complete understanding of long-term vector integration-related safety.
CONCLUSION
The administration of valoctocogene roxaparvovec at a clinically relevant and efficacious dose in both humans and NHPs resulted in comparable rates of vector integration. Importantly, direct head-to-head comparison between humans and NHPs provides further evidence that AAV vector integration in NHPs can be a model for predicting integration profiles in humans. We also found no evidence of abnormal clonal expansion, though vector integration driving cellular transformation remains a theoretical risk with AAV-based gene therapies. Future long-term studies will need to consider best practices for evaluating potential gene therapy-derived vector integrations in the context of our evolving understanding of basal rates of clonal expansion in healthy tissues. Consistent investigation of malignancies and healthy tissue in patients treated with various recombinant AAV gene therapies will build a more complete understanding of the real-world risk profile.
DATA SHARING STATEMENT
Due to the very small number of participants in this study, drawn from the limited number of individuals in this rare disease population, the sequencing libraries generated for each participant have not been shared via a public repository to avoid potentially compromising participants’ identities. However, the de-identified individual participant data that underlie the results reported in this article (including text, tables, figures, and appendixes) will be made available together with the research protocol and data dictionaries for noncommercial, academic purposes. Additional supporting documents may be available upon request. Investigators will be able to request access to these data and supporting documents via a website (https://www.biomarin.com/) beginning 6 months and ending 2 years after publication. Data associated with any ongoing development program will be made available within 6 months after approval of the relevant product. Requests must include a research proposal clarifying how the data will be used, including proposed analysis methodology. Research proposals will be evaluated relative to publicly available criteria available at https://www.biomarin.com/ to determine if access will be given, contingent upon execution of a data access agreement with
Footnotes
Acknowledgements
AUTHORS’ CONTRIBUTIONS
C.V., S.A., E.W., W.C., J.A., K.M.O.M., T.K., T.M.R., C.B.R., K.E., and S.Z.: Conceptualized and performed the experiments. R.F., H.T., G.K., P.R., and W.L.: Contributed to interpretation of the study results. H.T., G.K., P.R., and W.L. were clinical investigators and performed trial procedures. All authors contributed and provided critical input while drafting the article.
AUTHOR DISCLOSURE STATEMENT
S.A., E.W., J.A., K.M.O.M., K.E., and S.Z. are employees and stockholders of
FUNDING INFORMATION
Funding for this study was provided by
SUPPLEMENTARY MATERIAL
Supplementary Data
References
Supplementary Material
Please find the following supplemental material available below.
For Open Access articles published under a Creative Commons License, all supplemental material carries the same license as the article it is associated with.
For non-Open Access articles published, all supplemental material carries a non-exclusive license, and permission requests for re-use of supplemental material or any part of supplemental material shall be sent directly to the copyright owner as specified in the copyright notice associated with the article.