
Abstract
Recombinant adeno-associated virus (AAV) is one of the main viral vector-based gene therapy platforms. AAV is a virus consisting of a ≈25 nm diameter capsid with a ≈4.7 kb cargo capacity. Therapeutic safety and efficacy depend on the correct encapsidation of the DNA in individual virus particles, which is often characterized by the single scalar value of the ratio of full capsids with complete viral genomes to the total viral capsid number [the full-to-total (FTT) ratio]. This study reports on the interlaboratory and intertechnique variations of measurement methods for FTT among a cohort of organizations. The analytical methods used were sedimentation velocity analytical ultracentrifugation (SV-AUC) with UV/Vis and/or Rayleigh interference optics, size exclusion chromatography (SEC) with multi-angle light scattering (MALS), and tandem UV/Vis and/or refractive index, cryogenic electron microscopy, dual-wavelength ultraviolet spectrophotometry, and ELISA coupled with quantitative PCR (qPCR, dPCR, or ddPCR). FTT measurements for both AAV5 and AAV8 serotypes were similar, except for PCR–ELISA. The optical techniques (UV spectroscopy/SEC–MALS) showed <10% SD between laboratories, likely from the uniformity of existing industry protocols. AUC, while demonstrating good repeatability, had ≈25% SD interlaboratory, suggesting the need for standardized methods. PCR and ELISA had poor reproducibility due to variations in both PCR and ELISA protocols and instrumentation. The discussion presents intended future efforts to improve and harmonize these measurements to increase both the repeatability and reproducibility of AAV viral particle critical quality attributes such as FTT.
INTRODUCTION
Recombinant adeno-associated viruses (AAV) are the most well-studied and technologically advanced viral vectors for gene therapy. The discovery of AAV as an in vitro co-isolate and in vivo coinfecting entity associated with various adenovirus diseases in humans led to extensive characterization of the molecular biology of AAV via isolation of various serotypes—notably its nonpathogenic and low immunogenic infection of host cells. 1,2 Subsequent engineering of the AAV genome for gene therapy applications removed its site-specific host-cell genetic integration capabilities, and engineered AAV genetic cargo persists only in nondividing cells; these attributes make them attractive viral vectors for gene therapy. 3 –5 As of July 2023, there are five FDA-approved AAV-based therapeutics with several hundred clinical trials planned, in process, or completed. 6 –8
Therapeutic AAV drug substance (DS) can be generated from mammalian HEK293 or insect Sf9 cell cultures using plasmid or baculovirus systems. 9,10 Both systems yield AAV particles with significant heterogeneity of genetic loading in the viral protein capsid shell. 11 –13 Purification of AAV from crude cell lysate may include immunoaffinity chromatography, ion-exchange chromatography, polymer-assisted precipitation, or density gradient ultracentrifugation, with affinity chromatography being the most easily scalable to high throughput and serial ultracentrifugation giving the highest purity. 14 Commercial therapeutic AAV preparations contain viral particles with the desired full-length genetic cargo as well as undesired particles with no cargo, partial cargo, and potentially host-cell genetic cargo; these undesired particles can lower the safety and therapeutic benefit of the final drug product. 15
The U.S. FDA guidance for human gene therapy states that impurities of concern (among others) in viral vectors include: “defective interfering particles, noninfectious particles, empty capsid particles, or replicating recombinant virus contaminants” and should be characterized and “reported as a ratio, for example, full:empty particles or virus particles:infectious units.” 16 The critical quality attribute (CQA) of the fraction of filled capsids is of paramount importance, as the FDA guidance indicates. A variety of techniques to characterize the composition of an AAV preparation and its distribution of genetic cargo are employed, but many are yet to be harmonized or standardized within the community, complicating data assessment by developers and regulators across different laboratories and organizations. 17 –22
In 2019, the NIIMBL Technology Workshop IV: Analytical Methods for Novel Modalities identified the critical need to assess viral capsid genetic loading measurement techniques. We report on the current state-of-the-art in viral capsid metrology and the reproducibility between various analytical techniques and various laboratories using a bespoke set of AAV test materials as measured in an interlaboratory study. This work—and follow-up efforts with experimental guidance—is anticipated to facilitate industry use of analytical procedures that harmonize virus capsid full and empty measurement between methodologies and across organizations. This will increase the confidence in viral vector characterization for safety and efficacy and facilitate better understanding of this CQA.
MATERIALS AND METHODS
Material sourcing and study design
The test materials used were AAV of serotypes 5 and 8 (designated AAV5 and AAV8) because of their industrial relevance, stability, and minimal practical challenges in measurement. 23 AAV5 and AAV8 were purchased from Virovek (Hayward, CA) in full and empty preparations, targeting nominally 100% and 0% filled capsids, respectively. According to the manufacturer’s certificate of analysis (CoA), all materials had a capsid titer of 5.0 × 10¹² viral particles (vp) per milliliter (i.e., vp/mL). A third sample, denoted mix, consisted of the full and empty samples gravimetrically combined at an exact 1:1 mass ratio. This produced six samples: one of each serotype nominally 100% filled (full), 50% filled (mix), and 0% filled (empty). The AAV samples contained the same transgene DNA sequence with no known biohazards or potential use as a DS. The transgene consisted of ≈1 kb of random DNA sequence followed by a green-fluorescent protein under a cytomegalovirus promoter, yielding ≈4.7 kb total DNA cargo. The random DNA sequence increases the transgene size to more closely match relevant therapeutic AAVs.
Seven organizations: one governmental, one nonprofit pharmaceutical, and five biopharmaceutical companies—performed the AAV FTT measurements (details are in Supplementary Data). Each organization measured the FTT ratio with a selection from the following techniques: SV-AUC, SEC–MALS, cryo-EM, PCR, ELISA, and A260/A280. Each organization chose which techniques to implement according to their availability and expertise. Although some experimental protocol details were recommended, participants were allowed to modify protocols according to their experiences and institutional best practices to capture the reproducibility of the current state-of-the-art in laboratory practice. The reported data have been anonymized to remove any association with the collecting organization. The measured values are reported as the mean of any replicates along with the standard deviation. Detailed sources of uncertainty have not been evaluated.
RESULTS AND DISCUSSION
This study assesses the variability of AAV physicochemical measurements among different analytical techniques and among different labs. For convenience of analysis and presentation, we characterize the capsid loading as the FTT ratio, equal to the mass of DNA-containing particles (normalized by the full transgene mass) divided by the ostensible total particle number, instead of full-to-empty (FTE) ratio. FTT ranges from 0% (no full particles) to 100% (all full particles), whereas FTE can range from 0 to infinity. Therefore, FTT is a more accurate descriptor of the measured value, with an easily understandable physical meaning. The exact values of the “Full” and “Empty” preparations were not known prior to analysis.
The data are presented and analyzed in terms of both repeatability (agreement between successive measurements within an organization; data in Supplementary Data) and reproducibility (agreement between measurements across organizations). A general assessment of the total measurement landscape can be obtained by observing the average and spread of reported values across different measurement techniques, as evidenced by data shown in Figure 1.
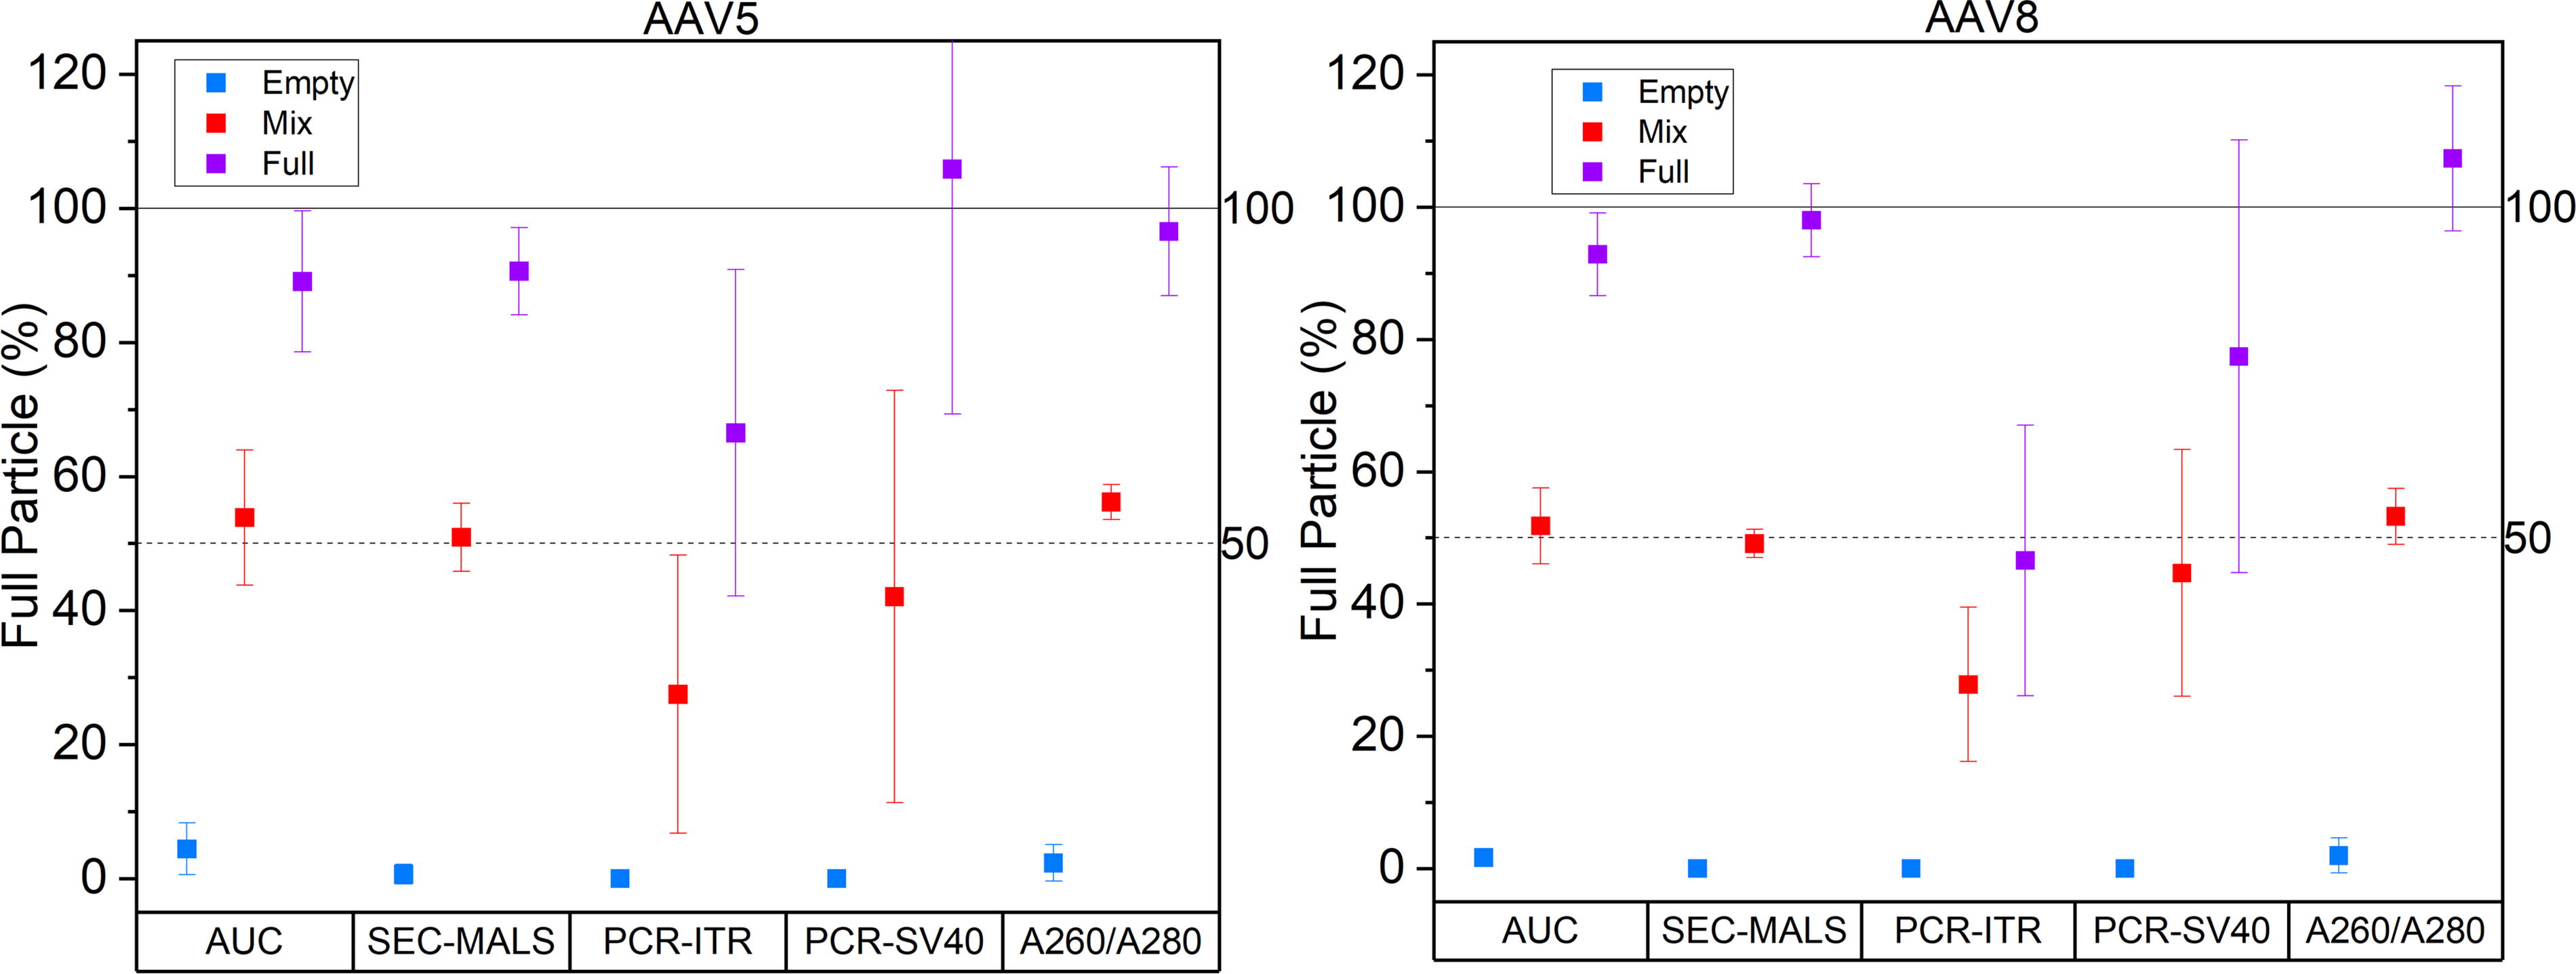
Summary of reported FTT values for AAV5 and AAV8 as measured by the different methods. Plotted values are averages with the error bars reporting the standard deviation of the measured values from across all study participants. FTT, full-to-total.
The average measurements obtained by SEC–MALS, A260/A280, and AUC show good reproducibility (average SD of 1.9% [empty], 5.0% [mix], and 8.2% [full]). Note that the A260/A280 FTT values are deconvoluted from raw data and can thus be >100%. The PCR–ELISA measurements for both inverted terminal repeat (ITR) and simian virus 40 (SV40) probes, by contrast, show greater variability than the other techniques and poor reproducibility between laboratories. Cryogenic electron microscopy (cryo-EM) provided an orthogonal measurement and gave a direct visual assessment of capsid loading as well as any errant particle loading or morphologies. The cryo-EM analysis was consistent with observations from other techniques (discounting PCR–ELISA).
The distribution of AAV5 and AAV8 FTT values reported by each laboratory enables testing of the presence of systematic bias between laboratories. A Youden plot (refer to the Supplementary Data for discussion) shows these data graphically by plotting the FTT of AAV8 against the FTT of AAV5 for each laboratory. If data points align with the diagonal corresponding to FTT (AAV8) = FTT (AAV5), that laboratory’s measurements are repeatable between the two serotypes. If data points tightly cluster at a point (along the diagonal), data from different laboratories are reproducible.
Figure 2 shows ultraviolet-visible absorbance spectrophotometry (specified as A260/A280) measurements. Here, the samples’ optical absorbance at two different wavelengths (most commonly 260 nm and 280 nm) is deconvolved with the proper optical constants to give the FTT (see Supplementary Data for full calculation), as shown in Figure 2.
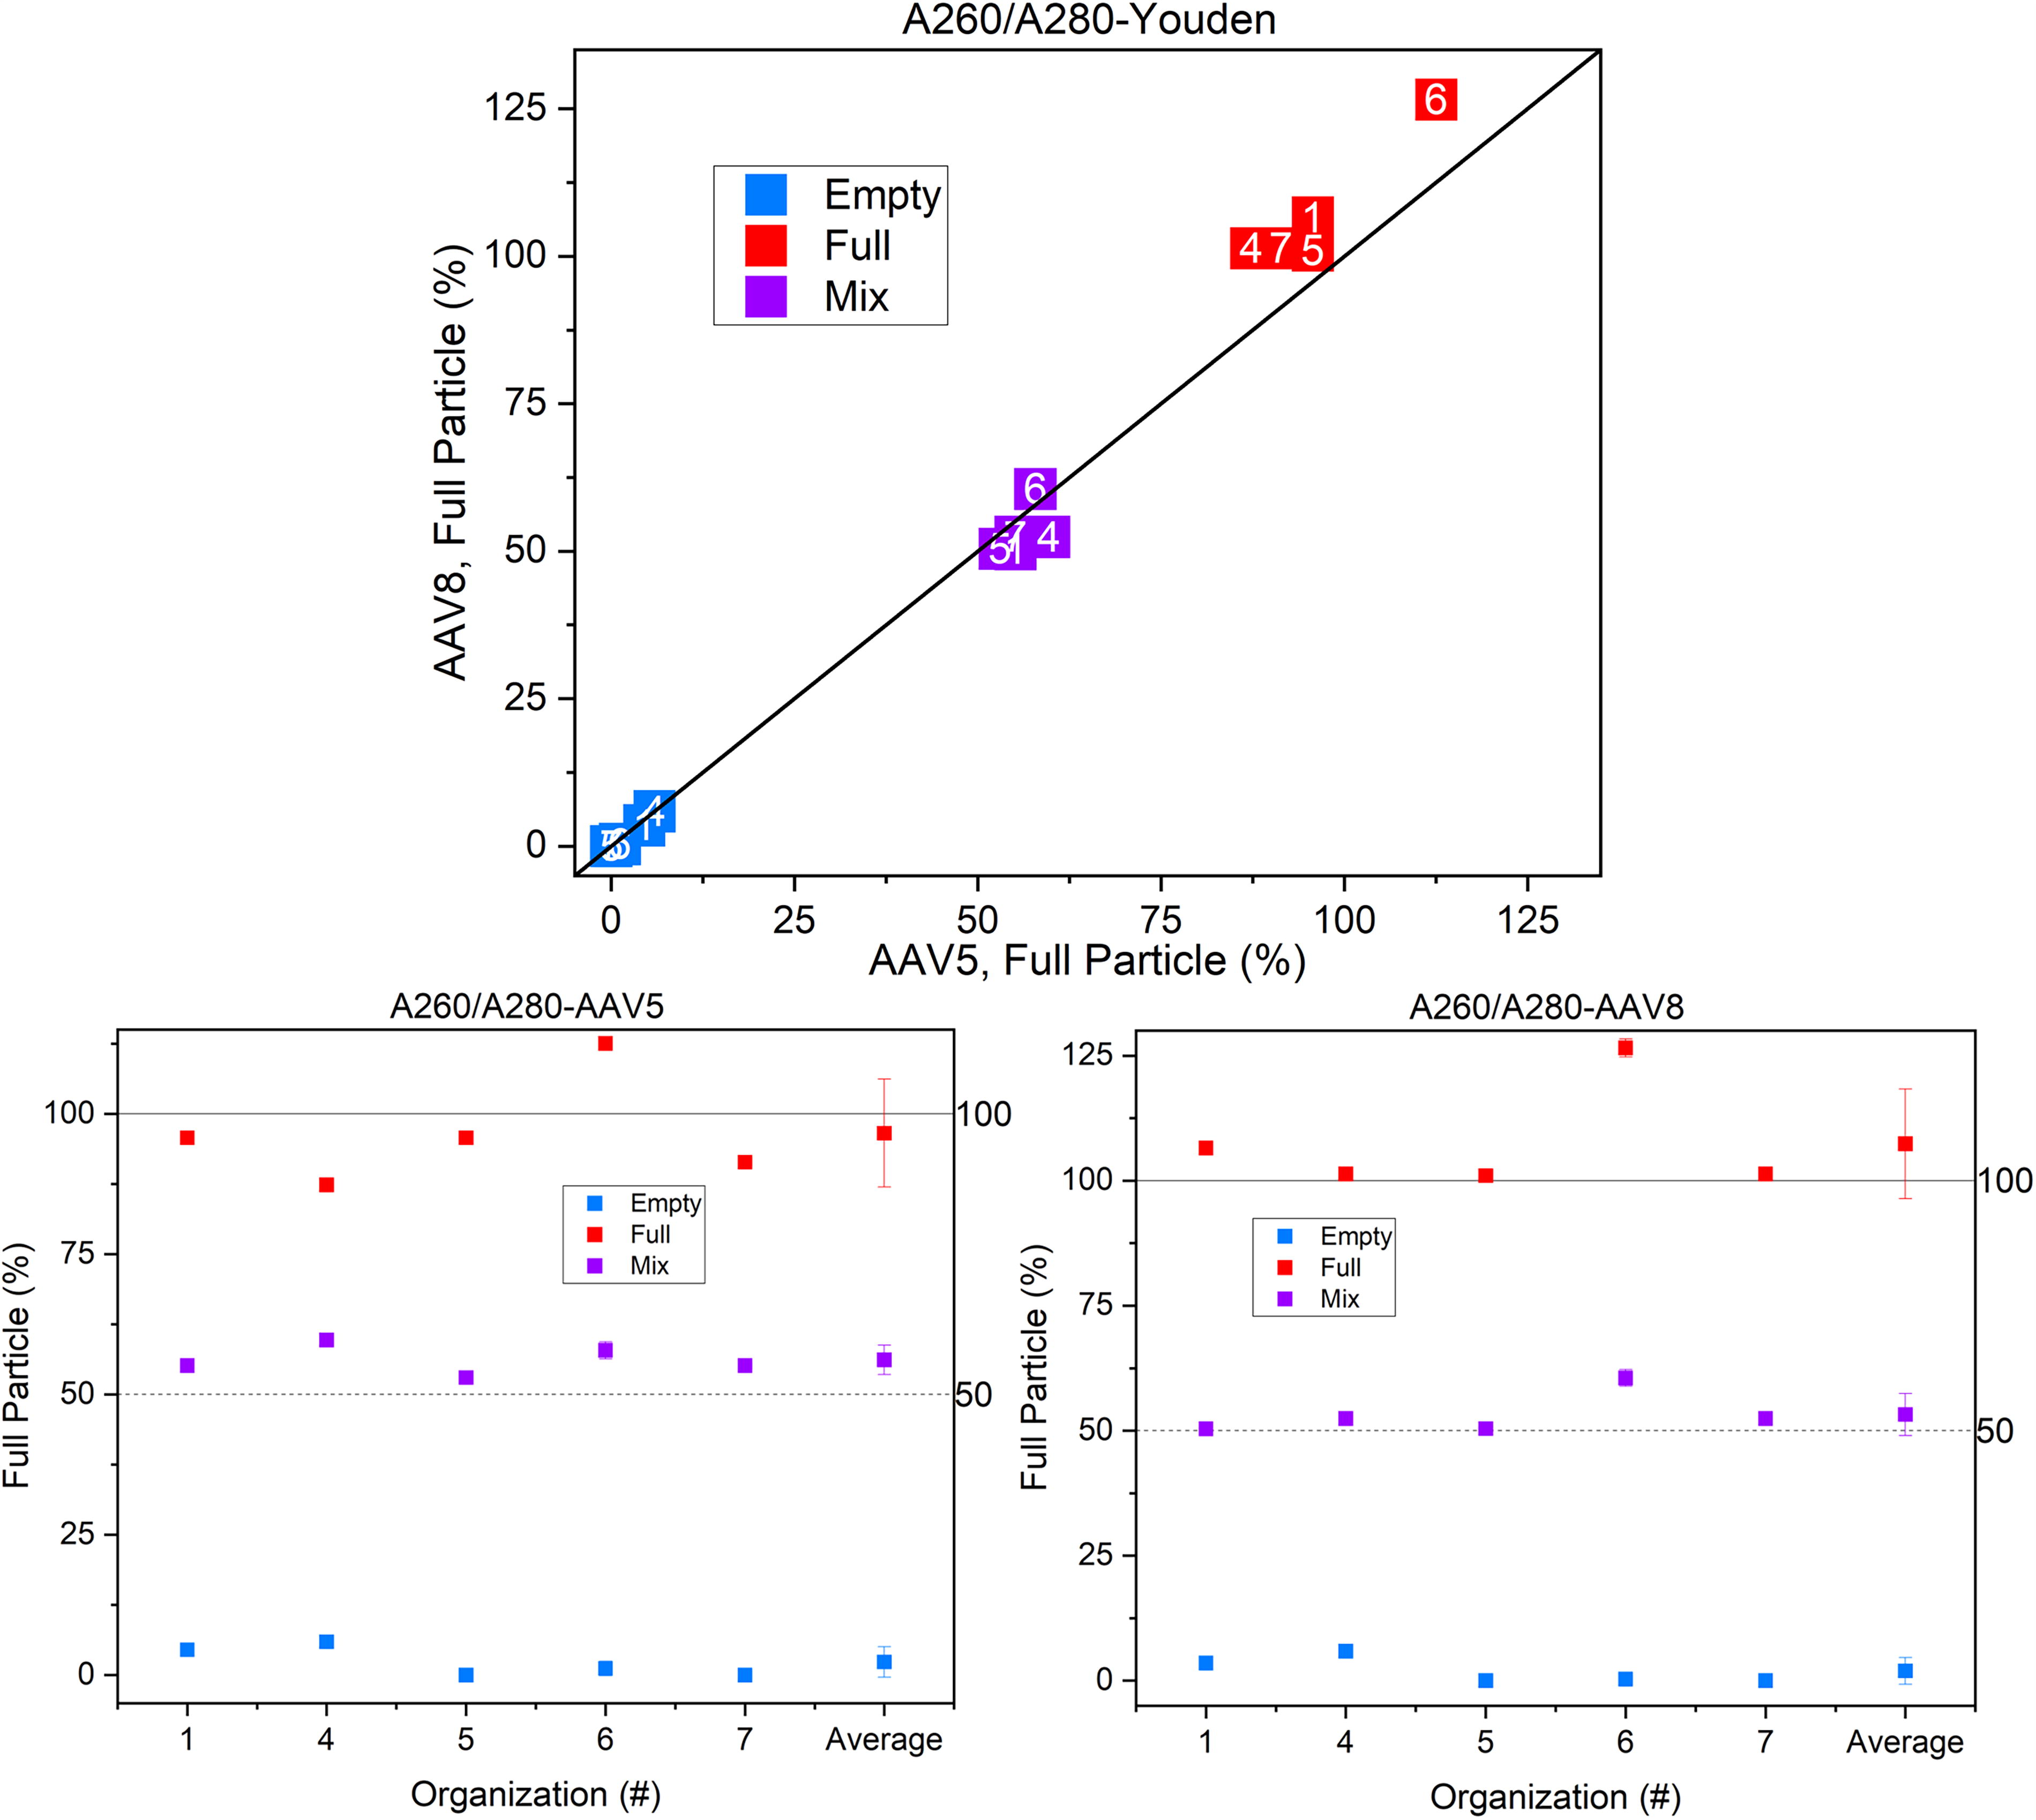
Ultraviolet-visible spectrophotometry measurements of AAV5 and AAV8 particles. The bottom two graphs show individual organization measurements of each sample and the graph above is the Youden plot for the data. Errors reported here are the average ± SD. (All data shown from hereon are labeled by the organization that collected it. This is concordant with the experimental parameters reported in the Supplementary Information file.)
The empty and mix samples demonstrate substantial agreement both between and within laboratories. The empty samples show a small detected full particle number, likely caused by contaminants not removed by purification. The full samples show a larger variation and show slightly larger measured FTT values for the AAV8 versus AAV5 serotypes. Although UV spectrophotometry gives good repeatability and reproducibility, it is important to note UV spectrophotometry only examines the amounts of total DNA and total protein in the sample. It cannot differentiate free DNA, partially filled, or overfilled capsids. UV spectrophotometry does not include a separation step and so cannot account for any contaminants or aggregates. In addition, the size of AAV particles is sufficiently large to introduce scattering-related artifacts. Since scattering increases the observed absorbance values in a wavelength-dependent manner, failing to account for it will result in the incorrect value for the A260/A280 ratio, introducing a systematic error into the calculated FTT. Laboratories implementing scattering correction showed slightly higher reported FTT values than laboratories that did not. The A260/A280 ratio is of interest because of its simplicity and minimal sample volumes.
PCR–ELISA is perhaps the most common approach to measure FTT. In this two-measurement technique, PCR quantifies the number of transgene copies, and ELISA quantifies the viral capsid number. Combining these two values gives the FTT quantification as shown in Figure 3 using two different PCR probes: ITR and SV40. In this study, for both targets, results for both full and mix samples were highly discordant.
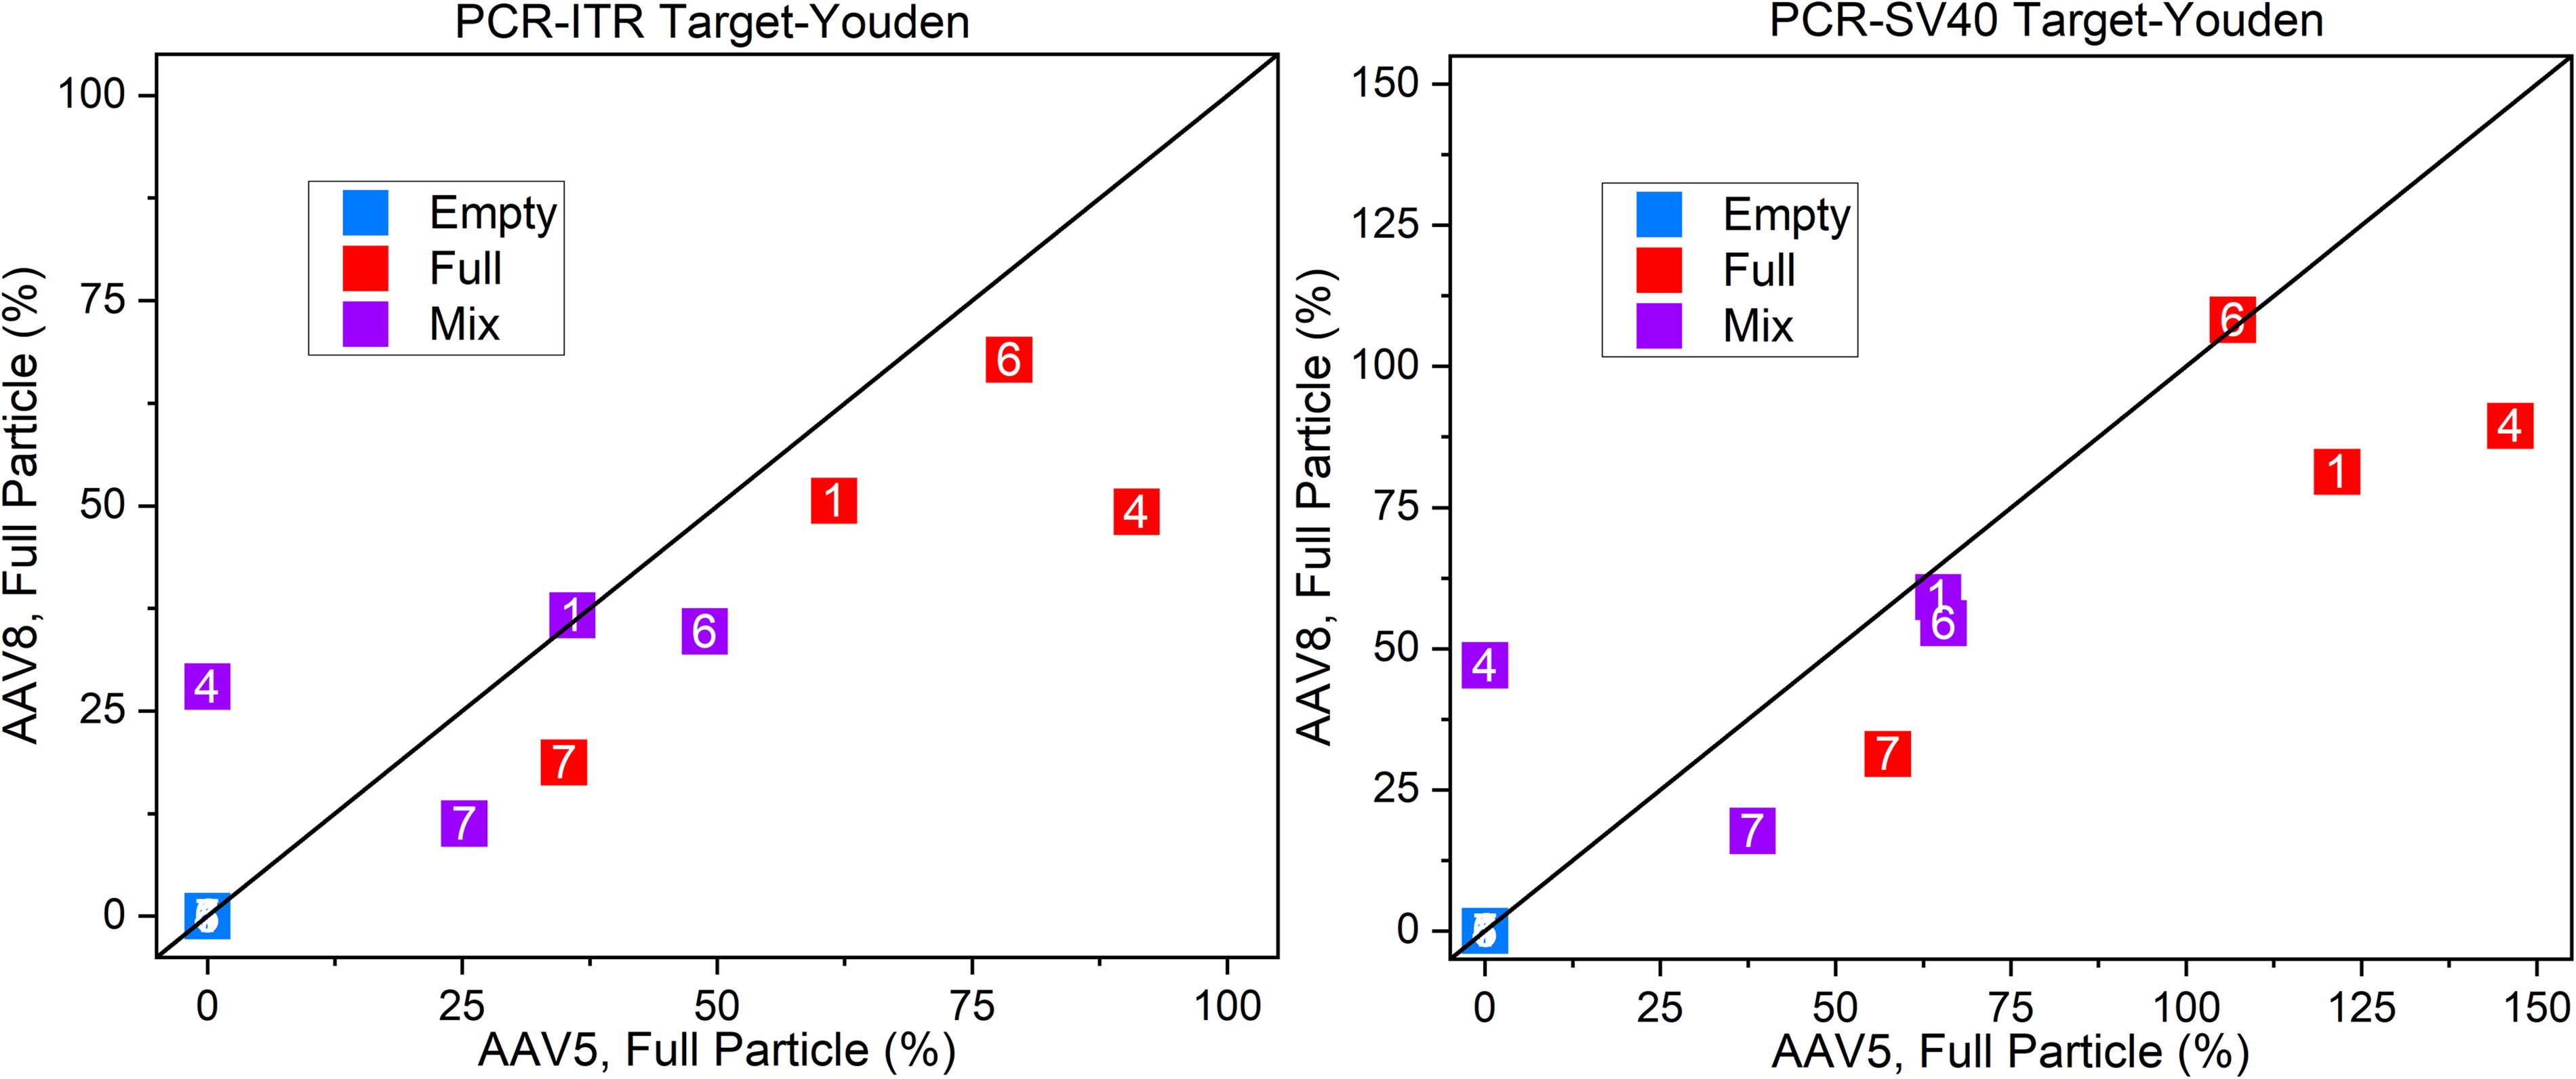
Youden plot comparison of PCR–ELISA measured values of FTT based on two different PCR target sequences showing a spread of data not closely associated with the 1:1 diagonal indicative of disagreement in values among and between laboratories.
Since the FTT measurements in Figure 3 are the composite of two distinct measurements—PCR for full particles and ELISA for total particles—we examined both PCR and ELISA data separately to determine the source of the FTT variability.
Figure 4 plots the PCR quantification of full particles. The PCR measurement identified some full particles in the empty samples—albeit at orders of magnitude lower than in the full or mix samples—the presence of these particles is not sufficient to be the source of the large discrepancy in full and mix samples shown in the lower panels in Figure 4. Agreement between AAV5 and AAV8 full particle count within single laboratories indicates internal repeatability (i.e., SD) as high as ≈8.8%. However, between laboratories differences are as large as a factor of two. Inspection of the participant data and protocols revealed the underlying variation in the full particle number measurement is likely caused by nonoptimal concentration of the PCR targets as well as variability in PCR protocols among participating laboratories. Different capsid lysis strategies may also have contributed to variations within PCR results from different labs. For both AAV5 and AAV8 full capsids, the measured analytical results were distributed around the manufacturer-reported CoA value of 5.0 × 10¹² vp/mL if the vp calculation was adjusted to vector genomes per milliliter (vg/mL) based on the assumption that all capsids were fully loaded with the genome.
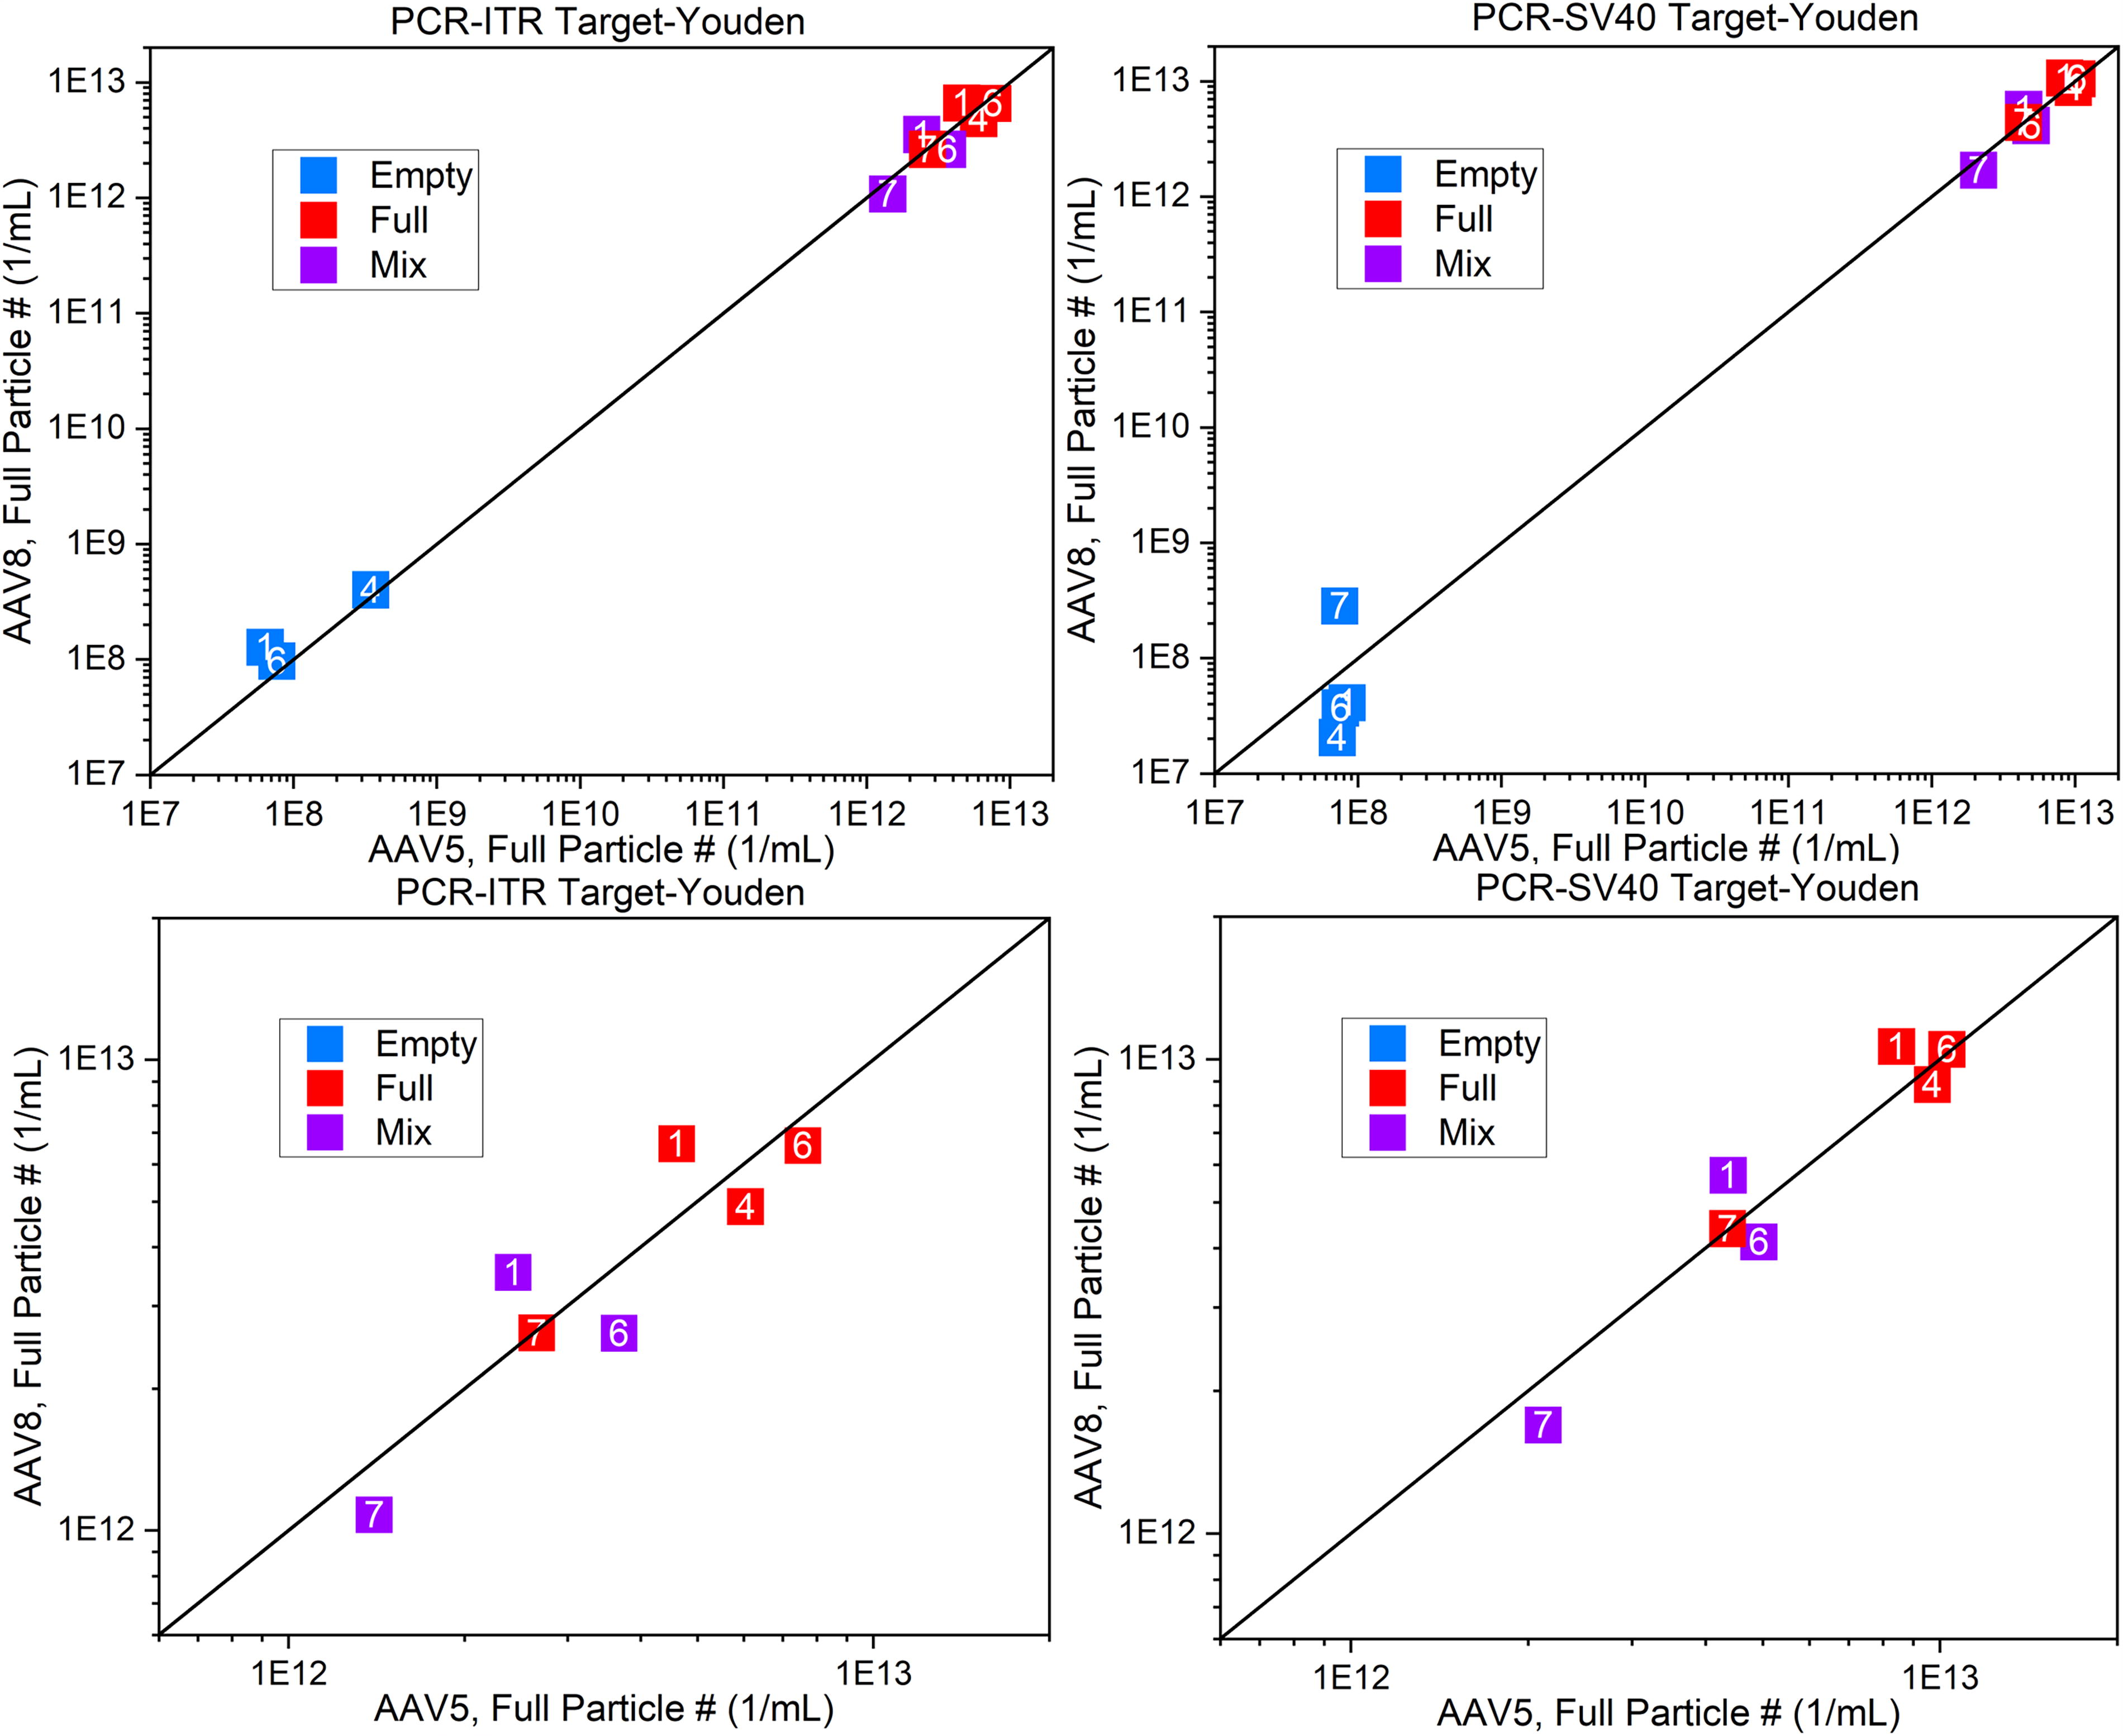
Comparison Youden plots for full particle content as measured by PCR. The upper panels are inclusive, whereas the lower panels are zoomed in to focus on the full and mix samples for comparison. (Note: Some mix sample data from Org. 4 is off scale and not visible.)
Figure 5 shows the total particle count for both ELISA and SEC–MALS measurements for all test samples. Notably, there is a difference between AAV5 and AAV8 total counts for ELISA (as shown in the distance orthogonal to the diagonal line), whereas SEC–MALS shows minimal differences, indicating some serotype dependence in ELISA. Data for both techniques across FTT measurements are greater than the manufacturer-supplied CoA value of 5.0 × 10¹² vp/mL, suggesting that this attribute could also benefit from future standardization efforts.
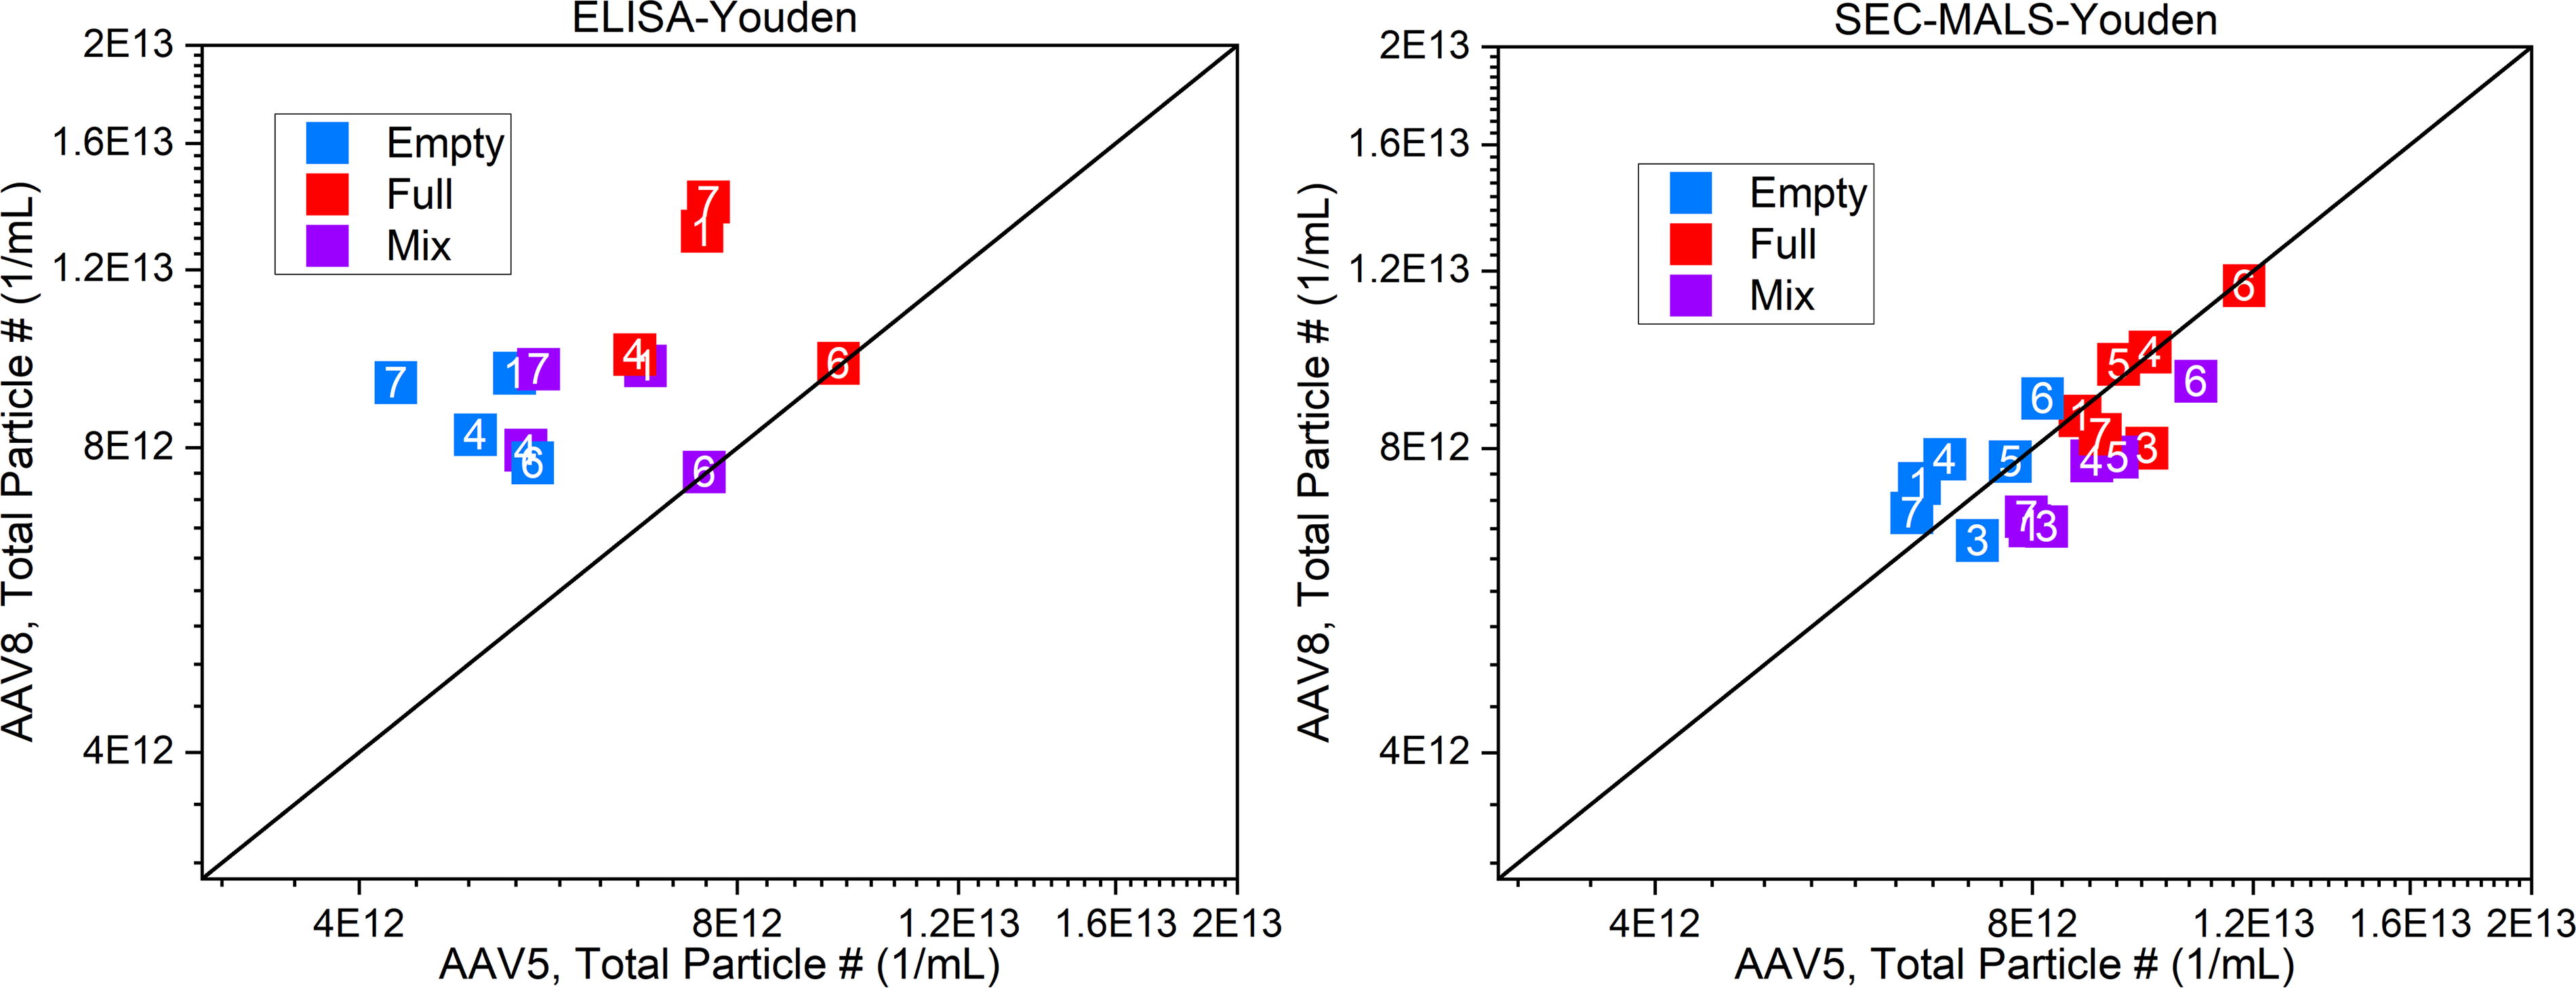
Comparison Youden plots based on measurement of the total particle count by ELISA and SEC–MALS. SEC–MALS, size exclusion chromatography with multi-angle light scattering.
The contributions from the spread of the PCR (Fig. 4) and ELISA (Fig. 5) results are approximately equal, and both contribute to discordant FTT values (Fig. 3). As the combined measurement incorporates error from both the PCR and ELISA measurements, the spread indicates that both contribute equally to the large observed variations in the PCR–ELISA FTT measurements. The very high variation both within and between laboratories demonstrates PCR–ELISA should not be used for quantitative FTT determination without further method development and harmonization.
The AUC data (Fig. 6) indicate that AAV5 and AAV8 values for each laboratory are internally consistent (repeatable), but the spread along the diagonal indicates significant differences between laboratories (less reproducible), particularly for the mix sample. The lower reproducibility is likely because the sedimentation profile analysis is more complex for the mix sample. As AUC can detect and quantitate partially filled capsids (in contrast to SEC–MALS, A260/A280), the amount of DNA in the capsid or the magnitude of their “fullness” must be measured or estimated to determine their contribution to the FTT value. Here the partially filled capsids were estimated to have 75 wt% of the total genome. The factor of 0.75 is a best estimate of the amount of DNA in partially filled AAV particles as measured by cryo-EM. For completeness and understanding, this is mathematically stated in Eq. (1):
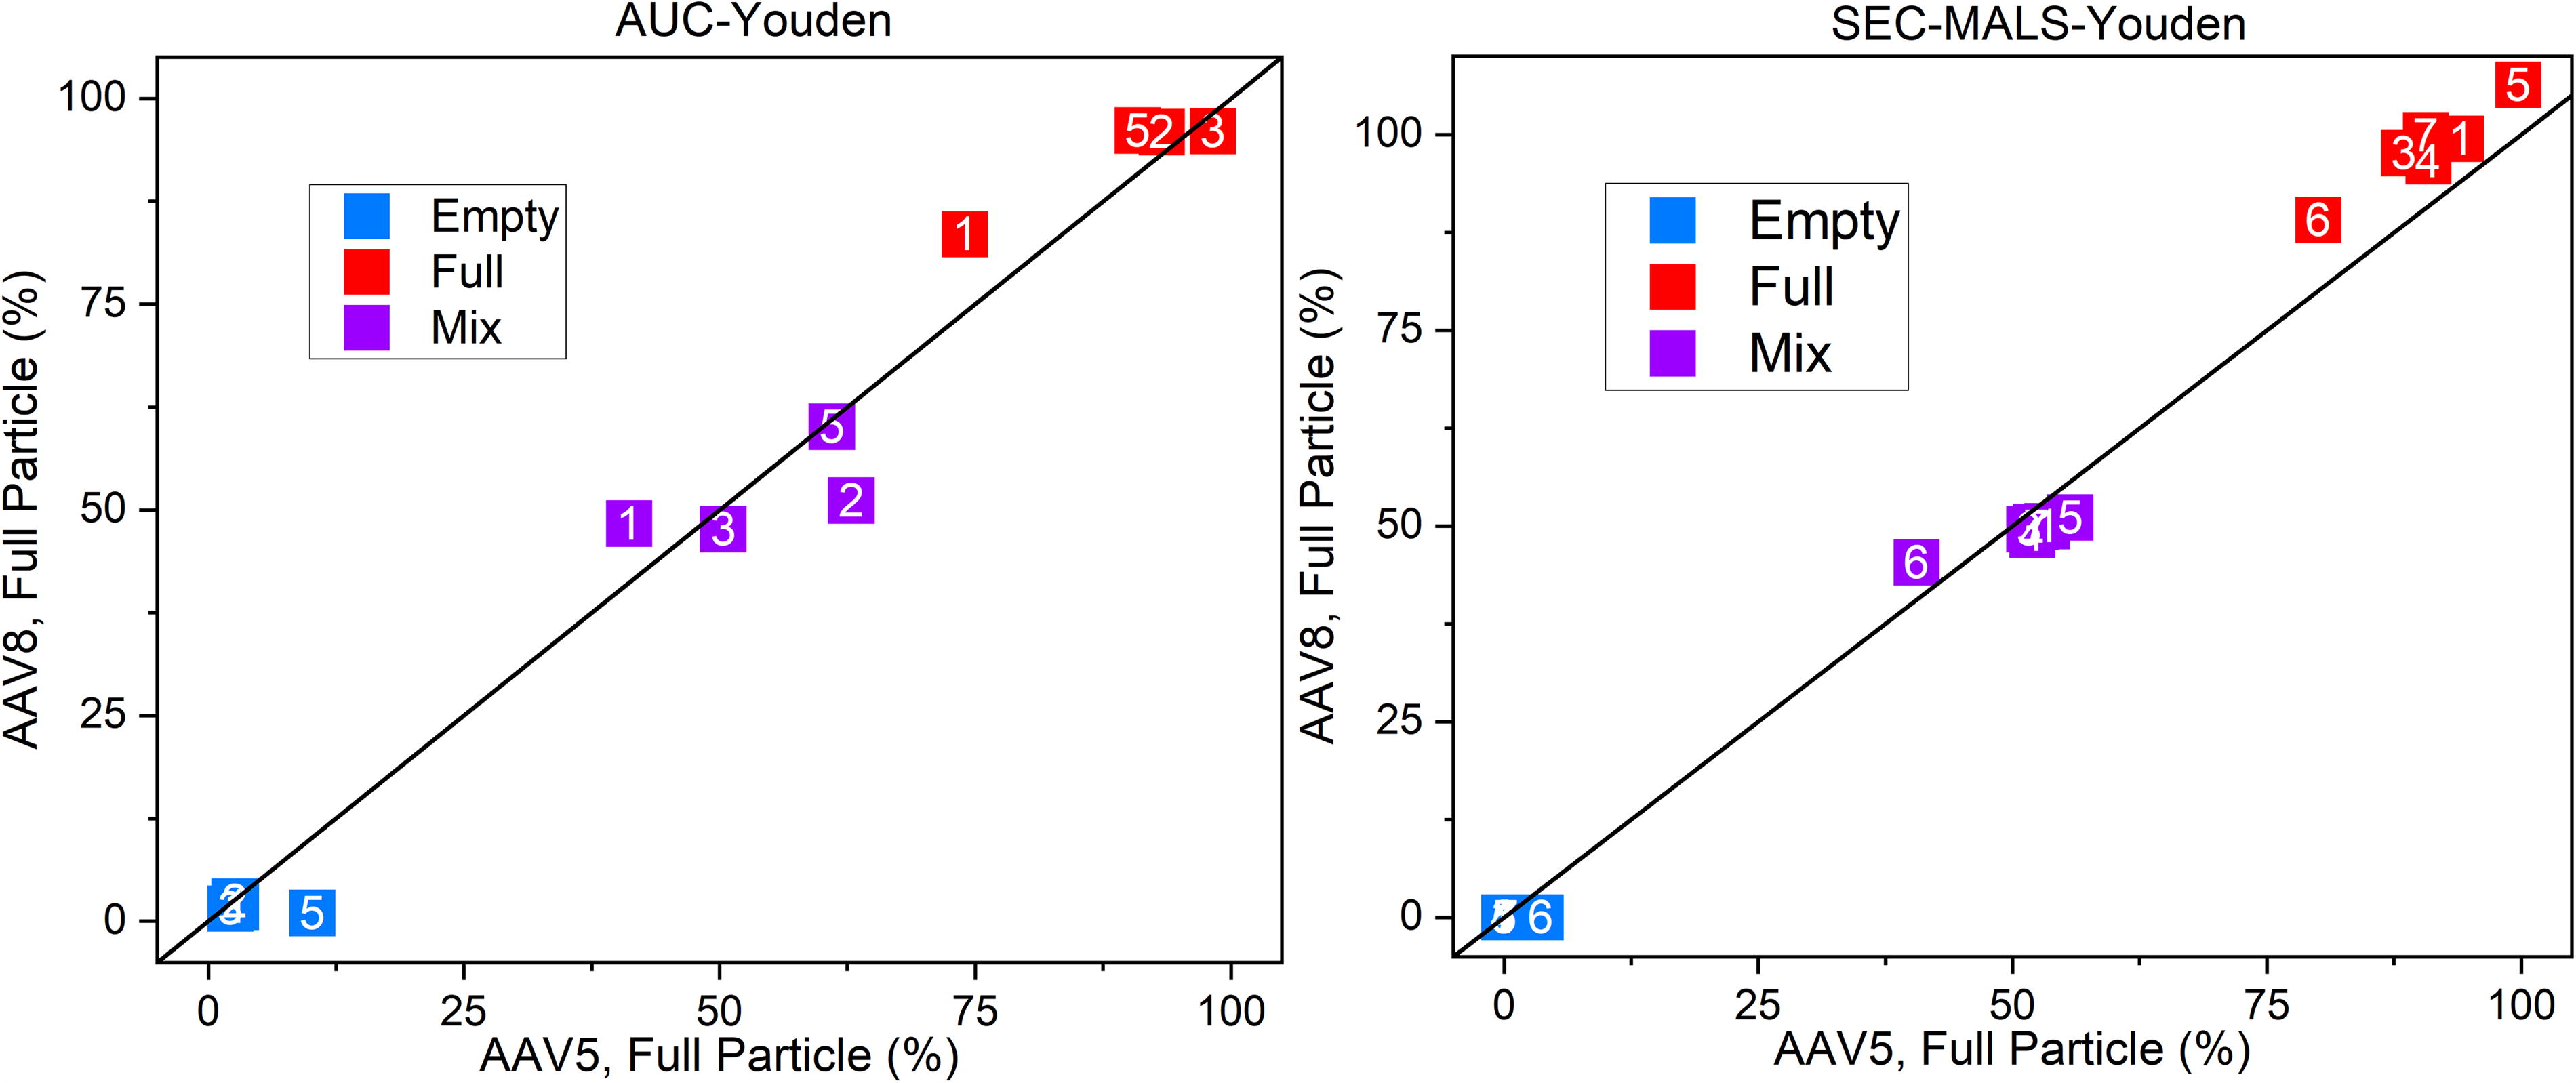
AUC and SEC–MALS Youden plot data for FTT quantification. FTT, full-to-total.
There is limited and differing guidance in the literature for optimum AUC operational parameters or appropriate DNA concentration assignment to determine accurately partially filled capsids contribution to the FTT value. 24 It is possible that with a standard protocol for AUC operation and data analysis, a more congruent assay of FTT across laboratories would be possible. Greater AUC harmonization would be valuable because AUC is the only traditional analytical technique with separation selectivity for partially full AAV particles. Partially full particle count and DNA content are of paramount importance in AAV characterization, as these particles have no therapeutic value but can elicit immunogenic responses. 25
The SEC–MALS data (Fig. 6) demonstrates better concordance than the AUC data with minor variability in the full particle sample but overall good agreement both within and between laboratories. This concordance is likely due to participants implementing almost identical methods with similar instrumentation to measure the FTT. SEC–MALS (with UV–Vis and/or dRI) cannot distinguish partially filled capsids from a mixture of full and empty capsids; here, partially Full particles contribute to the FTT the same as a mixture of empty and full weighted by absorbance-measured DNA content. An advantage of SEC–MALS and other chromatographic methods is that most impurities will be isolated from the AAV particles prior to optical detection, enabling measurements with generally reduced background signal. SEC–MALS could be implemented as a general method with AUC being used for more complete analysis as necessary.
This study was designed to assess interlaboratory variations in physicochemical measurements of AAV particles. The PCR–ELISA technique is commonly used, but significant variation in reported values between laboratories shows that this is a problematic measurement method as done here (allowing individual laboratories to apply their own analysis procedure). This is not to say that PCR–ELISA could not (or should not) be used for FTT measurement of AAV. We conclude from this data that without method harmonization, the interlaboratory variation is of such significance that these measurements should not be considered quantitative. AUC is considered a gold standard technique for AAV characterization, with good internal consistency (repeatability) in reported FTT values. The variation (reproducibility) in AUC measurements between laboratories could be minimized with a harmonized methodology. We implemented a standard data analysis protocol, which did slightly improve agreement (not shown; data analysis protocol is shown in Supplementary Data). It is possible that with a standard experimental protocol for AUC, a more consistent assessment of FTT across laboratories would be possible. SEC–MALS and/or UV spectrophotometry seem to be of high utility for FTT measurements.
Recent reports offer well-done methodological surveys of the measurement of AAV particles. 26 –28 However, these typically focus on only one or two measurements of the FTT without a larger measurement context across an array of techniques. The overall interlaboratory measurement landscape has not been assessed, although some broader scope reviews of the therapeutic approach are available. 29,30 As new measurement techniques such as charge detection mass spectrometry, mass photometry, capillary electrophoresis immunoassay, and capillary isoelectric focusing become available, knowledge of the reproducibility of existing methods is necessary to provide a rational basis for choosing appropriate methods. 31 Rapid expansion of AAV therapies highlights the importance of understanding the quantitative capabilities of physicochemical characterization. This is especially critical for the distribution of empty and full, as well as other particles (e.g., partially filled, or overfilled), as well as their individual particle counts. The results presented here provide guidance on present capabilities and on opportunities for improved measurement standardization and harmonization. Even relatively mature techniques such as AUC have opportunities for method harmonization and/or possible development and implementation of standards and/or calibrants. The promise of AAV-based therapies can be better realized with harmonized characterization methods. This represents an initial effort in that direction.
Footnotes
ACKNOWLEDGMENTS
The authors wish to thank Angie Snell Bennett at NIIMBL for providing outstanding program planning. They wish to thank Kelvin Lee, Chris Roberts, and Eric Hacherl at NIIMBL for scientific guidance. They thank John Kokai-Kun at USP for general scientific guidance on this project.
AUTHORS’ CONTRIBUTIONS
D.C.R., W.N.V., D.Mc.C., and J.R.: Conceptualization. J.J., W.N.V., S.E.L., C.M.S., J.A.F., R.G.C., and T.C.: Methodology. S.E.L., W.N.V., J.J., S.A.-H., S.A., A.A., H.B., I.L.B., T.E.C., IV, J.Z.D., B.L.D., C.E., J.A.F., T.G., J.H., L.D.H., V.M.H., A.J.L.H., M.H., S.K., B.K., A.L., L.M., E.N., V.O., A.P., T.W.P., H.R., R.R., F.S., C.M.S., S.S., A.V., S.W., N.W., Z.Y., and B.Z.: Data collection. S.E.L., W.N.V., J.J., S.A.-H., S.A., A.A., H.B., I.L.B., T.E.C., I.V., J.Z.D., B.L.D., C.E., J.A.F., T.G., J.H., L.D.H., V.M.H., A.J.L.H., M.H., S.K., B.K., A.L., L.M., E.N., V.O., A.P., T.W.P., H.R., R.R., F.S., C.M.S., S.S., A.V., S.W., N.W., Z.Y., and B.Z.: Data analysis. S.E.L. and W.N.V.: Writing—original draft preparation. S.E.L., W.N.V., J.J., I.L.B., T.E.C., IV, J.Z.D., J.A.F., T.G., V.M.H., T.W.P., R.R., C.M.S., A.V.: Writing—review and editing.
DATA AVAILABILITY STATEMENT
AUTHOR DISCLOSURE
No competing financial interests exist.
FUNDING INFORMATION
This study was supported in part by the National Institute of Standards and Technology through
SUPPLEMENTARY MATERIAL
Supplementary Data
References
Supplementary Material
Please find the following supplemental material available below.
For Open Access articles published under a Creative Commons License, all supplemental material carries the same license as the article it is associated with.
For non-Open Access articles published, all supplemental material carries a non-exclusive license, and permission requests for re-use of supplemental material or any part of supplemental material shall be sent directly to the copyright owner as specified in the copyright notice associated with the article.