
Abstract
Cystic fibrosis (CF) is caused by mutations in the gene encoding the CF transmembrane conductance regulator (CFTR) protein. Although CF affects multiple organs, lung disease is the main cause of morbidity and mortality, and gene therapy is expected to provide a mutation-agnostic option for treatment. SP-101 is a recombinant adeno-associated virus (AAV) gene therapy vector carrying a human CFTR minigene, hCFTRΔR, and is being investigated as an inhalation treatment for people with CF. To further understand SP-101 activity, in vitro studies were performed in human airway epithelia (HAE) derived from multiple CF and non-CF donors. SP-101 restored CFTR-mediated chloride conductance, measured via Ussing chamber assay, at a multiplicity of infection (MOI) as low as 5E2 in the presence of doxorubicin, a small molecule known to augment AAV transduction. Functional correction of CF HAE increased with increasing MOI and doxorubicin concentration and correlated with increasing cell-associated vector genomes and hCFTRΔR mRNA expression. Tropism studies using a fluorescent reporter vector and single-cell mRNA sequencing of SP-101-mediated hCFTRΔR mRNA demonstrated broad expression in all cell types after apical transduction, including secretory, ciliated, and basal cells. In summary, SP-101, particularly in combination with doxorubicin, shows promise for a novel CF treatment strategy and strongly supports continued development.
INTRODUCTION
Gene-based therapy has become a reality for the treatment of several diseases, and many exploratory applications are being evaluated. Despite the success of gene delivery to the lungs of animal models, 1,2 gene delivery to human airways as a potential treatment for cystic fibrosis (CF) pulmonary disease has been inadequate to date. 3,4 Innovative gene therapies are currently in clinical trials for CF that examine adeno-associated virus (AAV), herpes simplex virus, antisense oligonucleotides, and mRNA-based approaches (NCT06526923, NCT05248230, NCT05504837, NCT05095246, NCT06429176, NCT05668741, NCT05712538, NCT06237335). Although each vector system has strengths and weaknesses, AAV-based vectors have proven to be very successful for gene therapy. 5 The major weakness of AAV, the limited genomic capacity, is offset by many benefits, such as a stable capsid and successful production methods. However, high-dose AAV infusions are not without risk, as recently illustrated with the reported deaths of children with spinal muscular atrophy treated with ZOLGENSMATM and in subjects in a clinical trial for X-linked myotubular myopathy. 6,7 Despite this, the initial clinical successes and the safety profile at subtoxic doses provide a working range that may be adequate for the treatment of many diseases, including CF.
Another benefit of AAV is that it is amenable to molecular techniques, such as directed evolution, that can lead to the discovery of novel recombinant AAV capsids with enhanced tropism and transduction of target tissues. 5 Many studies have revealed that simple capsid changes are sufficient to redirect AAV tropism dramatically. An early study identified AAV2.5T, a vector that can transduce human airway epithelia (HAE) from the apical surface. 8,9 The AAV2.5T capsid is a hybrid of AAV2 and AAV5 with a single A581T mutation, changes that could not have been predicted to enhance apical airway transduction. To overcome the packaging limitation of AAV, Ostedgaard et al. discovered a shortened version of human CFTR that deletes a portion of the CFTR regulatory region (hCFTRΔR). 10 –12 Despite this deletion, hCFTRΔR retains full activity, regulation, and trafficking within airway cells. This deletion was sufficient to allow the inclusion of a small promoter and poly A sequence. To find a small promoter, Yan et al. screened a library of enhancers coupled to a minimal promoter (Tg83) and discovered a novel sequence, a combination of a 100 bp enhancer and an 83 bp minimal promoter (F5Tg83, also known as SP183), able to drive the expression of human and ferret CFTRΔR in well-differentiated HAE. 13 These components make up SP-101, an AAV2.5T capsid carrying the SP183 enhancer-promoter sequence driving expression of the hCFTRΔR minigene.
To obtain a greater understanding of the biology of SP-101, the relationship between the cell-associated vector copy number (VCN), hCFTRΔR mRNA expression, hCFTRΔR activity, and cellular tropism was undertaken in primary CF HAE from five different CF donors with different CF genotypes. Although SP-101 can efficiently enter CF HAE from the apical surface, hCFTRΔR mRNA expression and hence hCFTRΔR activity were limited. A growing body of evidence has shown that certain small molecules can enhance AAV-mediated transgene expression in multiple tissue types. 14 –16 One of these molecules, doxorubicin HCl, was previously tested in clinical trials in the lung 17 –19 and was chosen to further characterize its ability to enhance hCFTRΔR mRNA expression and functional correction of CF HAE. Although doxorubicin HCl did not affect VCN, there was a direct correlation between doxorubicin HCl concentration and both hCFTRΔR mRNA expression and hCFTRΔR activity, leading to functional correction of CF HAE. In addition, cell tropism was investigated by immunocytochemistry, confocal microscopy, and single-cell mRNA sequencing and demonstrated broad tropism. Taken together, SP-101 has tropism to multiple types of airway epithelial cells, and the combination of SP-101 with doxorubicin HCl is able to correct CF HAE equal to or exceeding levels of non-CF HAE.
MATERIALS AND METHODS
Human airway epithelia
Primary human bronchial airway epithelial cells (HAE) isolated from the lungs of non-CF and CF human donors were obtained from the Marsico Lung Institute (MLI) Tissue Procurement and Cell Culture Core, University of North Carolina (UNC), Chapel Hill, NC (Table 1). Primary HAE were isolated from discarded and de-identified trachea and bronchi of donor lungs and were analyzed anonymously. Passage 1 or 2 primary cells from multiple donors were expanded and polarized as previously described in detail by Fulcher and Randell. 20 Briefly, cells were expanded in Bronchial Epithelial Cell Growth Medium (BEGM; MLI, Chapel Hill, NC) on 10 or 15 cm plates coated with Purecol®-S Purified Bovine Collagen Type I&III (Advanced Biomatrix, Carlsbad CA; #5015–20) before seeding on 6.5-mm diameter polyester transwells with 0.4-μm diameter pores (Corning, Corning, NY; #3470) coated with Type IV collagen from Human Placenta (Millipore Sigma, St. Louis, MO; #C7521). Cells were submerged in the UNC Air-Liquid Interface (ALI) medium (MLI, Chapel Hill, NC) for 24 h at the apical and basal compartments before media was exchanged. Cells remained submerged for up to 5 days before the apical medium was removed to allow for differentiation at the air–liquid interface until they were fully polarized. ALI media was exchanged at the basal compartment every 2 or 3 days for at least 3 weeks before use. All cultures were estimated to contain ∼7.5E5 cells/well at the time of transduction.
List of donors
CF, cystic fibrosis; n/a, not applicable.
AAV vector
Recombinant SP-101 was generated by Catalent® Biologics, Baltimore, MD. Briefly, human embryonic kidney 293 (HEK293; ThermoFisher Scientific, Waltham, MA; #A3152801) cells were grown in serum-free, suspension culture conditions and triple plasmid transient transfected with pHelper, encoding the adenoviral helper genes, pRepCap, encoding the AAV2 Rep and AAV2.5T Cap genes, and pGOI encoding the hCFTRΔR gene. Following transfection, cells were harvested, lysed, treated with benzonase (EMD Millipore, Burlington, MA; #1016970010), and clarified using depth filtration. Material was concentrated and diafiltered using tangential flow filtration (TFF). Column chromatography was performed on the TFF material using an AKTA chromatography system prior to concentration via diafiltration. Titer was determined by droplet digital PCR (ddPCR). Recombinant AAV reporter, AAV2.5T-CBA-mCherry-SP183-gLuc, was generated at the Children’s Hospital of Philadelphia. The vector transgene and 2.5T RepCap plasmids were generated at the University of Iowa. 13 Vector integrity was verified using previously described methods. 13,15 Briefly, recombinant AAV was produced by co-transfection of adherent HEK293 cells with three plasmids and was purified by two rounds of CsCl2 ultracentrifugation. TaqMan quantitative reverse transcription polymerase chain reaction was used to quantify the titer of the purified viral stocks, as previously described. 21
AAV transduction
AAV vectors were diluted in ALI medium to a final volume of 50 μL and applied to the apical side of the polarized CF and non-CF HAE cells for ∼16 h. Doxorubicin HCl (doxorubicin-hydrochloride, also known as hydroxydaunorubicin hydrochloride, MedChem Express, Monmouth Junction, NJ; #HY-15142) was prepared at dilutions from 0 to 1 μM in ALI medium and added to the bottom chamber (basal side) of polarized cells throughout the ∼16 h period of transduction.
Control samples
Bronchial airway cells from two non-CF HAE donors (Table 1) served as positive controls. These cells have normal bioelectrical properties with functioning CFTR channels and generate current after CFTR stimulation with forskolin and IBMX (IscF&I). As an additional control, the functional correction of CF HAE was also measured in response to treatment with a triple combination of small molecule CFTR modulators (potentiator VX-770/ivacaftor, used at a concentration of 0.1 μM; correctors VX-661/tezacaftor, used at a concentration of 3.5 μM and VX-445/elexacaftor, used at a concentration of 3 μM) (VX-770/661/445, Medchem Express; #HY-13017/HY-15448/HY-111772). VX-770/661/445 served as a negative control in CF airway epithelia with Class I mutations (no CFTR protein to correct) and a positive control in CF HAE with Class II (F508del) or heterozygous with one Class I and one Class III (G551D) mutations. The VX-770/661/445 mixture was added to the basal media ∼16 h before the start of the Ussing chamber assay. For each Ussing assay run, one CF-HAE transwell transduced with an MOI of 1E5 vg/cell of AAV2.5T-CBA-mCherry-SP183-gLuc from the apical surface and 1 μM doxorubicin HCl in the basal media served as a negative control. As vehicle control, DMSO was added into the negative control sample in some runs (instead of forskolin/IBMX [F&I]).
Short-circuit current measurements (Ussing chamber assay)
One week after exposure to SP-101, doxorubicin HCl, or control treatments, the polarity of primary CF and non-CF HAE was confirmed using an Ohm meter (Millicell ERS-2 Voltohmmeter, Sigma-Aldrich, St. Louis, MO; #MERS00002), inserted into Ussing chambers (Physiological Instruments, Reno NV; #EM8-C), and short-circuit current (Isc) measurements were performed as previously described. 13 The basolateral chamber was filled with high-chloride HEPES-buffered Ringer’s solution (135 mM NaCl, 1.2 mM CaCl2, 1.2 mM MgCl2, 0.6 mM KH2PO4, 2.4 mM K2HPO4, 5 mM HEPES, 7.5 mM Dextrose; pH 7.4). The apical chamber was bathed in a low-chloride HEPES-buffered Ringer’s solution containing a 135 mM sodium gluconate substitution for NaCl. After clamping the transepithelial voltage to zero and measuring the baseline current, the following antagonists and agonists were sequentially added into the apical chamber: (1) Amiloride (100 μM) to block the activity of ENaC channels, (2) DIDS (100 μM) to block the activity of calcium-activated chloride channels, (3) combination of forskolin (10 μM) and IBMX (100 μM) to activate the CFTR or hCFTRΔR channels (reported as a positive current), and (4) Inh172 (420 μM) to block CFTR activity (the drop in current due to inhibition is reported as a negative current). The F&I-stimulated CFTR activity (IscF&I) was recorded, and peak activity was calculated using Acquire & Analyze software (Physiological Instruments, Reno, NV). The decrease from peak chloride current (Inh172, μA/cm2) for each cell line was calculated based on trace readings from Acquire & Analyze software for the current measured by the Ussing chamber measurement after adding Inh172.
Vector copy number per cell analysis
SP-101 VCN was quantified by ddPCR by measuring the SP-101 hCFTRΔR vector genome DNA present 7 days after transduction normalized to the cellular gene RPP30. Cells were harvested from transwell membranes immediately after Ussing chamber analysis. Total DNA was isolated using the DNeasy 96 Blood & Tissue kit (Qiagen, Germantown, MD; #69506) according to the manufacturer’s protocol, and the DNA concentration was determined using the Stunner (Unchained Labs, Pleasanton, CA). SP-101 hCFTRΔR vg and RPP30 copies were determined by ddPCR using specific primer/probe pairs according to the manufacturer’s protocol (Table 2). Briefly, each reaction was transferred to the QX200 Automatic Droplet Generator (BioRad, Hercules, CA; #1864101) followed by PCR amplification (BioRad; #C1000) in four steps: activation at 95°C (10 min), followed by 40 cycles of denaturation at 95°C (30 s) and annealing/extension at 60°C (1 min), followed by a single enzyme deactivation step at 98°C (10 min), and a final hold at 4°C upon completion. Droplets were read in a BioRad QX200 droplet reader (BioRad; #1864001). VCN was calculated, according to the manufacturer’s instructions, as the ratio of hCFTRΔR:RPP30 copies/μL multiplied by two since these cells are diploid and there are expected to be two copies of RPP30 per cell.
Primer and probe sequences used for ddPCR and RT-qPCR
ddPCR, droplet digital polymerase chain reaction; RT-qPCR, reverse transcription-quantitative PCR.
mRNA isolation and RT-qPCR
Expression of hCFTRΔR mRNA was quantitated by reverse transcription-quantitative polymerase chain reaction (RT-qPCR) analysis. Cells were harvested from transwell membranes that matched the Ussing and DNA samples 7 days after transduction. Total RNA was isolated using an RNeasy Plus 96 kit (Qiagen; #74034). RNA concentration was determined using the Stunner (Unchained Labs). After isolation, 500 ng of the total RNA was treated with Turbo DNase (Turbo DNA-free kit, Ambion, Waltham, MA; #AM2238) according to the manufacturer’s protocol to eliminate residual vector genome DNA. Subsequently, the SuperScript® III First-Strand cDNA Synthesis kit (Thermo Fisher Scientific; #18080400) was used for RT and cDNA synthesis according to the manufacturer’s protocol. Approximately 15 ng of cDNA was used in qPCR using primers and probes specific for hCFTRΔR and GAPDH (housekeeping reference gene). Absolute quantitation of hCFTRΔR transcripts/μg RNA was determined relative to a standard curve generated using a plasmid encoding hCFTRΔR (Table 2). As a negative control, qPCR was performed on Turbo DNase-treated RNA without RT. No signal was observed in no RT or no template negative controls.
Western blot
To test for protein expression, cell lysates from untreated A549 cells, CaLu-3, non-CF HAE (DD013O), and untreated and transduced CF HAE (KKD029O; MOI 1E5 vg/cell SP-101 with 1 μM doxorubicin HCl) were collected 7 days after transduction. A549 cells do not express CFTR and serve as negative control. Calu-3 cells constitutively express CFTR and serve as positive control. Blots were stained with antibodies against CFTR (UNC-596, University of North Carolina, Chapel Hill, NC) and β-actin (Cell Signaling, Danvers, MA; #4970). Cell lysates were subjected to gel electrophoresis before transferring to a nitrocellulose membrane using the iBlot dry blotting system (ThermoFisher Scientific; #PS0350). The membrane was cut into two portions, one with MW >75 kD for CFTR (UNC-569) and another with MW <75 kD for β-actin detection. Primary and secondary antibodies were incubated using the iBind FLEX system (ThermoFisher Scientific; #SLF2000), and the signal was detected using Super Signal West Femto chemiluminescence (Pierce Biotechnology, Waltham, MA; #34094) on the iBright Imager (ThermoFisher Scientific; #IB21001).
Lactate dehydrogenase assay measurements
To test for toxicity, 500 μL of ALI medium was removed from the basal side of all HAE transwells 48 h after transduction (24 h after media exchange) and 7 days after transduction (DAT), before the Ussing chamber assay. Collected media was assessed using the lactate dehydrogenase (LDH) colorimetric assay kit (Sigma-Aldrich; #MAK066 or Abcam, Waltham, MA; #AB102526). To perform the assay, 10 μL from each 500 μL sample ALI medium was mixed with LDH substrate/buffer mix. The assay was run alongside a nicotinamide adenine dinucleotide (NADH) standard curve and an LDH positive control for 45 min at 37°C. The readings from time points within the standard curve were used to calculate LDH activity units. An LDH activity unit is the amount of enzyme that catalyzes the conversion of lactate to pyruvate to generate 1.0 μmol of NADH per minute at pH 8.8 at 37°C, reported in the units of nmol/min/mL, or more simply mU/mL. The cytotoxicity cutoff was set at 10 mU/mL, which represents approximately two times the average LDH value for non-CF, non-treated cells across all donors at the 2 DAT timepoint.
Transepithelial electrical resistance measurements
Transwell transepithelial electrical resistance (TEER) was measured using the ERS-2 chopstick Voltohmmeter (Millipore Sigma; #MERS00002) before the Ussing chamber assay according to the manufacturer’s instructions. Briefly, transwells were incubated with HEPES-buffered Ringer’s solution on the basal side and low-chloride HEPES-buffered Ringer’s solution on the apical side for 15 min prior to measurement, converted to Ω cm2, and HAE with values >100 Ω cm2 were considered polarized and used in the Ussing chamber assay. Baseline TEER readings were also measured upon insertion in the Ussing chambers. The first resistance time point reading was taken from the Acquire and Analyze software (Physiologic Instruments, Reno, NV; #EM8-C). Initial transwell TEER values <90 Ω cm2 were considered nonpolarized and not used. Cutoffs were determined based on HAE able (above the cutoff) or unable (below the cutoff) to generate baseline currents in the Ussing chamber assay successfully.
Immunocytochemistry and confocal microscopy
CF HAE transduced with MOI 1E5 vg/cell AAV2.5T-CBA-mCherry-SP183-gLuc in the presence of 1 μM doxorubicin HCl were fixed for 30 min in 4% formaldehydein phosphate-buffered saline (PBS) and stained for α-tubulin (EMD Millipore; #MAB1864), MUC5AC (ThermoFisher; #45M1), Phalloidin (F-actin, ThermoFisher; #A22287), mCherry (ThermoFisher; #PA5-34974), and DNA (Hoechst 33342, ThermoFisher; #H3570) followed by species-specific secondary antibodies (ThermoFisher; Alexa Fluor™). Qualitative and quantitative reviews of positive and negative controls characterized morphological differences and co-expression with α-tubulin (ciliated cells), MUC5AC (secretory cells), and the mCherry reporter protein via immunostaining. Specimens were digitally imaged using a Leica Stellaris 5 confocal microscope (Leica, Deerfield, IL). Image brightness and contrast were adjusted using the postprocessing software, FIJI. To obtain representative images, parameters from each field were adjusted independently for increased visual clarity and cell-type identification. Displayed fields were projected from z-stack “slices,” encompassing the entire thickness of each culture.
Flow analysis
CF and non-CF HAE transduced with MOI 1E5 vg/cell AAV2.5T-CBA-mCherry-SP183-gLuc in the presence of 1 μM doxorubicin HCl were detached from transwells using TrypLE Express (GIBCO, Waltham, MA; #12604–013) 7 days after transduction. Detached cells were centrifuged at 600g for 5 min in PBS and resuspended with 100 μL of Fixable Zombie VioletTM dye (BioLegend, San Diego, CA; #423114) (1:50 dilution of reconstituted Zombie Violet dye in Dulbecco's PBS (DPBS)) to stain dead cells. Cells in Zombie Violet dye were incubated at room temperature in the dark for 15 min, centrifuged at 600g for 5 min, and resuspended in 500 μL of Cell Staining Buffer (BioLegend; #554656) to wash. Finally, cells in the buffer were centrifuged at 600g for 5 min and resuspended in 800 μL of flow buffer (2% FBS, 5 mM EDTA in DPBS) for flow cytometry analysis. Samples were run in triplicates in a flat bottom 96-well plate using the CytoFlex S flow cytometer (Beckman-Coulter, Brea, CA). Each well was set to collect 20,000 events and analyzed under mCherry (ECD) and PB450 fluorescent channels, with a 488- and 405-nm laser, respectively. Acquisition gain settings were FSC—55, SSC—80, PB450—8, and mCherry—70. The resulting events were gated and analyzed using FlowJo software (Becton Dickinson, Franklin Lakes, NJ). The initial 20,000 events were first gated to remove the debris population as determined by an FSC-A versus SSC-A dot plot. Live cells were gated using an FSC-A versus PB450 dot plot, and single cells with FSC-A versus FSC-H dot plot. These isolated events were divided into mCherry-positive or-negative groups, so the mCherry-positive population was not greater than 1% for any untransduced condition. Median fluorescence intensity was calculated with the FlowJo statistics function for all mCherry-positive populations.
Single-cell RNA sequencing
Primary CF HAE were exposed to 1 μM doxorubicin HCl in the basal medium with or without MOI 1E5 vg/cell SP-101 at the apical surface, as indicated above. Cells were detached from transwells using TrypLE Express (GIBCO, Waltham, MA; #12604-013) containing 1 U/mL DNase I (ThermoFisher; #18047019) 7 days post-transduction. Dissociated cells were resuspended in DPBS (without calcium or magnesium; GIBCO; #14190-144) containing 1 U/mL SUPERase·In RNAse inhibitor (RI-DPBS, ThermoFisher; #AM2694) and pelleted at 300g for 10 min at 4°C. The cell pellet was resuspended in 1 mL of RI-DPBS containing 0.04% BSA, followed by cell count and viability (>90%). Cells were subjected to single-cell RNA sequencing using the 10x Genomics Chromium Controller single-cell platform (10x Genomics, Pleasanton, CA). Briefly, ∼20,000 cells per sample were loaded into each lane of a 10x Genomics G chip, and single-cell droplets were generated using the Chromium Next GEM single-cell 3′ kit v3.1 (10x Genomics, Pleasanton, CA). cDNA synthesis and amplification, library preparation, and indexing were performed using the 10x Genomics Library Preparation kit, according to the manufacturer’s instructions. Overall library size was determined using the Agilent Bioanalyzer 2100 and the High Sensitivity DNA assay, and libraries were quantitated using KAPA real-time PCR. Libraries were pooled and sequenced on the NextSeq 2000 using a P3 300 cycle kit (Illumina, San Diego, CA), paired-end run with a custom sequencing setting of 26 and 328 bp for reads 1 and 2, respectively, to obtain a target sequencing depth of 60,000 reads per cell. Raw sequencing reads were processed using the 10x Genomics Cell Ranger v.7.1.0 pipeline and showed ∼30,000 reads per cell. A custom human genome reference was built using the Cell Ranger mkref (Cell Ranger v.7.1.0) command using the Ensembl GRCh38 release 93 reference genome FASTA and GTF files and the sequence of hCFTRΔR as added transgene. Reads were demultiplexed by the sample index using the Cell Ranger mkfastq command. FASTQ files were aligned to the custom transcriptome, cell barcodes were demultiplexed, and UMIs corresponding to genes were counted using the Cell Ranger count command and default parameters. Each sample was processed in separate runs of Cell Ranger count. Finally, each sample output file from each run of Cell Ranger count was combined using the Cell Ranger aggr command to produce one single feature-barcode matrix and a “.cloupe” file for visualization and analysis with Loupe Browser v.6.4.1. Alignment, normalization, and dimensionality reduction were performed using Cell Ranger v.7.1.0. Cells with a mitochondrial RNA content of >20%, cells with >20,000 UMI count, and >5,000 gene features were discarded using the Loupe Browser v.6.4.1. QC measures removed 3,326 cells from the total of 24,299, yielding a dataset of 20,973 cells. Major cell populations were separated by an initial round of clustering and classified based on the expression of known marker genes (https://www.lungmap.net/cell-cards/) 22 and manual curation of the clusters in the UMAP space.
Statistical analysis
Statistical analyses were performed using GraphPad Prism 8.4.3 (GraphPad Software, Inc., San Diego, CA), JMP software from SAS (Version 16 JMP, Cary, NC), and Biodata Solutions using R software (version 4.3.0). Unless otherwise indicated, the average ± standard deviation of 3 or more airway epithelia is shown.
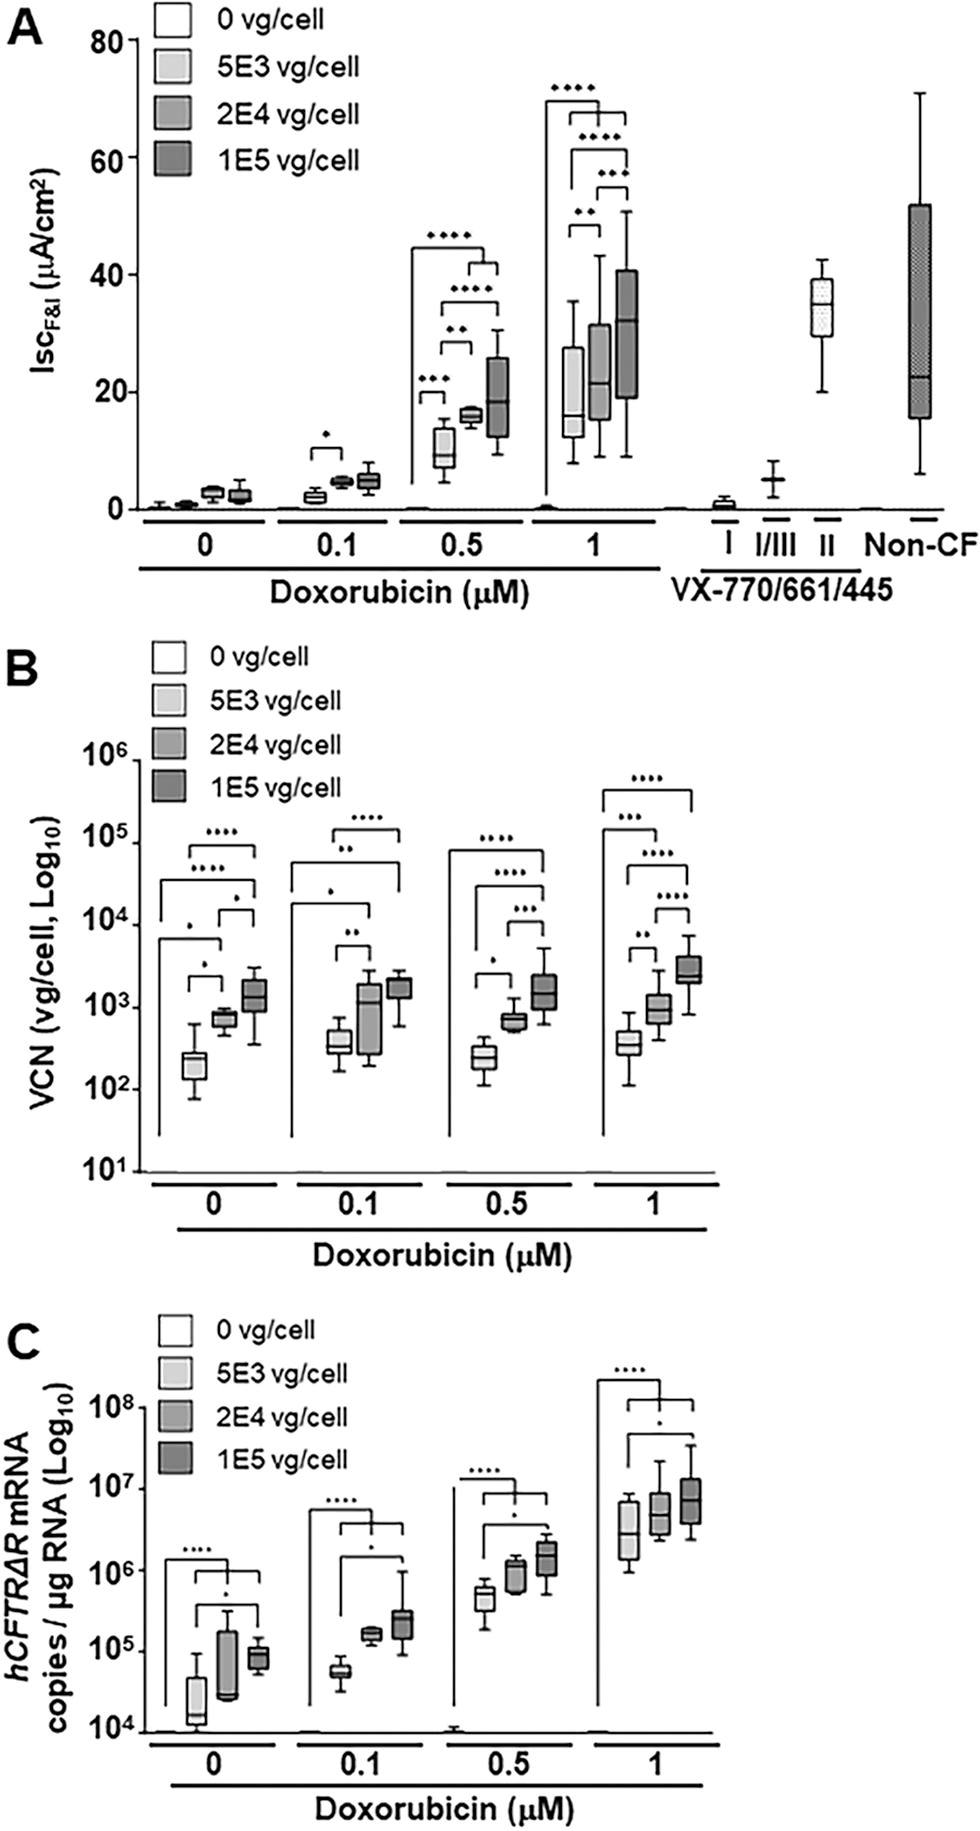
Doxorubicin HCl enhances SP-101-mediated hCFTRΔR mRNA expression and functional correction of CF HAE in a dose-dependent manner but does not affect cellular entry. Primary CF HAE with Class I, II, or III mutations were apically transduced with SP-101 at an increasing MOI (0, 5E3, 2E4, and 1E5 vg/cell, marked by progressively darker gray shaded bars) in the presence of various concentrations of doxorubicin HCl.
Three mixed-effects models were fitted to the data, each with a different response variable depending on the figure being analyzed:
To evaluate the relationship correlation between CFTR Cl− channel function, VCN, and mRNA copy number to both MOI and doxorubicin concentration increases, mixed-effect models were used to independently fit the data for each of the three response variables. In all three models, “Donor Code” was treated as a random effect, whereas “MOI” and “Doxorubicin Concentration” were treated as fixed effects. In addition, the interaction between “MOI” and “Doxorubicin Concentration” was also included as a fixed effect. Statistical values were calculated when the doxorubicin concentration was fixed and the MOI increased. For CFTR Cl− channel function a directional statistical evaluation was performed with the assumption that as the MOI increases, activity will increase (Fig. 2A). For VCN a nondirectional (two-sided) statistical evaluation was performed (Fig. 2B). For mRNA copy number, a log-transformation of copy number/μg RNA was deemed to be appropriate before a directional statistical evaluation was performed to determine if each increase in MOI was significant (Fig. 2C). Furthermore, a Benjamini–Hochberg procedure was employed to adjust for multiplicity. This method effectively controls the false discovery rate (FDR) when conducting multiple hypothesis tests or comparisons, and the FDR level of 5% was kept for each research hypothesis.
To determine the correlation between mRNA copy number per μg RNA and IscF&I, data from all donors were log-transformed for analysis using a regression model that included a random effect prediction model to account for donor-to-donor variation (Version 16 JMP, Cary, NC).
Several samples with insufficient RNA yield, potentially due to low recovery or loss during RNA extraction, were excluded. Samples were also excluded if the housekeeping gene GAPDH mRNA level was below the lower limit of quantitation or detection (Ct >32 or undetermined).
RESULTS
MOI-dependent SP-101-mediated correction of CF HAE
To confirm the functional activity of SP-101, a SP-101 MOI dose response in the presence of doxorubicin HCl was performed. Representative Ussing assay traces for CF HAE with Class I mutations (W1282X/R1162X), transduced with SP-101 MOI 0, 5E3, or 1E5 in the presence of 0.5 μM doxorubicin HCl or treated with VX-770/661/445, compared to non-CF HAE, are shown in Figure 1A. Although most cultures demonstrated low baseline amiloride and DIDS-sensitive current, CF epithelia treated with SP-101 and doxorubicin showed a robust response to F&I treatment that was similar to non-CF HAE and sensitive to Inhibitor 172 treatment (Inh172). As expected, these CF HAE with Class I mutations demonstrated no response after treatment with a mixture of VX-770, VX-661, and VX-445 (VX-770/661/445). To further understand the functional activity across CF HAE from multiple donors, a 6-point SP-101 MOI dose response in the presence of 1 μM doxorubicin HCl was performed (Fig. 1B–E). Although the level of F&I-stimulated short-circuit Cl− current (IscF&I) upon treatment with SP-101 in the presence of 1 μM doxorubicin HCl varied between and within donor epithelia, Cl− current correlated directly with SP-101 MOI. Moreover, SP-101-mediated Cl− current was detectable in all epithelia treated, even at the lowest MOI evaluated (5E2 vg/cell; Fig. 1B, C). SP-101-mediated Cl− current reached levels equal to or exceeding CF HAE treated with a combination of small molecule modulators (VX-770/661/445; Class I, Class I/III or Class II CF genotypes [see Table 2]) and non-CF HAE controls (Fig. 2A). The lack of Cl− current at MOI 0 and treatment of CF HAE with the CFTR-specific Inhibitor 172, which reduced the current back to baseline, indicating that IscF&I represents hCFTRΔR specific current (Fig. 1A–C).

SP-101 in the presence of doxorubicin corrects chloride current in CF HAE derived from donors with different CF mutations. ) and n = 1 for CF HAE with Class II mutations at MOI 0 ( ,
,  ). Each symbol shape and each line color represents a different donor:
  = KKD029O (blue),
  = KKD047N (purple),
  = KKD008N (red),
  = KKD013M (green).
Given the direct relationship between SP-101 MOI and hCFTRΔR activity in the presence of 1 μM doxorubicin HCl, it was hypothesized that both the number of vector genomes and the amount of hCFTRΔR mRNA would also have a direct relationship. To test this, each epithelium subjected to Ussing was lysed and DNA isolated to quantify vector genomes per cell (VCN) (Fig. 1D). An identical set of epithelia, not subjected to Ussing chamber assay, were lysed and RNA isolated to quantify hCFTRΔR mRNA copies per μg total RNA (Fig. 1E). VCN, hCFTRΔR mRNA copies, and hCFTRΔR activity increased with increasing SP-101 MOI. Analysis of the individual donors highlighted donor-to-donor variability exemplified by epithelia from the donor with the lowest hCFTRΔR activity (KKD047N; G551D/T663RfsX8) yielding the highest VCN and hCFTRΔR mRNA and vice versa for donor KKD029O (W1282X/R1162X).
Western blot of samples from individual transwells was performed to confirm SP-101-mediated hCFTRΔR protein expression (Fig. 1F). As expected, control A549 cells and nontransduced CF HAE from a CF donor with Class 1 mutations (W1282X/R1162X, KKD029O) showed no CFTR protein expression. By contrast, CF HAE (KKD029O) exposed to SP-101 MOI 1E5 in the presence of 1 μM doxorubicin HCl showed a Band C (fully glycosylated) CFTR protein signal that was stronger than a non-CF control (DD013O). As expected, positive control CaLu-3 cells demonstrated a strong CFTR Band C signal that was slightly lower than Band C in HAE, as previously observed. 23
SP-101-mediated correction of CF HAE is enhanced by doxorubicin HCl after SP-101 entry into epithelial cells
Doxorubicin HCl has been shown to increase AAV-mediated transgene expression independent of serotype, likely through a proteasomal inhibition mechanism. 14 –16 To understand the impact of doxorubicin HCl for SP-101-mediated functional correction of CF HAE, the relationship between doxorubicin HCl concentration and SP-101 MOI was explored in HAE from five different CF donors with different genotypes and compared to CF HAE treated with a cocktail of three modulators or non-CF HAE (Fig. 2A). The hCFTRΔR activity (IscF&I) increased in an SP-101 MOI- and doxorubicin HCl concentration-dependent manner in all five CF donors investigated. SP-101 alone at a high MOI (2E4 and 1E5 vg/cell) demonstrated low hCFTRΔR activity that was nominally above the vehicle control (MOI 0/0 μM doxorubicin). A concentration of 0.1 μM doxorubicin HCl increased SP-101-mediated hCFTRΔR activity slightly over no doxorubicin HCl. At a concentration of 0.5 μM doxorubicin HCl and SP-101 MOI of 5E3 vg/cell, average hCFTRΔR activity in three out of four donors was above the lower 10th percentile of non-CF activity levels (two F508del/F508del and one W1282X/R1162X donor above, one W1282X/R1162X donor below; Fig. 2A). A concentration of 1 μM doxorubicin HCl further boosted SP-101-mediated hCFTRΔR activity such that the SP-101 MOI of 5E3 vg/cell in the presence of 1 μM doxorubicin HCl demonstrated hCFTRΔR activity equivalent to SP-101 MOI 2E4 and 1E5 vg/cell in the presence of 0.5 μM doxorubicin HCl. Except for MOI 2E4 versus MOI 1E5 at 0.5 μM doxorubicin HCl, with every step increase in SP-101 MOI at 0.5 μM and 1 μM doxorubicin HCl, there was a significant increase in hCFTRΔR activity (at least p < 0.01, Fig. 2A). Furthermore, increasing doxorubicin HCl concentration significantly increased hCFTRΔR activity at each MOI, except in the absence of SP-101 or when comparing 0 versus 0.1 μM doxorubicin HCl at each MOI (p < 0.0001, statistics not shown on Fig. 2A).
The degree of hCFTRΔR activity in response to various levels of SP-101 and doxorubicin HCl were similar to or exceeded the values achieved when CF HAE were treated with VX-770/661/445 (Class I, I/III, or II, Fig. 2A). Moreover, transduction with SP-101 in the presence of ≥0.5 μM doxorubicin HCl fully corrected the Cl− current in CF airway epithelia to the range of non-CF levels irrespective of the mutation class examined in this study (Class I, I/III, or II, Fig. 2A). As expected, VX-770/661/445 treatment of epithelia with two Class I mutations (W1282X/R1162X; no endogenous functional CFTR protein) did not demonstrate any CFTR-mediated Cl− current, partially corrected epithelia with a combination of Class I and Class III mutations (T663RfsX8/G551D, respectively), and corrected epithelia with two Class II mutations (F508del/F508del) to a Cl− current level in the range of non-CF epithelia. Also, as expected, a large range of “normal” CFTR-mediated Cl− current was observed in non-CF epithelia.
These data demonstrate the dose–effect relationship between SP-101 MOI and doxorubicin HCl concentrations and indicate the positive impact of doxorubicin HCl on SP-101-dependent correction of CF HAE.
To further understand the molecular basis of the observed functional correction of CF HAE with increasing SP-101 MOI and doxorubicin HCl concentrations, CF epithelia analyzed in the Ussing assay were subsequently lysed, and DNA was isolated to determine VCN (vg/cell) (Fig. 2B). RNA was isolated from an identical set of epithelia not evaluated in the Ussing assay and analyzed for hCFTRΔR mRNA transcript levels per μg total RNA (Fig. 2C). Control samples (SP-101 MOI 0, no doxorubicin HCl [vehicle only], VX-770/661/445 treated, and non-CF HAE) were below the limit of quantitation for all VCN and hCFTRΔR mRNA analyses. Therefore, only representative SP-101 MOI 0 samples are shown as negative controls.
VCN significantly increased with increasing SP-101 MOI (Fig. 2B). However, consistent with evidence that indicates that doxorubicin HCl enhances the translocation of AAV vg from the cell cytoplasm into the cell nucleus after AAV cell entry, 15,24,25 VCN (vg/cell) did not change with increasing concentrations of doxorubicin HCl for any given SP-101 MOI except for the highest MOI (1E5 vg/cell) at the highest doxorubicin HCl concentration (1 μM) (p < 0.05 vs. 0, 0.1, or 0.5 μM, statistics not shown on Fig. 2B).
In contrast to VCN, hCFTRΔR mRNA levels significantly increased with both increasing SP-101 MOI and doxorubicin HCl concentrations (Fig. 2C). In the absence of doxorubicin HCl, the observed levels of hCFTRΔR mRNA expression were close to the lower limit of quantitation for the RT-qPCR reaction (∼1E-1.5E4 copies/μg RNA) for SP-101 MOI 5E3. The low levels of hCFTRΔR mRNA/μg total RNA at SP-101 MOI 2E4 and 1E5, in the absence of doxorubicin HCl, or all three MOI with 0.1 μM doxorubicin HCl, correlate with low levels of hCFTRΔR activity (Fig. 2A). This indicates that a threshold amount of hCFTRΔR mRNA is required to generate detectable hCFTRΔR activity in CF HAE. At 0.5 and 1 μM doxorubicin HCl, the levels of hCFTRΔR mRNA were sufficient for functional correction of CF HAE in the range of non-CF epithelia. To further understand the relationship between hCFTRΔR mRNA and channel activity, all individual data points, irrespective of SP-101 MOI or doxorubicin concentration were log-transformed and plotted (Fig. 3). Statistical analysis showed that the increase in hCFTRΔR mRNA expression correlated directly with the increase in the amount of hCFTRΔR activity (R 2 = 0.79, p < 0.0001, random effect prediction model; Fig. 3).
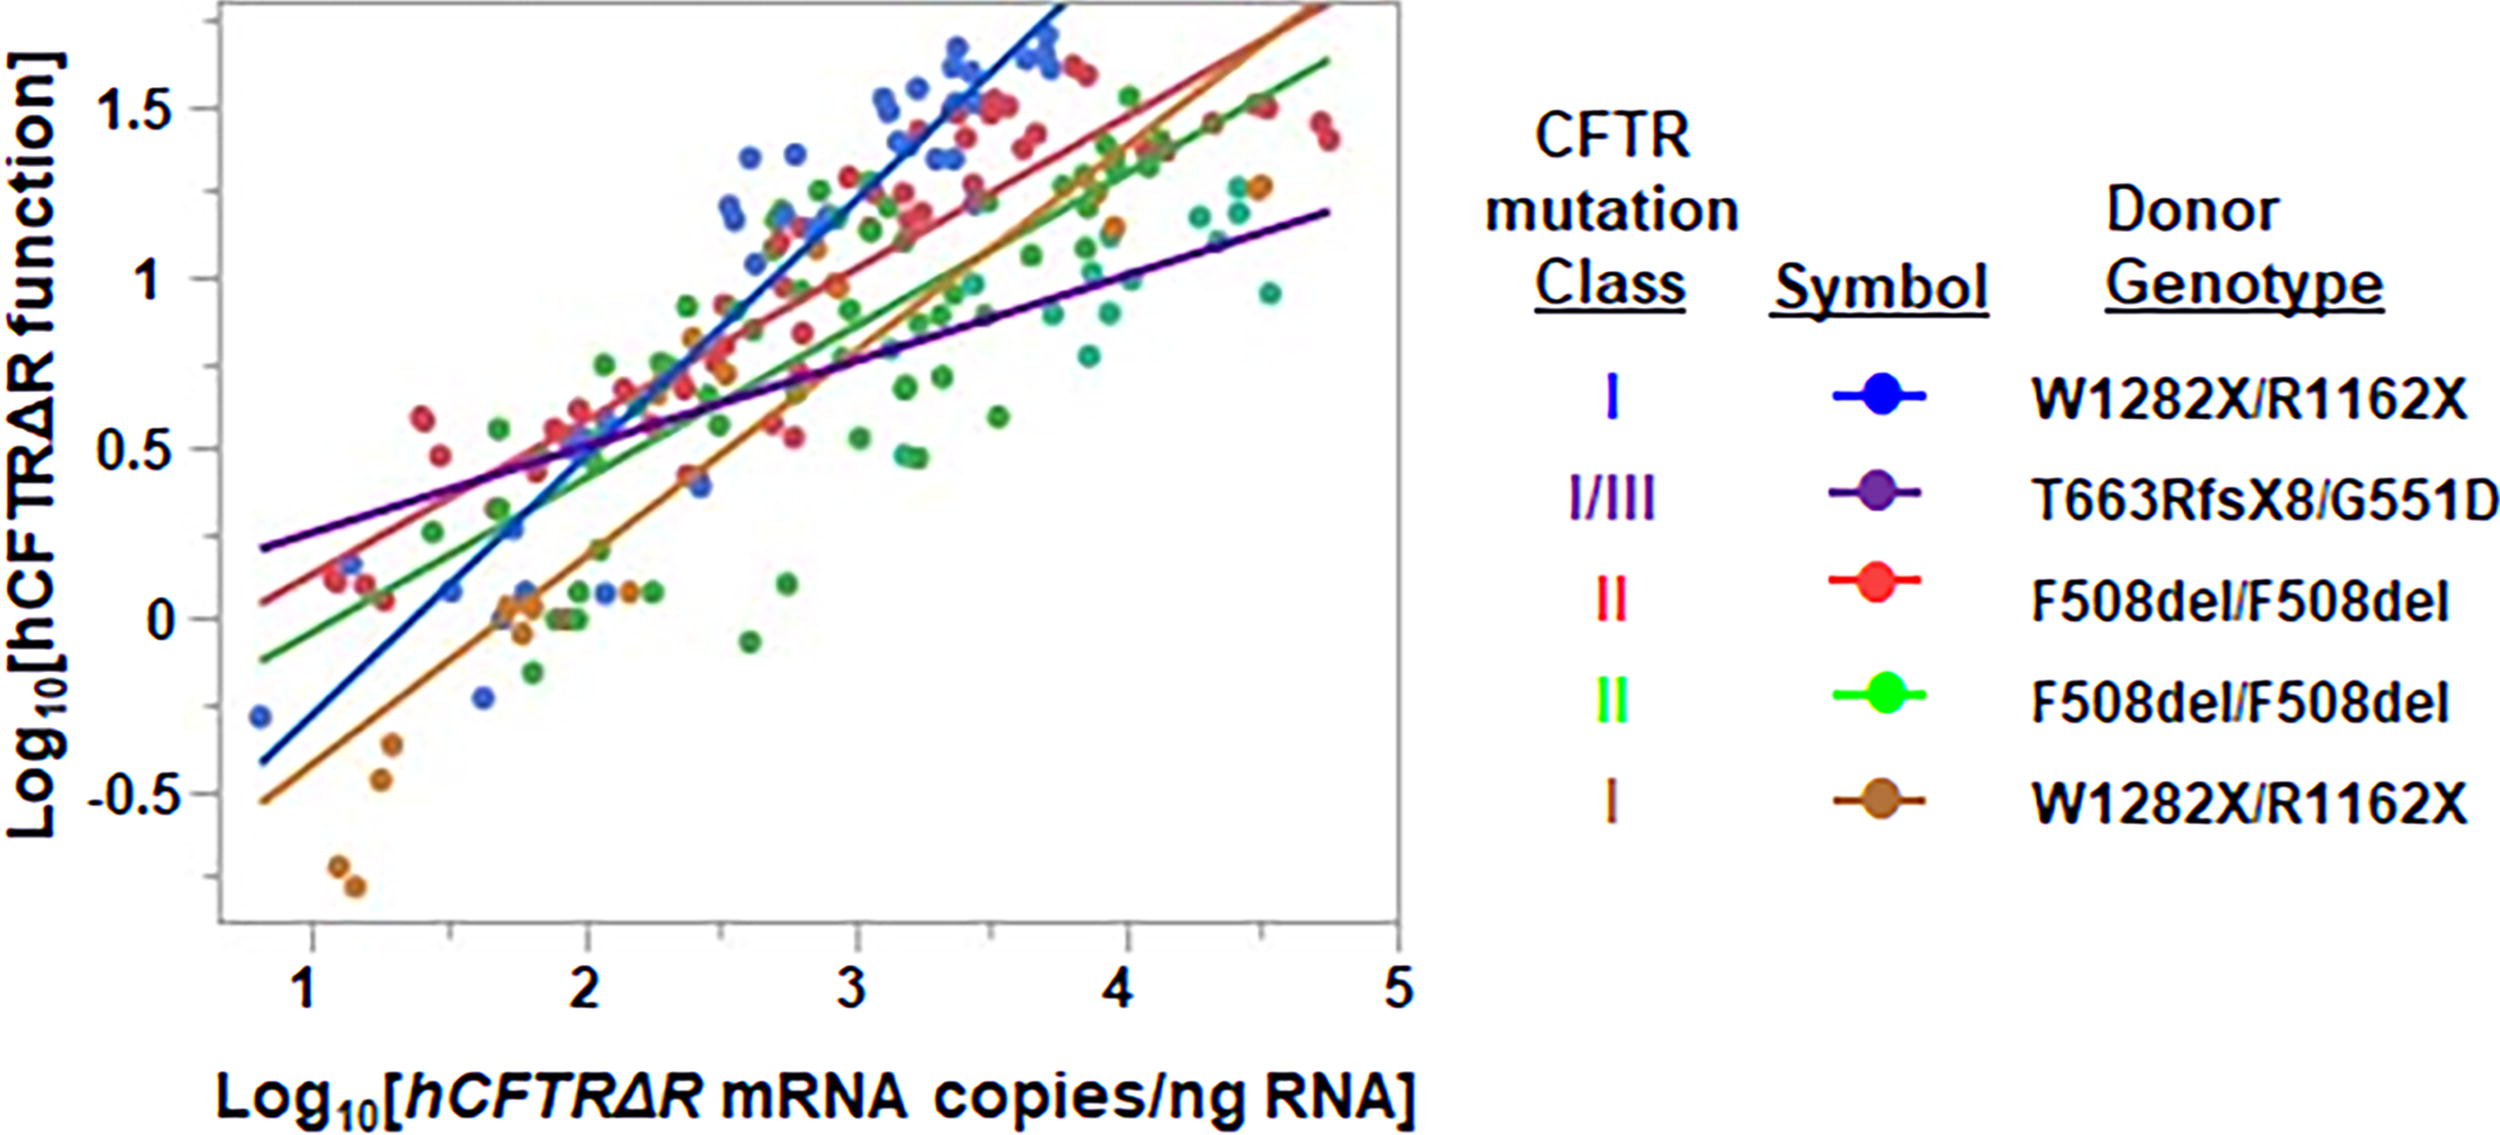
Correlation between SP-101 mediated hCFTRΔR mRNA expression and hCFTRΔR functional activity. Data from all donors for hCFTRΔR mRNA expression and hCFTRΔR activity were log10 transformed before analysis using a random effect prediction model. The regression plot shows the line of fit for each donor (KKD029O [blue], KKD047N [purple], KKD008N [red], KKD013M [green], and KKD030O [gold]) demonstrates a positive correlation between hCFTRΔR mRNA expression and hCFTRΔR activity (R 2 = 0.79, p < 0.0001).
Exposure to SP-101 and doxorubicin HCl does not increase LDH activity or alter TEER
To confirm that SP-101 and doxorubicin HCl do not demonstrate toxicity, the release of LDH and TEER was explored prior to the Ussing chamber assay.
LDH activity in the basal media was measured on days 2 and 7 after treatment and prior to the Ussing chamber assay to determine if there was any treatment-related toxicity (Fig. 4A, B). All conditions ≤1 μM doxorubicin HCl and at any MOI of SP-101 had average LDH values ≤10 mU/mL, indicating no toxicity. A 10 μM doxorubicin condition was also applied as a toxicity control and yielded an average LDH value >10 mU/mL. Epithelia exposed to 10 μM doxorubicin were no longer viable at D7 so no measurement was taken at this timepoint.
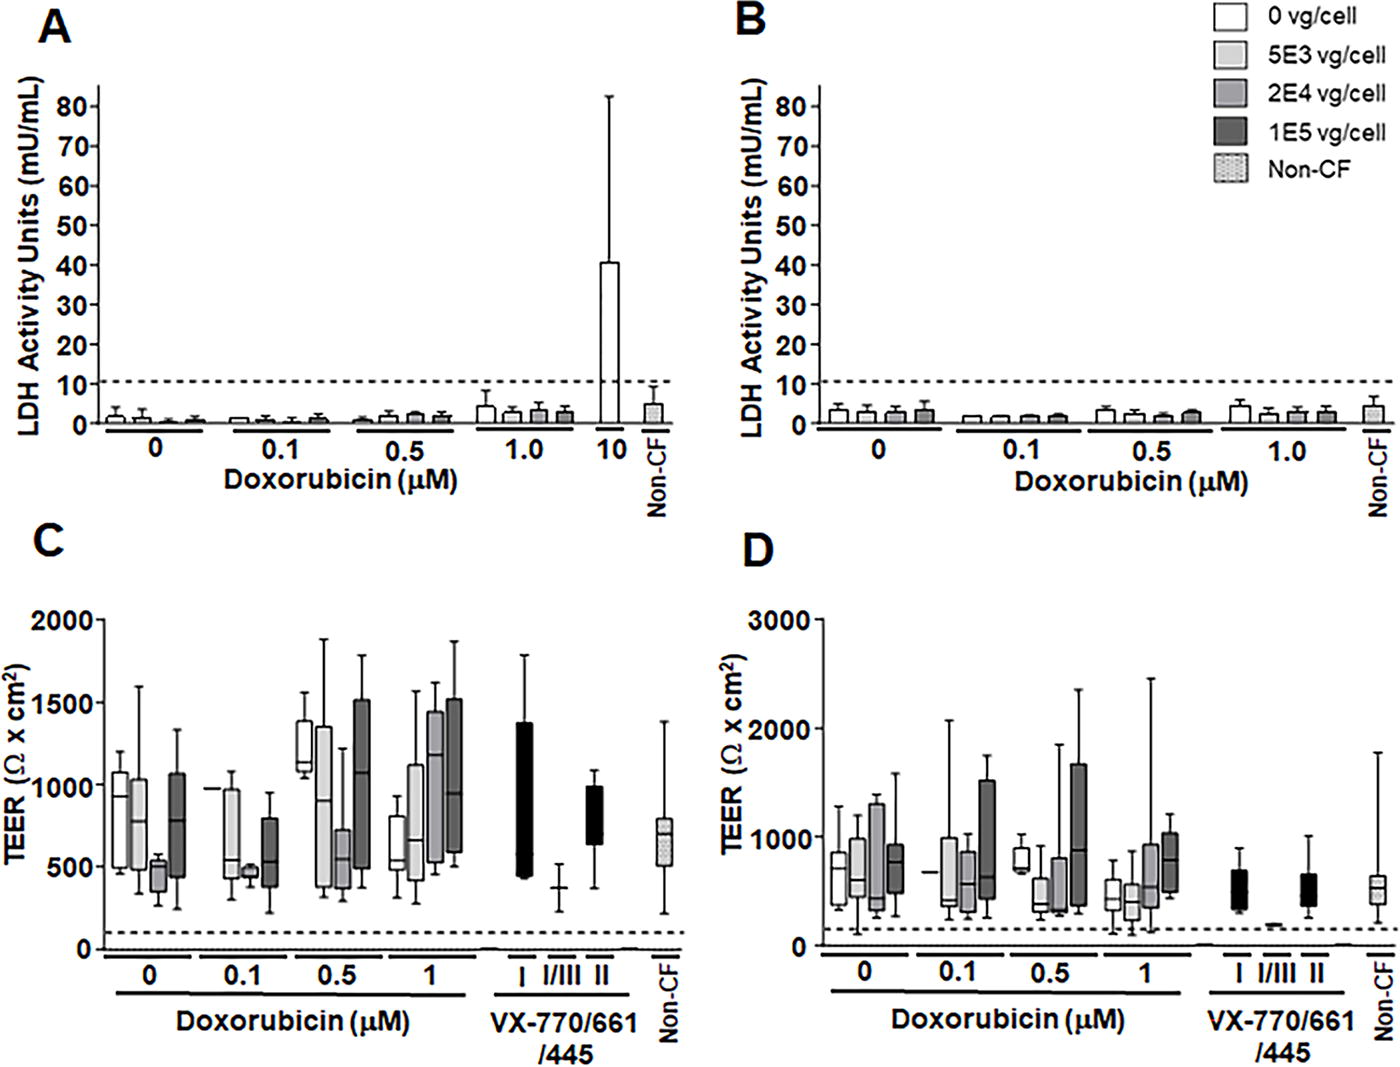
SP-101 and doxorubicin HCl do not increase LDH activity or alter TEER. Primary CF HAE from 5 CF donors with Class I, II, or III mutations were apically transduced with SP-101 at an increasing MOI (0, 5E3, 2E4, and 1E5 vg/cell) in the presence of various concentrations of doxorubicin HCl in the basal media for 16 h or treated with VX-770/661/445 on day 6 for 16 h. Data from untreated control non-CF HAE from 2 different donors are also shown. LDH activity
The mean TEER, measured by Chopstick Ohm meter (Fig. 4C) or at baseline during Ussing assay (Fig. 4D), varied between donors and conditions. However, all HAE treated with various SP-101 MOI, different doxorubicin HCl concentrations, VX-770/661/445, and untreated non-CF epithelia had values above the threshold (dotted black lines), as described in the methods, indicating proper polarization. These data indicate that while HAE TEER is variable, all HAE were viable and retained polarity for at least 7 days after transduction.
AAV2.5T is tropic to the major HAE cell types upon apical transduction
The exact airway cell types and levels of CFTR expression required for clinically relevant activity for the treatment of CF remain a matter of debate. However, it is generally accepted that the correction of 5–25% of airway epithelial cells is required to correct the chloride conductance defect of CF HAE. 26 –29 Immunofluorescence and flow cytometric analyses were conducted to determine the number and type of HAE cells transduced by AAV2.5T (Fig. 5). Fully differentiated CF HAE were transduced with AAV2.5T-CBA-mCherry-SP183-gLuc at an MOI of 1E5 vg/cell in the presence of 1 μM doxorubicin HCl. CF HAE were fixed 7 days after transduction and subsequently underwent immunocytochemistry for mCherry (yellow), α-tubulin (ciliated cells; white), or MUC5AC (secretory cells; teal), and counterstained with Hoechst 33342 (nuclei; blue) and phalloidin (actin; red). Quantitation of mCherry signal in representative whole-mount fields from two inserts indicated staining across 32 or 39% of the area imaged (Fig. 5A). A three-color overlay of α-tubulin, mCherry, and MUC5AC was used to visually assess whether certain cell types were represented in mCherry-expressing cells. In addition to mCherry-positive ciliated and secretory cells, basally oriented cells also stained positive for mCherry, suggesting the presence of stained basal cells (Fig. 5A). By contrast, mock-transduced epithelia demonstrated no mCherry signal indicating the specificity of staining (Fig. 5B).

SP-101-capsid reporter encoding mCherry transduces the major epithelial cell types in CF HAE. CF HAE (F508del/F508del; KKD013M) were apically transduced with MOI of 1E5 vg/cell AAV2.5T-CBA-mCherry-SP183-gLuc in the presence of 1 μM doxorubicin HCl or mock (control) transduced. Epithelia were fixed, and five-color immunocytochemistry was performed 7 days post-transduction followed by confocal microscopy. = KKD013M,  = KKD029O,
  = non-CF HAE-DD013O.
To quantitatively determine the number of cells transduced and expressing the mCherry signal in multiple donors, flow cytometry was performed on two CF and one non-CF donor transduced with MOI 1E5 vg/cell AAV2.5T-CBA-mCherry-SP183-gLuc in the presence of 1 μM doxorubicin HCl (Fig. 5C–F). Although the number of cells transduced demonstrated donor-to-donor variability, there was a positive correlation between MOI and positive cells with an average of 17% ± 8%, 26% ± 10%, and 34% ± 9% cells transduced at MOI of 5E3, 2E4, and 1E5 vg/cell, respectively.
SP-101-mediated hCFTRΔ R mRNA expression is found in ciliated, secretory, and basal cells after apical transduction of CF HAE
To further identify the cell populations transduced by SP-101, primary CF HAE (KKD029O, W1282X/R1162X, Fig. 1F) exposed to only doxorubicin HCl were compared to MOI 1E5 SP-101 in the presence of doxorubicin HCl by single-cell mRNA sequencing 7 days after transduction (Fig. 6). A total of 16,372 cells were sequenced in the control (dox only) condition, and 7,927 cells were sequenced in the SP-101 and doxorubicin combined condition. Clustering allowed for the assignment of a cell-type label based on marker gene expression to identify basal, ciliated, and secretory cell populations (Fig. 6A). The expression of hCFTRΔR was observed in the SP-101 exposed group in all populations and not in the control condition (Fig. 6B). Expression of hCFTRΔR mRNA in secretory cells (mean expression = 0.33) was significantly higher than that in basal (mean = 0.10) and ciliated cells (mean = 0.03) (p value = 3.72 × 10⁻¹⁸, LogFC = 2.29) (Fig. 6C). The Log2 fold change (LogFC) value was derived from the differential gene expression analysis performed in the Loupe Cell Browser. The Log2FC is the ratio of the normalized mean gene UMI counts in each secretory cell cluster relative to all other clusters/groups (i.e., basal and ciliated) for comparison. Taken together with the mCherry reporter data, AAV2.5T can transduce multiple cell types, including basal cells that are difficult to target from the apical surface of HAE.
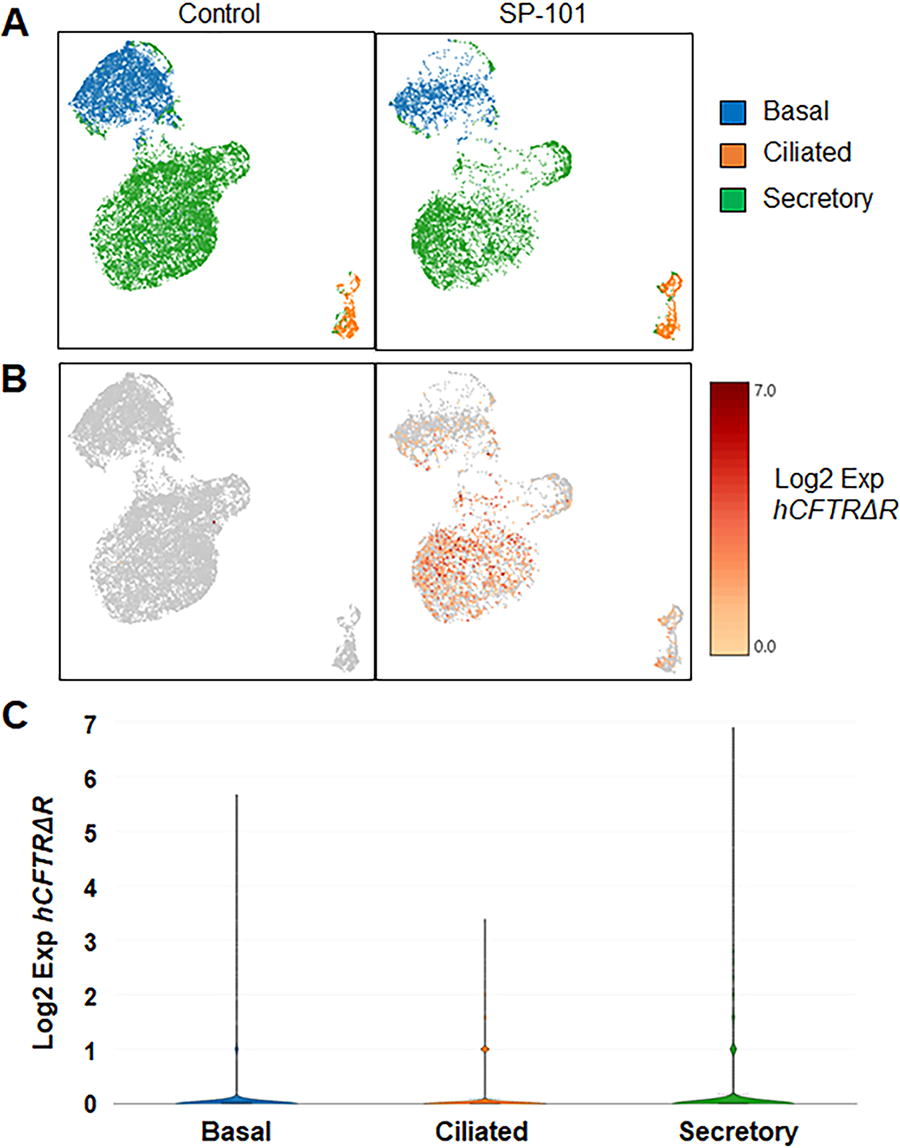
SP-101-mediated hCFTRΔR mRNA is detected in basal, ciliated, and secretory cells. CF HAE (KKD029O, W1282X/R1162X) were apically transduced with SP-101 at an MOI of 1E5 vg/cell in the presence of 1 μM doxorubicin HCl or treated with 1 μM doxorubicin HCl only. Single-cell suspensions were prepared 7 days later and subjected to single-cell RNA sequencing.
DISCUSSION
The primary objectives of this study were to determine the individual and combined effects of multiple SP-101 MOI and doxorubicin HCl concentrations on VCN per cell, hCFTRΔR mRNA per μg RNA, and hCFTRΔR activity (IscF&I) and their relationships in HAE from multiple different CF donors with different CF genotypes. In addition, LDH activity, as a measure of toxicity, and TEER, a measure of polarization, were determined for each donor and condition. Finally, tropism and transduction mediated by the AAV2.5T capsid were evaluated using an AAV2.5T reporter vector and SP-101.
The data demonstrate that SP-101 alone can efficiently enter HAE of all CF genotypes in a dose-dependent manner as evaluated by the VCN (vg/cell) (Fig. 1D, 2B). The average VCN observed in CF HAE with SP-101 demonstrated a direct relationship with SP-101 MOI but did not reveal any relationship to doxorubicin HCl concentration levels (Fig. 2B). These data indicate that doxorubicin HCl does not alter SP-101 tropism in CF HAE and is consistent with early studies that showed AAV2 and AAV5 could enter HAE cells efficiently, but the addition of a proteasomal inhibitor allowed the vector to make it to the nucleus and robustly express the transgene. 14,15
In contrast to VCN, the average amount of hCFTRΔR mRNA (copies per μg total RNA) demonstrated a direct relationship with both SP-101 MOI and doxorubicin HCl concentrations (Fig. 2C). SP-101 alone at MOI 5E3 was close to the limit of quantitation of hCFTRΔR mRNA by RT-qPCR, and 2E4 and 1E5 resulted in low expression that correlated with low hCFTRΔR activity (Fig. 2C, A). However, co-administration of SP-101 with doxorubicin HCl strongly enhanced hCFTRΔR mRNA expression, which correlated positively with hCFTRΔR activity in an SP-101 MOI and doxorubicin HCl concentration-dependent manner (Fig. 2).
Based on these in vitro studies in CF HAE, approximately 2.5E5 copies of hCFTRΔR mRNA per μg RNA was sufficient to yield a mean hCFTRΔR activity of 5.0 ± 1.3 μA/cm2 (n = 21 transwells from 4 different donors), a level of activity well above control CF HAE and in the range of the CF donor with Class I/III mutations treated with VX-770/661/445 (Figs. 1 and 2). Roughly doubling the number of hCFTRΔR mRNA copies to 5.3E5 copies of hCFTRΔR mRNA per μg RNA was sufficient to yield a mean hCFTRΔR activity of 11.4 ± 2.8 μA/cm2 (n = 11 transwells from 3 different donors), a level of activity well within the range of non-CF controls tested in this study.
Although SP-101 alone mediated some functional activity, correction was not to the levels of non-CF epithelia. The dual relationship between SP-101 MOI and doxorubicin HCl concentrations revealed the impact of each on achieving functional correction of CF HAE equal to non-CF levels. CF correction to levels observed with non-CF controls started with SP-101 MOI 1E5 vg/cell in the presence of 0.1 μM doxorubicin HCl or SP-101 MOI 5E3 vg/cell, or greater, in the presence of 0.5 μM doxorubicin HCl (Fig. 2). Even an SP-101 MOI as low as 5E2 vg/cell in the presence of 1 μM doxorubicin HCl achieved the correction of CF HAE to the levels observed with non-CF controls (Figs. 1 and 2). Moreover, non-CF levels of hCFTRΔR activity were observed with a range of SP-101 MOI in conjunction with a range of doxorubicin HCl concentrations without any indication of cellular toxicity (Fig. 4).
LDH activity and TEER were evaluated as a marker of epithelial integrity and treatment-associated toxicities. Although the values observed demonstrated intra- and interdonor variability, functional correction of CF HAE was observed at various SP-101 MOI and doxorubicin HCl concentrations without changes in LDH or TEER (Fig. 4). SP-101, at any MOI tested, and doxorubicin HCl concentrations ≤1 μM maintained TEER and demonstrated LDH activity values within the normal range for this type of culture system. In support of our findings, Ning et al. have recently shown that AAV2.5T induces a DNA damage response in primary HAE that is similar to doxorubicin HCl alone or a combination of both together. 30 Although no obvious host chromosomal DNA damage was detected, DNA-protein kinase C inhibitors further enhanced the doxorubicin-mediated increase in expression while maintaining the epithelial barrier.
Transduction with SP-101 in the presence of doxorubicin HCl could fully restore hCFTRΔR activity in CF HAE in a mutation-agnostic manner, in contrast to the activity of VX-770/661/645 modulators, which depends on the CF mutation.
Several historical studies have suggested that CFTR gene expression of at least 10–25% of normal levels is necessary to correct the CF airway. 26 –29 Moreover, an early study showed that as few as 5% of corrected cells might be sufficient to restore CFTR-mediated Cl− current. 26 In the present study, we show that an MOI 5E3 vg/cell of SP-101 in the presence of 1 μM doxorubicin HCl is within the proposed range, with an average of 17% positive epithelial cells for AAV-reporter expression (Fig. 5). This correlates well with SP-101-mediated correction that achieved non-CF levels of CFTR activity at this MOI (Figs. 1, 2). Notably, AAV2.5T mediated transduction is observed in different human airway epithelial cell types (Figs. 5, 6), which are similar to previously published co-immunostaining for ciliated, basal, goblet, and club cells. 31 However, it remains unclear which cell types are key for molecular therapy correction, which warrants further investigation.
The UNC-based expansion and polarization media in this study have been widely used and are known to result in a low percentage of ciliated cells. 20,32 –35 Using scRNA sequencing, Okuda et al. quantified ciliated cells to be ∼5% of the UNC ALI cultures. 32 This is similar to the levels of ciliated cells observed in this present study and, as opposed to tropism, is possibly why the lowest level of transduction was observed in this cell population. Regardless of the percentage of ciliated cells, single-cell RNA sequencing has provided insight into the cell types that express CFTR mRNA. 32,36,37 The highest CFTR mRNA expression is observed in ionocytes, a rare cell type, followed by secretory and basal cells. 36,37 Okuda et al. further mined the data and found that the expression of P2RY2 mRNA, which encodes a nucleotide—purinergic regulatory system receptor that controls CFTR-mediated mucus hydration, was limited to secretory and suprabasal cell types and was not detected in ionocytes. 32 Lentivirus vector-based reconstitution of hCFTR using promoters that limited expression to either secretory cells with a rat CCSP promoter or ciliated cells with a human FOXJ1 promoter demonstrated that functional correction of CF epithelia was only observed with the rat CCSP-CFTR construct. Taken together, these data suggest the importance of targeting secretory cells for CF. Given this finding, the historical reconstitution experiments should be re-evaluated to determine the number of key cell types required to correct CF epithelia.
Regardless, in this study, the AAV2.5T capsid targeted multiple airway epithelial cell types, including secretory cells. Although tropism in a human lung in vivo is required to definitively determine the feasibility of SP-101-mediated gene therapy to correct the airways of people living with CF, the in vitro data provided here strongly support the continued clinical development of SP-101.
Footnotes
ACKNOWLEDGMENTS
The authors gratefully acknowledge the work performed by others at Spirovant including Madhu Mahankali, Spirovation's Scott Randell and Samuel Gallant for performing the immunocytochemistry, the Wistar Genomics core for performing the single-cell sequencing, and Stephanie Pasas-Farmer and Charles Gu at Biodata Solutions.
DATA AVAILABILITY
Data are available upon request.
AUTHORS’ CONTRIBUTIONS
K.J.D.A.E.: Conceptualization, writing—original draft, methodology, validation, visualization, and supervision. S.L.: Conceptualization, writing—original draft, methodology, formal analysis, investigation, validation, and visualization. P.K.L.N.: Conceptualization, writing—review and editing, methodology, investigation, validation, and visualization. SS: Conceptualization, writing—review and editing, and methodology. A.M.J.: Writing—review and editing, investigation, and visualization. T.T.F.: Writing—review and editing, investigation, and visualization. M.L.J.: Writing—review and editing, methodology, and investigation. M.G.: Writing—review and editing, investigation, and visualization. M.P.L.: Writing—review and editing. M.D.S.: Writing—review and editing. G.G.: Methodology, validation, formal analysis, writing—review and editing, investigation, and visualization. R.K.: Conceptualization, writing—review and editing, supervision, and funding acquisition.
AUTHOR DISCLOSURE
All authors were employees of
FUNDING INFORMATION
All work was funded by