
Abstract
The development of various manufacturing platforms and analytical technologies has substantially contributed to successfully translating the recombinant adeno-associated viral vector from the laboratory to the clinic. The active deployment of these analytical technologies for process and product characterization has helped define critical quality attributes and improve the quality of the clinical grade material. In this article, we report an anion exchange high-performance liquid chromatography (AEX-HPLC) method for relative and as well as absolute quantification of empty capsids (EC) and capsids encapsidating genetic material (CG) in purified preparations of adeno-associated virus (AAV) using serotype 5 as a model. The selection of optimal chromatographic buffer composition and step-gradient elution protocol offered baseline separation of EC and CG in the form of two peaks, as validated with the respective reference standards. The native amino acid fluorescence-based detection offered excellent linearity with a correlation coefficient of 0.9983 over two-log dilutions of the sample. The limit of detection and limit of quantification values associated with the total AAV5 capsid assay are 3.1E + 09 and 9.5E + 09, respectively. AEX-HPLC showed method comparability with the analytical ultracentrifugation (AUC) method for determination of relative proportions of EC and CG, supporting the reported HPLC method as an easy-to-access alternative to AUC with operational simplicity. Moreover, rapid and easy adaptation of this method to AAV8 material also demonstrated the robustness of the proposed approach.
Introduction
With three clinically approved products and many more drug candidates under evaluation in clinical trials, the recombinant adeno-associated virus (rAAV) emerged as one of the preferred gene delivery vehicles in the curative gene therapy approach of many hereditary diseases. 1 –4 In contrast to the wild-type AAV sample, which has near 100% of the genome-containing functional particles, 5 the rAAV vector preparations contain genome-less empty capsids (EC) in excess. Having no direct therapeutic effect, these EC are generally considered a product-related impurity in clinical lots. 6 A better understanding of these EC's role in in vivo AAV transduction efficiency and potential impact on the final clinical outcome 7,8 has led to the development of various analytical technologies for detection, identification, and quantification of EC and capsids containing genetic material (CG).
These methods include sedimentation velocity analytical ultracentrifugation (sv-AUC), 9 transmission electron microscopy (TEM), 10,11 a combination of enzyme linked immunosorbent assay (ELISA) and quantitative polymerase chain reaction (qPCR) for total capsids and CG analysis, respectively, 12 charge detection mass spectrometry (CD-MS), 13 and optical density measurement. 14 Although effective to a varying extent, these methods also have specific drawbacks. For example, TEM- or Cryo-TEM-based analyses are subjected to manual intervention for both the differentiation between EC and CG and their quantification, potentially affecting the accuracy and precision of the final results. In the ELISA-based analysis of total AAV capsids, both TEM and qPCR are used as validation methods for establishing the concentration of EC in the standard provided with the kit. Because of this, the ELISA, besides its own inherent error, may also confound the errors associated with the methods for quantification of the standard. The accuracy of optical density measurements for both relative and absolute quantification of EC and CG depends on the purity level of the sample. In the absence of in situ sample fractionation, in contrast to high-performance liquid chromatography (HPLC) run, an impurity of any nature, DNA, or protein, even when present in trace amounts, will absorb at 260 and 280 nm and can substantially impact the overall result. A recently reported CD-MS method differentiates the EC and CG based on the difference in mass-to-charge ratio and associated migration velocity under applied electric field. 13 Notably, a more robust and accurate method is sv-AUC, where the sedimentation coefficient (S), a practical expression of the buoyant density, is determined for EC, CG, and the intermediate population during a centrifugation run. The S values reported for the CG capsid population linearly correlates to the size of the genome encapsidated in an empty capsid. 9
Ion-exchange chromatography has been reported for high-resolution separation of charge variants of complex biological molecules such as monoclonal antibodies. 15 –17 Similarly, various anion exchange HPLC (AEX-HPLC) methods demonstrating separation of EC and CG, based on the differences in the net negative charge, have also been reported to determine empty and genome-containing capsids of AAV serotypes such as AAV1, 18 AAV2, 19,20 AAV8, 21 and AAV6. 22
Building on the intrinsic resolution power of AEX and the operational advantage of HPLC, in this article, we report a simple AEX-HPLC protocol for the simultaneous quantification of relative and absolute values of EC and CG population in an affinity-purified AAV5 sample. Combining a step-gradient elution approach, which enabled a baseline separation of EC and CG populations, with the native fluorescence-based detection improved the accuracy and sensitivity of detection and quantification. Demonstrated comparability with other existing methods, including sv-AUC, for EC and CG determination provides an opportunity to establish this protocol as an additional tool for orthogonal analyses with better accessibility and operational simplicity.
Materials and Methods
Recombinant AAV5 vector production, harvest, and immunoaffinity purification
The rAAV5-gfp vector material was produced using the One-Bac 3.0 platform and the fed-batch mode of high-cell density production cultures, as reported in our previous publication. 23 For AAV5 production, B8 Sf9 cells 24 were infected with Bac-GFP baculovirus (harboring the AAV expression cassette of 3.79 kb in size, consisting of inverted terminal repeats flanked GFP transgene sequence) at a multiplicity of infection of 3. The B8 Sf9 cell line is a third-generation One-Bac inducible packaging insect cell line harboring the rep2cap5, which upon infection with a single baculovirus carrying the transgene sequence produces the AAV5. 24 The cell culture was provided with nutrient feed formulation in pre- and post-baculovirus infection phases at specific time points. At 72 h post-infection, the insect cell culture was harvested through in-situ whole broth cell lysis by the addition of 10% v/v of the lysis buffer. AAV8-gfp used for the demonstration of the method robustness was produced through triple-plasmid transfection protocol as reported previously. 25 The suspension-adapted HEK293 cells at 1–1.2 million cells/mL were transiently transfected using 5% v/v polyethylenimine (PEI):DNA complex at a ratio of 2:1. The final concentrations of plasmid DNA and PEI (Catalog number:23966-1; Polysciences, Warrington, PA) were 1 and 2 μg/mL of cell culture, respectively. The three plasmids used for AAV8 production were as follows: (1) Rep2Cap8 (Provided by Dr. Samulski, University of North Carolina, Chapel Hill, NC), (2) pAdDeltaF6-helper (a gift from James M. Wilson, Catalog number: 1128677; Addgene, Watertown, MA), and (3) pAAV-CAG-GFP (a gift from Edward Boyden, Catalog number: 37825; Addgene; 2.9 kb in size). The HEK293 cells were harvested 48 h post-transfection and lysed by the addition of 10% v/v of lysis buffer. Post-addition of a lysis buffer, the final concentration of buffer components in the lysate is 50 mM Tris-HCl, pH 7.5, 0.1% Triton X-100, 2 mM MgCl2, and 50 U/mL of Benzonase® DNase (Millipore Sigma, Burlington, MA). Following the incubation at 37°C for 2 h, magnesium sulfate was added to increase the overall ionic strength of the lysate to 600 mM coupled with an additional half an hour incubation before the clarification step. The high ionic strength lysate was clarified using the Optiscale® capsule filter consisting of a Milligard® membrane-1.2/0.5 μm (Cat# SWSCA47HH3; Millipore Sigma). The clarified lysate was then subjected to a single-step affinity capture chromatography step using commercially available 5 mL prepacked immune-affinity resin columns, AVB Sepharose (Cytiva Life Sciences, Chicago, IL) for AAV5 and AAVX (Thermofisher Scientific, Waltham, MA) for AAV8. The affinity purification process was conducted on the ÄKTA Avant 25 chromatography system. The AAV5 and AAV8 capsids, which were bound to the affinity resin, were eluted with a low pH buffer (0.1 M Glycine, pH 2.5). The eluate was immediately neutralized by adding 10% v/v of neutralization buffer (1 M Tris, pH 8.8). The neutralized AAV5 and AAV8 material was buffer exchanged against a suitable buffer using a PD-10 desalting column (Cytiva Life Sciences, Chicago, IL) for further analysis.
AEC-HPLC method of AAV5 and AAV8
Affinity-purified AAV5 material or the AAV5 empty and vector capsid reference standards were buffer exchanged against the AEX-HPLC equilibration buffer that enables the binding of AAV capsid to the anion exchange medium. The separation of AAV5 empty and genome-containing capsids was achieved using a 0.106 mL anion exchange monolithic disc column (CIMac™ Q 0.1 AAV full/empty) connected to a Waters Alliance HPLC System. This HPLC system was equipped with a separation module, a column chamber, a ultraviolet-visible (UV-VIS) photodiode array detector (PDA), and a fluorescence detector. The separation module consisted of a four-channel mixing chamber allowing buffer composition prepared from four different stock solutions. The low extra column volume (CV, ∼1 mL) associated with the Alliance system ensures minimum band broadening of the sample injection and provides sharper peaks.
The chromatography buffers used in the AEX method were as follows: A: 10 mM bis-Tris propane (BTP)-phosphate, pH 9.0; B: 10 mM BTP-phosphate, pH 9.0 + 20 mM sodium phosphate tribasic (Na3PO4), C: Milli-Q water, and D: 2 M NaCl. The continuous-gradient elution protocol consisted of the following steps: equilibration: 95% A +5% B (25 CV), elution 1: 5% B → 50% B (100 CV), elution 2: 100% B (20 CV, 0.45% B/CV), column wash: 10% A +15% C + 75% D, and re-equilibration: 95% A +5% B. The optimized step-gradient protocol comprises the following steps: equilibration:95% A +5% B (25 CV, conductivity: 0.348 mS/cm), elution Step 1 (EC elution): 88% A +12% B (50 CV, conductivity: 0.9 mS/cm), elution Step 2 (CG elution,): 82% A +18% B (50 CV, conductivity: 1.13 mS/cm), elution step 3: 50% A +50% B (50 CV, conductivity: 2.4 mS/cm), elution step 4: 100% B (30 CV conductivity: 4.2 mS/cm), column wash: 10% A +15% C + 75% D (30 CV), and re-equilibration: 10% A +90% C (30 CV) and 95% A +5% B (35 CV).
The HPLC method robustness was demonstrated for an additional serotype, AAV8-gfp vector. The affinity-purified AAV8 material was subjected to the following continuous-gradient elution protocol: equilibration: 60% A +40% B (20 CV), elution 1: 40% B → 80% B (200 CV), elution 2: 100% B (30 CV), column wash: 10% A +15% C + 75% D (30 CV), and re-equilibration: 10% A +90% C (35 CV) and 95% A +5% B (35 CV). For both continuous-gradient and step-gradient elution protocols, the process flow rate and column chamber temperature were 0.5 mL/min (5 CV/min) and room temperature (around 23°C), respectively. The column pressure at given flow rate was between 160 and 180 psi. Since the Waters Alliance HPLC system used for this study is not equipped with an in-line conductivity sensor, the conductivity of eluted fractions were measured by an offline conductivity sensor.
The sample injection volume for all the samples, including reference standards, was fixed to 40 μL. To account for the sample loop volume and associated injection volume, which may vary depending on the HPLC system hardware, all the method validation parameters such as limit of detection (LOD), limit of quantification (LOQ), and linear quantification range are reported as a function of the total AAV capsid amount instead of the capsid concentration (capsids/mL). The conversion of these values in the AAV concentration unit (capsids/mL) can simply be attained by dividing the total amount with the injection volume.
The real-time chromatographic run monitoring by UV absorbance was conducted at 260 and 280 nm wavelengths using a PDA, whereas the native amino acid fluorescence was monitored at 280 nm excitation and 336 nm emission wavelengths. The automated post-run data analysis was performed using the Empower® 3 software. The peak area calculation was conducted using a preset apex-track algorithm that integrates peak area from the valley-to-valley arrangement. For calculations of the relative percentage of empty and genomic capsids from the 260/280 nm absorbance signal, their molar absorption coefficient, as previously reported, 14 and the peak area corresponding to each wavelength were used. The DNA does not significantly emit at 336 nm upon excitation at 280 nm 26,27 and the single-stranded AAV genome's contribution to the fluorescence signal is negligible. Therefore, the relative values of peak area were directly correlated to the percent proportion of EC and CG capsids.
AAV5 empty and vector capsid reference standard characterization through orthogonal analyses
AAV5 empty and vector capsid reference standards were prepared by a two-step anion exchange chromatographic process. An affinity-purified preparation containing the mixture of empty and vector capsids (VC) was subjected to the first cycle of AEX where a highly enriched empty capsid fraction was collected. The moderately enriched vector capsid fraction (still containing the residual EC), collected from this first cycle, was then subjected to a second cycle of AEX under a continuous-gradient elution to further reduce the residual empty capsid content and increase the extent of enrichment of vector capsid preparation. This way, a two-step process enabled generation of enriched empty and VC preparation with minimized co-presence of other components. To certify these preparations as reference standards, they were comprehensively characterized for purity (sodium dodecyl sulfate-polyacrylamide gel electrophoresis [SDS-PAGE]), identity (sv-AUC, alkaline agarose gel electrophoresis analysis), and quantification (digital droplet quantitative polymerase chain reaction [ddPCR], optical density measurement, and total protein assay-Avagadro equation-based total capsid
sv-AUC analyses
Due to the lower sensitivity of absorbance measurement in general, the sample concentration step was necessary to achieve the optical-density value of 0.2–0.8 AU for sv-AUC analyses. The affinity-purified AAV5 samples and EC and VC reference standards, buffer exchanged in phosphate-buffered saline (PBS), were analyzed using the Beckman proteomelab XL-1 (Beckman Coulters, Brea, CA). The centerpieces were charcoal-filled epon, two-sector centerpieces with a 1.2 cm path length. The reference sector was filled with 420 μL PBS (blank) and the sample sector with either the concentrated AAV reference standards or affinity-purified sample. After placement in the rotor, the sample cell was allowed to equilibrate at 20°C with a full vacuum applied for 1 h. The sedimentation analysis run was performed at 20,000 rpm for 2 h at 20°C. During the velocity sedimentation run, the real-time sedimentation data were collected using absorbance detected at 260 and 280 nm optics simultaneously in a single run. Data analysis was performed using Sedfit as per previously published AAV-related parameters. 9 The data visualization plots were created using GUSSI freeware. 28
Genomic capsid quantification by ddPCR
The affinity-purified sample and reference standards were incubated with 5 U/mL of Benzonase for 30 min at 37°C before viral DNA extraction. Benzonase treated undiluted, and 1:10 diluted samples were used for viral DNA extraction using the High Pure Viral DNA Extraction kit (Roche Diagnostics, Risch-Rotkreuz, Switzerland). The ddPCR reaction was conducted using the QX200 digital droplet PCR system (Bio-Rad Laboratories) as per the manufacturer's instructions. In the case of the AAV5-gfp sample, the reaction mixture consisted of a forward primer (5′-ATAGGGACTTTCCATTGACGTC-3′), a reverse primer (5′-TGATACACTTGATGTACTGCCAAG-3′), and a probe (FAM 5′-TGGGTGGACTATTTACGGTAAACTGCC-3′BHQ) targeting the cytomegalovirus enhancer sequence. The primers and a probe were purchased from Integrated DNA Technologies (Coralville, IA). The thermocycling temperature programming was as following: preincubation at 95°C/15 min for denaturation and 40 cycles of 95°C/15 s and 54.5°C/30 s.
Purity analysis by SDS-PAGE
The AEX-HPLC process fractions, concentrated samples, and standards recovered after the sv-AUC were subjected to denaturing protein electrophoresis run. After the run, the gel was stained using the Silver Stain Plus™ kit (Bio-Rad Laboratories) as per supplier's instructions and visualized using the ChemiDoc Imager (Bio-Rad Laboratories).
Alkaline agarose gel electrophoresis
The affinity-purified starting material and empty and vector capsid reference standards, recovered after sv-AUC analyses, were subjected to alkaline agarose gel electrophoresis. The 6 × gel loading dye (New England Biolabs, Ipswich, MA), the running buffer, and the gel casting buffer were adjusted to alkaline pH by adding sodium hydroxide stock solution to the final concentration of up to 150 mM. Thirty microliters of 1 × samples in gel loading dye and 10 μL of Quick-Load® 1 kb DNA ladder (New England Biolabs, Ipswich, MA) in 1 × alkaline gel loading buffer were loaded on the 0.7% alkaline agarose gel. The gel was run at 3.5 V/cm for extended hours until the dye had migrated ∼2/3 length of the gel. Post-electrophoresis run, the gel was washed with 0.5 M Tris-HCl, pH 8 buffer, for 30 min. Later, the gel was incubated with staining buffer (1 × SYBR™ Safe stain in TE buffer, pH 8) for 1 h, followed by imaging using the ChemiDoc Imager.
Results
AEX-HPLC method development
Sample characteristics
The affinity-purified AAV5 material used for AEX-HPLC method development consisted of about 90% of EC, an undesirable AAV-related component, and 10% of CG as analyzed by sv-AUC (Supplementary Fig. S1A). 23 In this study, CG refers to an entire AAV population consisting of intermediate capsids (encapsidating small-size fragments of genetic material: host cell DNA, RNA, and fragments of viral expression cassette) and VC (encapsidating full-length vector expression cassette with or without other fragments) (Supplementary Fig. S1E[1]).
AEX-HPLC method development
Building on our preliminary data related to the selection of the pH, buffering agent, and eluent salt, the BTP buffer at pH 9 and sodium phosphate tribasic (Na3PO4) salt were selected as chromatographic buffer constituents for AEX method development. The BTP, having one of its pKa values at 9.1, was a suitable choice for buffers at pH 9. The trivalent sodium phosphate (PO4 −3) was selected over monovalent and divalent salts such as sodium chloride or sodium sulfate because of its higher resolution power, potentially due to a higher ionic and displacement strength. The higher pKa of phosphate groups of sodium phosphate results in a higher pH (>12.5) for the non-pH-adjusted buffer; therefore, both the equilibration buffer (Buffer A) and the elution buffer (Buffer B) were pH adjusted to 9 using the phosphoric acid. Such a high pH, which is above the global isoelectric point of AAV capsids, induces strong net negative surface charges and dominantly promotes anionic exchange interactions with the quaternary ammonium ligands of the AEX column matrix. The elution buffer, consisting of 20 mM sodium phosphate (equivalent to a 120 mM ionic strength), was used for gradient generation. Notably, the theoretical ionic strength of 1 M sodium phosphate salt concentration is 6 M. This relationship was used to calculate the ionic strength associated with a given salt concentration, as presented in the sections ahead. The other two solutions consisted of Milli-Q grade water and 2 M NaCl used for column wash and regeneration steps.
A continuous-gradient method was developed after the initial fine-tuning of buffer B composition and salt gradient range. The AAV5 capsids bound to the anion exchange column were eluted with 5–50% B shallow gradient (6–60 mM ionic strength) over 100 CV at a gradient slope of 0.54 mM/CV. First, the AAV5 EC eluted, followed by CG, both in the 16.5–27.5% B range (Fig. 1A, B). The notable feature of the EC and CG elution profile was the absence of a baseline separation and very close elution points, indicating a partial overlapping (and co-elution) of EC and CG at the intersection point. The relative proportion of EC and CG determined from the continuous-gradient run data collected for all three sensors (260 nm, 280 nm, and fluorescence [FL]) and analyzed by both modes (peak height and integrated peak area) indicated a lack of comparability with the sv-AUC values (Supplementary Fig. S2A, B). These data suggested that the continuous-gradient run was not suitable for accurate determination of % EC and % CG populations in a given sample. Under the given AEX conditions, the extent of EC and CG co-elution is a combined function of (1) minute differences in the net negative charge and consequent equilibrium coefficients between these populations, (2) a continuum of the population between EC and complete VC encapsidating a full-length vector genome, and (3) a very high anionic displacement strength of the eluent (phosphate).
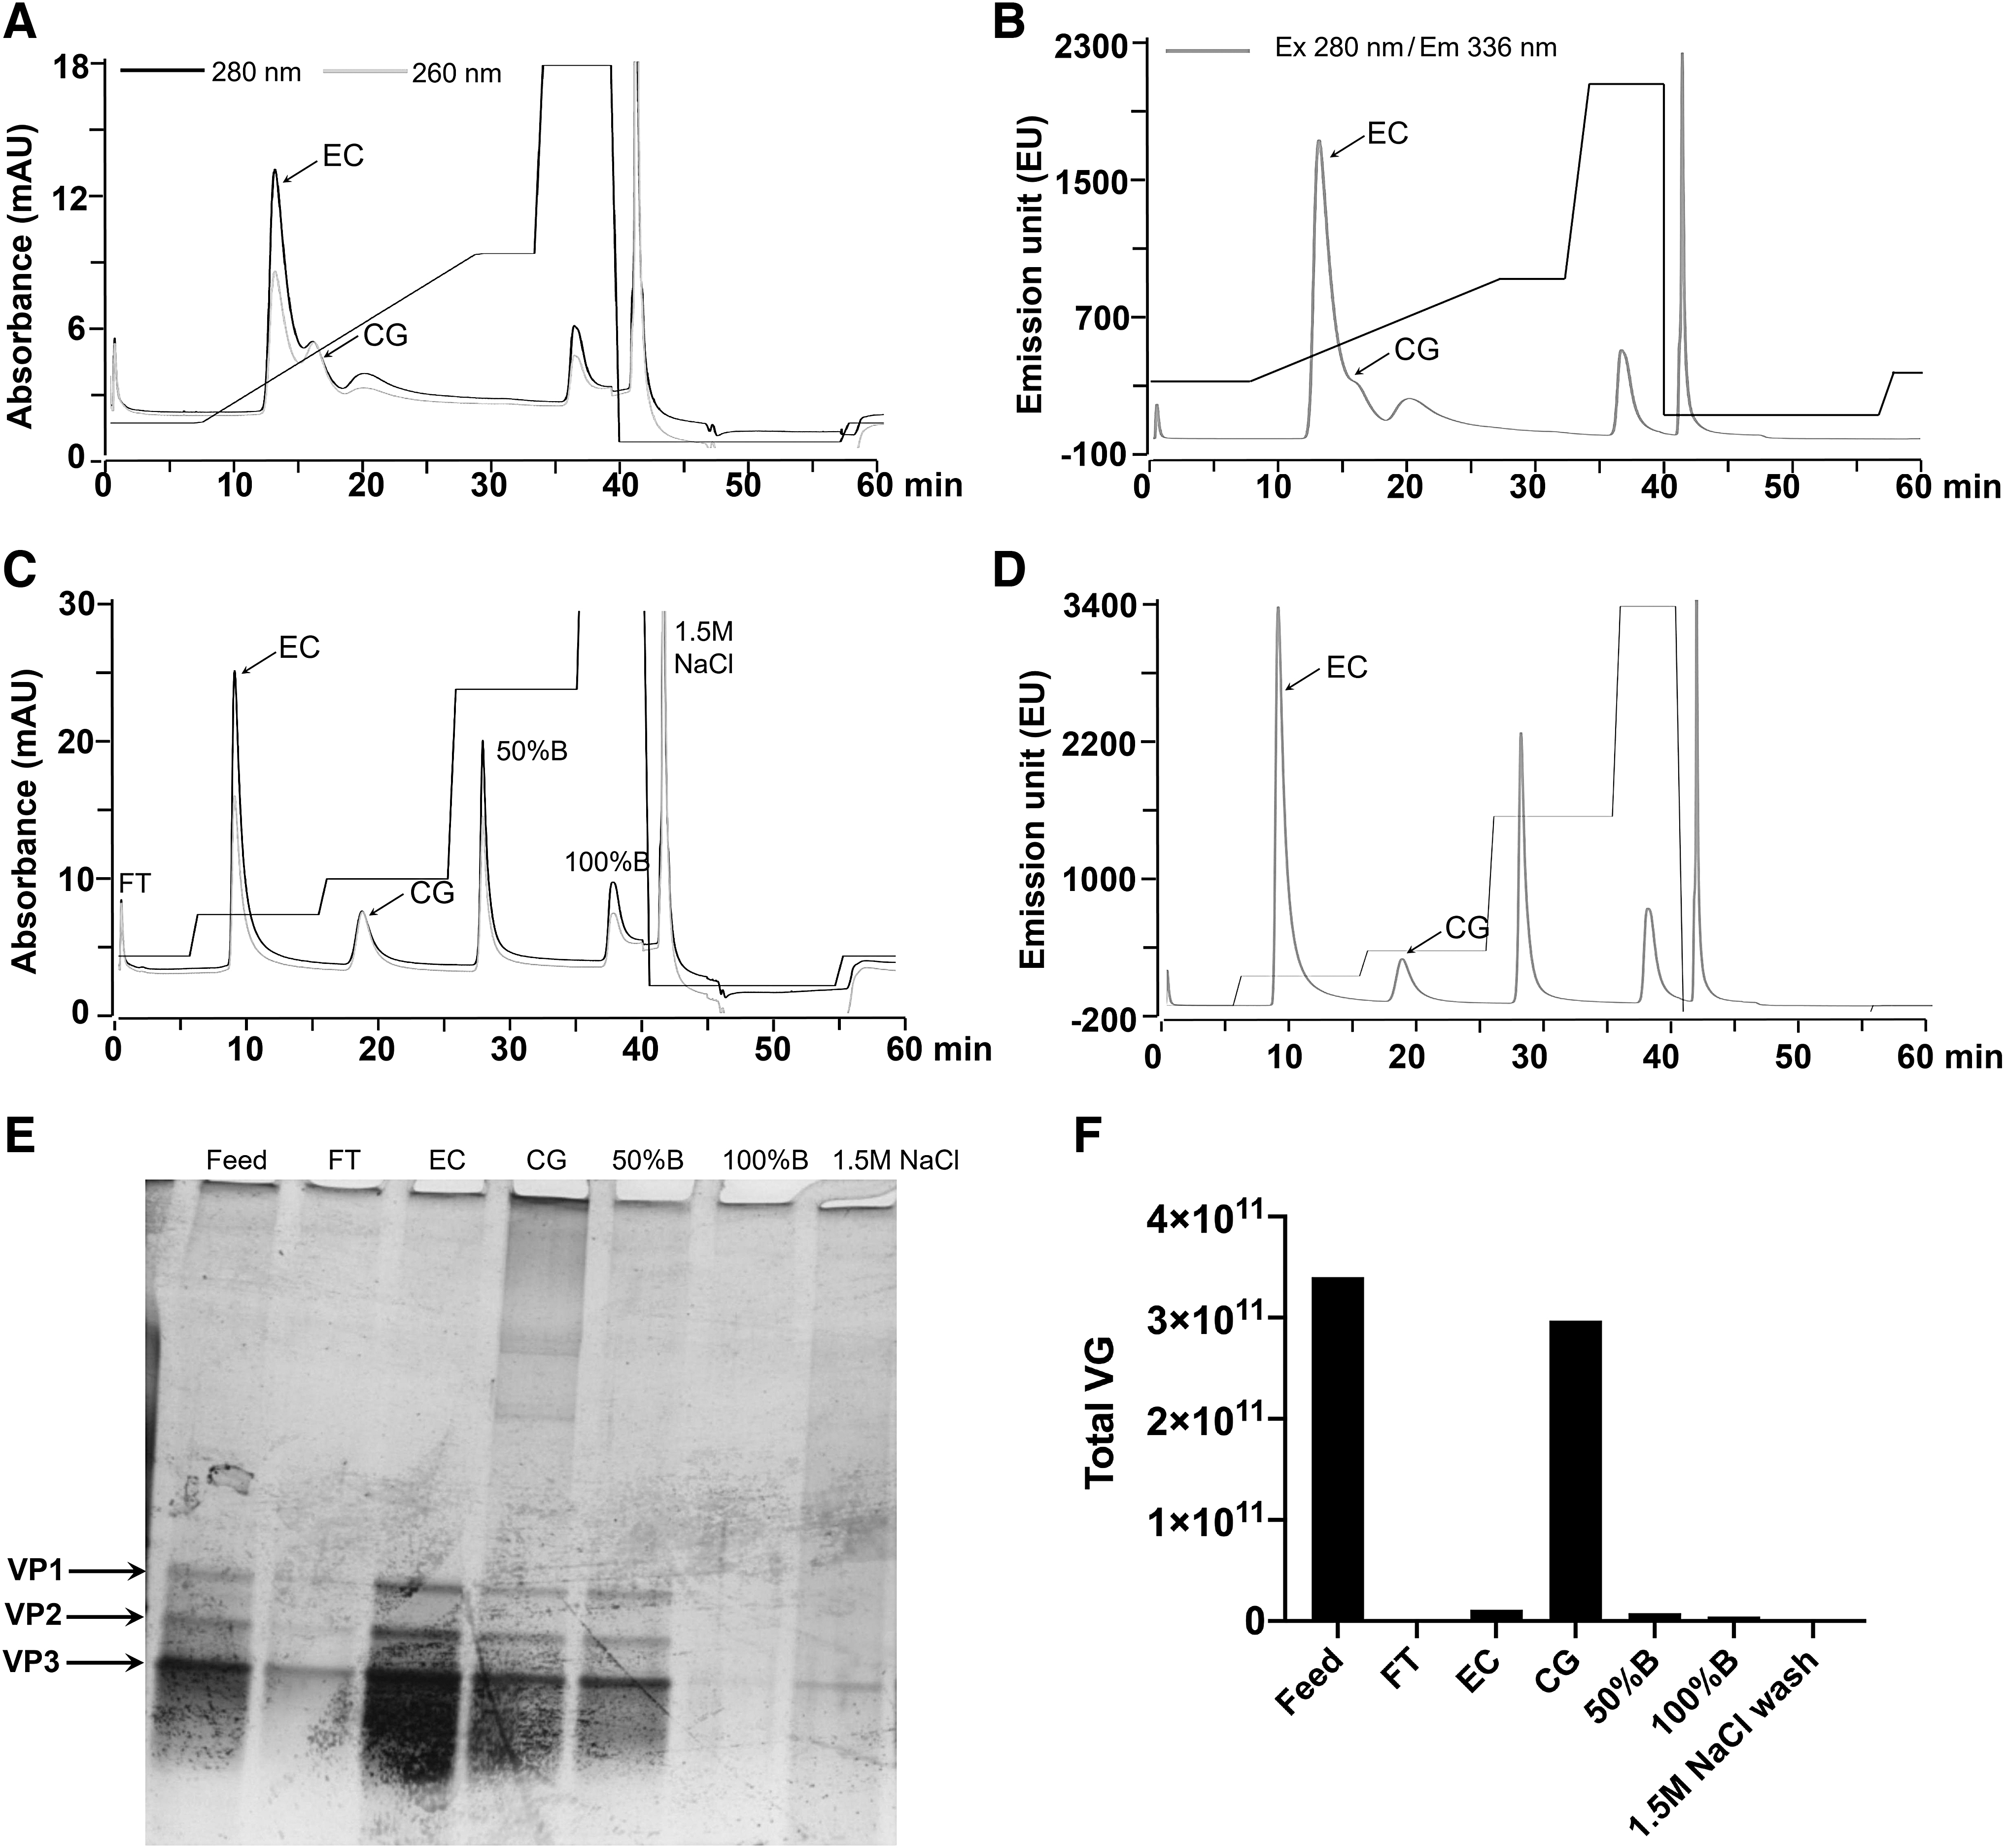
AAV5 AEX-HPLC method development. AAV5 AEX-chromatogram with UV signal
Following this, we decided to develop a step-gradient elution process where each elution step would represent a single population (EC or CG) with a minimum co-elution of other components. Further fine-tuning of the method resulted in the EC (retention time: 8.9 min) and CG capsids (retention time: 19 min) eluting in two separate peaks (12% and 18% B, respectively) (Fig. 1C, D). It should be noted here that the length of the step elution gradient was adjusted to ensure that the signal reaches the baseline, which represents a near-complete elution of the first component (EC) before beginning the elution of the following species (CG). The identity and purity of EC and CG peak fractions were assessed by SDS-PAGE, where both fractions displayed three bands corresponding to AAV VP proteins with no additional detectable bands upon silver staining (Fig. 1E). The peak fractions following the CG peak (Fraction# 4, 5, and 6) showed the presence of residual of AAV capsids that eluted at higher salt concentration and other small molecular weight impurities present in the affinity-purified AAV5 sample. Furthermore, the viral genome (VG) copy analyses by ddPCR also confirmed the presence of the majority of genomic particles in the second peak (CG peak), which consisted of ∼87% of the total VGs loaded on the column upon sample injection (Fig. 1F).
The native fluorescence in the protein is predominantly exhibited by tryptophan with excitation, and emission maxima reported to be ∼280 and 350 nm, respectively. 29,30 Due to apparently higher sensitivity than absorbance, we decided to use the native fluorescence as an additional detection signal besides UV-VIS (260 and 280 nm). The excitation and emission wavelengths for affinity-purified AAV5 material in AEX-chromatographic buffer (10 mM BTP-phosphate, pH 9.0) were found to be ∼280 and 336 nm, respectively, confirming no effect of AEX-buffer formulation on the tryptophan fluorescence. The analysis of step-gradient run suggested that the peak area-based determination of the relative proportions of % EC and % CG offered better accuracy than the peak height when compared with sv-AUC results (Supplementary Fig. S2C, D), where the values from all three signals (260 nm, 280 nm, and FL) were comparable to the sv-AUC (Supplementary Fig. S2D). Therefore, while the 260/280 nm relative ratio was employed for visual identification of EC and CG peaks in a chromatogram, the more sensitive fluorescence signal was used for the quantitative analyses and HPLC method validation reported in the following sections.
Specificity and comparability of AEX-HPLC
The finalized AEX-HPLC step-gradient method (Fig. 1C, D) was analyzed for two key attributes: specificity and comparability. The method specificity, which in this context is a measure of the degree of selectivity in the separation of EC and CG populations, was confirmed by AEX-HPLC run of in-house reference standards of AAV5 empty and VC, where the later was enriched in capsids containing full-length genomes (Supplementary Fig. S1C). These standards generated by a two-step ion-exchange chromatographic process were orthogonally characterized. The relative percent proportion and purity in these standards were confirmed by sv-AUC and SDS-PAGE analyses, respectively (Supplementary Fig. S1B–D). The alkaline agarose gel and ddPCR were used to analyze packaged genome size (Supplementary Fig. S1E) and total VG quantification (Supplementary Table S1), respectively. The AEX chromatograms of EC and VC reference standards, the affinity-purified sample, and buffer blank are shown in Fig. 2. While the peak at 19 min in EC reference standard (Fig. 2A, B) corresponds to the residual presence of the intermediate populations of AAV5 packaged capsids (∼4.0%), as confirmed already by sv-AUC (Supplementary Fig. S1B) and alkaline agarose gel electrophoresis (Supplementary Fig. S1E[2]), the peak at 9 min (Fig. 2C, D) represents residual EC (∼19%) in the VC standard, as confirmed by sv-AUC (Supplementary Fig. S1C). Similar to affinity-purified AAV5 material, the determination of % relative proportion of EC and CG in each reference standard from AEX-HPLC run, the peak area-based analyses of FL signal showed better compatibility with sv-AUC values over UV signals and peak height-based determination (Supplementary Fig. S3A–D).
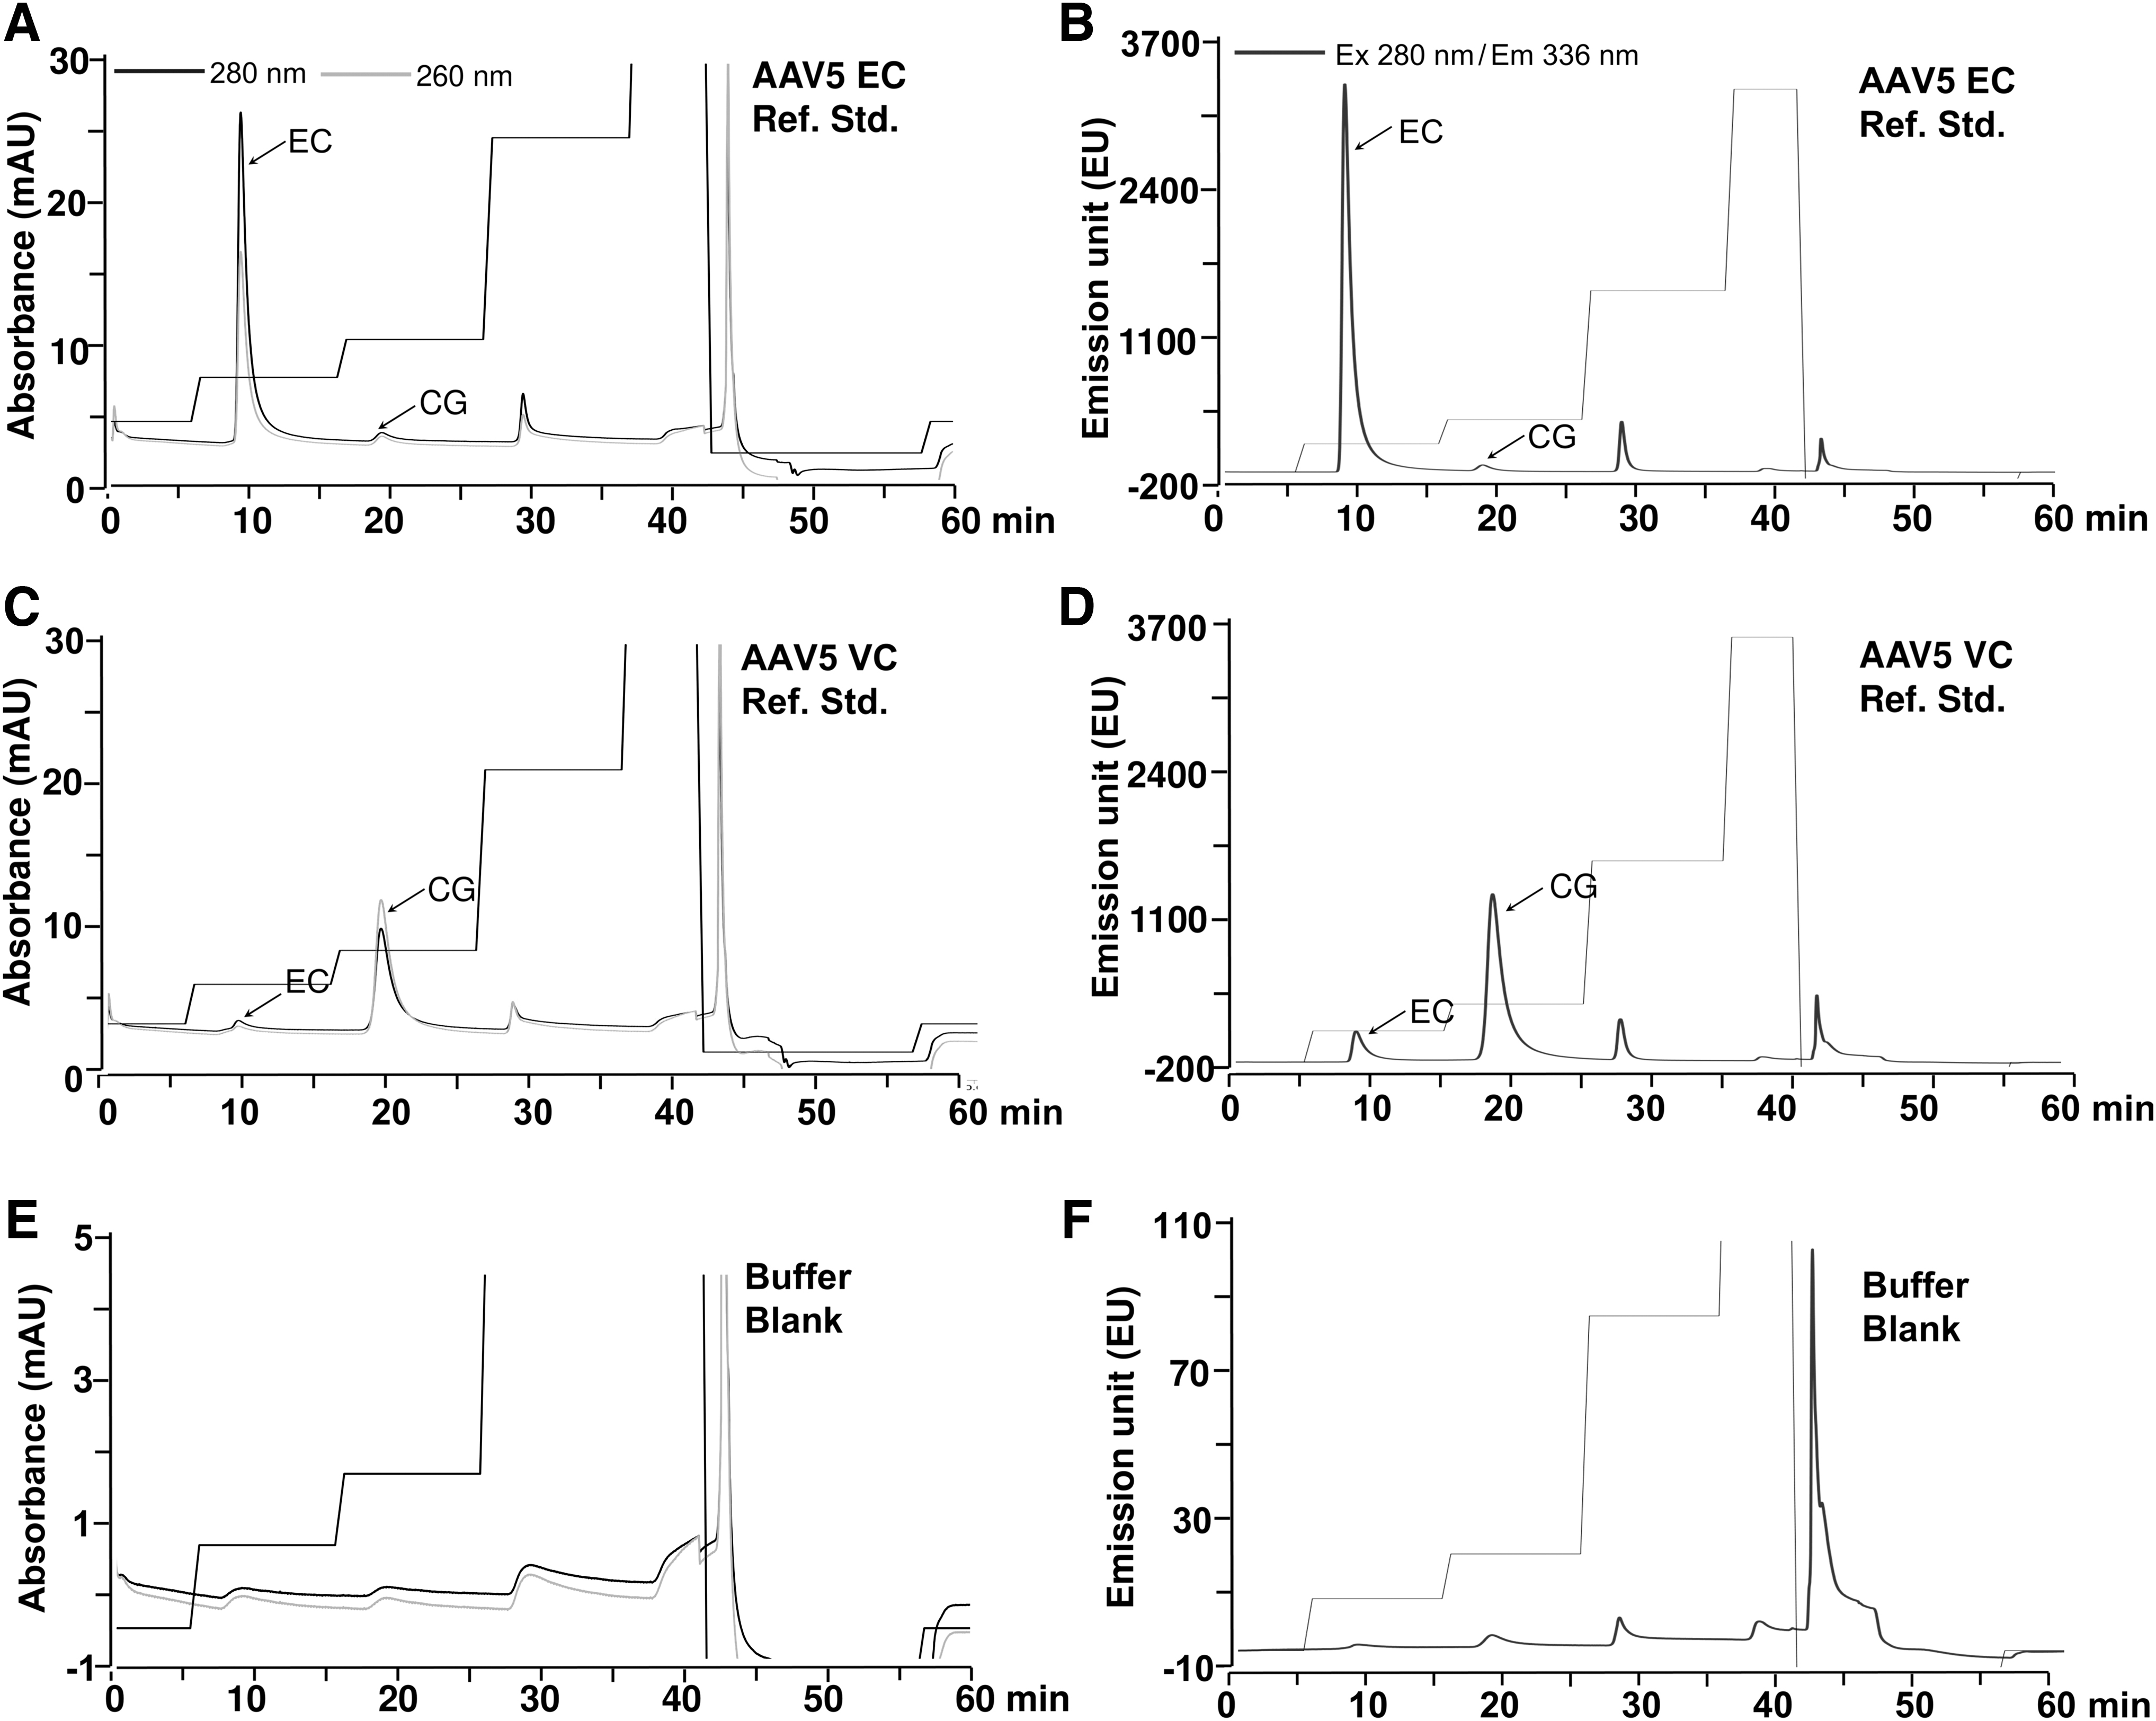
Confirmation of specificity of the AAV5 AEX-HPLC step-gradient protocol for EC and CG peaks. UV absorbance
The AEX-HPLC method comparability was evaluated against two other established methods: sv-AUC analysis 9 and optical density measurement. 14 Table 1 provides a summary of the percent relative proportion of EC and CG in the affinity-purified sample and respective reference standards when analyzed side-by-side by AEX-HPLC, sv-AUC, and optical density measurement methods (refer to the “Supplementary Calculation” section for more details). Despite small differences in the reported values with the other two methods, which is a function of the inherent intermethod variability, the overall data from Table 1 confirm the comparability of the herein reported AEX-HPLC method. It further supports the AEX-HPLC method as an effective alternative to current methods and an additional tool for orthogonal characterization of affinity-purified AAV5 samples.
Orthogonal quantitative analysis and intermethod comparability of an affinity-purified AAV5 sample and a reference standard
Calculation based on 280 nm absorbance signal data.
Calculation based on 260 nm absorbance signal data.
Calculation based on fluorescence signal (emission unit) data.
The calculations are based on the integrated peak area where applicable.
EC, empty capsids; CG, capsids encapsidating genetic material; HPLC, high-performance liquid chromatography.
AAV5 AEX-HPLC method validation
Following the confirmation of method specificity and comparability, the AEX-HPLC method was validated as per standard analytical method validation guidelines from International Council for Harmonisation (ICH) 31 and U.S. Food and Drug Administration (USFDA). 32 The method validation parameters tested include linearity, sensitivity, precision, accuracy and recovery, and carryover analysis.
Linearity of calibration and working range
The linearity of the fluorescence signal as a function of AAV5 capsids was established using the AAV5 VC reference standard. In addition to the orthogonal analyses, as reported in the previous section, this reference standard was further quantified for packaged vector genome copies using ddPCR and total protein assays. It should be noted that SDS-PAGE analysis of the VC reference standard did not show many bands associated with other major impurities, except a faint band at 250 kDa; therefore, the contribution of any trace protein impurities in the total protein value was ignored, while calculating the total AAV capsids from the protein amount determined by appropriate assay. From the total capsid amount (protein assay) and known molecular weight of AAV5 capsid (∼4,000 kDa), total capsids were quantified (Cp/mL) applying the Avogadro equation. The VG/mL value was then derived from the known ratio of total capsids and VGs from the sv-AUC analysis. Notably, this VG/mL quantification values showed comparable results with that analyzed by ddPCR. A summary of these orthogonal analyses is provided in Supplementary Table S1.
For the linearity study, VC reference standard (5.5 × 10¹² VG/mL or 6.8 × 10¹² total capsids/mL) was serially diluted with a dilution factor 2 (1:2, 1:4, 1:8, .…, 1:128) and injected in triplicate in the range of 1.0 × 10⁹–1.9 × 10¹¹ capsids. This capsid amount reported here is the value that corresponds to the VGs in the 40 μL injection. In the linearity curve, when the peak height and peak area values were plotted as a function of VG capsids over the given range, the correlation coefficient values was similar (Supplementary Fig. S4A, B). However, because of the better suitability of the peak area over peak height for both relative and absolute quantification, as indicated previously, it was selected as a quantification method. The integrated vector capsid peak area plotted as a function of the total VC was used to construct a standard curve and establish other parameters (Supplementary Fig. S4B). The details of the linear curve parameters are shown in Table 2.
Linearity curve characteristics of the vector capsid reference standard
LOD, limit of detection; LOQ, limit of quantification.
Since baseline resolution was achieved between EC and CG in the affinity-purified sample (8.5 × 10¹² VG/mL or 7.7 × 10¹³ capsids/mL, Supplementary Table S1) as well, it was also serially diluted over a two-log range and subjected to AEX-HPLC (Supplementary Fig. S2) run. The peak height and peak area were used to determine the relative proportion of % EC and CG in the sample, where again, peak area was found to be relatively more accurate across the entire dilution range tested (Supplementary Fig. S4C, D). The interdilution relative standard deviation (RSD) values for % EC and % CG in the given range was <12%. However, for the linear curve, both peak height and peak area indicated comparable correlation coefficients (Supplementary Fig. S5A–D). When combined, linearity over a three-log range dilution with a correlation coefficient of >0.998 was achieved when the total capsid loading was in the range of 2.3 × 10⁹–2.8 × 10¹² capsids.
Sensitivity: LOD and LOQ
The LOD and the LOQ were derived from the linearity curve data generated from the vector capsid standard and determined from the formulas as per ICH guidelines. These equations are LOD = 3.3 × σ/S and LOQ = 10 × σ/S, where σ corresponds to the standard deviation of the regression line or the y-intercept, and S represents the slope of the curve. The values of LOD and LOQ determined from these formulas and expressed as a signal response (peak area) are shown in Table 2 and Supplementary Fig. S4B. The LOD values corresponding to the standard deviation of the regression line and the y-intercept were found to be 1.3 × 10⁷ and 2.6 × 10⁶ (peak area unit: μV × s), respectively, equivalent of 1.2 × 10¹⁰ and 3.1 × 10⁹ AAV5 capsids. Similarly, the LOQ values (peak area unit) based on the standard deviation of the regression line and the y-intercept were 4.3 × 10⁷ and 1.0 × 10⁷, respectively, which correspond to 1.2 × 10¹⁰ and 3.1 × 10⁹ AAV5 capsids. A comprehensive summary of each of the standard curve parameters for both the vector capsid standard and the affinity-purified sample is provided in Table 2 and Supplementary Table S2, respectively.
Based on the combination of the linearity range and LOQ values reported above, the effective range of quantification corresponding to AAV5 capsids is above 9.5 × 10⁹ capsids and up to 2.8 × 10¹² capsids (Table 2 and Supplementary Table S2).
Precision
The two parameters for precision analysis employed in this study were repeatability (intraday) and intermediate precision (interday). For this study, 40 μL injections of the affinity-purified AAV5 sample with a nominal concentration (the concentration that falls in the middle of the linear curve—1.1 × 10¹² VG/mL or 9.6 × 10¹² capsids/mL) were injected six times per day for three consecutive days. For each intraday and interday points, the relative standard deviation of the peak area and retention time was determined for EC and CG. For the EC peaks, the % RSD value of the peak area and retention time, for both repeatability and interday precision parameters, was <3.5%. For the CG peaks, it was <5%. Similarly, the % RSD value of the relative proportion of empty and full capsids for both precision parameters was below 7%. Table 3 provides the details of this study and the associated parameters.
Summary of the precision parameters for an anion exchange high-performance liquid chromatography run of an affinity-purified AAV5 sample
RSD, relative standard deviation; SD, standard deviation.
Accuracy and determination of % recovery of spiked VG
For the accuracy and recovery study, a total of 4.8 × 10¹⁰ VG capsids of the AAV5 vector capsid reference standard was spiked in three samples corresponding to three concentrations (high—1 × , medium—1:10, and low—1:20, Supplementary Table S3) of the affinity-purified AAV5 sample. These spiked samples were subjected to the AEX-HPLC run, and the % recovery of spiked VGs was determined from the peak area corresponding to the CG peak (retention time: 19 min) for each sample. The reported recovery of AAV5 VGs across all three samples was in the range of 93–99% (Supplementary Table S3).
Method robustness
The robustness of the HPLC method reported herein was further studied for another serotype, AAV8. The affinity-purified material of AAV8 vector was subjected to the continuous-gradient run HPLC method and two separate population of EC and CG was observed (Fig. 3A, B), each representing characteristic A260/280 profile (Fig. 3A). When analyzed by SDS-PAGE, the EC and CG peak fraction were found to contain AAV capsids. ddPCR analysis of eluted fractions confirmed the identity of the CG peak as it contained ∼90% of total VGs with reference to total VGs injected in a sample. The % EC and CG, determined from FL signal applying valley to valley peak integration algorithm, were found to be 54% and 46%, respectively. These values were comparable to the optical density measurement-based analysis 14 of the same affinity-purified AAV8 material, which was found to be 61% and 39% for EC and CG populations, respectively.
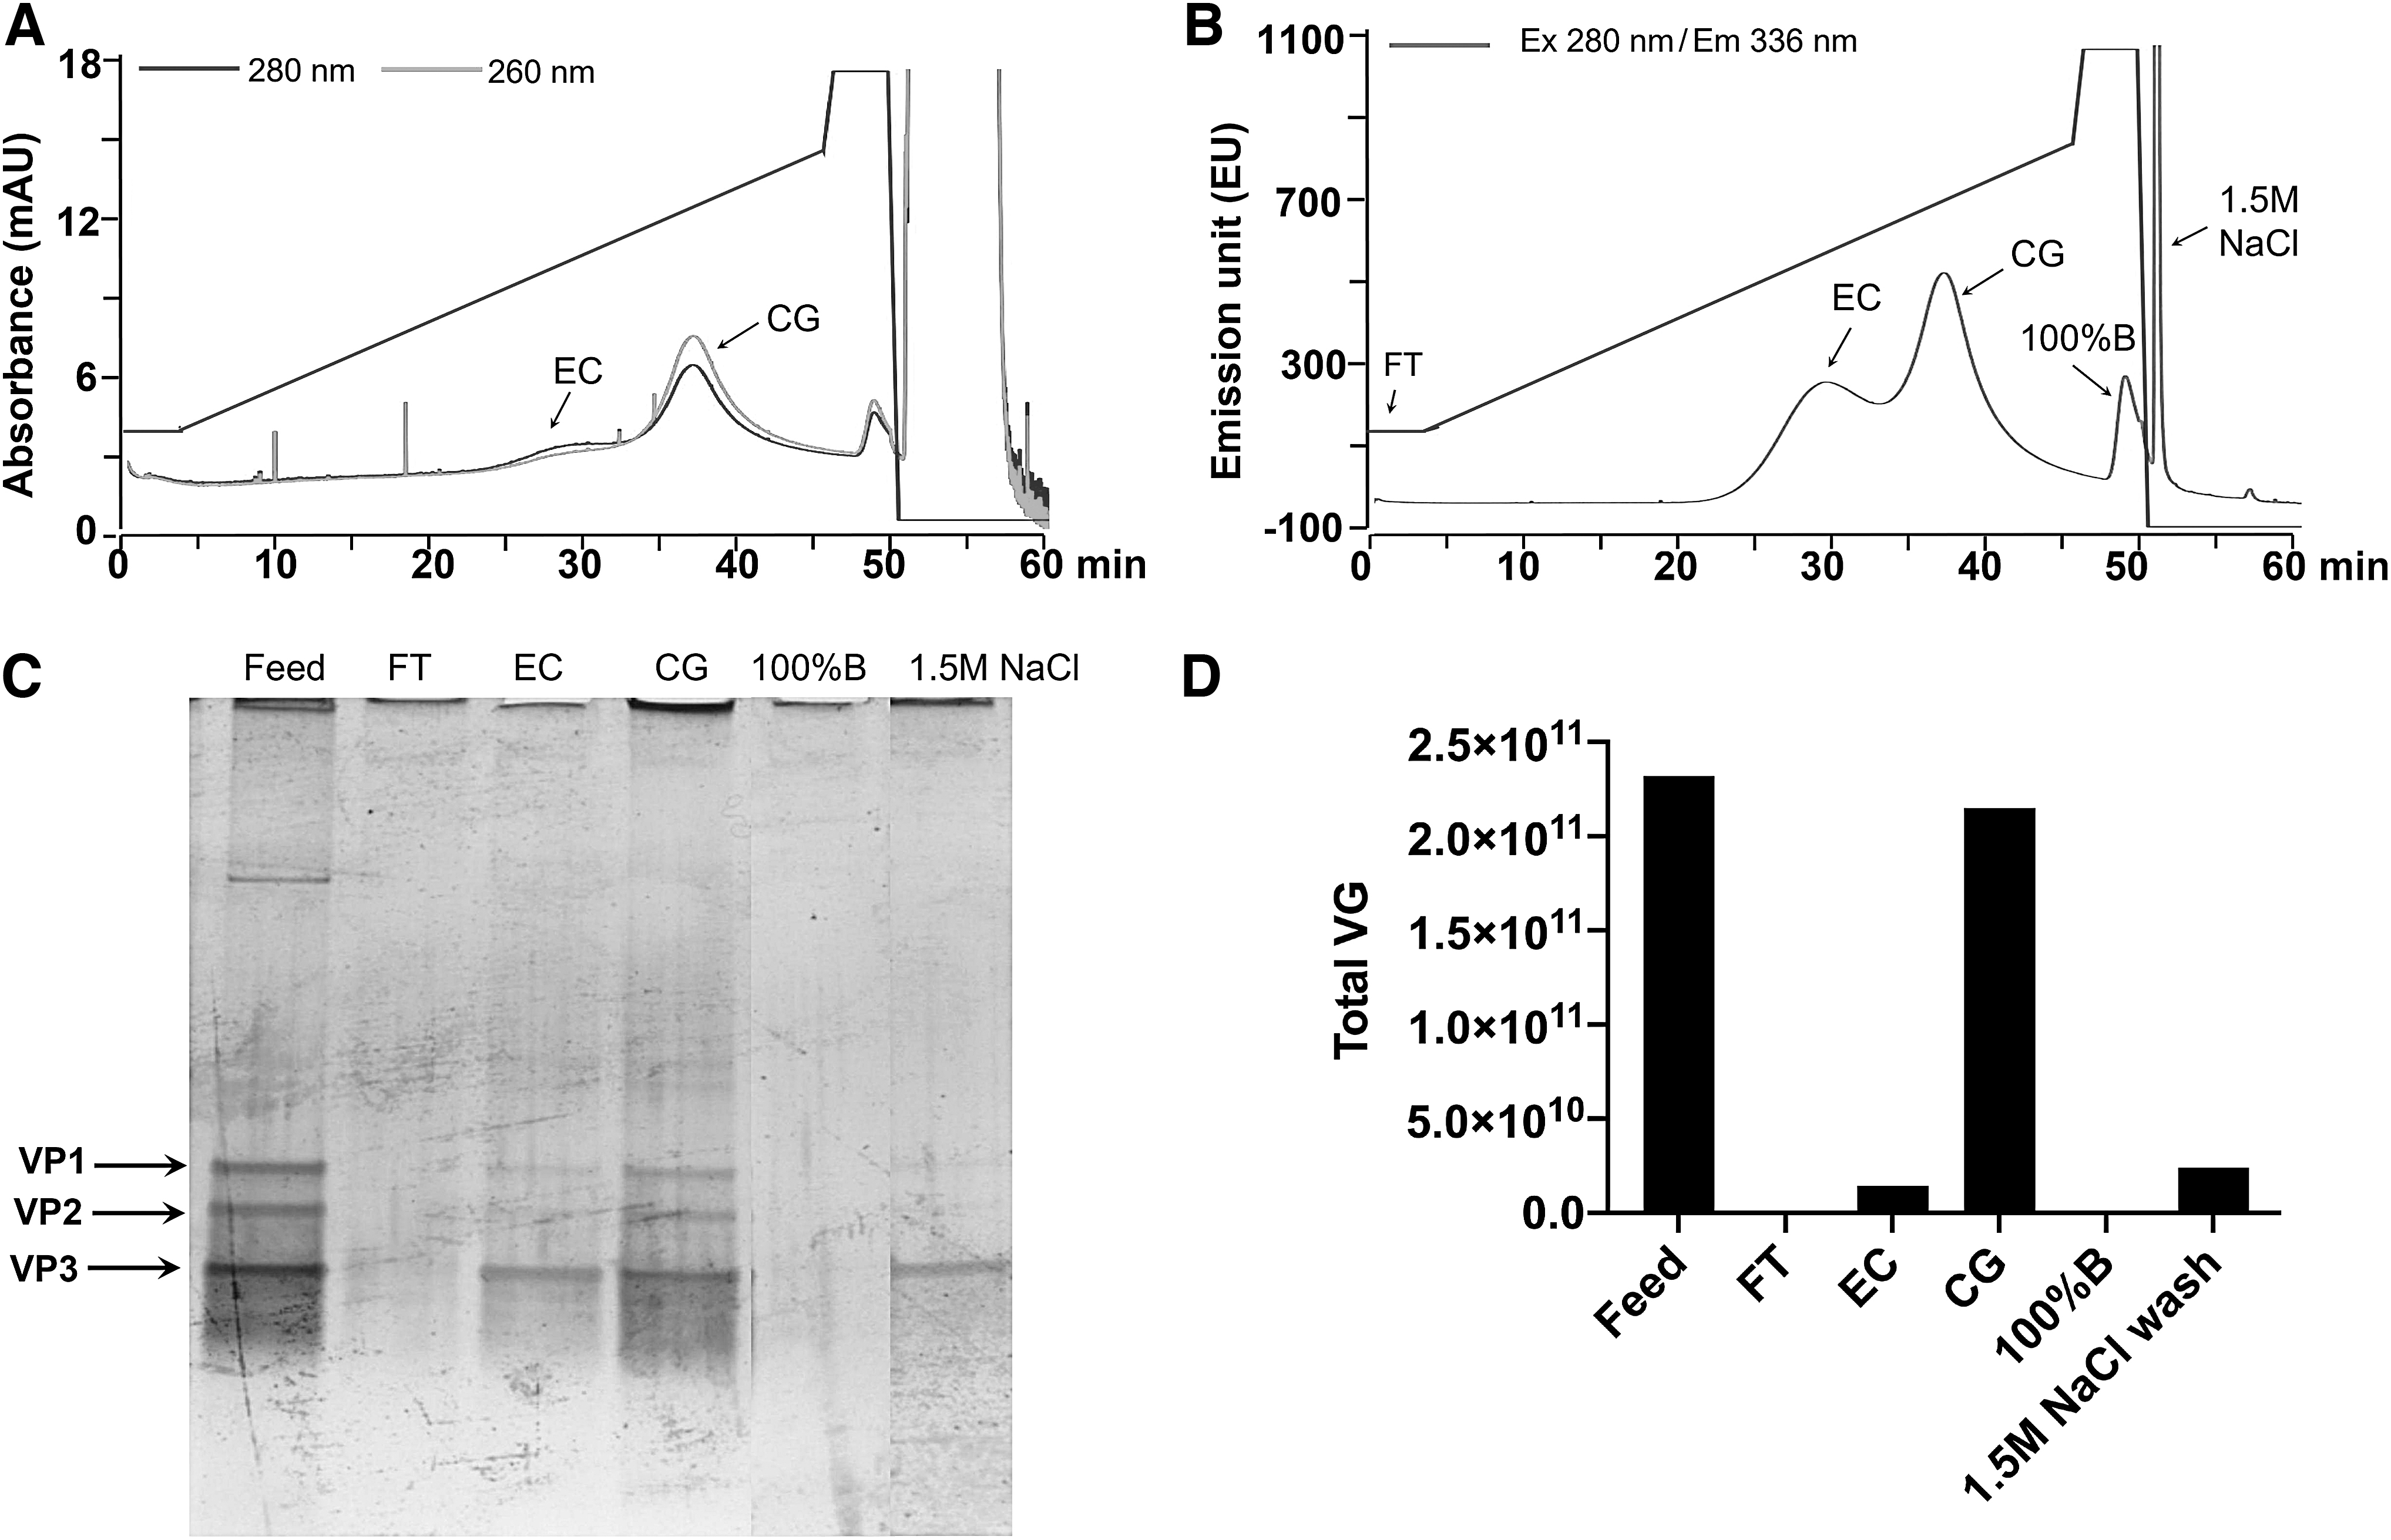
Demonstration of HPLC method robustness for AAV8. AAV8 AEX-chromatogram with UV signal
Carryover analysis
Carryover analysis is an integral part of an HPLC method validation as it provides information on any possible carryover of sample components during subsequent injections without additional column washing or regeneration steps. Moreover, since we have already incorporated a high salt wash and column re-equilibration steps in the herein reported HPLC method, carryover analysis provides us an opportunity to evaluate if these conditions are sufficient or any additional column regeneration step is required between successive sample injections. For carryover analysis, immediately after the AEX-HPLC run of the highest concentration sample (2.9 × 10¹¹ VGs in 40 μL injection volume), a buffer blank was injected. The peak area values, each corresponding to EC and CG, were used to calculate the carryover. The % carryover reported for EC peak, and CG peak was below 20% of LOQ (Supplementary Table S4), meeting the USFDA guideline acceptance criteria. 32 It should be noted that the percent carryover reported here is a function of the total capsid amount injected, the amount of each component (EC and CG), the column matrix, and the ligand. It may be minimized by injecting sample in the lower dilution range of the standard curve and/or by adjusting the frequency and duration of the column's cleaning/re-equilibration conditions between the subsequent injections.
Discussion
With an increased understanding of the rAAV manufacturing process and pharmacological characteristics of AAV in the clinics, various analytical approaches have been developed, defining critical quality attributes (CQA) of an rAAV-based clinical-grade material. 6 The removal of EC, one of the major product-related components and an important CQA, during the manufacturing process and analysis in the final clinical grade material, is of prime importance due to its impact on in vivo transduction efficiency. 7,33 AAV serotype 5 is currently one of the vectors of choice in clinical studies for curative gene therapies in indications such as rheumatoid arthritis (NCT03445715 and NCT02727764), acute intermittent porphyria (NCT02076763), and hemophilia A and B (NCT03520712 and NCT03569891). In this article, we are reporting a simple HPLC method to analyze EC and CG in a purified preparation of AAV5.
In contrast to the previously reported AEX-HPLC methods based on monovalent or divalent salts reported with continuous-gradient elution protocols, 18,20 –22 we selected a trivalent sodium phosphate salt due to its higher efficiency for the separation between EC and CG capsids in the initial screening study. The phosphate salt was more effective than other monovalent or divalent salts for our AAV5 sample where the percent proportion of the AAV-related undesirable component: EC was much higher (∼10 × ) than the genome-containing capsids, the product of interest.
The continuous-gradient elution is regularly used in an analytical HPLC method due to its higher sensitivity for detection of multiple components in a sample; however, its effectiveness for an accurate quantification is limited when there is a lack of baseline resolution or the degree of co-elution between the impurity(ies) and the product of interest is higher, as observed in our AAV5 sample (Fig. 1A, B). In previous reports of the AEX-HPLC method for determination of % EC and CG in other AAV serotypes, where the continuous-gradient protocol was found to be effective, the percentage of CG was as high as 50%, 20,22 which in turn compensates for the lack of baseline resolution, resulting in relatively lower co-elution between EC and CG. In contrast, in our AAV5 sample, due to 90% of EC content, the separation efficiency was not high enough to offer baseline resolution. As a result, a relatively higher degree of co-elution between EC and CG suggested that the quantification of % of EC and CG determined from this continuous-gradient run was not accurate and differed significantly from the values reported with sv-AUC (Supplementary Fig. S2A, B), the current standard method for such analysis.
To address this problem, a step-gradient elution protocol was developed. The EC and CG, two main populations of AAV capsids in an affinity-purified AAV sample, were separated as baseline-resolved discrete peaks. Because of the apparent higher purity of the sample, the amount of non-AAV-related impurities and their interference in overall analysis and quantification is expected to be minimum in the step-gradient elution protocol, making it suitable for analytical HPLC purpose. Moreover, the specificity demonstrated with appropriate reference standards also demonstrated the effectiveness of the step-gradient AEX protocol.
The optimized step-gradient protocol offers various advantages over the classical continuous-gradient elution. First, under optimally defined step-elution conditions, peak overlapping and resulting co-elution are minimized compared to a continuous gradient, as we have demonstrated in Fig. 1A and B. Second, under clearly defined separation conditions, each tailored for EC and VC, the method is now independent of their relative proportion in the sample. Interestingly, the method can handle the relative proportions of EC and VC on both extremes. For example, the AEX method reported herein efficiently separated (1) the empty capsid standard where the individual proportion of EC and VC is >95% and <5%, respectively, and (2) the vector capsid standard where the full vector proportion is ∼80%. Third, because EC and CG are eluted separately in different steps, the effect of chromatographic flow rate, which otherwise may have a substantial impact on the overall resolution under a continuous-gradient mode of elution, is negligible. Fourth, the step-gradient protocol also offered higher sensitivity and better accuracy in the analysis (Supplementary Fig. S2D). Moreover, because of no peak overlapping, the baseline and the peak area integration parameter (e.g., valley-to-valley, used for quantitation herein) were easier to define.
Notably, both peak height and peak area-based analyses were suitable for constructing the standard curve for absolute quantification of AAV capsids (Supplementary Figs. S4A, B and S5). However, peak area-based analysis offered better accuracy for the determination of % EC and CG (Supplementary Fig. S4C, D), and hence selected for both absolute and relative quantification purposes.
While the 260/280 nm absorbance was used as an in-line detection and a direct method of differentiation between EC and CG, the native fluorescence was also used for both detection and quantitative analyses. Due to the higher sensitivity and specificity of the 280 nm Ex/336 nm Em signal for protein over DNA, it was adopted for the quantitative analysis and establishing method validation parameters, among others, such as sensitivity and linear range of quantification. The protein-specific response of the fluorescence detection allows quantifying EC and CG not requiring capsid and vector DNA molar absorption coefficient values. In contrast, in UV absorbance-based analysis, these values have to be known or practically determined for accurate quantification. Moreover, a well-defined baseline under fluorescence mode (Fig. 1D), compared to UV detection, had a lower noise and hence increased sensitivity of the detection as reflected in LOD values reported in Table 2.
Different from widely used sv-AUC or TEM, the proposed AEX-HPLC method is more sensitive, thus not necessitating a highly concentrated sample (or a very high amount of the analyte). Moreover, unlike TEM, AEX-HPLC allows simultaneous quantification of both relative (% proportion) and the absolute amount of EC (Cp/mL) and CG (VG/mL) in an affinity-purified sample. The AEX-HPLC method can also be used as a readily accessible and additional tool for AAV drug product characterization in research or quality control laboratories. A high degree of automation offered by HPLC also provides higher reproducibility and simplicity in the overall operation and handling of the sample.
In conclusion, primarily based on the net negative charge of a biomolecule, a universal property of AAV capsids, the herein proposed AEX-HPLC method demonstrated for AAV5 and AAV8 can also be adapted for other serotype quantification by introducing serotype-specific adjustments in HPLC method conditions.
Footnotes
Authors' Contributions
Conceptualization, P.R.H.J., P.S.C., and A.K.; design of experiments, P.R.H.J., A.B., P.S.C., and A.K.; AEX-HPLC method development and validation, P.R.H.J.; AAV5 production, purification, and characterization, P.R.H.J.; writing-original draft, P.R.H.J.; review and editing, P.S.C., A.B., and A.K.; funding acquisition, A.K.; resources, P.S.C. and A.K.; Supervision, P.S.C. and A.K.
Acknowledgments
The authors would like to thank Aleš Štrancar (BIA separation) for providing a gift sample of the monolith anion exchange column. The authors would also like to thank Julia transfiguracion (National research council of Canada, Montreal) for providing valuable guidance in HPLC operation and method development.
Author Disclosure
No competing financial interests exist.
Funding Information
P.R.H.J. is financially supported through a grant from the Natural Sciences and Engineering Research Council (NSERC RGPIN-2015-05132) of the government of Canada. A.K. is a recipient of a Canada Research Chair (CRC/240394).
Supplementary Material
Supplementary Figure S1
Supplementary Figure S2
Supplementary Figure S3
Supplementary Figure S4
Supplementary Figure S5
Supplementary Table S1
Supplementary Table S2
Supplementary Table S3
Supplementary Table S4
Supplementary Calculations
References
Supplementary Material
Please find the following supplemental material available below.
For Open Access articles published under a Creative Commons License, all supplemental material carries the same license as the article it is associated with.
For non-Open Access articles published, all supplemental material carries a non-exclusive license, and permission requests for re-use of supplemental material or any part of supplemental material shall be sent directly to the copyright owner as specified in the copyright notice associated with the article.