
Abstract
Global spread of Zika virus in 2015 and 2016 highlighted the importance of surveillance to rapidly detect, report, and respond to emerging infections. We describe the lessons learned from the development and deployment of a web-based surveillance reporting system for Zika virus and other acute febrile illnesses (AFI) in Guangdong and Yunnan provinces, China. In less than 2 months, we customized the China Epidemiologic Dynamic Data Collection (EDDC) platform to collect, manage, and visualize data in close to real time. According to provincial and sentinel hospital staff requirements, the customized platform provided specific user authorization management, online/offline data collection, data quality control, and secure data transmission and protection and visualization tools. AFI case data and laboratory test results were entered through a web-based interface by hospital and provincial-level staff and saved on a China CDC server in Beijing. The dashboard visualized aggregate data by hospital, age, onset date, and laboratory test results. From June 2017 to December 2018, data from 768 patients with AFI were entered into the web-based surveillance system and visualized by hospital and provincial-level decision makers. Input from provincial and hospital staff was essential for developing the AFI case-reporting and feedback tools appropriate for specific settings and decision-making requirements. Web-based systems (eg, EDDC, data collection, and visualization tools that can be easily adapted to meet local surveillance needs) can help shorten time for system deployment, thereby strengthening global health security to rapidly detect and respond to emerging infections and outbreaks.
In January 2016,
To determine if Zika virus and other emerging pathogens were circulating in China, we conducted an acute febrile illness (AFI) sentinel surveillance project in Guangdong and Yunnan provinces in southern China. This was a hospital-based project aimed at detecting and reporting unidentified febrile illnesses not localized to an obvious organ system that could be due to Zika virus or other emerging infections and, therefore, could assist in the early detection of possible epidemics. In both provinces, dengue outbreaks occur seasonally, and Aedes aegypti and albopictus, the mosquito vectors responsible for Zika virus transmission, are present. 3 The surveillance project was implemented from June 2017 to May 2019 in collaboration with the Guangdong Centers for Disease Control and Prevention (GCDC) and the Yunnan Institute of Parasitic Diseases (YIPD). The project collected demographic, clinical, and epidemiologic risk factors and results from 2 laboratory diagnostic testing platforms: the Trioplex test kit 6 for dengue, Zika, and chikungunya and the TaqMan Array multipathogen test card (TAC) for 34 different infections. 7
Because of differences in the structure, size, and locations of sentinel hospitals and laboratory testing sites, the project faced several data management challenges. These challenges included ensuring standard, quality data collection; linkage of laboratory test results to demographic, clinical, and epidemiologic case data; and rapid analysis and feedback for local decision makers. Data ownership and sharing were key administrative concerns. Collecting case data and diagnostic test results using spreadsheets, email, or noninteroperable systems could create delays and cause data integrity and patient confidentiality concerns. Project staff opted against sharing raw case-based data between hospital and laboratory testing sites across the 2 provinces. To address these challenges, we designed and deployed an AFI surveillance system using a customized version of the Epidemiologic Dynamic Data Collection (EDDC) platform, an existing web-based data collection platform previously developed by China CDC in 2011. 8
In this article, we describe the design, implementation, and lessons learned from the customization process, with results reflecting surveillance data collected from June 2017 through December 2018. These lessons can be applied to the future development and deployment of surveillance reporting systems for rapidly detecting and responding to emerging infections and outbreaks, a key goal for achieving global health security. 9
Methods
Setting
Public health officials in Jiangmen City, Guangdong Province, and in Mengla County, Yunnan Province, agreed to participate in this project. Jiangmen City is located in south-central Guangdong Province, in the western region of the Pearl River Delta. In 2016, the population of the city was 4,544,000. Enping Renmin Hospital, Enping Shahu Renmin Hospital (in Enping County), Xinhui Renmin Hospital, and Xinhui Siqian Renmin Hospital (in Xinhui District) were selected as sentinel hospitals for the AFI surveillance project. Real-time Trioplex Polymerase Chain Reaction (rt-PCR) testing was performed at the Jiangmen City CDC laboratory, and TAC testing was performed at the Guangdong CDC laboratory in Guangzhou (Figure 1).
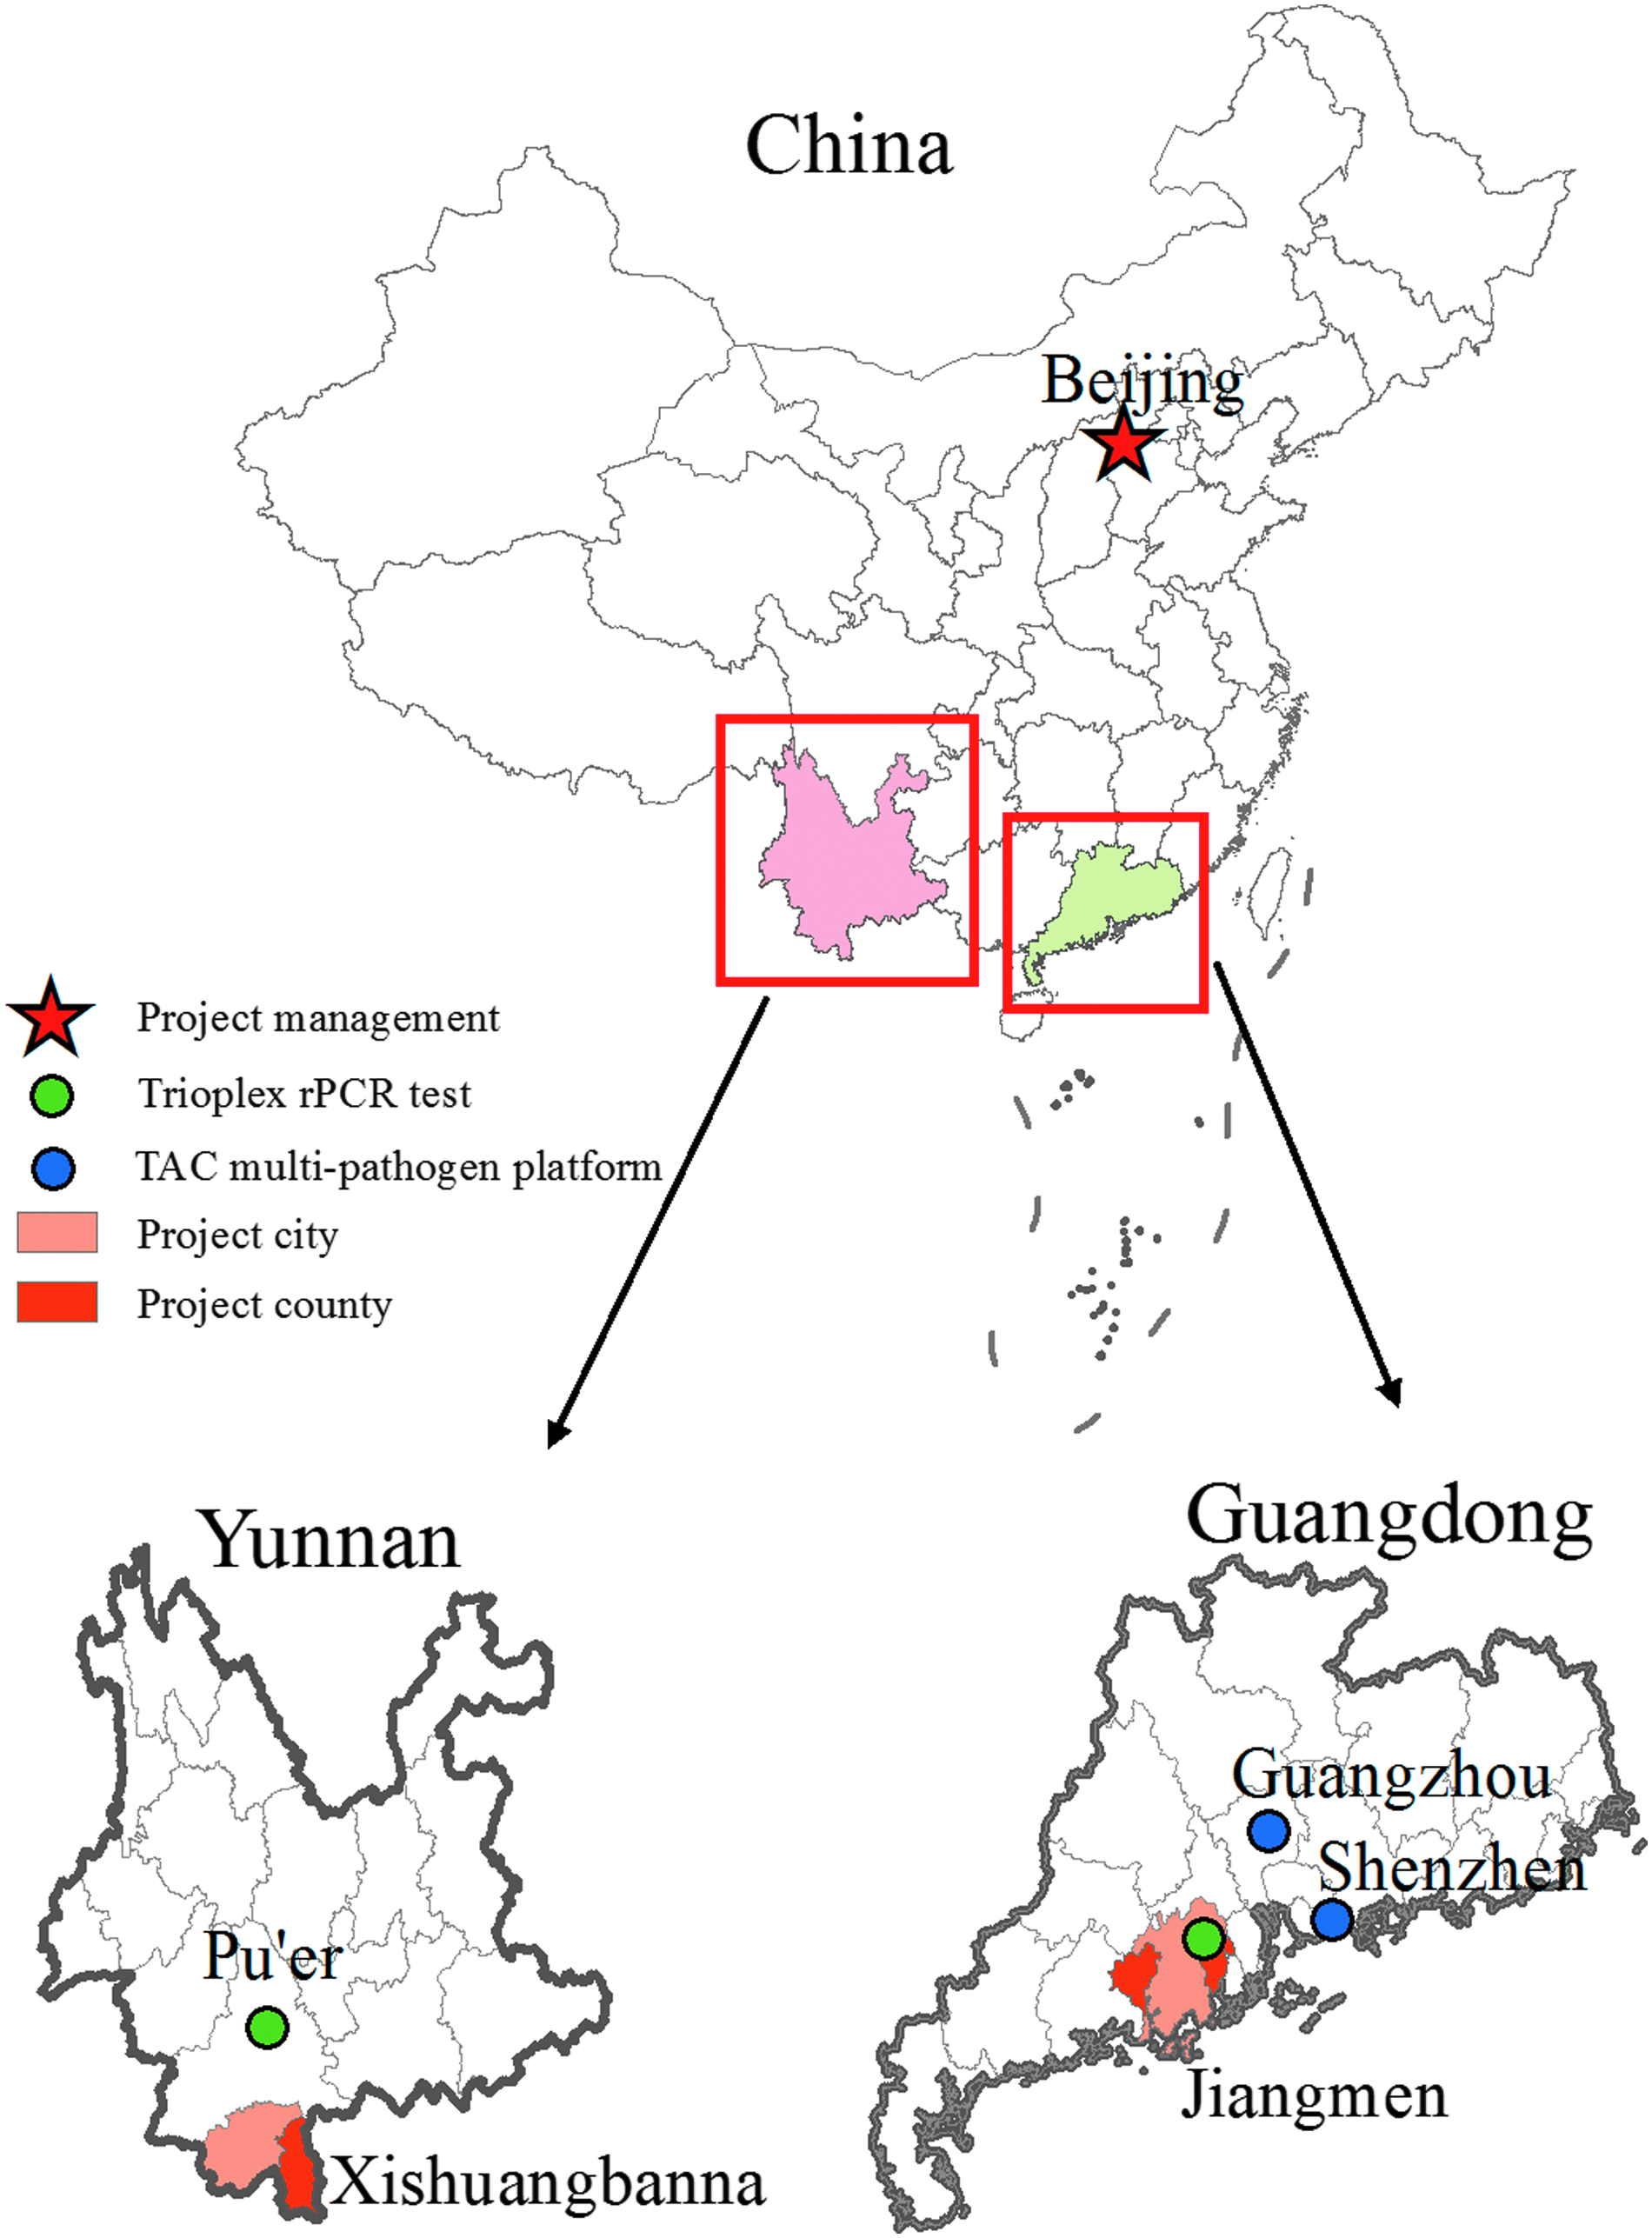
Acute febrile illness surveillance project locations in Guangdong and Yunnan provinces, China, June 2017 to December 2018.
Mengla County is located in southern Yunnan Province and borders Vietnam, Laos, and Myanmar to the east, south, and west, respectively. In 2016, the population of Mengla County was 291,900, representing 26 different ethnic minority groups. Mengla County CDC selected People's County Hospital as the sentinel hospital for the AFI surveillance project. Real-time Trioplex PCR testing was performed at the Yunnan Institute of Parasitic Diseases (YIPD) in Pu'er, Yunnan, and TAC testing was performed at China's Customs and Quarantine Station in Shenzhen, Guangdong Province.
System Design and Development
The EDDC architecture has been previously described elsewhere. 8 In brief, the EDDC platform (version 6.7) was created by a Browser/Server mode, using the JavaEE architecture and common Java frameworks/library, including Spring framework and Apache Commons. The background database used MySQL. EDDC was designed to be accessed according to a standardized user interface. Users operate within the web browser and program-specific guidelines for data quality control (based on EpiData CHECK language). EDDC provides the following functionalities: (1) customization, (2) complex data quality control, (3) online/offline data collection, and (4) specific user authorization management. The general workflow of EDDC includes questionnaire customization, task publishing, user management, online/offline data collection, data submission, and online data access and export (in an Excel or XML format). The EDDC platform adheres to China CDC's guidelines on surveillance system business processes (see Supplementary material at https://www.liebertpub.com/doi/suppl/10.1089/hs.2019.0079). In collaboration with project staff in Guangdong and Yunnan provinces, 4 new functionalities were added.
Data Integration
The AFI surveillance system required users to access and enter project data from different locations. Project staff at each of the 5 sentinel hospitals completed and entered data from the case investigation forms (demographic, clinical, and epidemiologic risk factors) into the AFI surveillance system. YIPD and Jiangmen City CDC staff performed and entered the Trioplex test results into the system, linking the results to case data by a unique project ID. All raw data generated from TAC testing were first uploaded into Multi-Schema Information Capture system (MuSIC, University of Virginia) and verified (according to Ct values) by project staff at the University of Virginia and then forwarded to China CDC in Beijing.
Data integration required linkage of the AFI case data from the 5 sentinel hospitals with laboratory test results from the 4 project laboratories by a single unique project ID; this occurred on the China CDC server (Figure 2). The EDDC platform provided flexibility to add, modify, or delete fields according to changes in surveillance system requirements. In mid-2018, the data collection form and database were modified to include fields for Japanese encephalitis (JE) and yellow fever (YF) vaccination status and for history of mosquito bites within the past 2 weeks. We included these fields as possible risk, or protective, factors, for AFI. 10
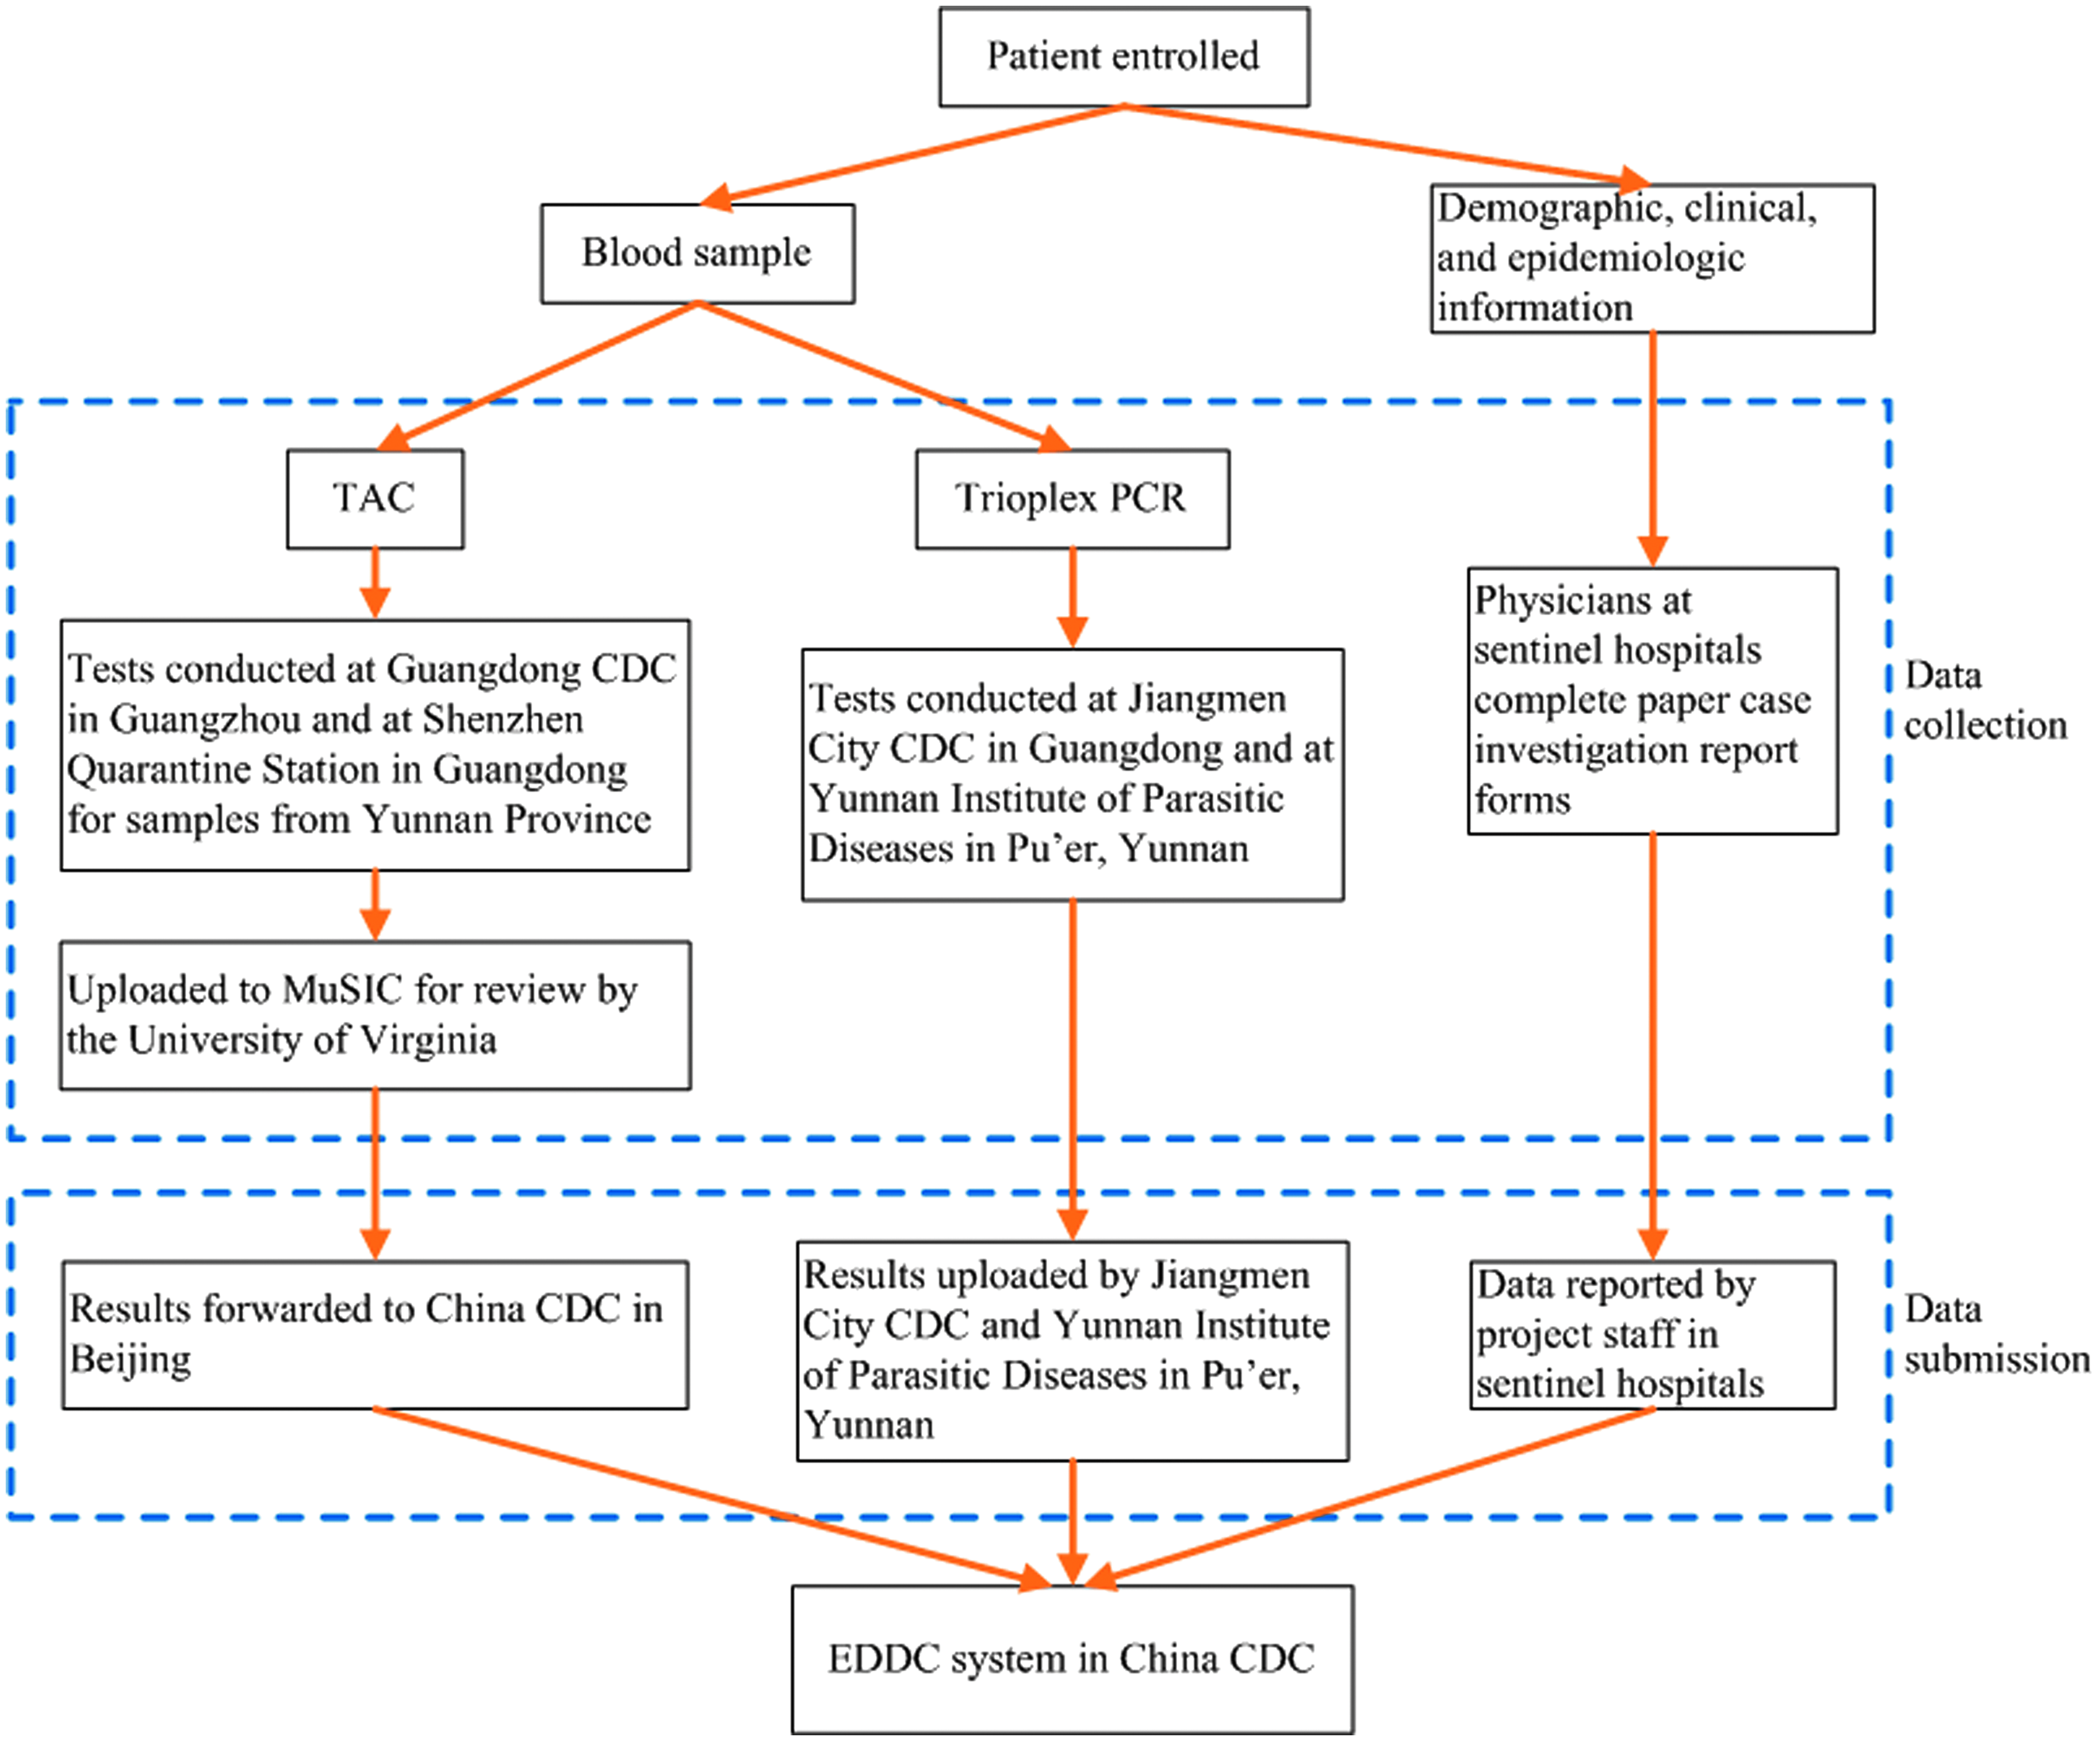
Flow chart of data integration from sentinel hospitals and laboratories participating in the acute febrile illness (AFI) sentinel surveillance system, Yunnan and Guangdong provinces, China, 2017-2018Note. TAC = Taq Mann Array Card; rt-PCR = real-time Trioplex polymerase chain reaction; EDDC = Epidemiologic Dynamic Data Collection; China CDC = Chinese Center for Disease Control and Prevention.
Authorization Requirements
According to the AFI case reporting and laboratory testing procedures, the project involved 5 levels of users at the national, provincial, city, county, and hospital levels. Provincial-level users were further defined in 4 roles: management, epidemiology data, Trioplex rt-PCR, and TAC results (input, modify, delete, and view). Users could access only data collected and entered according to their authorization level. For example, project staff with Jiangmen City CDC could access only case and laboratory data from AFI cases identified at the 4 sentinel hospitals located in the city.
Statistical Tables and Dashboard
The following fields were used to generate statistical output: sentinel hospital, gender, age, onset date, and etiology. The dashboard displayed Trioplex test results. The statistical output and corresponding dashboard were updated automatically when new case data were entered, edited, or deleted. Dashboard displays of hospital and provincial-level data could be viewed by all project staff, but access to raw data was determined according to specific roles and user authorization.
Mapping Case Data
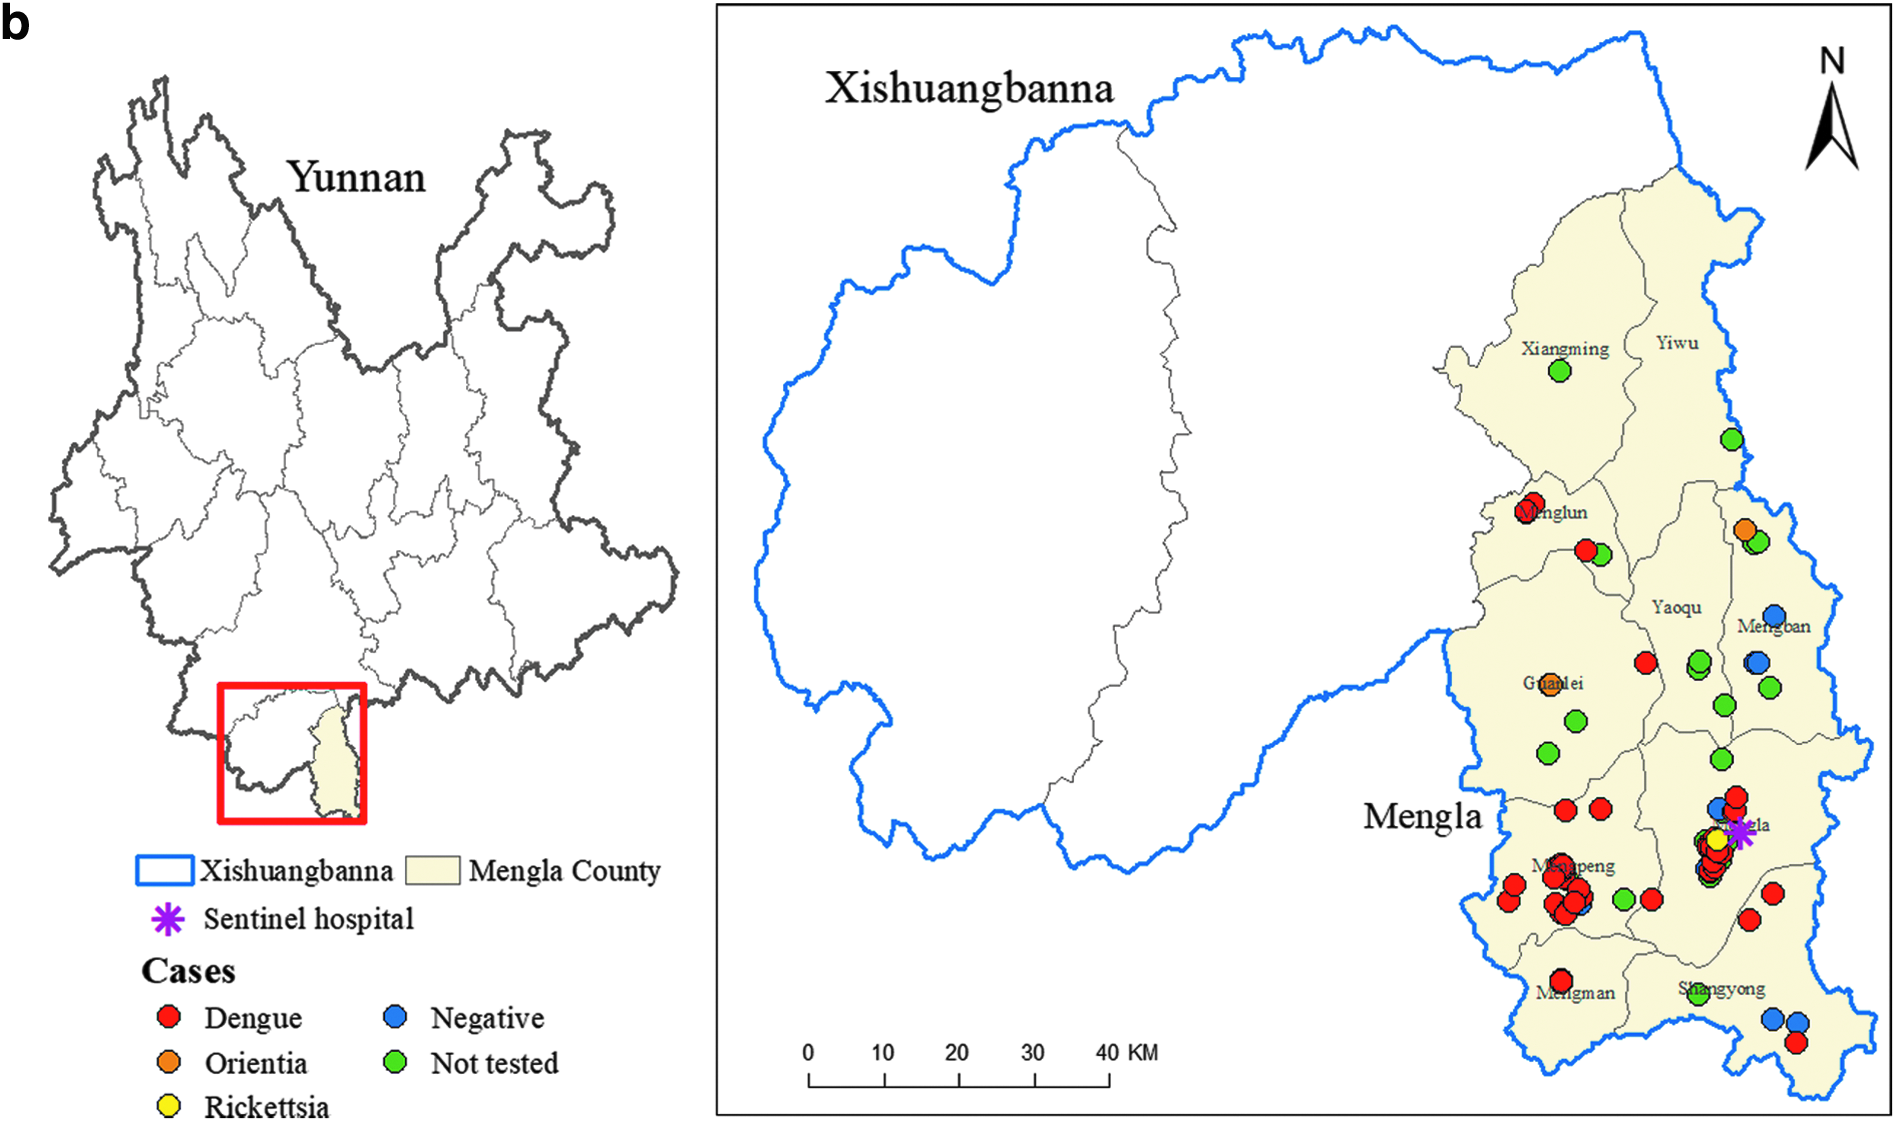
A geographic information system (GIS) module was embedded in the EDDC platform and can be used for mapping case location using latitude and longitude coordinates. Because linking the case address to specific coordinates in the customized AFI surveillance system was beyond our project scope due to deployment time constraints, we created maps of TAC test results according to the zip code recorded in the AFI case investigation report form at China CDC. These maps were created using ArcGIS (Redlands, WA, version 10.3) and shared with project staff through email for AFI case monitoring.
Local Project Staff, Training, and Pilot-Testing Input
We visited project staff to better understand data management procedures and local system requirements. During these visits, we received input on the design of the web-based data entry screen and dashboard output and on determining the roles and assigning authorizations for using the AFI surveillance system. We provided training on data entry, editing, and downloading for analysis, and we pilot-tested the system's functionality. Additionally, based on an agreement among local, provincial-, and national-level partners, the accuracy of case records was assessed using logic validation during data entry.
Results
Implementation of Customized AFI Surveillance System
AFI demographic and clinical case data were reported to the surveillance system within approximately 1 week of enrollment (median time: 7.6 days, interquartile range [IQR]: 4.6 to 11.6 days). Variability in reporting timeliness reflected backlogs due to evolving outbreaks, disruptions in data entry to observe national holidays, and changes in staff responsibilities due to human resource constraints.
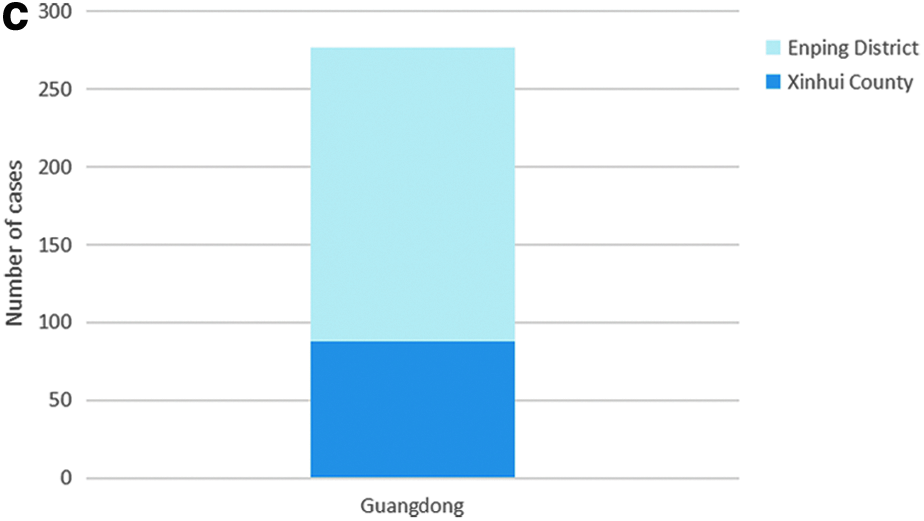
From June 2017 to December 2018, 768 AFI cases were reported to the EDDC-AFI surveillance system. Of these, 491 (64%) were reported from the Mengla County sentinel hospital in Yunnan Province, and 277 (36%) were reported from the 4 sentinel hospitals in Guangdong Province. The 277 cases reported from Guangdong Province included 138 (50%) cases from Enping Renmin Hospital, 72 (26%) cases from Xinhui Renmin Hospital, 51 (18%) cases from Enping Shahu Renmin Hospital, and 16 (6%) cases from Xinhui Siqian Renmin Hospital. Due to the need to collect, store, and ship specimens from the sentinel hospitals to the laboratory sites, reporting lags were observed for Trioplex and TAC test results.
Statistical Analysis and Dashboard
The statistical output and dashboard were visualized in 7 different graphs, displaying a combination of AFI case enrollment, enrollment date, case nationality, and Trioplex test results by province and sentinel hospital. The status of AFI case enrollment by province was displayed when project staff logged into the web-based system and were updated automatically as new case data were recorded in the database. The statistical output and dashboard allowed project staff and decision makers to monitor enrollment of AFI cases and occurrence of unusual or re-emerging infections. Figures 3a-c present examples of output displayed in the AFI project dashboard, including the distribution of case enrollment by month, sentinel hospital, and city. China CDC staff generated maps displaying TAC testing results by province (Figures 4a and 4b).
Dashboard displays from acute febrile illness (AFI) surveillance at 5 sentinel hospitals in Yunnan and Guangdong provinces, China, June 2017 to December 2018.a. AFI case enrollment by month, Mengla County, Yunnan Province, and 4 sentinel hospitals in Guangdong Province, June 2017 to December 2018.
AFI case enrollment by sentinel hospital, Yunnan Province and Guangdong Province, June 2017 to December 2018Note. XHRM = Xinhui Renmin Hospital, Guangdong; XHSQ = Xinhui Siqian Renmin Hospital, Guangdong; EPRM = Enping Renmin Hospital, Guangdong; EPSH = Enping Shahu Renmin Hospital, Guangdong; MLRM = Mengla People's County Hospital, Yunnan.
AFI case enrollment in Guangdong Province, June 2017 to December 2018.
AFI surveillance project locations in Jiangmen City, Guangdong Province, June 2017 to December 2018.
Project location in Mengla County, Yunnan Province, June 2017 to December 2019.
Time to Develop, Deploy, Monitor System
We designed and developed the AFI project specific data collection tools, including content and format, and dashboard in approximately 6 weeks. This included time to customize the EDDC platform, agree on roles and user authorization, and incorporate input and recommendations from project staff. Two additional weeks were required for training and pilot-testing. During this time, a total of 81 staff received training, 71 in Guangdong Province and 10 in Yunnan Province. Because not all fields required input, the addition of new fields in 2018, including previous JE and YF vaccinations, were easily incorporated in the AFI surveillance system (previous records could maintain a null value).
Lessons Learned
Development and deployment of integrated web-based surveillance systems to detect and rapidly respond to emerging infectious diseases are key goals for achieving global health security. 9 Consistent with these goals, we successfully customized EDDC, an existing web-based surveillance platform, to capture AFI case data and laboratory test results from 5 sentinel hospitals in 2 Chinese provinces. The dashboard provided feedback and visualization tools for monitoring surveillance data close to real-time while guaranteeing local data ownership. Involvement of end users in the web-based AFI surveillance system design and development encouraged local engagement, likely having a positive impact on data quality11-13 (Table 1). The project highlighted the importance of developing flexible surveillance systems that can be modified according to changes in reporting requirements.
Summary of solutions and lessons learned for problems and concerns identified during the development and deployment of the acute febrile illness (AFI) web-based sentinel surveillance system in Yunnan and Guangdong provinces, China, 2017-2018
Collecting and Reporting Surveillance Data
In our AFI surveillance project, staff at the sentinel hospitals used paper case investigation forms for collecting demographic, clinical, and epidemiologic information. Data from these forms were later entered in the AFI surveillance database. These reporting procedures likely improved data comparability (by using the same data fields and format) but required additional staff time. Use of mobile devices for simultaneous data collection and entry into the project database could reduce the time and resources required for conducting infectious disease surveillance and responding to public health emergencies.12,14 Because EDDC supports this functionality, future projects should incorporate the use of mobile devices for data collection. This can allow users to enter information directly into an electronic version of the case investigation form. When users have internet access, case data can be automatically uploaded to the surveillance database, minimizing delays between case detection, reporting, and visualization for decision makers. This approach could also address staffing gaps for manual data entry due to holidays and other human resource constraints. The use of mobile devices for data collection, however, should be balanced with the potential need for complex case investigation information (ie, open-ended questions) that can be difficult to record on mobile devices, 12 time for additional predeployment training, 14 and possible local requirements for maintaining paper-based case investigation report forms.
Real-time Visualization of Data
Several criteria have been outlined to determine whether a dashboard can be useful. 11 These criteria include: a need for data visualization exists, an analysis and sharing mechanism is established, and structured and regularly updated data streams using available data collection processes are already in place. These criteria were met for the AFI surveillance project. Input from hospital-, county-, and city-level project staff was critical for the development of the project dashboard and also helped strengthen relationships across the various jurisdictions.11,13-15
Project staff could monitor the AFI surveillance project as soon as case data and laboratory results were entered into the web-based database. Because raw TAC results were forwarded to the University of Virginia for review and verification, and to avoid additional data entry work by project staff at Guangdong CDC or YIPD, China CDC uploaded the TAC results directly into the AFI database. Additional time to ship specimens and run the TAC tests in batch in Shenzen, Guangdong (for specimens collected in Mengla County, Yunnan), and in Guangzhou, Guangdong, reduced the usefulness of the dashboard for communicating close-to-real-time information on the etiology of enrolled AFI cases. Because Trioplex testing was performed in Pu'er, Yunnan, and Guagnzhou, Gaungdong, the reporting lag for Trioplex test results was shorter. Assessing local diagnostic capacity and need for rapid etiology results can assist in determining the expected benefits of designing and deploying a near real-time web-based surveillance reporting system and dashboard. When possible, increasing laboratory capacity at local-level hospitals can help strengthen infectious disease detection, reporting, and monitoring.
Time Required
We developed the initial AFI surveillance system in approximately 8 weeks, close to the time to develop and deploy similar web-based surveillance systems, including during the 2014-2016 West Africa Ebola outbreak in Guinea. 14 Familiarity with web-based hospital information systems and national infectious disease reporting requirements facilitated training and use of the EDDC-AFI surveillance system. In the future, core demographic and clinical case investigation forms and corresponding dashboard displays can be developed and stored on file to further decrease the time required for revising, testing, and deploying surveillance systems for other targeted diseases, syndromes, or health emergencies.
Based on the goal to implement the project at the start of the 2017 rainy season in southern China and related time constraints, we were unable to display the geographic distribution of case-data as part of the dashboard for this surveillance project. Based on recommendations from provincial-level staff, we have added township codes to the EDDC platform. The system will be able to link these codes to the address of each case report and generate close to real-time maps on the location of AFI cases and potential outbreaks. Maps and other visual displays can reduce the need for routine data analysis by local staff and ensure that surveillance systems serve as a tool for bidirectional information sharing.12,13
Data Ownership and Local Engagement
The EDDC-AFI surveillance data were saved on China CDC servers. Although the platform can be deployed on a local or provincial-level server, this could limit the ability of project staff in the 2 provinces and at the national level to monitor findings from the 5 sentinel hospitals. To address potential concerns, we included features during the customization process that limited access to the project database for entering, editing, and downloading according to user authorization. While project staff with Guangdong CDC, for example, could edit and download AFI data from all 4 sentinel hospitals in Jiangmen City, staff at each hospital were able to edit and download only data collected by their respective hospital. This decision helped maintain local data ownership while allowing access to project data for further analysis and investigation at the city and provincial levels as required for public health practice and responding to emerging outbreaks.11,14 This decision also helped to strengthen trust between project partners, which is essential for all effective public health surveillance projects.12,15 According to project staff, the EDDC-AFI surveillance system was easy to use, flexible (could be modified to address changes in reporting requirements, eg, adding fields for JE and YF vaccination), included a feedback mechanism, safeguarded patient confidentiality, and ensured local data ownership. These characteristics likely strengthened local “buy-in” and probably improved data quality and should be considered when designing and deploying new surveillance systems.11-13
Existing Platforms and Open Source Tools
Development and deployment of the EDDC-AFI surveillance reporting system provided a number of advantages compared to the existing National Notifiable Disease Reporting System (NNDRS) maintained by China CDC in Beijing. Although NNDRS has been a web-based system since 2004, only basic demographic data are reported, and the system does not yet provide a feedback mechanism for provincial or local hospital staff. Case classification is determined according to a clinical diagnosis or laboratory confirmation. Dengue and chikungunya were notifiable diseases when our project was implemented; Zika virus was not. Customization of an existing platform helped ensure provincial- and local-level approval for deployment of the EDDC-AFI surveillance system and allowed the collection of more detailed epidemiologic and clinical data on patients presenting with AFI compared to the existing national surveillance system. The project also demonstrated the availability of open source tools such as Apache Commons and MySQL database management systems that can be used to develop, adapt, and deploy web-based surveillance reporting systems and dashboards.11,14
Conclusion
We successfully customized the EDDC platform for the AFI surveillance project, including the development of a dashboard as a visual feedback tool for local staff. Several lessons were learned that can be applied to future surveillance system development. Project staff and stakeholder engagement are critical in the system design. Despite integration across administrative and geopolitical units, ownership of locally acquired and reported data remains important for both data collection and dissemination. Additionally, statistical analyses and visualization of surveillance data should reflect project staff and stakeholders' needs for decision making. The use of mobile devices for data collection and ensuring local sentinel hospitals have capacity and equipment to conduct required laboratory testing can contribute to the usefulness of the surveillance system and real-time case monitoring. Project staff should consider local laboratory capacity in determining performance expectations prior to deploying a web-based surveillance reporting system and dashboard. The lessons learned from the design, development, and implementation of the EDDC-AFI surveillance system—along with future mapping tools and mobile devices for data collection—can help achieve surveillance priorities needed to achieve global health security.
References
Supplementary Material
Please find the following supplemental material available below.
For Open Access articles published under a Creative Commons License, all supplemental material carries the same license as the article it is associated with.
For non-Open Access articles published, all supplemental material carries a non-exclusive license, and permission requests for re-use of supplemental material or any part of supplemental material shall be sent directly to the copyright owner as specified in the copyright notice associated with the article.