
Abstract
Abstract
Imray, Christopher, Colin Chan, Alison Stubbings, Hannah Rhodes, Susannah Patey, Mark H. Wilson, Damian M. Bailey, and Alex D. Wright for the Birmingham Medical Research Expeditionary Society. Time course variations in the mechanisms by which cerebral oxygen delivery is maintained on exposure to hypoxia/altitude. High Alt Med Biol. 15:21–27, 2014.—Normal cerebral function is dependent upon an adequate and continuous supply of oxygen. This study calculated cerebral blood flow based on assessment of the right middle cerebral artery (MCA) velocity (MCAVel) and MCA diameter (MCADiam) by trans-cranial Doppler and trans-cranial Duplex in normoxia, during acute exposure to 12% normobaric hypoxia for up to 6 hours, and after 3 days exposure to the equivalent altitude, 4392 m, in nine subjects. Mean (SD) MCAVel increased both after 6 hours hypoxia from 76.8 (11.4) to 97.2 (17.4) cms/sec (p<0.001), and after 3 days at altitude from 68.1 (7.5) [sea level] to 76.2 (10.2) [4392 m] (p=0.015). MCADiam increased from 5.07 (0.6) to 6.1 (0.6) mm (p<0.001) after 6 hours of 12% hypoxia. Calculated mean MCA blood flow increased after 6 hours of 12% hypoxia from 5.0 (0.6) mL/sec to 8.9 (1.2) mL/sec, but there was no difference between sea level and 4392 m. Calculated mean cerebral oxygen delivery increased from 72.4 (14.4) to 107 (20.1) mL/sec (p<0.001) after 6 hours of 12% hypoxia and was maintained unchanged at 4392 m. An increase in MCA caliber, rather than blood velocity, was a major contributor to increased oxygen delivery accompanying within the first few hours of exposure to acute hypoxia. During more long-term exposure, increases in MCA velocity and a rise in hemoglobin appeared to be the more important mechanisms in maintaining cerebral oxygen delivery. The implication of this observed change in MCA diameter questions the widely held assumption that MCA velocity is a surrogate for flow during acute hypoxic exposure.
Introduction
N
For the last 40 years, transcranial Doppler (TCD) measurement of flow velocity in the middle cerebral artery (MCA) has been widely used as a surrogate marker for cerebral blood flow (CBF), both at rest and during exercise at altitude (Aaslid et al., 1982; Otis et al., 1989; Baumgartner et al., 1994, 1999; Jansen et al., 2000, 2002; Ter Minassian et al., 2001; Appenzeller et al., 2004; Lysakowski et al., 2004; Norcliffe et al., 2005; van Osta et al., 2005; Imray et al., 2005; Palma et al., 2006; Ainslie et al., 2007; Subudhi et al., 2008). To date, investigators have assumed that the cerebral arterial diameter remains constant in the face of sustained hypoxia, and based upon this assumption investigators have then inferred changes in cerebral blood flow from observed changes in the velocity of blood in the MCA. This assumption has however been disputed (Giller, 2003). Furthermore, the opposite assumption is made in certain clinical situations, for example, in the management of subarachnoid haemorrhage: changes in TCD-derived blood velocity are assumed to represent changes in vessel diameter secondary to vasospasm (Lodi and Ursino, 1999).
Poiseuille's law states that flow in a vessel is proportional to the fourth power of the radius, and consequently relatively small changes in MCA vessel radius would have very large impacts on CBF (Moore et al.). 20 In the past, the measurement of MCA diameter (MCADiam) has only been possible by direct vision at surgery (Giller et al., 1993), by use of contrast angiography (Du Boulay and Symon, 1971), or magnetic resonance angiography—techniques that are inappropriate for remote high altitude field studies. Transcranial Color Doppler Power signal has previously been used to indirectly infer MCA cross-sectional area in a laboratory setting (Poulin and Robbins, 1996). Under conditions of mild hypobaric hypoxia, no significant change in MCA cross-sectional area was noted. The recent development of portable ultrasound devices that incorporate both 2D color flow mapping and simultaneous pulse wave Doppler ultrasonography permits measurement of both vessel diameter and the velocity of the blood within it. The 2D ultrasound ensures the same segment of the artery can be reliably visualized and assessed. This technique has recently been described and validated by magnetic resonance imaging (MRI) (Wilson et al., 2011).
Our hypothesis was that cerebral oxygen delivery (COD) would be maintained on hypoxic exposure by a number of novel mechanisms, including increases in both middle cerebral artery velocity (MCAVel) and middle cerebral artery diameter (MCADiam). In addition, we speculated that there might be a temporal or time-related difference in these responses. In this study, we aimed to use a transcranial Duplex technique to characterize the contribution of altered vessel diameter to changes in middle cerebral artery flow (MCAFlow) and calculated cerebral oxygen delivery (MCACOD) seen in response to acute normobaric hypoxia (Fi
Methods
Ethical approval for this study was obtained from the University of Glamorgan Ethics Committee, and written informed consent was obtained from all participants.
Subjects
Nine subjects [8 male; mean (SD) age 43.5 (14.4): BMI 24.1 (2.8)] were studied. Participants were nonsmokers, normotensive, on no medication, physically fit, living at 50–150 m, and with no recent exposure to high altitude (1500 m within the last 3 months). No caffeine, alcohol, or medication that could affect cerebral blood flow was consumed prior to the measurement on the study day. Immediately before each study, subjects rested in a horizontal position for 15 minutes.
Sea level 12% hypoxia study
After baseline measurements were made in the chamber under normoxic conditions, inspired oxygen was reduced achieving 12% Fi
High altitude study
Subjects flew from the United Kingdom to Arica, Northern Chile, and spent 3 days at sea-level (SL, 0 m), followed by 2 nights acclimatizing at 3300 m (Putre), before ascending to Parinacota village (4392 m). Ascent was by road with minimal physical exercise. Measurements were taken at SL (Arica) and after 24 h at 4392 m.
Measurements
Acute mountain sickness
All subjects completed Lake Louise questionnaires at baseline and after 6 hours hypoxic exposure in the chamber and every morning and evening in the field study. Subjects were considered to be suffering from AMS at any given altitude if the subject had a headache and the questionnaire score was >3 (Roach et al., 1993)
Blood pressure was recorded (mean of three noninvasive recordings) using an automated cuff (Omron M7, IL, USA); arterial oxygen saturation (Sa
Transcranial Doppler
In a supine subject, the right MCA was insonated via the temporal bone window, by one of two skilled observers, using a 5-1 MHz Transducer MicroMaxx™ (Sonosite, Bothell, WA, USA). The clinoid process of the sphenoid bone, the circle of Willis, and the distal internal carotid artery were initially identified, and then the M1 segment (the first section of MCA just beyond the origin of the anterior communicating artery) of the MCA was identified (characterized by flow towards the transducer). Doppler gain was set in a standard fashion (Wilson et al., 2011). An optimal portion of the MCA without branches and with near laminar flow was then selected and the depth recorded. Once identified, the center of the artery was insonated and MCA blood velocity (MCAVel), peak systolic velocity (PSV), end diastolic velocity (EDV), pulsatility index (PI), and resistivity index (RI) calculated by the inbuilt software (see Fig. 2). On subsequent studies, every effort was made to insonate the same depth (to within 1 mm). After 3–5 minutes of insonation, the 2D image movie sequence was saved, and the frame with the maximum vessel diameter (systole) studied. Using the on-screen caliper tool, the width of the vessel at the point of insonation was measured and recorded. The angle of insonation was constant for each individual, since the position of the probe on the temporal bone window and the position on the interrogated section of the MCA, were fixed. All TCD measurements were performed five times.
Calculations
MCA blood flow was calculated using the formula:
Blood oxygen content is usually calculated using the formula
Oxygen delivery per gram hemoglobin was calculated as the product of blood flow and peripheral oxygen saturation divided by hemoglobin concentration. The small quantity of dissolved oxygen (decreasing further at altitude) was not included in the estimation.
Statistics
Within-subject comparisons were made using paired t tests, and ANOVA with Bonferroni correction in SPSS version 18 (IBM, NY, USA), normal distribution was assumed. For all tests, significance was set to <0.05.
Results
Acute mountain sickness
The mean (SD) Lake Louise self-assessment was 2.33 (1.33) at 6 hours in the chamber study and 2.88 (2.12) at 4392 m, p=0.44.
Cardiorespiratory physiology
Changes in mean blood pressure, heart rate, MCA velocity, MCA diameter, cerebral oximetry, peripheral oxygen saturation, hemoglobin concentration, EtCO2 in both studies are shown in Table 1.
Cerebral hemodynamics
MCA velocity
After 6 h of 12% hypoxia, mean (SD) MCAVel increased from 76.8 (11.4) normoxia to 97.2 (17.4) cm/s (p<0.001) and from 68.1 (7.5) to 76.2 (6.0) cm/s after 3 day exposure to hypoxia, 4392 m (p=0.015) (Figs. 1 and 2).
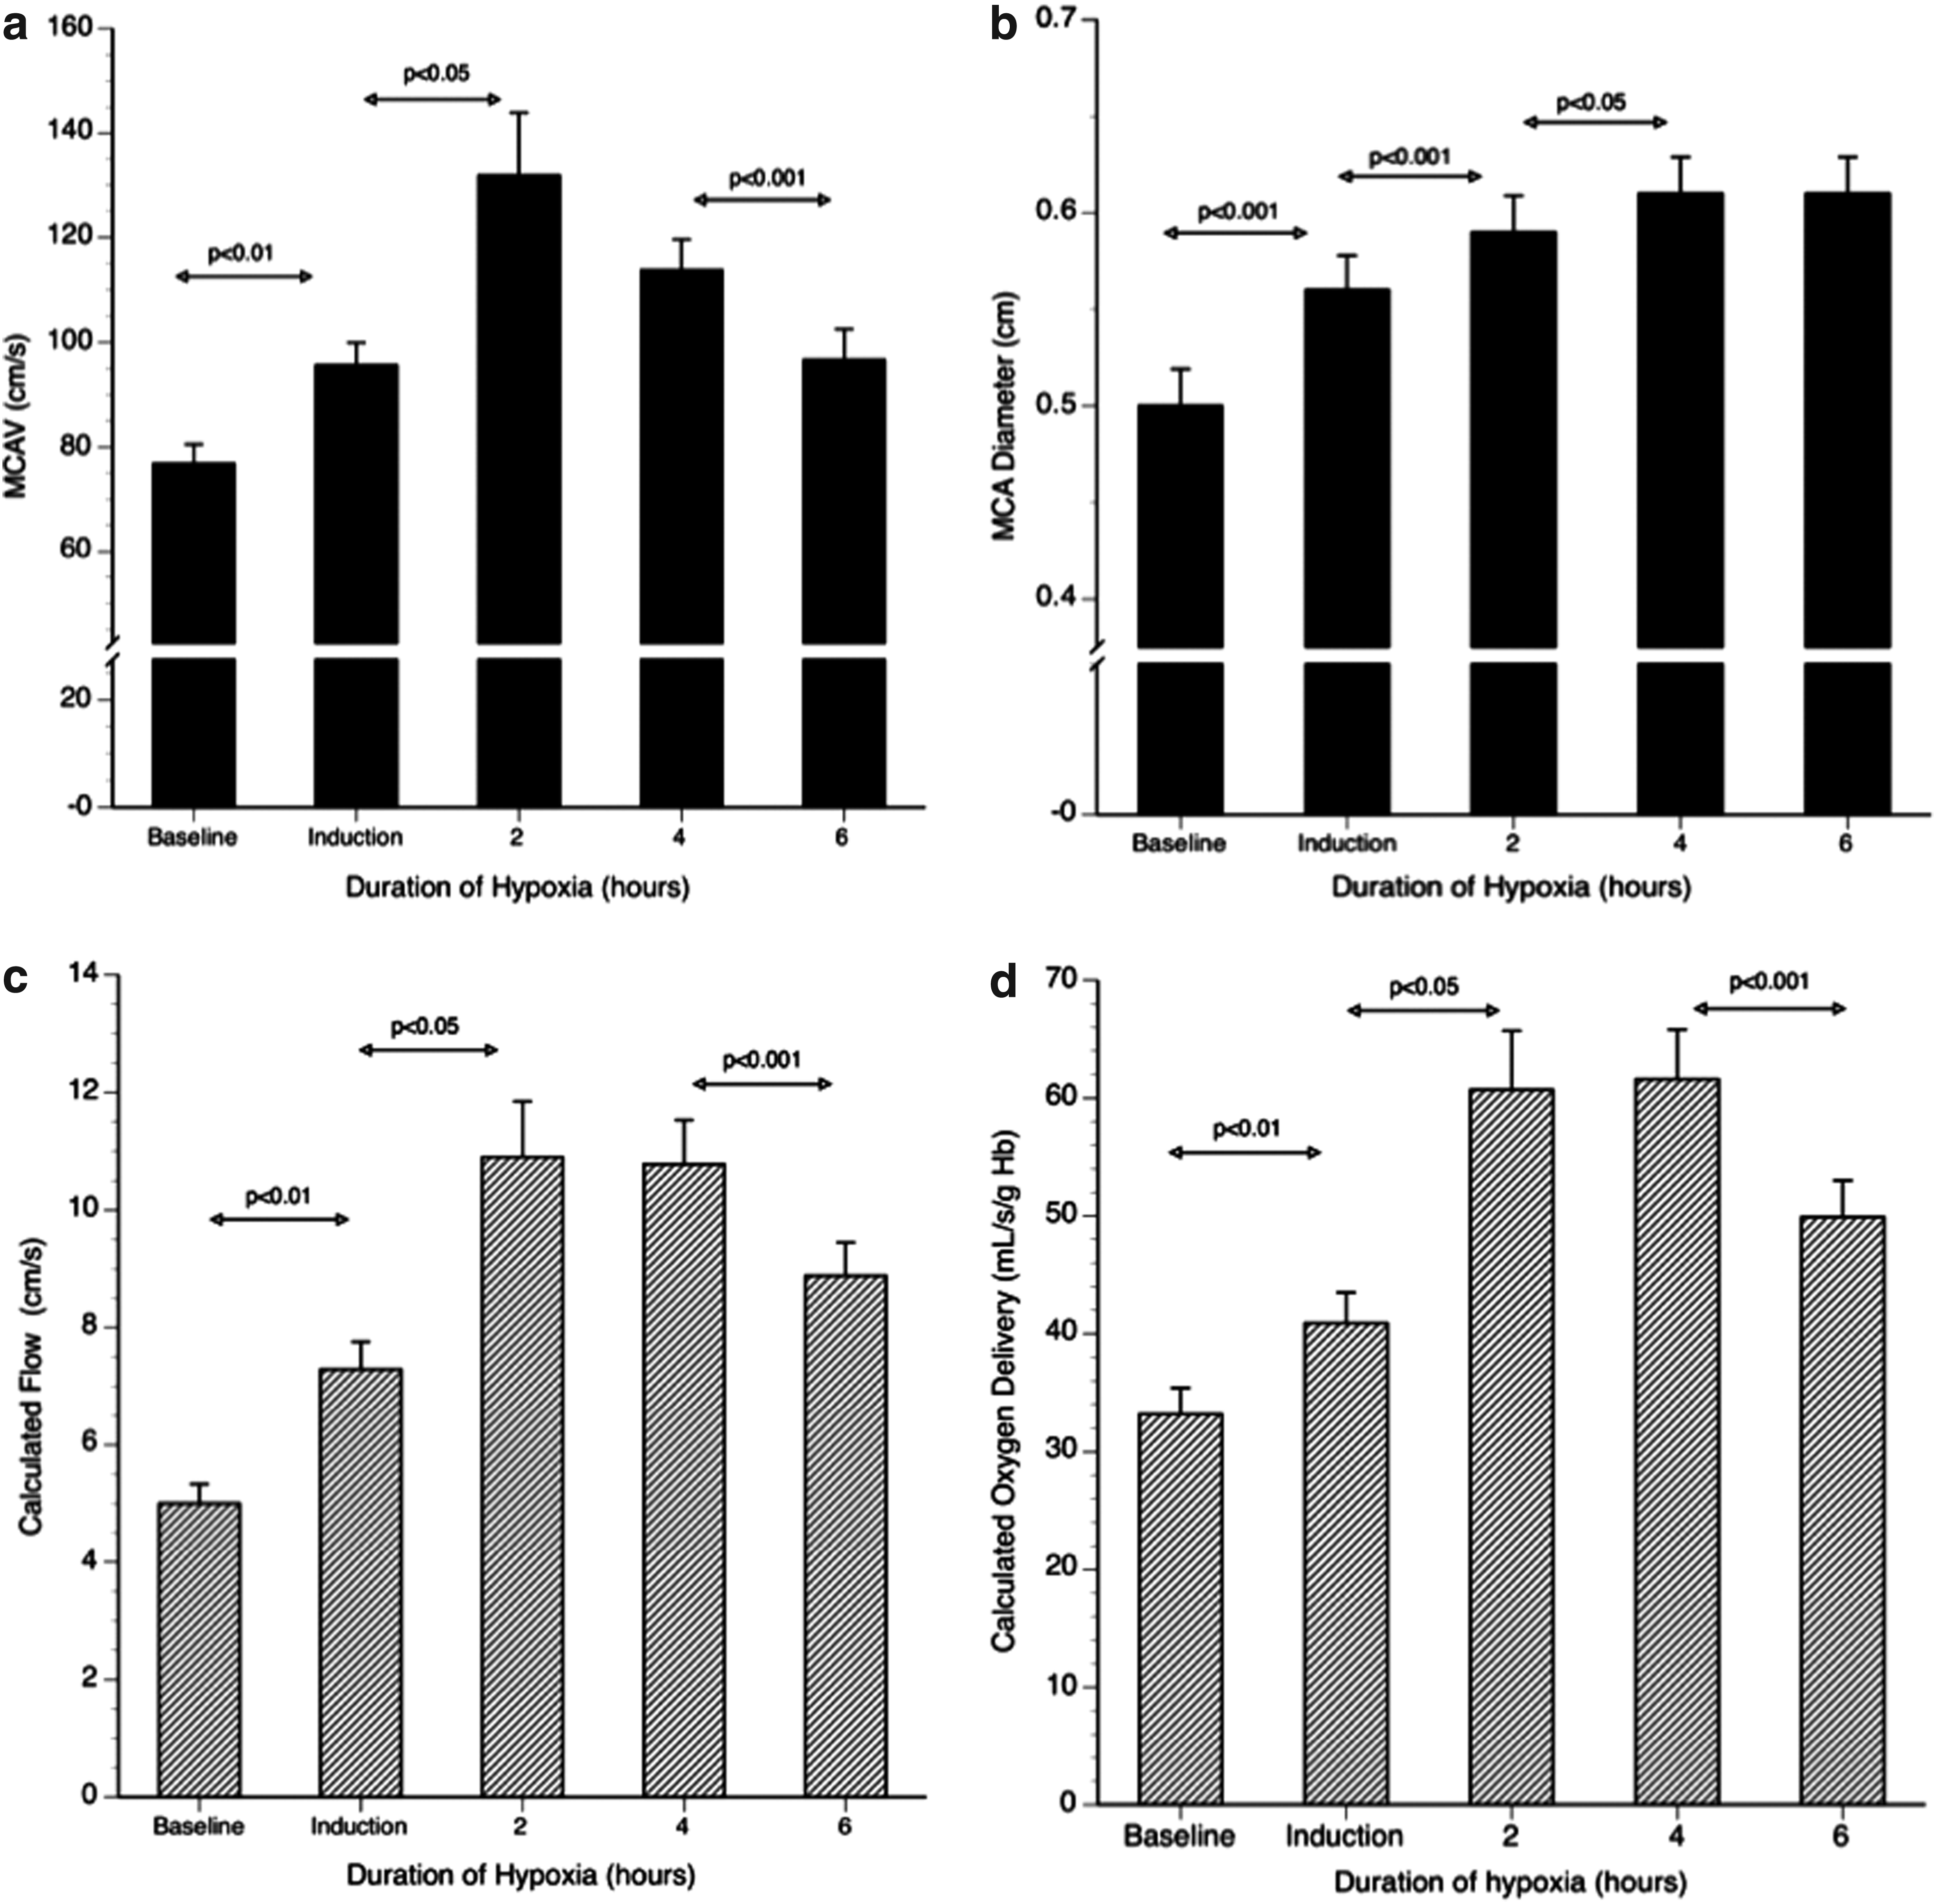
Time course variations over six hours in the middle cerebral artery velocity (MCAV), middle cerebral artery diameter (MCA diameter), and the calculated cerebral blood flow and cerebral oxygen delivery on acute exposure to FiO2 12%.
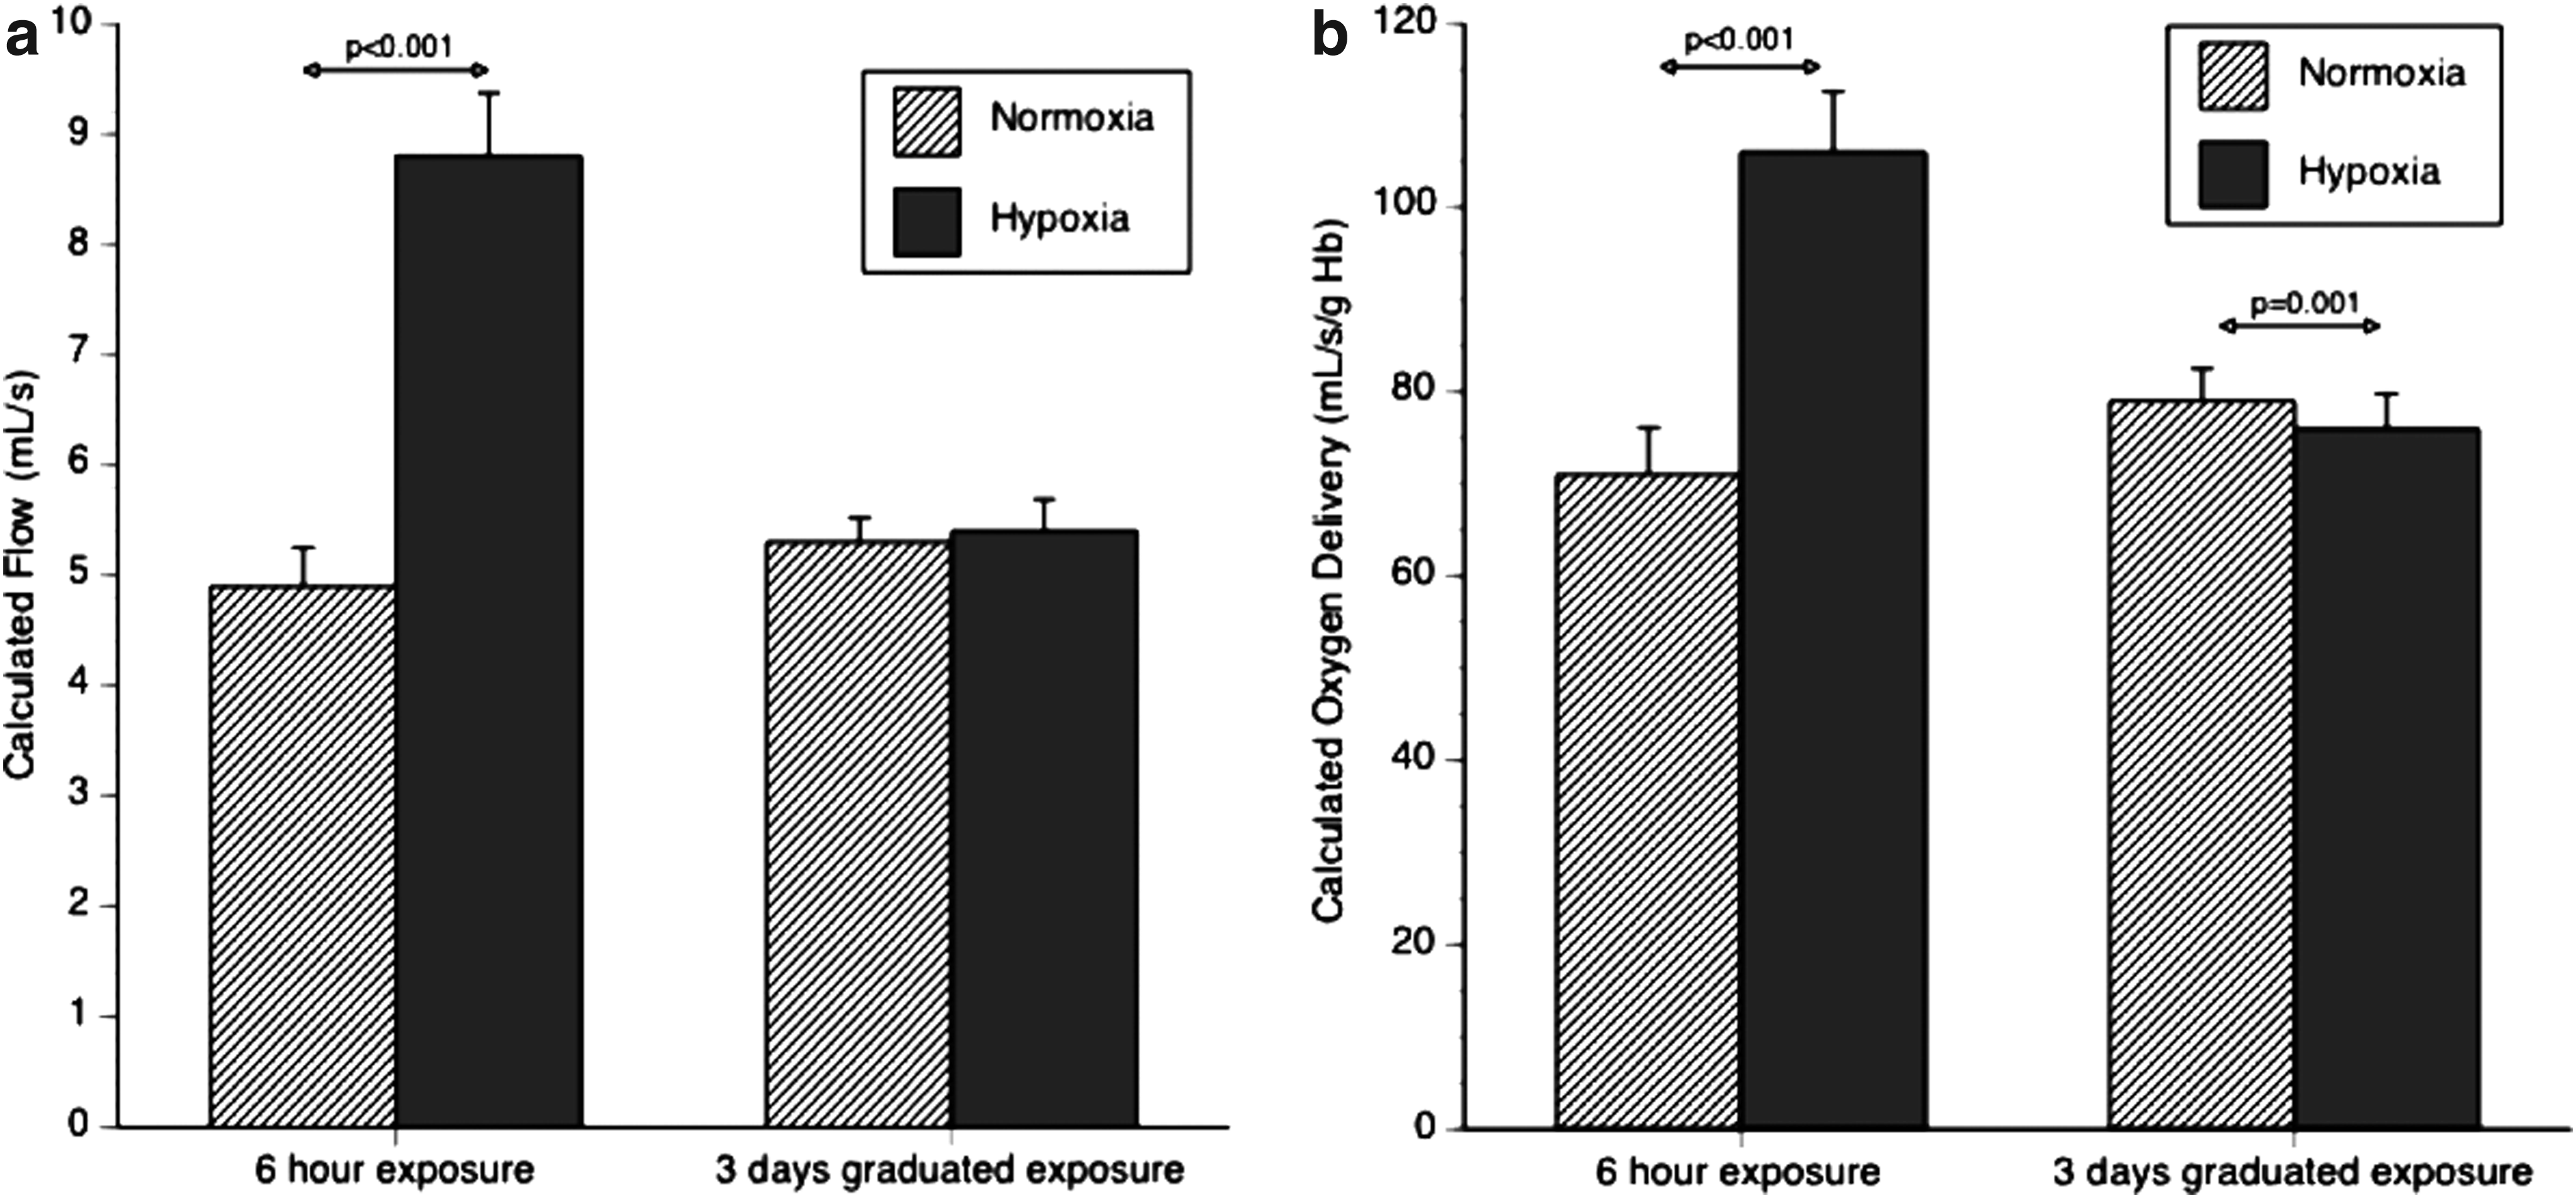
Comparison of calculated cerebral blood flow and cerebral oxygen delivery between six hours (FiO2 12%) and three days (4392 m).
MCA diameter
After 6 h of 12% hypoxia, mean (SD) MCADiam increased from 5.0 (0.6) normoxia to 6.0 (0.6) mm (p<0.001). There were incremental increases in MCADiam peaking at 4 h (Fig. 1). There was no difference in MCADiam after 3 days exposure (4392 m) compared with sea level, Figures 1 and 2.
Cerebral blood flow
After 6 h of 12% hypoxia, calculated cerebral blood flow increased from 5.0 (0.9) to a maximal 10.8 (2.1) mL/sec at 4 h, and 8.9 (1.8) mL/sec at 6 h. There was no difference in calculated cerebral blood flow between sea level 4932 m: 5.3 (0.6) versus 5.4 (0.9) mL/sec NS, Figures 1 and 2.
Cerebral oxygen delivery
Calculated total cerebral oxygen delivery increased from a baseline of 72 (14.4) to 132 (26.7) mL O2/sec at 4 h and remained elevated at 6 h 107 (20.1) mL O2/sec in the chamber. Calculated total cerebral oxygen delivery was unchanged between sea level and 4392 m, 79(10.5) versus 76 (11.4) mL O2/s NS, Figures 1 and 2.
Discussion
This study found that there was marked middle cerebral artery dilatation on acute exposure to 12% oxygen, apparently peaking at 4 h. This study confirms the findings of Wilson et al. (2011) and more recently Willie et al. (2012, 2013), demonstrating that dilatation of the extracranial and intracranial arterial vessels occur under acute hypoxic stress.
Wilson et al. (2011) found no evidence of cerebral arterial vasodilatation on slow ascent over 17 days to 5300 m, and this was similar to our findings on more rapid ascent to 4393 m. Wilson et al. (2011) also found cerebral arterial vasodilatation occurred in acclimatized individuals above 6400 m, and this was reversed rapidly with supplementary oxygen at 7950 m. In addition they found TCD duplex and MRA evidence for middle cerebral artery vasodilatation at 90 and 180 minutes exposure to an Fi
Important and independent supporting evidence that questions the constancy of the diameter of the cerebral vessels is found in Willie et al. (2012). They found, in a laboratory-based hypoxic study, that profound changes in Pa
In our study, we used the technique of transcranial Duplex for measuring MCA diameter, which has recently been validated against MRA (Wilson et al., 2011). By using a combination of assessments of vessel anatomy (from color mapping) and velocity (from pulse wave Doppler), vessel flow can be estimated. The strengths of this study are the use of this validated technique, the paired transcranial measurements using two different time scales, with the same subjects studied both in acute hypoxia with multiple measurements, and at altitude. Weaknesses include the potential selection bias of the subjects being walkers or climbers who had previously travelled to altitude, and so may be self-selecting and able to tolerate hypoxia and reduction of end-tidal CO2. The calculation of cerebral blood flow assumed frictionless laminar flow and does not take account of vessel wall resistance or changes due to any turbulent flow. Further, only maximal MCADiam was used. True measures of flow would have to integrate flow velocity with changes in vessel diameter across the cardiac cycle. Caution should thus be applied when interpreting absolute values and it should be noted that no attempt to control EtCO2 was made. In addition, the small sample size and complex techniques are potential issues when interpreting the results. However, we are confident about the observed trends and relative changes.
Current and established practice uses cerebral blood velocity as an estimate of cerebral blood flow (Baumgartner et al., 1994; Jansen et al., 1999). Whilst velocity is clearly an important determinant of flow, the use of this technique for estimating CBF at a time of changing blood gases assumes the diameter of the blood vessel in which velocity is being measured is constant. Although over 200 TCD studies have been reported in hypoxia or at altitude, there is marked variation in cerebral artery velocity changes (Brugniaux et al., 2007). The time course of early marked vasodilatation, followed by modest/minimal vasodilatation, may in part explain the conflicting measurements of cerebral blood flow on acute ascent to altitude. Our results suggest the greatest inaccuracies in use of TCD MCAV as a surrogate marker for estimation of cerebral blood flow would occur within the first few hours of acute exposure.
A few clinical studies have been able to demonstrate changes in MCA diameter. Valdueza et al. (1997) failed to show any change in MCA diameter on MRI imaging on hyperventilation, and Serrador et al. (2000) when end-tidal CO2 was increased from 36±3 to 40±4 mmHg or reduced to 24±2 mmHg. However, Schreiber et al. (2000) failed to show any effects on MCA diameter after acute acetazolamide. It has been suggested that much of the regulation of CBF lies in the terminal arterioles and pre-capillary sphincters, which would be difficult to measure diameter changes in vivo. However, Hansen et al. (2007) showed an increase in MCA diameter after glyceryl trinitrate exposure, and it has been suggested that caffeine reduced MCA diameter (Lunt et al., 2004). In a recent study, it has been shown that the diameter of the MCA constricts in response to the administration of the α1-adrenergic receptor agonist phenylephrine (Ogoh et al., 2011).
It is widely accepted that subarachnoid blood outside a cerebral artery results in significant vasoconstriction. Our study gives further insights into the contrasting vasodilatory effects of hypoxia and the vasoconstrictive effects of hypocapnia, and in particular the differing time courses on their effects. During the hyper-acute response within a few hours, hypoxic vasodilation appears to predominate. However, by 3 days, the vasoconstrictive hypocapnic response appears to have strengthened. After acclimatization to extreme altitude (6400 m and 7950 m), the vasodilatory component again predominates (Wilson et al., 2011).
Cerebral blood flow can be measured using a number of different techniques, each having certain advantages and also potential associated methodological flaws. Whilst some techniques are better suited to use in the field such as transcranial Doppler ultrasound (TCD) and near infrared spectroscopy (NIRS), others give more detailed information but are restricted to use in a hospital or research institute such as magnetic resonance imaging, radioisotopic or gas inert diffusion techniques. As a consequence, our insights into cerebral perfusion are determined in part by where, how, and when during the ascent to altitude the measurements have been made. Historically, the gold standard for measuring cerebral blood was the Kety and Schmidt nitrous oxide wash out technique, which is independent on the MCA diameter (Kety and Schmidt, 1945; Severinghaus et al., 1966). An inert, freely diffusible gas, nitrous oxide, was used with results of mean whole brain blood flow of 54±12 mL·100 g–1·min–1 in 14 young, healthy males and this increased by 35% whilst breathing 10% oxygen. An important modification of the technique was the measurement of CBF by monitoring the washout of 133Xe or 85Kr with external scintillation detectors after injection of the gas into the internal carotid artery or peripheral vein. This technique has been applied to studies at high altitude; (Severinghaus et al., 1966) reported a mean sea level CBF of 42±2 mL per 100 g per min increasing to 51±4 after 6–12 hours at 3810 m, falling back to sea level after 3–5 days acclimatization with increasing partial pressure of CO2, increased oxygen carrying capacity as a result of erythropoietin upregulation and, later, an increase in cerebral capillary density. Increases in CBF (using 133Xe) were similar in subjects with and without acute mountain sickness (Jensen et al., 1990). Wolff et al. (2000) re-examined Sevringhaus's data and showed an increase of 24% in CBF after 24 h at 3475 m, returning to baseline at 6 days and a 53% increase in CBF at 4785–5430 m and further increases after acetazolamide. They found that oxygen delivery to the brain was essentially unchanged (Wolff et al., 2000).
In this study, calculated cerebral oxygen delivery rose markedly during acute hypoxia, but was reducing at 6 hours due to a fall in MCA velocity. Calculated cerebral oxygen delivery was not different after 3 days exposure, confirming the findings of Wolff et al. (2011).
In conclusion, transcranial Doppler is a noninvasive ultrasound technique that has been used to assess relative changes in cerebral blood flow velocity at high altitude. To date, the velocity of the blood within the middle cerebral artery is assumed to represent CBF. There is now growing evidence to suggest that assuming cerebral vessel diameter is constant at extremes of blood gas change is incorrect (Giller, 2003; Wilson et al., 2011; Willie et al., 2012, 2013), and it is now apparent that cerebral vessel diameter as well as velocity needs to be directly characterized with the most sophisticated imaging modalities available (Wilson et al., 2011; Willie et al., 2012, 2013). The long-held paradigm that blood flow regulation is modulated solely at the pial arterioles is likely to be an inadequately simplistic regulatory model (Du Boulay and Symon, 1971). We speculate that this is a direct hypoxic effect (possibly mediated by through NO). Recent evidence highlights the need to interpret isolated transcranial Doppler ultrasound velocity measurements with caution during acute (0–6 h) hypoxia or extreme altitude (>6400 m).
Footnotes
Author Disclosure Statement
No competing financial interests exist.
The acute hypoxic study was carried out in Faculty of Health, Sport and Science University of Glamorgan with funding obtained by SRIF III (c/o DM Bailey).