
Abstract
Aims:
Mitochondrial functional transformation contributes to the carcinogenesis of the prostate by meeting the metabolic needs of cancer cells. Mitochondrial transcription factor A (TFAM) is a pivotal regulator that maintains homeostasis of mitochondrial function. However, its role in prostate carcinogenesis has not been well elucidated.
Materials and Methods:
In the present study, we analyzed the expression of TFAM in normal prostate tissue and prostate cancer using public databases; a prostate-tissue chip was used to verify the results. The expression of TFAM in normal cells and in prostate cancer cells was determined by western blotting analysis. We knocked down TFAM in the prostate cancer cell line PC3 using a specific shRNA to explore the potential effects of TFAM in prostatic carcinogenesis.
Results:
We observed higher expression levels of TFAM in prostate cancer tissue than in normal prostate tissue and tumor adjacent normal tissues. A receiver operating characteristic curve was drawn that demonstrated the diagnostic efficacy of using TFAM expression for prostate cancer prognoses. Elevated levels of TFAM may indicate poorer overall survival in prostate cancer patients. Western blotting assays also showed that relative to the normal prostatic epithelial cell line RWPE-1, prostate cancer cell lines PC3 and DU145 expressed more TFAM protein. Furthermore, knockdown of TFAM inhibited the colony-formation capability of PC3 cells.
Conclusion:
Collectively, these results suggest that TFAM promotes carcinogenesis of the prostate, and may constitute a marker to be used in the diagnosis and prognosis of prostate cancer.
Introduction
Although the incidence and mortality vary greatly between countries and regions, prostate cancer is the second most frequently observed cancer and the fifth leading cause of cancer deaths among men worldwide (Sung et al., 2021). Cellular metabolic alterations in the pathological progression of prostate cancer have been highlighted since they may be used for the diagnosis and treatment of prostate cancer (Giunchi et al., 2019). In normal prostatic tissues, peripheral epithelial cells display a unique metabolic pattern in which oxidative phosphorylation (OXPHOS) is inhibited to accumulate and secrete citrate into prostatic fluid. In contrast, primary prostate cancer cells prefer enhanced OXPHOS and lipogenesis, but limited glycolysis (Bader and McGuire, 2020).
The mitochondrion is the organelle that is critical to modulating cellular energy metabolism, and changes in mitochondrial DNA (mtDNA) may contribute to the initiation and progression of prostate cancer (Kozakiewicz et al., 2021). Mitochondrial transcription factor A (TFAM)—which is closely associated with mtDNA and occupies a histone-like role in mitochondria—modulates the replication of mtDNA and is essential for the maintenance and biogenesis of mitochondria (Granados et al., 2017). Previous reports indicated that TFAM might be important in carcinogenesis.
Positive TFAM expression in pancreatic ductal adenocarcinoma specimens was significantly associated with invasion, recurrence, and advanced surgical stages (Yamauchi et al., 2014); downregulation of TFAM prevented tumorigenesis in nonsmall-cell lung cancer (Xie et al., 2016). Granados et al. (2017) analyzed three TFAM polymorphisms and their haplotypes in overweight or obese Mexican Mestizo men with prostate cancer, and noted that the most frequent TFAM haplotype was associated with aggressiveness of prostate cancer. However, the role of TFAM in the progression of prostate cancer is still obscure.
In this study, we employed public databases—The Cancer Genome Atlas (TCGA) and Genotype Tissue Expression (GTEx) to analyze TFAM expression in normal prostate, tumor-adjacent (ADJ) normal tissues, and prostate cancer. The expression of TFAM in different prostatic tissues and cells was also analyzed through immunohistochemical (IHC) staining and Western immunoblotting, respectively. Besides, the diagnostic efficiency and prognostic value of TFAM expression in prostate cancer were evaluated. And TFAM knockdown was performed to explore its potential effects on the development of prostate cancer.
Materials and Methods
Public databases analysis
An online tool was used to analyze the expression of TFAM in normal prostate, tumor-ADJ normal tissues, and prostate cancer tissues, as well to draw the receiver operating characteristic (ROC) curve. The gene expression data were from TCGA/GTEx databases. Unpaired comparison was performed to compare TFAM expression in normal prostate (n = 152) and prostate cancer tissues (n = 496), whereas paired comparison was employed to compare TFAM expression in prostate cancer tissues (n = 52) and their corresponding tumor-ADJ normal tissues (n = 52).
The overall survival (OS) was analyzed in top 25% patients with highest TFAM expression and bottom 25% patients with lowest TFAM expression, and the analysis was performed with another online tool Xena Functional Genomics Explorer (xenabrower.net).
Prostate tissue chip
A prostate tissue chip (HProA100PG01) was purchased from SHANGHAI OUTDO BIOTECH Company (Shanghai, China) and was used to investigate the expression of TFAM in different prostatic tissues. The research was approved by the Ethic Committee of Shanghai Outdo Biotech Company (NO. YB M-05-02). The 100 dots on the chip were from 64 samples and were composed of 3 normal dots, 36 tumor-adjacent normal dots, 59 prostatic adenocarcinoma dots (PRAD, 56 dots remained after IHC staining), and 2 prostate ductal adenocarcinoma (PDA) dots.
The inclusion criteria for selection of the samples: (1) all samples were obtained with the informed consent of patients, (2) the histopathological types of samples were confirmed by imaging and pathological examination, (3) the cancer patients were between 50 and 85 years old and had no other primary tumors, (4) the pathological samples were all from primary prostate cancers without distal metastasis, and (5) the patients had not received radiotherapy or chemotherapy. The general characteristics of the patients are listed in Supplementary Table S1.
IHC staining
The prostate tissue chip was baked at 60°C for 1 h, followed by three washes with phosphate-buffered saline (PBS). The chip was deparaffinized in xylene for 5 min and rehydrated in a graded series of alcohol (100%, 95%, and 75%) for 5 min each. The poach method with citrate buffer (pH, 6.0) was used for antigen retrieval and the chip was incubated in 3% H2O2 for 10 min to eliminate endogenous peroxidase activity. The chip was blocked with PBS supplemented with 10% fetal bovine serum (FBS; Invitrogen) for 1 h and then incubated with primary antibody (mouse anti-TFAM, sc-376672; diluted 1:200; Santa Cruz) overnight at 4°C.
The biotinylated secondary antibody (rabbit anti-Mouse IgG Bio; BIOSS, China) and horseradish-peroxidase streptavidin (Beyotime, China) were then applied successively (the DAB Horseradish Peroxidase Color Development Kit and a Hematoxylin Staining Solution were both purchased from Beyotime). The stained slides were visualized using bright-field optics with a Leica microscope, and photomicrographs were obtained at a magnification of × 200.
Cell culture
The normal prostatic epithelial cell line RWPE-1 was obtained from ATCC and the cells were cultured in keratinocyte serum-free medium (K-SFM; Thermo Fisher, MA) supplemented with 0.05 mg/mL bovine pituitary extract (absin, Shanghai, China) and 5 ng/mL epidermal growth factor (Merck, Darmstadt, Germany). The prostate cancer cell lines DU145 and PC3 were both purchased from ATCC and maintained in RPMI1640 medium (Thermo Fisher) supplemented with 10% FBS.
Western immunoblotting assay
RIPA buffer (CWBIO, China) supplemented with 1% PMSF (Solarbio, China) was used to lyse cultured RWPE-1, DU145, and PC3 cells to extract total protein. A BCA protein assay kit (CWBIO) was used to determine protein concentration, and the protocol for Western blotting assay was as in the previous report (Jia et al., 2016). The primary mouse anti-TFAM antibody (Santa Cruz) was diluted 1:500, and the primary mouse anti-β-actin antibody (BIOSS) was diluted 1:10,000 to detect the expression of the housekeeping gene β-actin. The secondary antibody was a goat antimouse IgG (H+L)-HRP conjugate purchased from Proteintech (Rosemont). After treatment with an enhanced chemiluminescence regent (PIERCE, Rockford, IL), the membrane was exposed to X-ray film (Kodak, Rochester, NY).
Short hairpin RNA transfection
The short hairpin RNAs (shRNAs) were constructed by two PCRs. In the first step, plasmid pZeo-U6-hp was used as template, and forward and reverse primer 1 were utilized to amplify the resulting DNA fragment that was collected and purified with a commercial DNA clean-up kit (CWBIO). The second PCR was performed with the purified DNA fragment as template and the forward and reverse primer 2 as primers.
The PCR products were cloned into a T vector to generate corresponding shRNA plasmids, and the plasmids were verified by predicted size after restriction digestion and by sequence analysis (the primers used in this study are listed in Table 1). Control shRNA (shC), which did not match any known human cDNA, and shTFAMs were transiently transfected into PC3 cells using Lipofectamine 2000 (Invitrogen) according to the manufacturer's instructions. For Western blot assays, total proteins were extracted 48 h after transfection.
Primers Used to Construct Short Hairpin RNAs
TFAM, mitochondrial transcription factor A.
Colony-formation assays
PC3 cells were grown to 50% confluency and then transfected with shC or shTFAM. After 48 h, the cells were trypsinized and anchorage-independent cell growth was enabled in soft agar (Merck). Twelve-well plates were coated with 0.5 mL of bottom agar (RPMI1640, 10% FBS, 0.7% agar) and 0.5 mL of top agar (RPMI1640, 10% FBS, 0.35% agar) containing 200 cells transfected with shC or shTFAM.
Normal growth medium (0.2 mL, RPMI1640, and 10% FBS) was gently layered over the cultures every 3 days. The colonies were observed every day and the images were captured randomly at five fields for each well on the 12th day; the experiment was performed three times independently. Photomicrographs were taken at × 200 and colony numbers were calculated.
Statistical analysis
The results are presented as mean ± SD. We used the Student's t-test to compare two groups in colony-formation assays. Wilcoxon rank sum test was used in unpaired comparison and Wilcoxon signed rank test was performed in paired comparison. COX regression was used in prognostic analysis. p < 0.05 was considered to indicate a statistically significant difference.
Results
TFAM expression is upregulated in prostate cancer and may indicate a poorer prognosis
TFAM expression in normal prostate (n = 152) and prostate cancer (n = 496) was compared according to the data from TCGA/GTEx databases and the results revealed the upregulation of TFAM in prostate cancer tissues (Fig. 1A). Higher TFAM expression was also observed in prostate cancer tissues compared with their corresponding ADJ tissues (n = 52) (Fig. 1B).
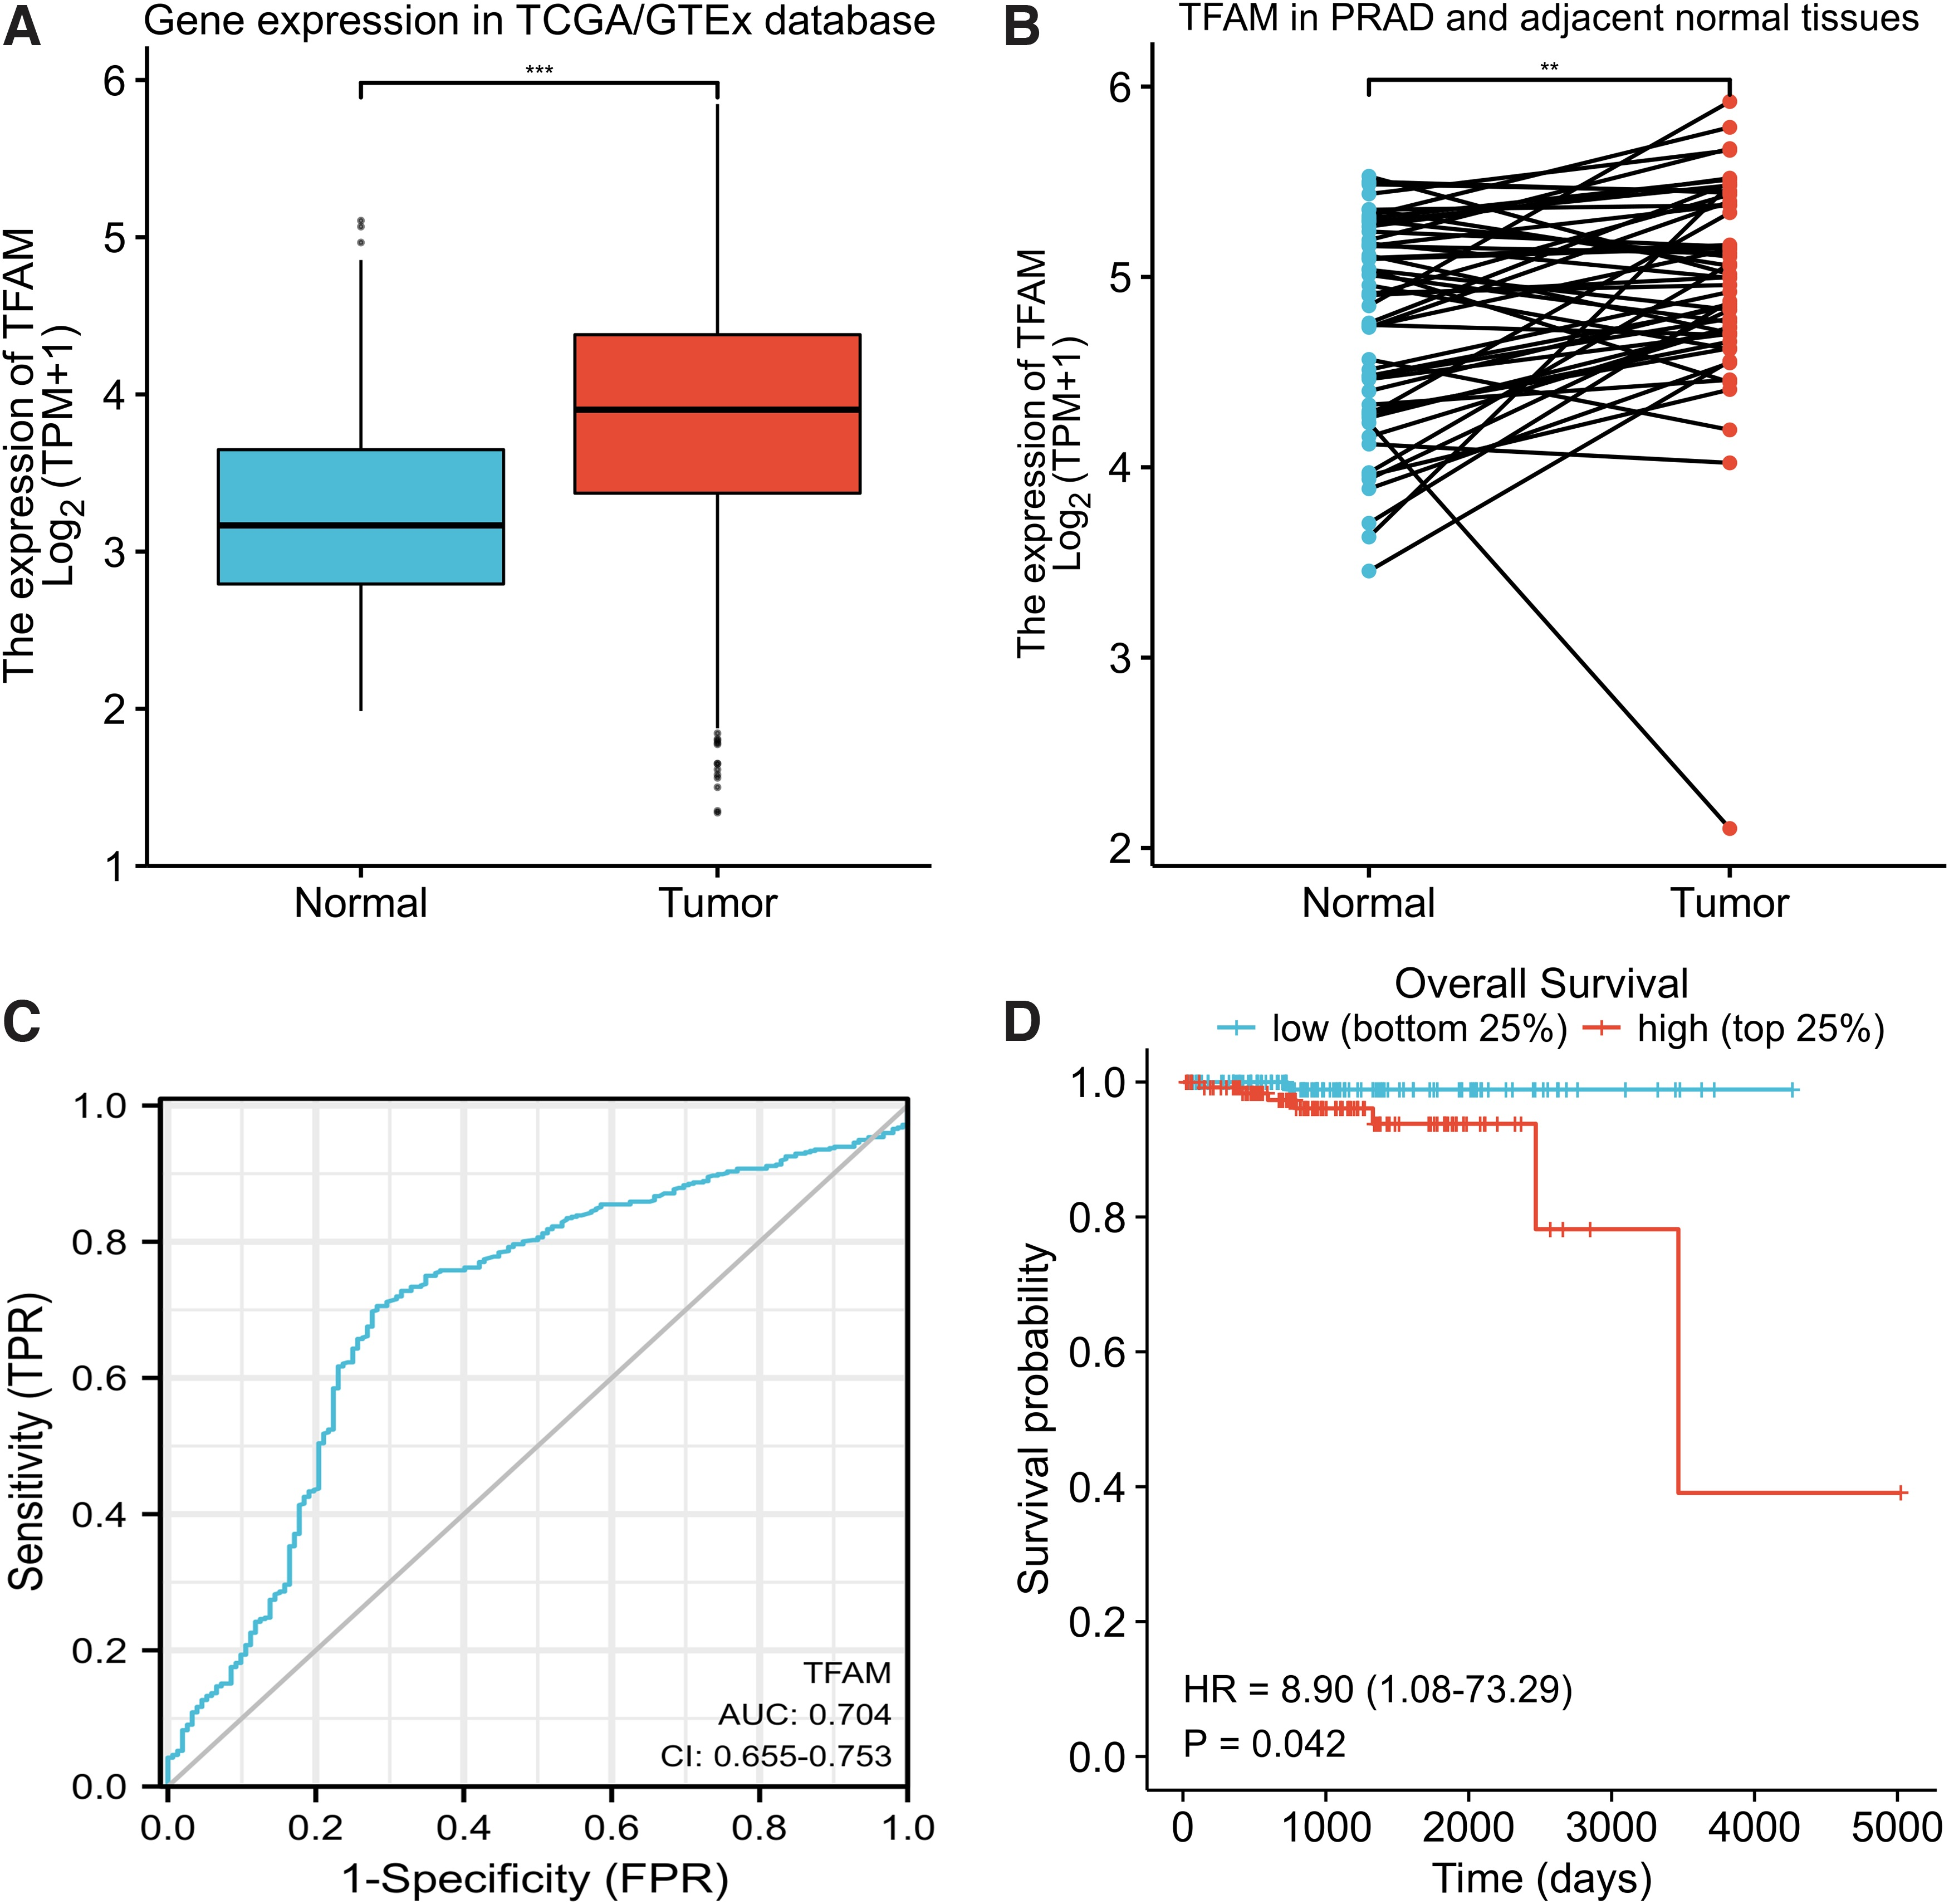
Analysis of TFAM expression in public databases.
The ROC curve was drawn and the results disclosed the certain diagnostic efficiency of TFAM expression in prostate cancer (AUC: 0.704; CI: 0.655-0.753) (Fig. 1C). The potential prognostic value of TFAM was also evaluated and compared with the bottom 25% prostate cancer patients with lowest TFAM expression, the top 25% patients with highest TFAM expression exhibited short OS time, suggesting that high TFAM expression may indicate a poorer prognosis in prostate cancer (Fig. 1D).
Higher expression of TFAM is observed in PRAD and PDA tissues compared with normal prostatic and ADJ tissues using IHC assays on a prostate tissue chip
A prostate tissue chip was exploited to validate the expression of TFAM in different prostate samples, and the section comprised 3 normal prostate tissue dots, 36 ADJ dots, 56 PRAD dots, and 2 PDA dots. We performed IHC staining to evaluate the expression of TFAM, and classified the intensity of staining as negative (0 score), weak (1 score), medium (2 scores), and high (3 scores) (Table 2). Our results indicated that the expression of TFAM in PRAD and PDA tissues was much higher than in normal prostatic tissues and ADJ tissues (Fig. 2, all images were captured at a magnification of × 200).
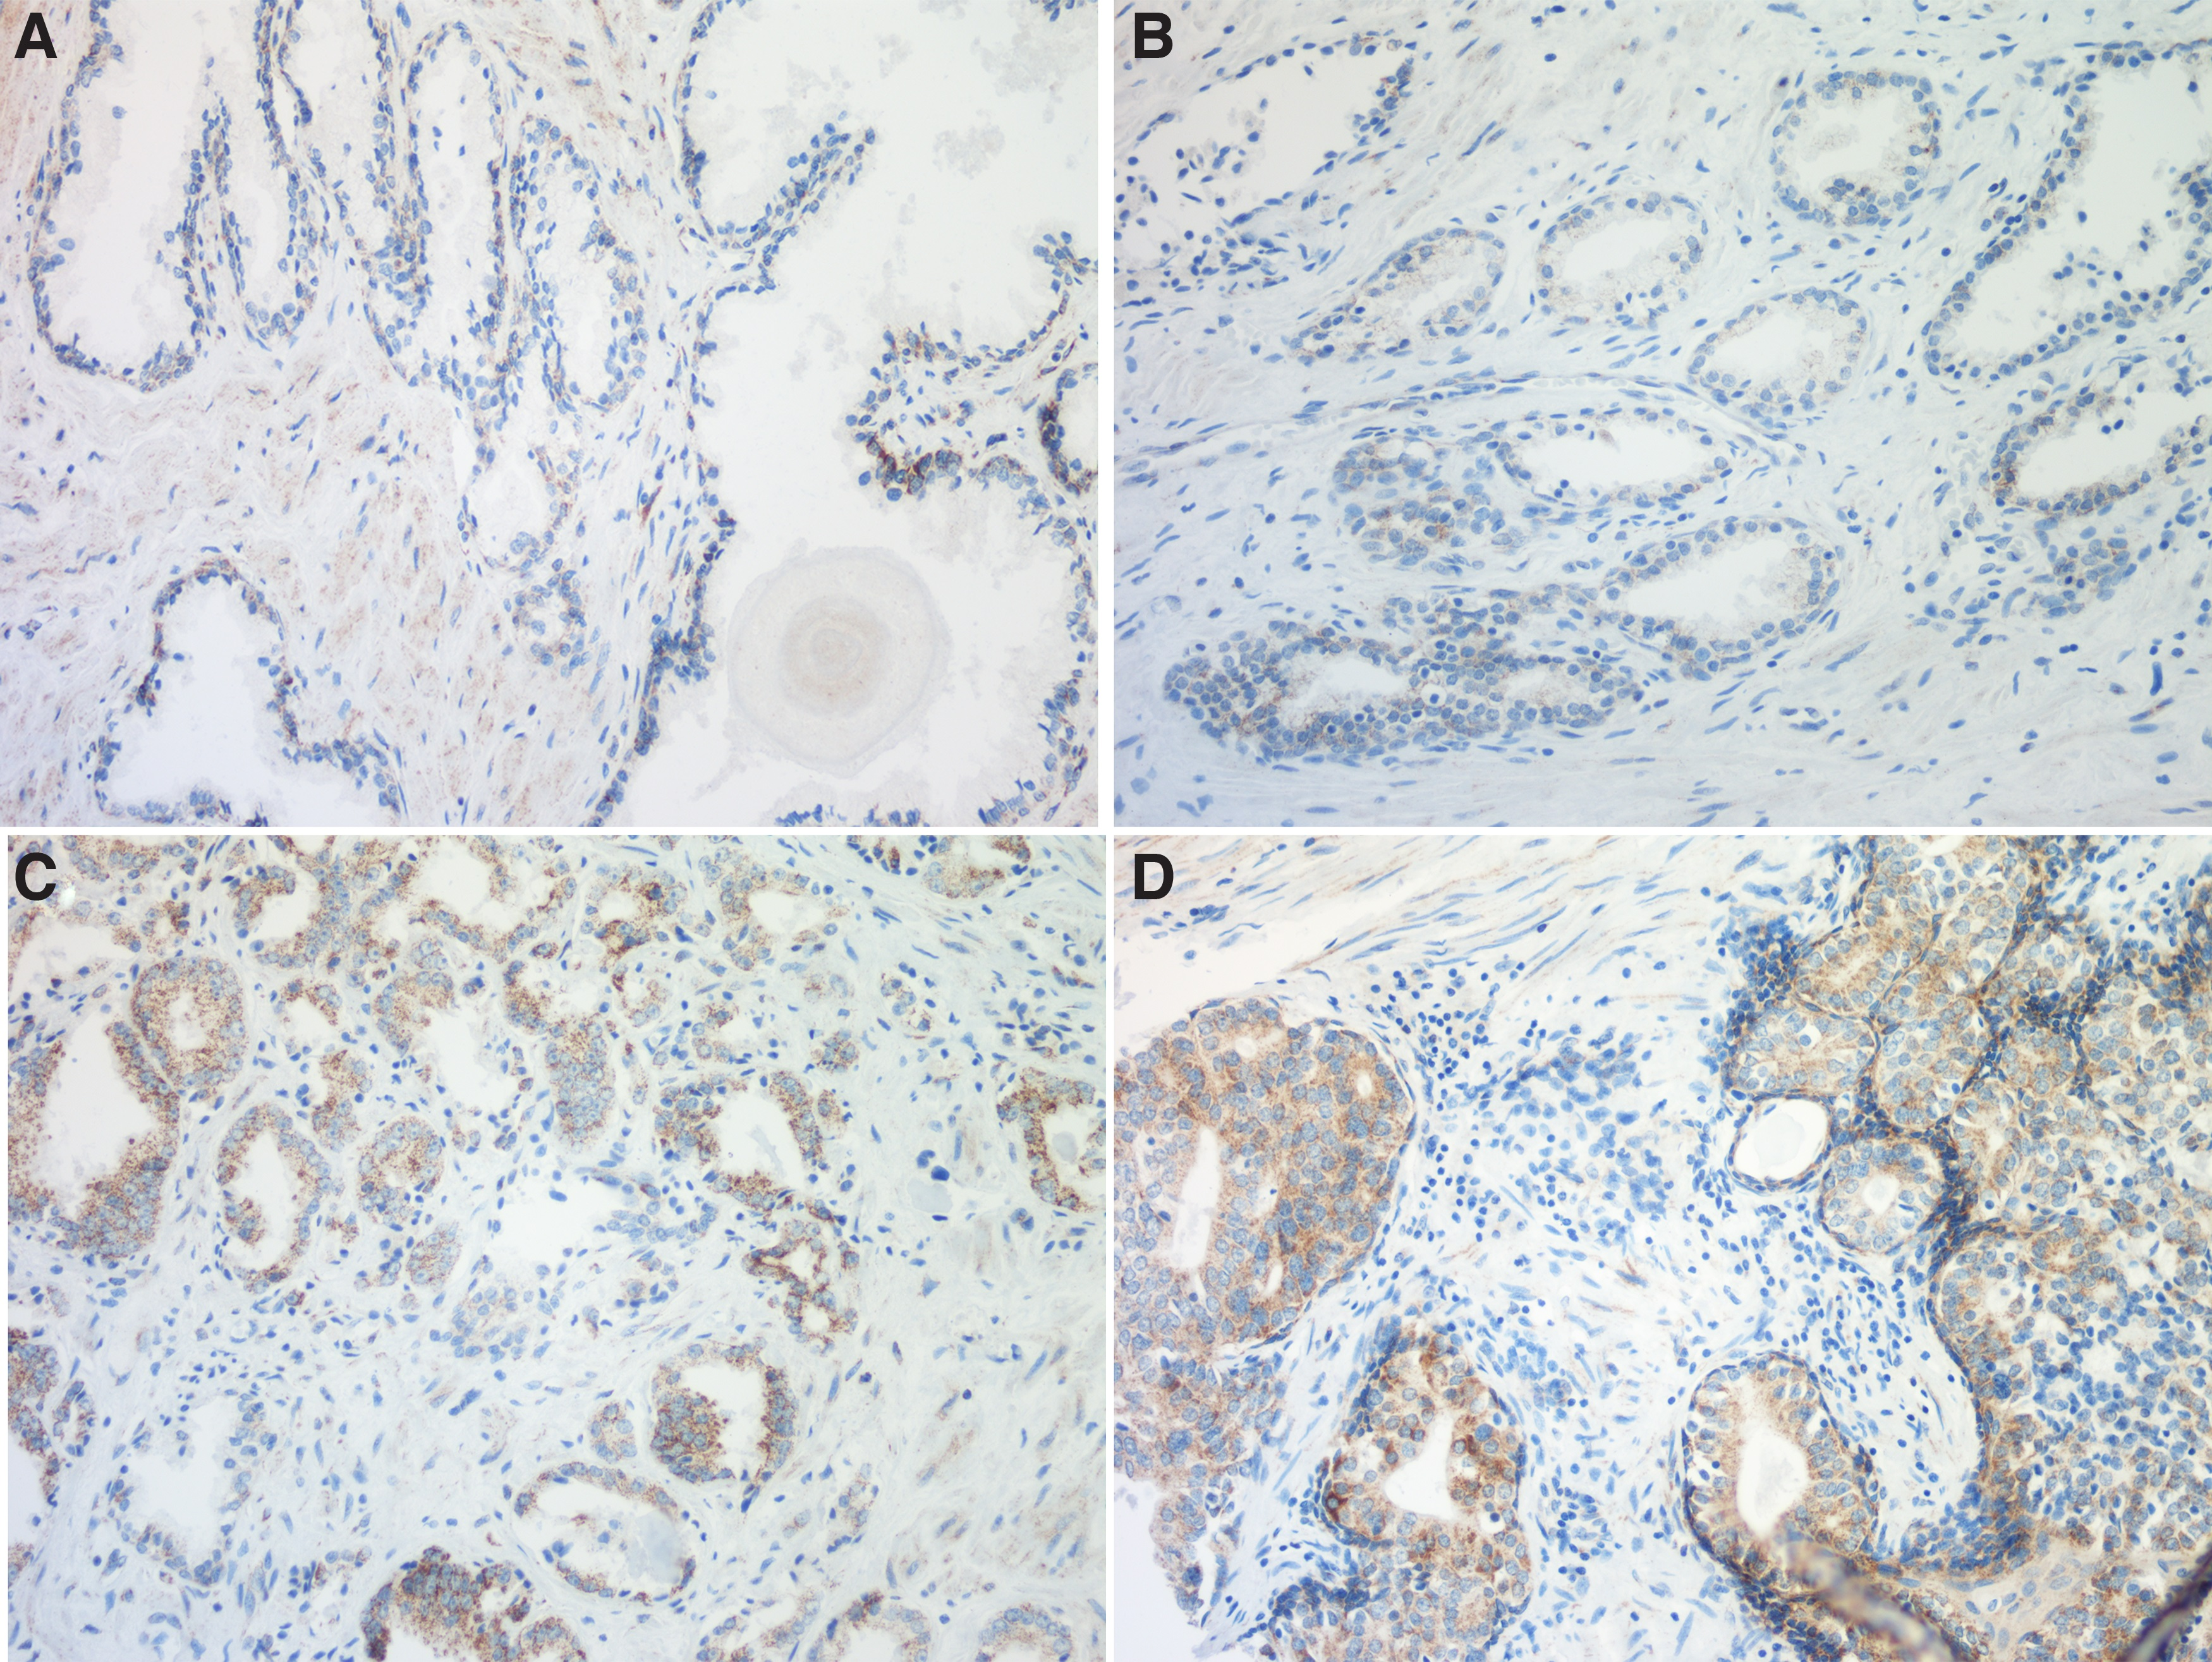
IHC staining assays on the prostate tissue chip. TFAM expression was detected by IHC staining.
The Results of Immunohistochemical Staining of the Prostate Tissue Chip
ADJ, adjacent; PDA, prostate ductal adenocarcinoma.
The expression of TFAM was also evaluated by IHC staining in PRAD tissues with different Gleason scores (6 to 9) and their paired ADJ tissues and the results confirmed that TFAM expression was much higher in PRAD tissues compared with corresponding ADJ tissues (Supplementary Fig. S1, all images were captured at a magnification of × 200). Furthermore, to explore the potential influence of tumor grade on TFAM expression, the intensity of TFAM staining was evaluated in PRAD tissues with different Gleason scores (6 to 9), however, no significant differences of TFAM expression were observed in PRAD tissues with different Gleason scores (Supplementary Table S2).
This result indicated that TFAM expression did not seem to be affected by tumor grade in PRAD tissues. However, considering the limited samples in this research, more PRAD samples are needed to confirm the conclusion.
Prostate cancer cell lines DU145 and PC3 express more TFAM than the normal prostatic epithelial cell line RWPE-1
The prostate cancer cell lines DU145 and PC3—as well the normal prostatic epithelial cell RWPE-1—were cultured in vitro, and the total protein was extracted. The expression of TFAM in RWPE-1, DU145, and PC3 cells was then determined by Western blot assays—and results indicated that TFAM expression was upregulated in DU145 and PC3 cells relative to RWPE-1 cells (Fig. 3), suggesting a procarcinogenic effect of TFAM.
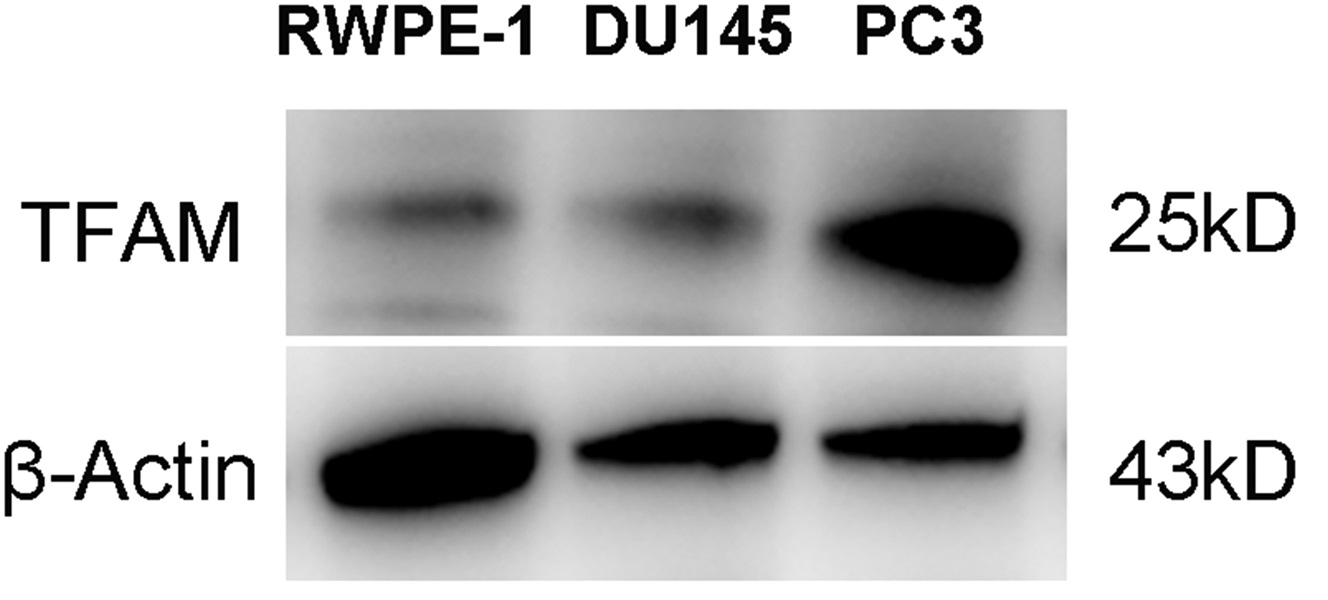
Western blot assays of TFAM expression in normal and prostate cancer cells.
Knockdown of TFAM in PC3 cells attenuates the colony-forming ability of cancer cells
To evaluate the role of TFAM in prostatic carcinogenesis, we constructed shRNAs (shTFAM1 and shTFAM2) targeting human TFAM, and transiently transfected them into PC3 cells. Western blot assays indicated that shTFAM2 efficiently downregulated the expression of TFAM in PC3 cells compared with control shRNA (shC) (Fig. 4A). Additional PC3 cells were transfected with shC or shTFAM2, and the cells were cultured in 12-well plates to perform anchorage-independent growth assays.
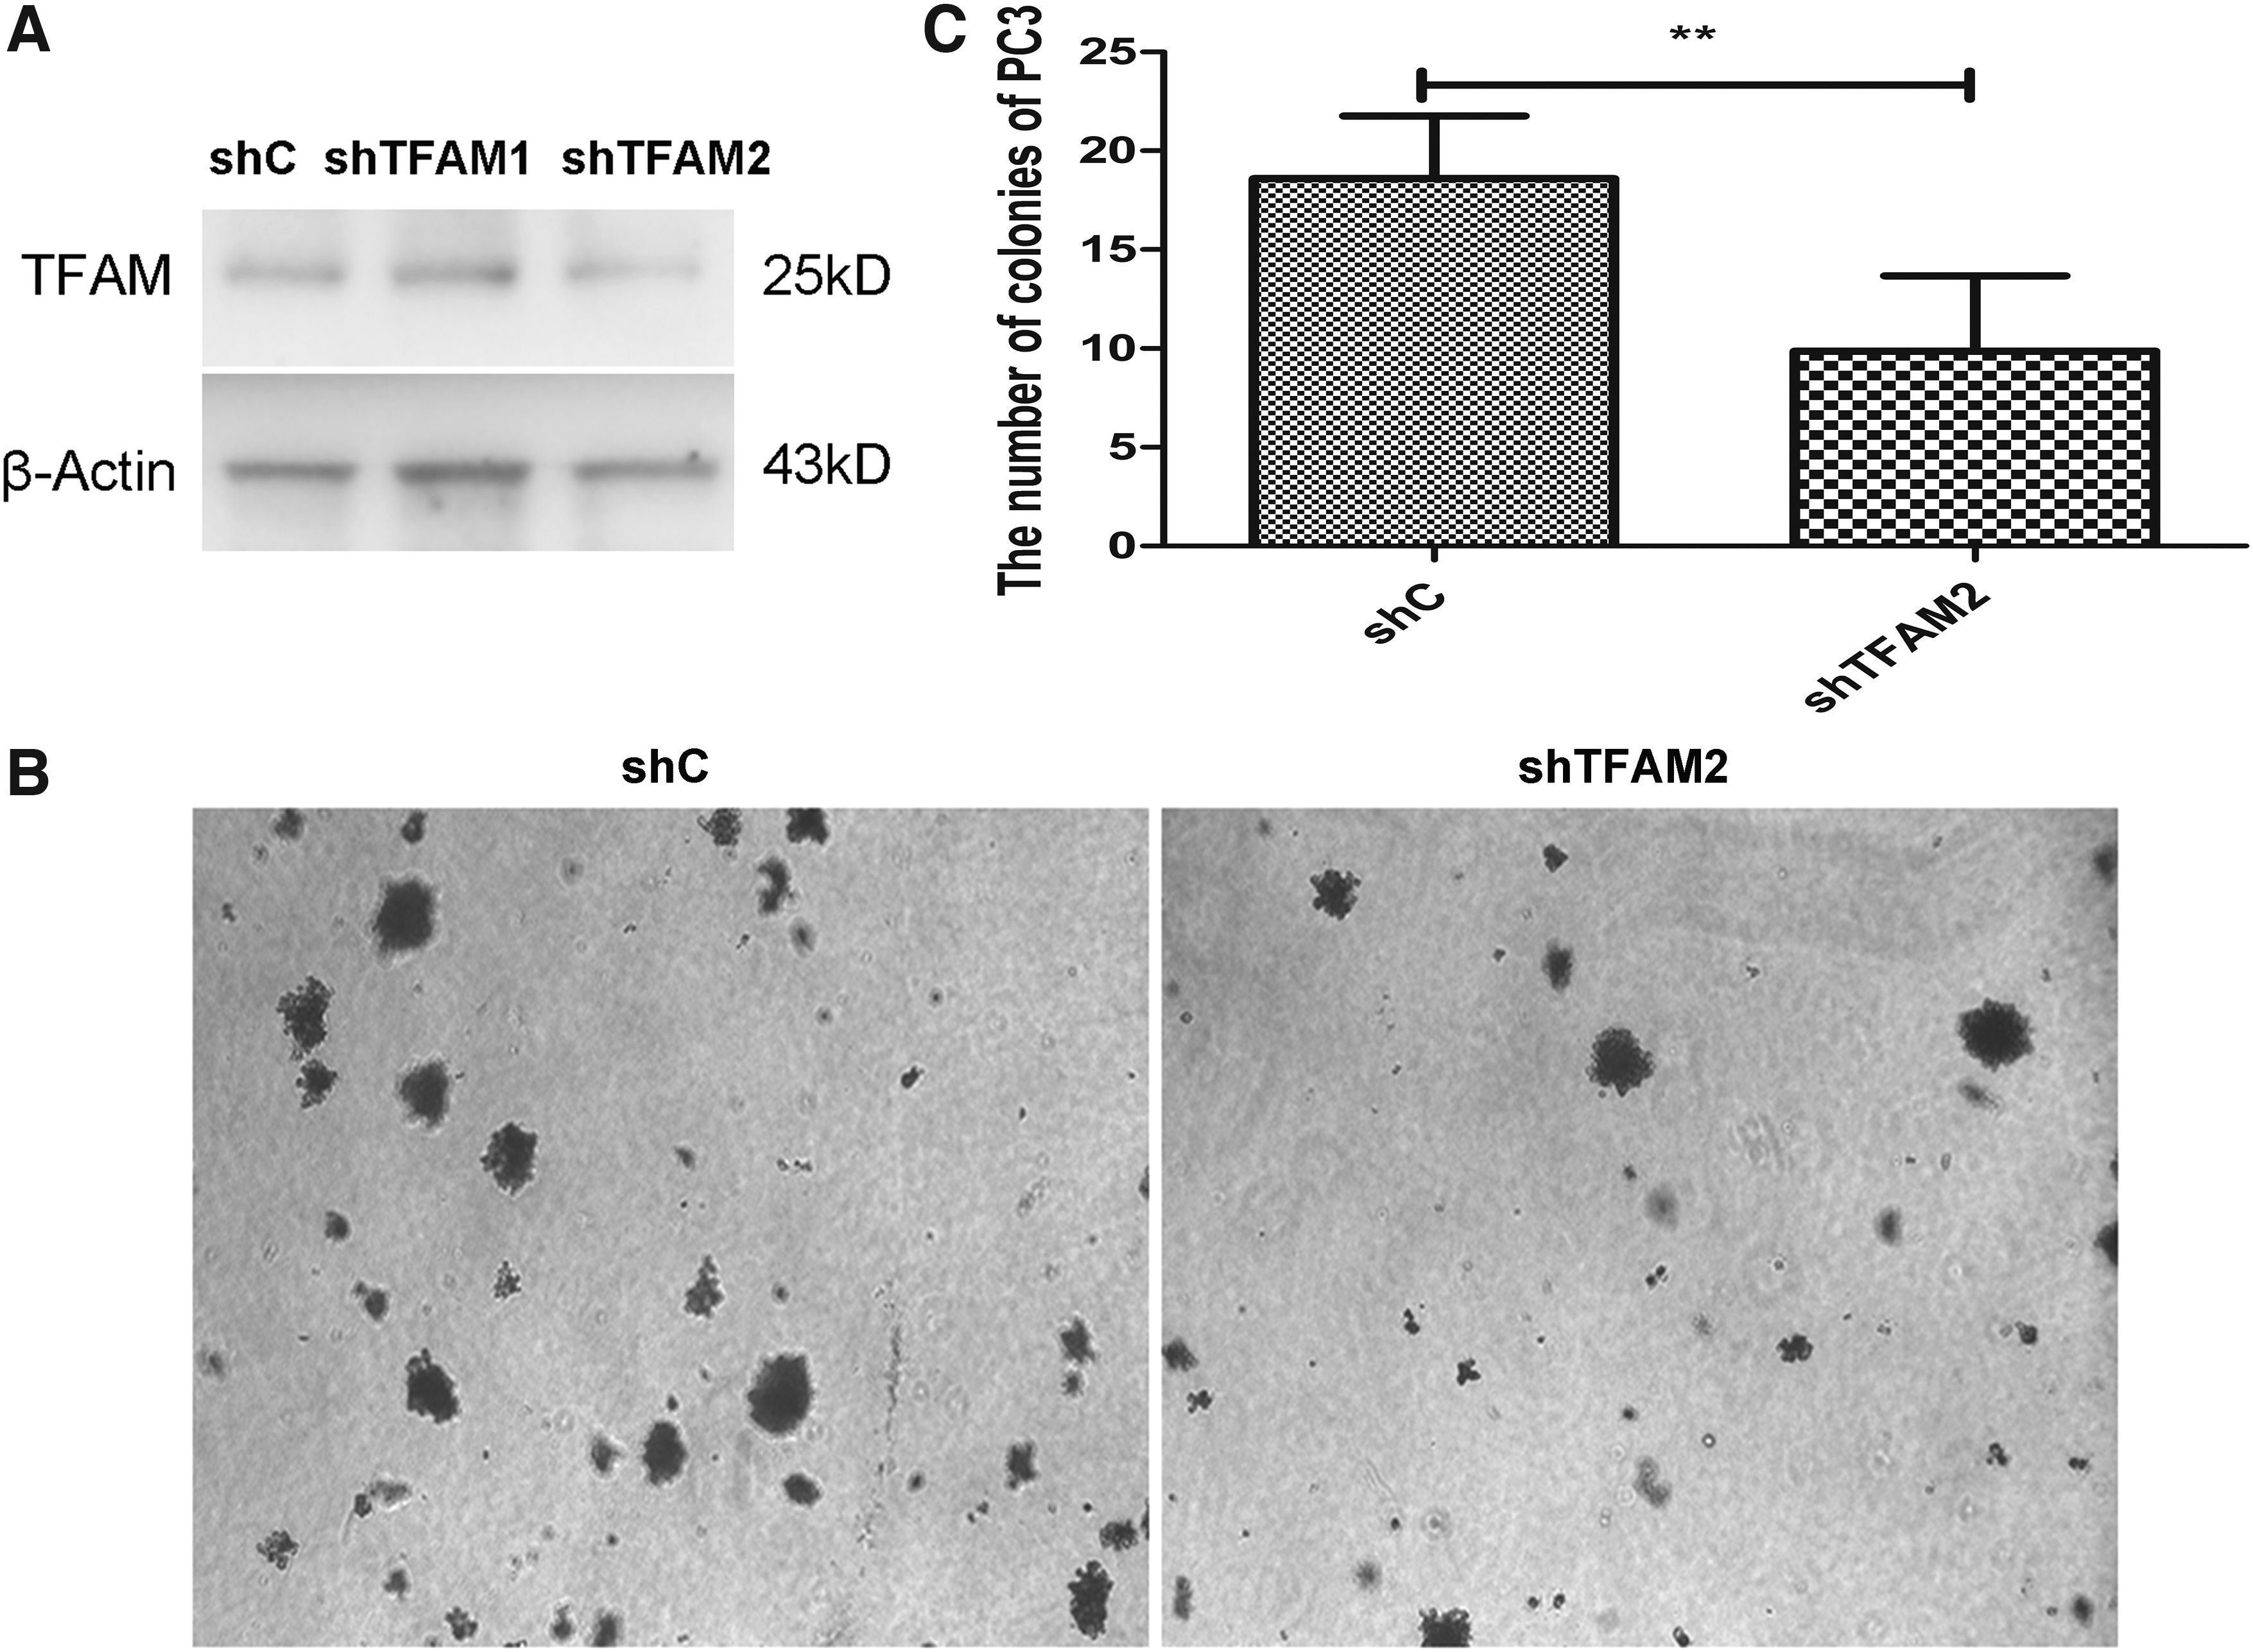
Knockdown of TFAM expression attenuated the colony-forming ability of PC3 cells.
After 12 days, the colonies of PC3 cells transfected with shC or shTFAM2 were photographed under a microscope (Fig. 4B) and the number of colonies was recorded (Fig. 4C). The results revealed that fewer colonies were observed in PC3 cells transfected with shTFAM2 compared with cells transfected with shC, suggesting that knockdown of TFAM may diminish the malignancy of prostate cancer cells.
Discussion
Metabolic alternation has been recognized as one of the characteristics of cancer. Normal prostatic epithelial cells produce citrate from glucose and are dependent on glycolysis, which attenuates the efficiency of the tricarboxylic acid cycle. However, during transformation, OXPHOS is progressively reactivated in prostate cancer cells and citrate production is reduced (Mamouni et al., 2021). OXPHOS is composed of ATP synthase and the electron transport chain (ETC), the latter containing four enzyme complexes and two mobile electron carriers.
Several key subunits of the ETC are encoded by the mitochondrial genome, highlighting the important role of mtDNA in metabolic reprogramming of prostate cancer (Falkenberg et al., 2007). Previous research indicated that in several cancers—including bladder, breast, and kidney cancers—mtDNA was depleted relative to matched normal tissues (Reznik et al., 2016). However, in prostate cancer, mtDNA content is heterogeneous and not universally depleted relative to other cancer types.
Elevated mtDNA content might, therefore, predict unfavorable pathological characteristics that include higher disease stage and extracapsular extension (Kalsbeek et al., 2018). These investigators suggested that the replication and transcription of mtDNA might contribute to the progression of prostate cancer.
TFAM is a regulator of mtDNA content, and is a nucleus-encoded protein that is necessary for the transcription and replication of mtDNA (Larsson et al., 1998; Campbell et al., 2012). A role for TFAM has been examined with respect to several diseases. In studies using neurodegenerative models, TFAM protein levels were reduced by ∼50%; overexpression of TFAM appeared to improve neural function and content, suggesting a protective effect of TFAM in neurodegenerative disease (Kang et al., 2018).
In cardiac diseases, TFAM has been reported to exhibit a cardioprotective role by mitigating calcium mishandling and ROS production (Kunkel et al., 2016), and a recent report disclosed that disrupting TFAM-mediated mtDNA maintenance may increase cytokine release and promote inflammation (Zhao et al., 2021). The potential effect of TFAM has also been explored in cancers, as augmented expression of TFAM has been reported to accelerate the progression of pancreatic cancer and nonsmall-cell lung cancer (Yamauchi et al., 2014; Xie et al., 2016).
Downregulation of TFAM in breast cancer cells by miR-199a-3p was also shown to enhance cancer cell sensitivity to cisplatin (Fan et al., 2017). Hu et al. (2021) reported that inhibition of ataxia telangiectasia mutated protein boosted cancer immunotherapy by the downregulation of TFAM and subsequent promotion of mtDNA leakage. In addition, Li et al. (2021) revealed that zalcitabine induced arachidonate lipoxygenase 5 (ALOX5)-dependent ferroptosis in pancreatic cancer cells through induction of TFAM degradation.
Although these reports indicated that TFAM could be considered a therapeutic target in several cancers, the role of TFAM in prostate cancer remains equivocal. Although recent research disclosed an intricate crosstalk between the AR-signaling pathway and TFAM-mediated mitochondrial function (Bajpai et al., 2019), the potential actions of TFAM in prostate cancer progression require further elucidation.
We herein demonstrated that the expression of TFAM was upregulated in prostate cancer compared with normal prostatic tissue, indicating a poorer prognosis in prostate cancer and that knockdown of TFAM attenuated the malignancy of prostate cancer cells. These results indicated that TFAM can be utilized in the diagnosis and prognosis of prostate cancer.
Footnotes
Acknowledgments
We thank LetPub for its linguistic assistance during the preparation of this article.
Authors' Contributions
S.L. designed the whole work. Y.T. performed IHC staining, cell culture, and colony formation assays. Z.F. and S.L. contributed to bioinformatical analysis of TCGA/GTEx databases. Y.W. participated in the data analysis and interpretation, as well wrote the article. All the authors read and approved the final article.
Author Disclosure Statement
No competing financial interests exist.
Funding Information
This study was funded by Tianjin Key Medical Discipline (Specialty) Construction Project (TJYXZDXK-047A).
References
Supplementary Material
Please find the following supplemental material available below.
For Open Access articles published under a Creative Commons License, all supplemental material carries the same license as the article it is associated with.
For non-Open Access articles published, all supplemental material carries a non-exclusive license, and permission requests for re-use of supplemental material or any part of supplemental material shall be sent directly to the copyright owner as specified in the copyright notice associated with the article.