
Abstract
In the normal population, loss of one of the sex chromosomes leading to monosomy (45,X) is a part of the aging process. In Turner syndrome (TS), the classic karyotype 45,X is found in up to 50% at birth, and others have a second cell line; mosaicism. The aim was to study if the chromosomal pattern in TS women changes over time. Fluorescence in situ hybridization was performed on buccal smear cells obtained twice, 10 years apart, from 42 women with TS aged 26-66 years (mean±standard deviation: 42.0±11.6). DNA probes specific for chromosomes X (DXZ1) and Y (DYZ3) were used and >100 cells were analyzed/patient. Nineteen women had monosomy (45,X) (<10% 46,XX), nine had 45,X/46,XX mosaicism, and 14 had iso, ring, or a marker chromosome at baseline. At 10 years, the percentage of diploid cells had increased in 29 of 42 women (69%), with an average increase of 5.7±13.0%. There was a positive correlation between age and % change in diploid 46,XX or 46,XY cells (r=0.38, p=0.023). This new finding might have relevance for the life expectancy in TS.
Introduction
S
Nielsen and Krag-Olsen (1980) have shown that 45,X cells have a prolonged cell cycle. Furthermore, chromosomal damages involving specific growth-regulating genes extend the cell cycle time even more. It is believed that there is an in vivo selection against cells with X chromosome monosomy or other chromosomal aberrations (Nielsen and Krag-Olsen, 1980; Barrenas et al., 2000). In the present study, fluorescence in situ hybridization (FISH) was performed on two occasions, 10 years apart, on buccal cell samples from 42 women with TS. This is the first report of a 10-year longitudinal study in a fairly wide age span of women with TS. The short life expectancy makes it difficult to investigate older TS women than those in the present study. The aim was to study if the chromosomal pattern changes over time in women with TS, as in the chromosomally normal population.
Materials and Methods
Participants
The participants comprised 42 women aged 26-66 years (mean±standard deviation [SD]: 42.0±11.6) diagnosed with TS on the basis of karyotype determination on lymphocytes. The women had been followed since 1995 at the Turner Center in Gothenburg, Sweden and were recruited through an advertisement in the Turner patient magazine, by referral from the hospital, or through transition from the pediatric clinic. They were examined according to the national and international guidelines for care and treatment of patients with TS (Bondy, 2007). The participants were divided into three subgroups based on the genotype labeled “45,X,” “mosaic,” and “other” (Tables 1-3; Fig. 1) (El-Mansoury et al., 2007). The study was approved by the Ethics Committee at the University of Gothenburg (approval number 242-02), and all participants provided their informed consent.
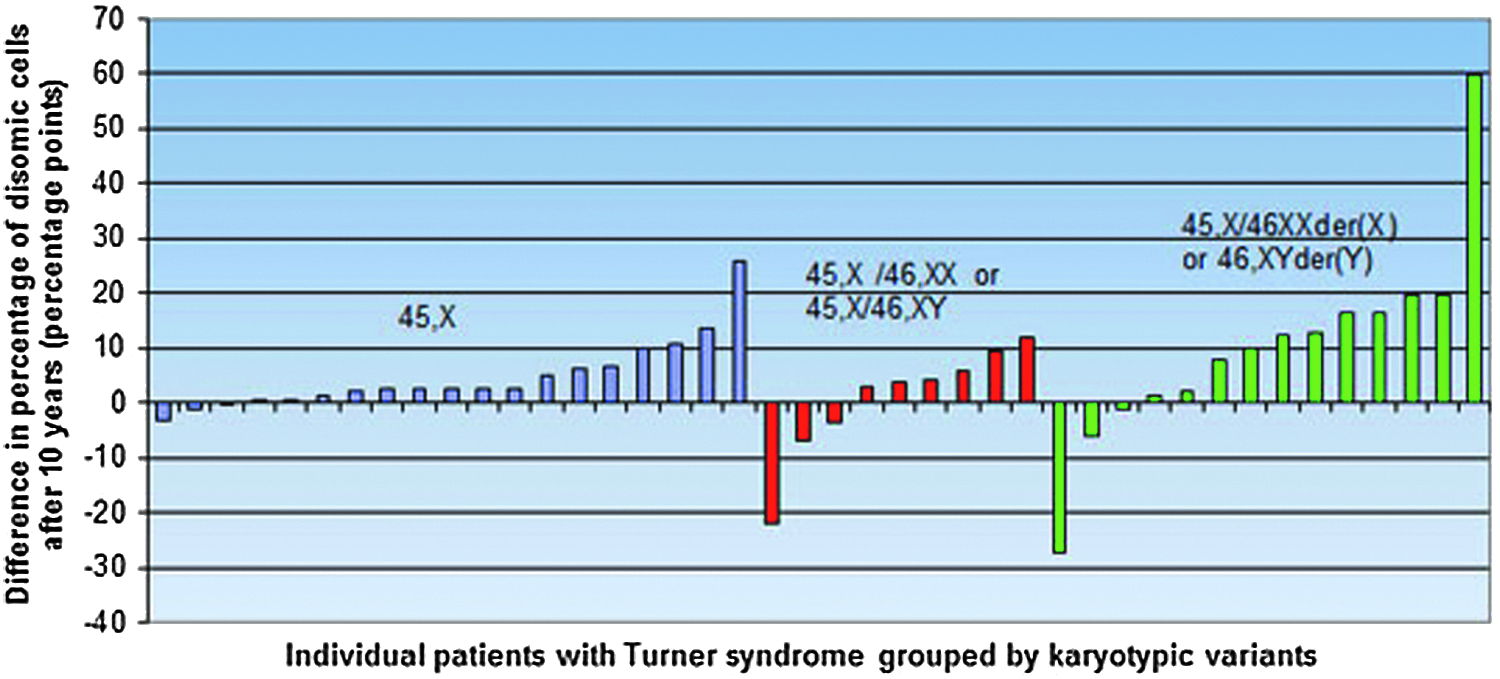
Distribution of the individual differences in %XX cells after 10 years in 42 women with Turner syndrome divided into three groups according to genotype: 45,X, mosaics, and “other” (including iso, ring, deletions, and marker Y chromosomes).
inv, inversion of chromosome.
i, isochromosome; der, derivative chromosome; mar, marker chromosome; r, ring chromosome; del, deletion; pter, short arm; qter, long arm.
Karyotypes
Information on karyotypes for diagnosis was collected from the patient journals. Karyotype analyses were performed on cultured lymphocytes and based on 30 analyzed metaphases.
FISH analysis
Buccal smears were obtained from all participants at baseline (year 0) and after 10 years. The samples were then subjected to interphase FISH analysis with centromeric probes specific for chromosomes X and Y; DXZ1 (Xp11.1-q11.1) and DYZ3 (Yp11.1-q11.1), respectively (VYSIS/Abbott, Inc.). The FISH procedure was conducted as described previously (Hanson et al., 2001a). On average, 150 nuclei were analyzed on each slide, and the proportion of chromosomally abnormal cells was calculated. The repeatability on duplicate samples using the at hand probes was 98.3%. The same geneticist (C.H.) processed and evaluated all samples on both occasions, in the same laboratory, using the same methodology. The results from the FISH analysis were compared with the conventional karyotypes on the lymphocytes.
Statistical analysis
Mean and SD were calculated according to conventional methods. The individual differences between data obtained at baseline and at 10 years were calculated and tested with Wilcoxon's signed-rank test. The Pearson correlation coefficient (r) was used to compare continuous variables (age and difference in percentage of diploid cells at year 10). A p-value <0.05 was considered statistically significant.
Results
The distribution on the three subgroups based on the genotype labeled “45,X,” “mosaic,” and “other” is shown in Tables 1-3 and Figure 1. The 45,X group included women with <10% 46,XX-cells at year 0 (n=19). The mosaic group had ≥10% diploid cells (either 46,XX or 46,XY) (n=9). Finally, the “other” group included all other genotypes, such as i(X), r(X), or marker Y chromosomes (n=14). In two of the women, XY cells were detected during later analyses. In one of these cases, the XY cell line was detected in the original karyotype (one of 10 cells karyotyped) and the woman was thus moved retrospectively to the mosaic group (participant 26, Table 2). However, this change did not influence the results. The other woman was considered as unchanged over time and was thus left in the 45,X group (participant 10, Table 1).
At 10 years, the percentage of diploid cells had increased in 29 of 42 participants (69%). Due to limitations of the FISH technique, participants showing changes in cell proportion of <2% were considered as unchanged over time; this occurred for participants in the 45,X and “other” groups (Tables 1 and 3; Fig. 1). The percentage differences of diploid cell proportions after 10 years for each of the 42 participants are shown in Figure 2.
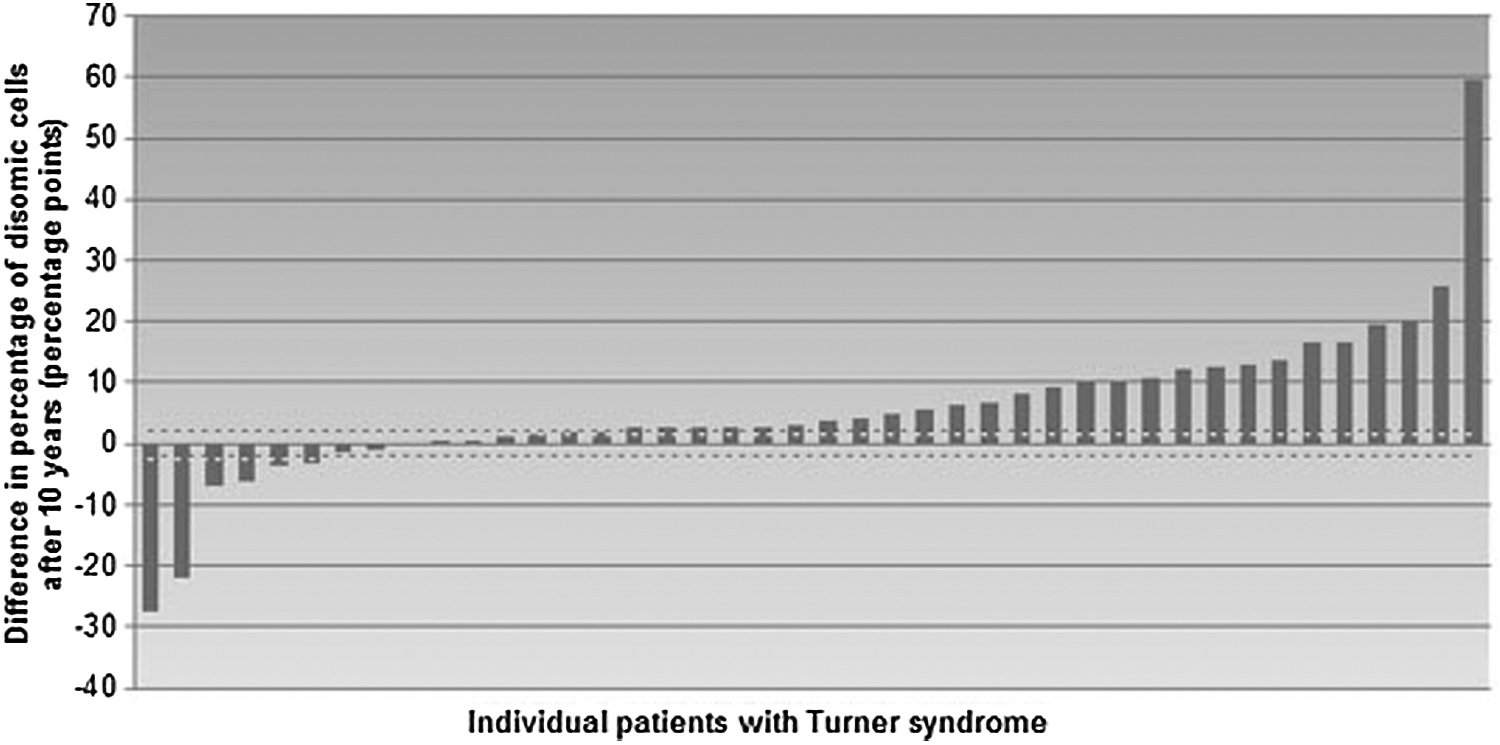
Distribution of the individual differences in %XX cells after 10 years in 42 women with Turner syndrome. The dotted line represents the 2% limit; bars within the dotted lines represent the participants who were considered as unchanged over time.
The mean proportion of diploid cells increased over time in the whole population of women with TS, from 24.4% at baseline to 30.1% after 10 years (p=0.0002); the average increase was 5.7±13.0. This trend of increase in diploid cells was also apparent for the subgroups 45,X and “other,” in which the mean percentages of diploid cells changed from 2.3±2.4 to 7.0±7.3 (p=0.0010) and from 39.4±29.8 to 49.6±31.0 (p=0.030), respectively, after 10 years. However, there was no significant increase of diploid cells in the mosaic subgroup (p=0.57). Some extreme values were seen in the mosaic and “other” groups. A large negative difference (−22%) was found in a woman aged 43 at the last analysis, with XY as the diploid cell line (participant 23, Table 2). In the “other” group, a large negative difference (−27%) was found in a mosaic woman aged 34 at the last analysis, with an isochromosome of the q-arm [45,X/46,X,i(Xq)] (participant 38, Table 3). A very large positive change (60%) was found in a woman aged 53 at the last analysis, with genotype 45,X/46,X,marY, in whom the proportion of diploid cells rose from 13% to the remarkable number of 73% (participant 33, Table 3). In this specific case, the proportion of the diploid cell line was 47% after 5 years (data not shown).
The correlations between age and % change in 46,XX or 46,XY cells and between age and 45,X cells were analyzed in patients who had a ≥2% change after 10 years of follow-up (n=35). The results showed a significant positive correlation (r=0.38, p=0.023) between age and % change in 46,XX or 46,XY cells and a negative correlation (r = −0.35, p=0.040) between age and % change in 45,X cells. The correlation between age and % change in 46,XX or 46,XY cells was stronger in women >36 years of age compared with women ≤36 years of age (Fig. 3).
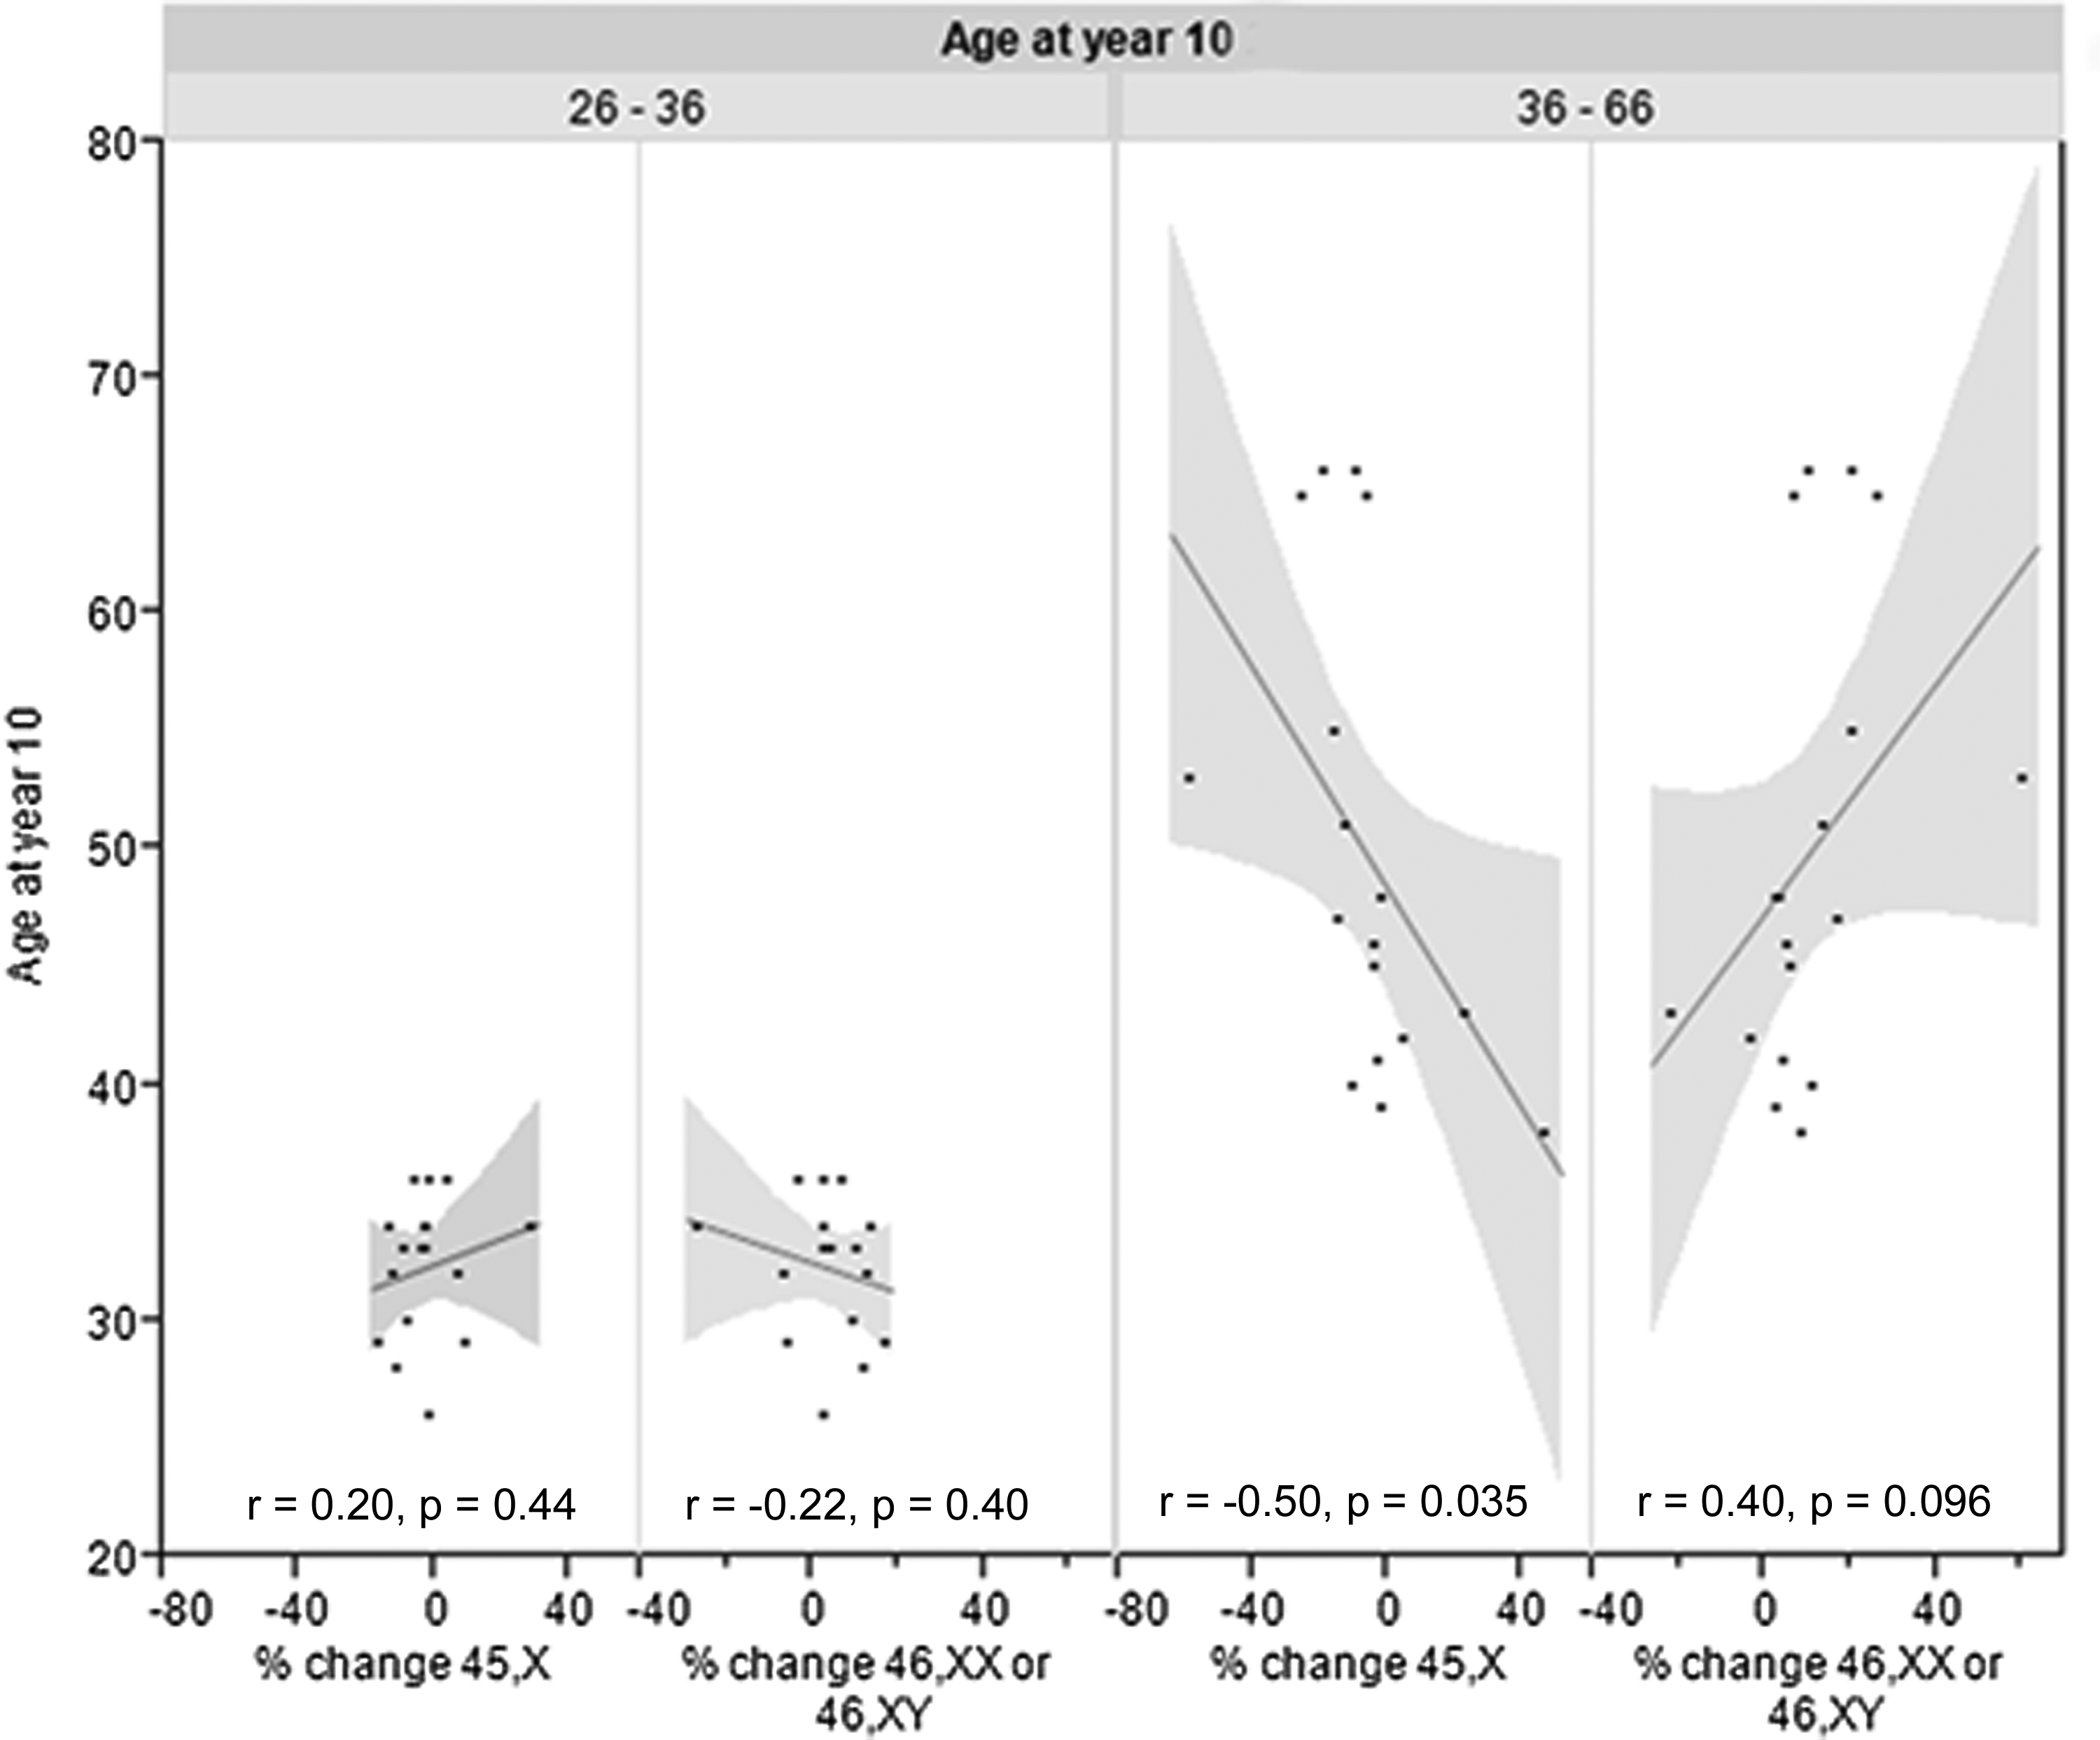
Correlation between age and % change in 45,X and 46,XX or 46,XY cells, respectively, in women with Turner syndrome divided into two age groups: ≤36 years (n=17) and >36 years (n=18). Participants with <2% change (n=7) were excluded from the analysis. Each line of fit shows a linear regression with confidence intervals. As shown, there was a stronger correlation between age and % change of 45,X and 46,XX or 46,XY cells in women >36 years of age compared with women ≤36 years of age.
Discussion
There was a significant increase in the proportion of diploid cells after 10 years in the whole study population of women with TS. There was a significant positive correlation between age and % change in diploid cell proportion (Fig. 3) as well as a negative correlation between age and % change in 45,X cell proportion. The correlations were stronger in women >36 years of age compared with women ≤36 years of age. These findings are the opposite of the situation for 46,XX women in the general population (Guttenbach et al., 1995). As it is known that women with TS have a 10 years shorter life expectancy (Gravholt, 2004), the present study was unique in its inclusion of TS women up to fairly high ages. The short life expectancy makes it difficult to investigate TS women older than those in the present study.
In contrast to the majority of participants, a few women showed a decrease in proportion of diploid cells during the 10-year follow-up period (participant 23 in Table 2 and participants 33 and 38 in Table 3). These deviations from the overall trend may be due to activated genes on the marker chromosomes influencing the cell survival rate.
Barrenas et al. (2000) proposed a cell cycle delay hypothesis, suggesting a prolonged cell cycle in 45,X cells that would lead to fewer 45,X cells over time as the proportion of 45,X decreased. This is a probable explanation for the increased proportion of diploid cells in the TS women in the present study. Another possible mechanism behind our findings may be related to apoptosis. In a study by Gupta et al. (2003), where T cells from cord blood of a patient with TS were analyzed, an increased apoptosis was observed in the 45,X cells compared with cells from a control.
Concerning the women originally diagnosed to have 45,X cells only, the occurrence of a second diploid cell line later in life may be due to either an originally very low degree of mosaicism (cryptic mosaicism) or the establishment of a second cell line with uniparental disomy (two copies of the chromosome received from only one of the parents and none from the other). With the method used in this study, it was not possible to distinguish between paternally and maternally inherited X chromosomes.
The large variation in genotypes within the participants made it necessary to divide them into subgroups, even though this might jeopardize the proof of significance due to the small sample size. This may be the reason why the mosaic group did not show any significant difference in diploid cell proportion after 10 years, as the group only contained nine individuals. With regard to phenotype, the women in the “other” group were more similar to the women in the 45,X group, meaning that they would gain the most from an increase in diploid cell line, whereas women with mosaicism (45,X/46,XX or 45,X/46,XY) were expected to be healthier overall and to have less to lose by not having an increase in diploid cells (El-Mansoury et al., 2007).
One limitation of this study was the lack of controls (i.e., women without TS). However, it is well known that the loss of one of the female sex chromosomes is related to normal aging in women (Nowinski et al., 1990; Guttenbach et al., 1995; Zietkiewicz et al., 2009). One strength of the study was that all women with TS were followed for a relatively long time, 10 years, at fairly high ages, and that they were examined by the same staff and with the same methods throughout this time period. Another strength was that the FISH analysis on buccal smears showed concordance with the conventional karyotypes on the lymphocytes.
Most other studies of this kind have used phytohaemagglutinin-stimulated blood lymphocytes (Russell et al., 2007). However, some have also been performed on cells such as differentiated myeloid cells or buccal mucosal cells with the help of FISH technology (Barrenas et al., 2000; Hanson et al., 2001b). The latter technique was also used in the present study, which was yet another strength, since buccal cells can be studied in vivo and there is no need for culturing of cells (which can affect and thus give an erroneous estimation of true cell line proportion).
Observations made on lymphocytes from children with mixoploid cells showed that the frequency of the abnormal cell line decreased with age (Nielsen and Krag-Olsen, 1980). This appeared to give fewer clinical symptoms compared with children born with the same chromosome abnormalities in all of their cells (Nielsen and Krag-Olsen, 1980). In addition, the level of mosaicism in women with TS is correlated with both the number and seriousness of stigmata (El-Mansoury et al., 2007). For example, cardiac malformations and aortic dissection were more frequently found among women with TS and monosomy than in women with TS who had mosaicism (El-Mansoury et al., 2007). It would therefore be of relevance to investigate whether an increase, decrease, or lack of change in proportion of diploid cells with time has an impact on the phenotype, health, and life expectancy in women with TS.
Conclusions
The proportion of diploid 46,XX cells increases with time in women with TS, and the % increase in diploid cell proportion correlates positively with age. The findings are in contrast to the situation in women with 46,XX in the general population, indicating a decreased cell cycle rate and/or an increased apoptosis of chromosomally abnormal 45,X cells. These new findings might have relevance for the life expectancy in women with TS.
Footnotes
Acknowledgments
The excellent help from midwife Halina Sporrong for coordinating the patients is gratefully acknowledged. This study was supported by grants from the Gothenburg Medical Society and grants from the ALF agreement at the Sahlgrenska University Hospital and the Swedish Council for Working Life and Social Research and Hjalmar Svensson Foundation.
Author Disclosure Statement
No competing financial interests exist.