
Abstract
Gene expression is subject to epigenetic regulation and is dependent upon cellular context. Spatial omics tools can provide insight into cellular context; however, development has centered on spatial transcriptomics and proteomics. Deterministic barcoding in tissue for spatial omics sequencing was the first spatial epigenomics platform at the cellular level. In this study, we present a comparison of spatial epigenomic profiling on both 50-channel and 96-channel platforms. The new 96-channel microfluidics chip design greatly improved precision in cell typing and identification of regulatory elements by spatial-ATAC-seq. Spatial mapping reveals complexity of glial cell and neuronal localization within brain structures as well as cis-regulatory elements controlling cellular function. This technology streamlines spatial analysis of the epigenome and contributes a new layer of spatial omics to uncover the context-dependent regulatory mechanisms underpinning development, disease, and normal cellular function.
Introduction
Single-cell sequencing has defined the composition of different cell types from specific tissues but requires dissociation and thereby lacks the context of cellular function in the native tissue environment. Spatial omics technologies have emerged to profile gene expression of cells within the context of the surrounding tissue. Although many of these methods were developed and commercialized for spatial transcriptomics1,2 or proteomics, 3 they require high-resolution imaging systems and are limited by finite panels of probes.
Deterministic barcoding in tissue for spatial omics sequencing (DBiT-seq) 4 was developed as a way to integrate unbiased multiomics spatial mapping of tissue using microfluidics and commonly used next-generation sequencing (NGS) workflows. The DBiT-seq platform is highly flexible and has demonstrated utility as a spatial transcriptomics, proteomics, epigenomics, and multiomics platform.4–8
DBiT-seq was the first platform, in both academic and commercial use cases, to enable users to profile the epigenome with spatial resolution at the cellular level, building upon insight generated by single-cell ATAC-seq 9 and CUT&Tag. 10 Spatial epigenomics can uncover the causative relationships between the chromatin state or histone modifications and the context-specific gene expression of cells within tissue. In the past decade, epigenetic states within the genome have been shown to influence brain development, 11 cognitive decline, 12 tumorigenesis, 13 and aging of tissue. 14 Researchers now have tools to study the epigenetic dysregulation in the tissues where diseases originate, which can inform development of drugs targeting the epigenome.15–21
Spatial epigenomics platforms can create molecular maps of normal and diseased tissue, 15 which begins to address the inherent heterogeneity of different tissues and complex disease states. In this study, we demonstrate the utility of spatial profiling of chromatin accessibility and histone modifications directly in brain tissue with spatial ATAC-seq and CUT&Tag applications of DBiT-seq. One limitation of the first-generation commercial DBiT-seq platform lies in the 2.5 mm × 2.5 mm field of view (FOV) for analysis.
This iteration of the platform uses a two-layer 50-channel microfluidics chip with 25 μm resolution. For some tissues, the 2.5 mm × 2.5 mm FOV size and resolution is not adequate to capture full anatomical structures or tissue heterogeneity. To this end, we sought to develop an improved DBiT-seq platform, which enables unbiased profiling of the epigenome over a 3.8 mm × 3.8 mm FOV on tissue with 20 μm resolution. In this study, we demonstrate an improved ability to identify unique cell populations and regulatory features across a larger region of tissue with this new development.
Results
Commercial DBiT-seq platform design and workflow
Since the invention of the academic DBiT-seq platform, the commercialization process has led to iterations of the hardware components that have improved the ease of use of the platform. The workflow for spatial ATAC-seq or spatial CUT&Tag using a streamlined DBiT-seq protocol is shown in Figure 1. Fresh frozen tissue sections were subjected to light fixation, then permeabilized on the slide (Fig. 1, Step 1). For ATAC-seq applications, Tn5 transposition is performed and adapters with a ligation linker are inserted into accessible regions of the genome.
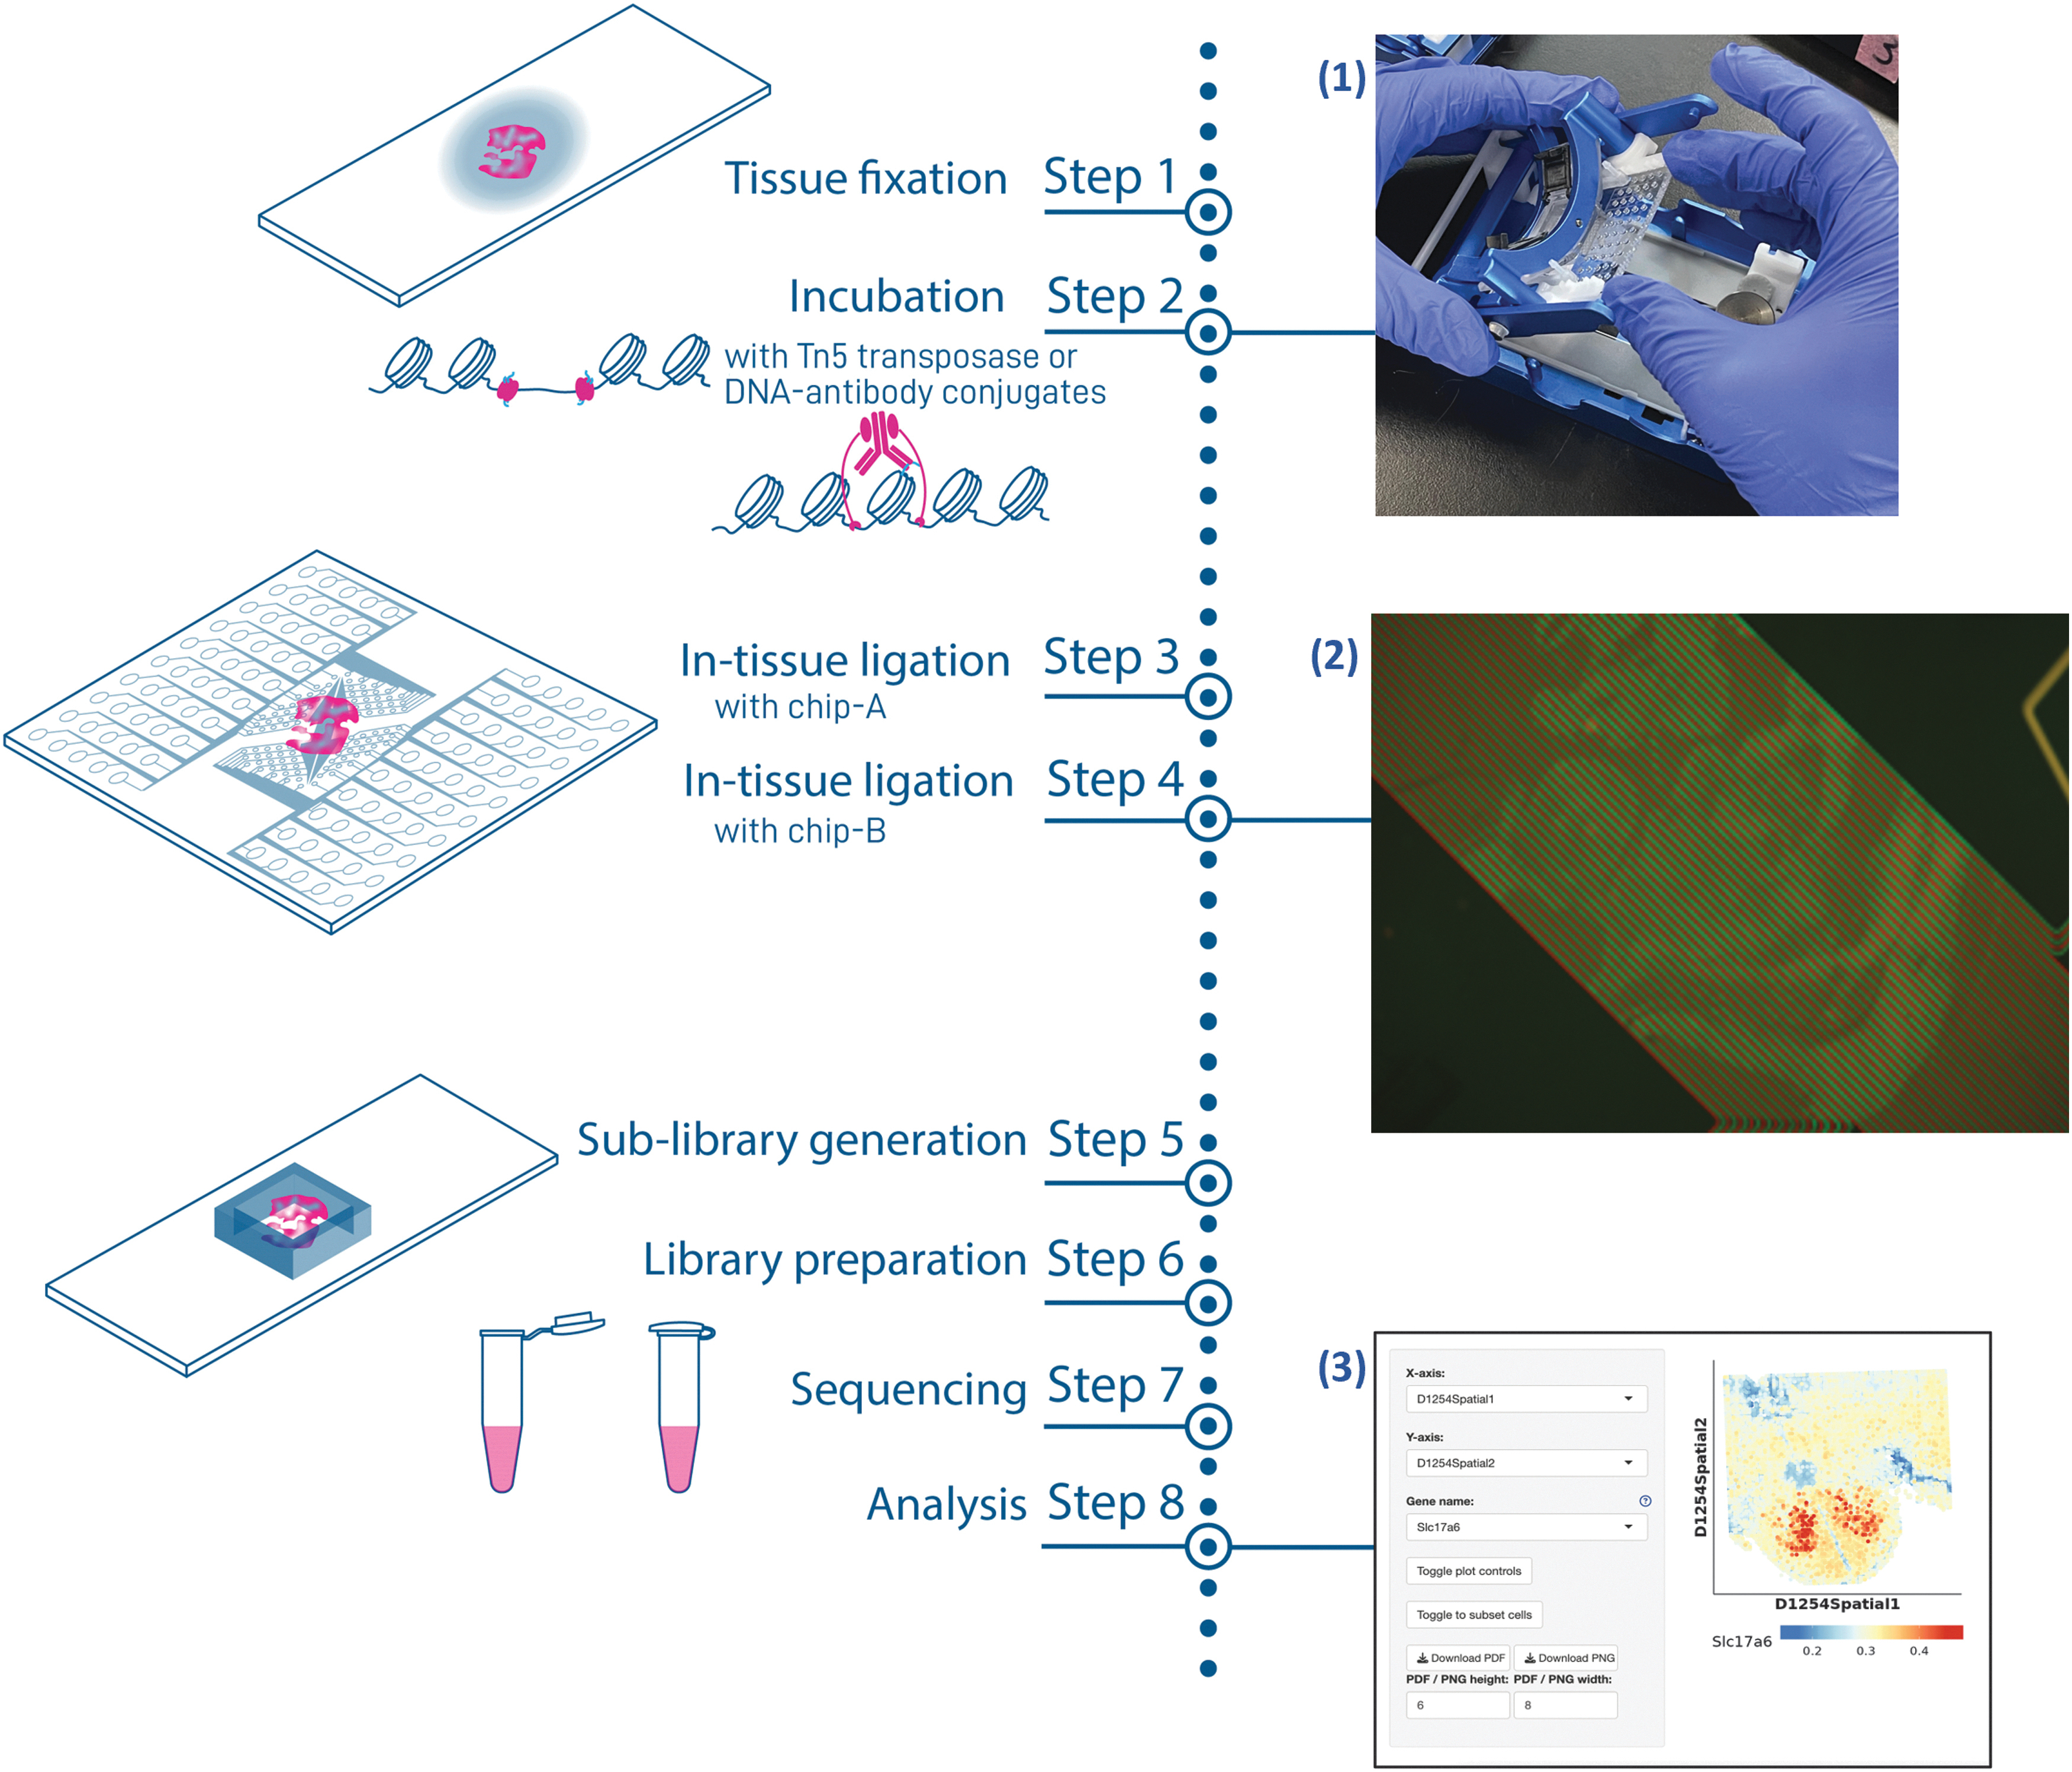
For CUT&Tag applications, antibodies are used to direct transposition toward histone modifications of interest. A pA-Tn5 binds to the immunoglobulin regions of the antibodies and inserts adapters with a ligation linker into the genomic DNA surrounding the histone modification of interest (Fig. 1, Step 2). Next, a two-layer, dust-resistant microfluidics chip is used to deliver spatial barcodes to the tissue. Each of these steps is performed using a newly designed and optimized AtlasXpress clamp (Fig. 1, Image 1).
The optimized clamp improves microfluidics delivery of reagents over high-quality tissue sections. Microfluidics flow quality control (QC) is an essential step to evaluating tissue quality and optimizing the DBiT-seq commercial platform in each tissue type. Successful QC checks contain green and red fluorescent dyes in an alternating pattern across the tissue (Supplementary Fig. S1A, B).
Testing
The first-generation commercial microfluidics chips contain 50 channels, through which DNA barcodes are delivered. The first set of DNA barcodes are flowed over the tissue to perform
To increase the amount of data that could be generated from one tissue section, we developed a microfluidics chip that delivers reagents to a larger FOV at improved resolution. The second-generation commercial microfluidics chips contain 96 channels and generates a 3.8 mm × 3.8 mm grid of 9216 tissue elements. After the
Sequencing data are processed and visualized using AtlasXomics software suite. Final analysis is then visualized using our interactive ShinyApp (Fig. 1, Image 3). In combination with the streamlined hardware and optimized protocol for data acquisition and analysis, the new and improved microfluidics chips enable a nonexpert spatial user to generate spatial epigenomics data.
Spatial epigenome mapping of mouse hippocampus
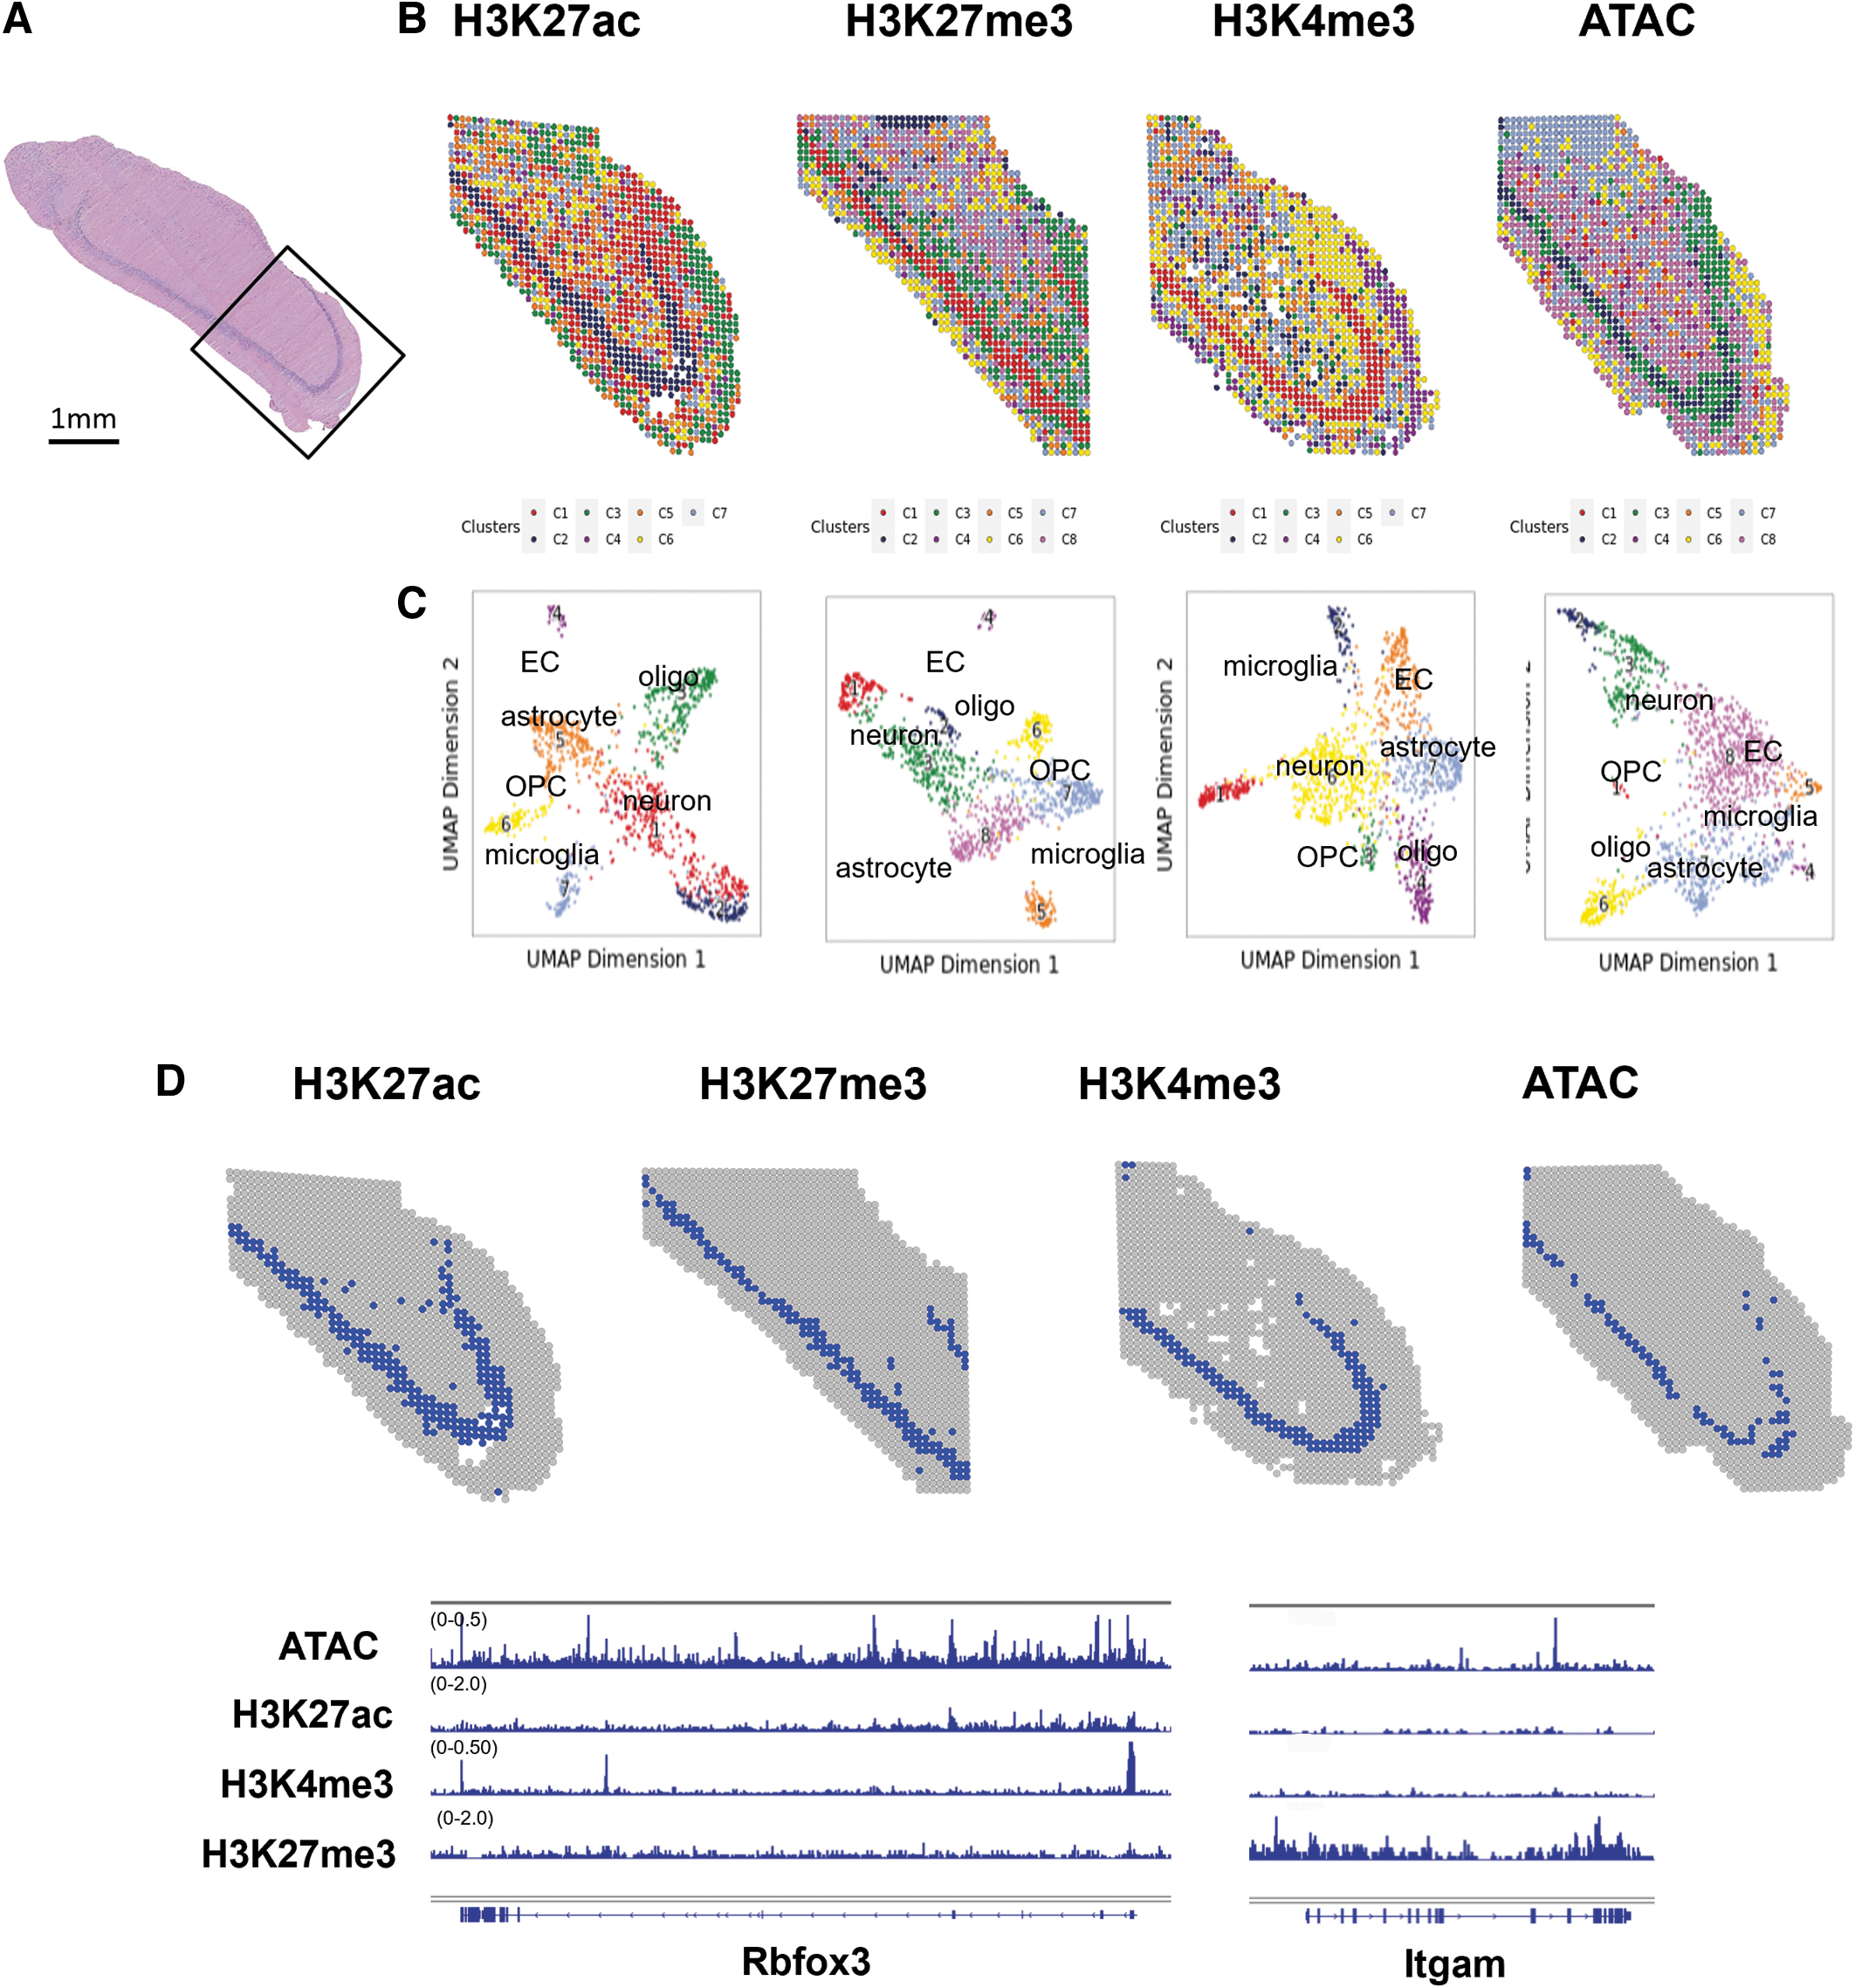
To validate the performance of our optimized spatial ATAC-seq and spatial CUT&Tag protocols, we performed the assays on adjacent sections of mouse brain. CUT&Tag was performed with antibodies against H3K27ac, H3K27me3, and H3K4me3 on 10 μm thick sections of an isolated hippocampus (Fig. 2A). Mapping of clusters by spatial chromatin accessibility and all three histone modifications identified anatomical patterns that agree with the adjacent sectioned stained with hematoxylin and eosin and known structures in the hippocampus (Fig. 2B).22,23
Spatial epigenome data exhibited strong performance metrics across all assays. This was evident by uniform TSS enrichment throughout the tissue (Supplementary Fig. S3A, B) and by high TSS enrichment for ATAC-seq, H3K27ac, and H3K4me3, fragments per Tixel (Supplementary Fig. S3B), as well as expected periodicity between nucleosome-free and mononucleosome peaks in the fragment distribution plot (Supplementary Fig. S3C). As expected, H3K27me3 CUT&Tag produced lower TSS enrichment than other histone markers (Supplementary Fig. S3A, B).
One of the advantages of spatial omics is the ability to recognize mixtures of cell types and how they may impact one another in the environment of the tissue. Our spatial platform was able to cell type with epigenomic information alone. Cell types were identified in each cluster by their chromatin accessibility and histone modifications. Pyramidal neurons in the hippocampus were identified as cluster 2 by spatial ATAC-seq, cluster 2 by H3K27ac, cluster 1 by H3K27me3, and cluster 1 by H3K4me3 (Fig. 2C).
Within the pyramidal neuron cluster, spatial CUT&Tag and ATAC-seq data suggest the presence of various regulatory elements in the genome surrounding the neural marker
Although these assays provide useful information on the epigenomic signatures of pyramidal neurons and glial cells, the 50-channel platform only allowed analysis on a small area of tissue. This excludes other anatomical features, such as the dentate gyrus in the hippocampus, which may contain important information about how the neurons of this structure impact the epigenomic state of pyramidal neurons and vice versa.
Enhanced cell identification with 96-channel DBiT-seq commercial platform
To this end, we have developed and optimized a 96-channel microfluidics platform (Portal96), which can be used to generate approximately fourfold more data than the first-generation 50-channel platform (Portal50). To remain compatible with standard 25 mm × 75 mm glass slides, the bottom layer hole locations between the two generations of chips remained identical (Fig. 3A, B).
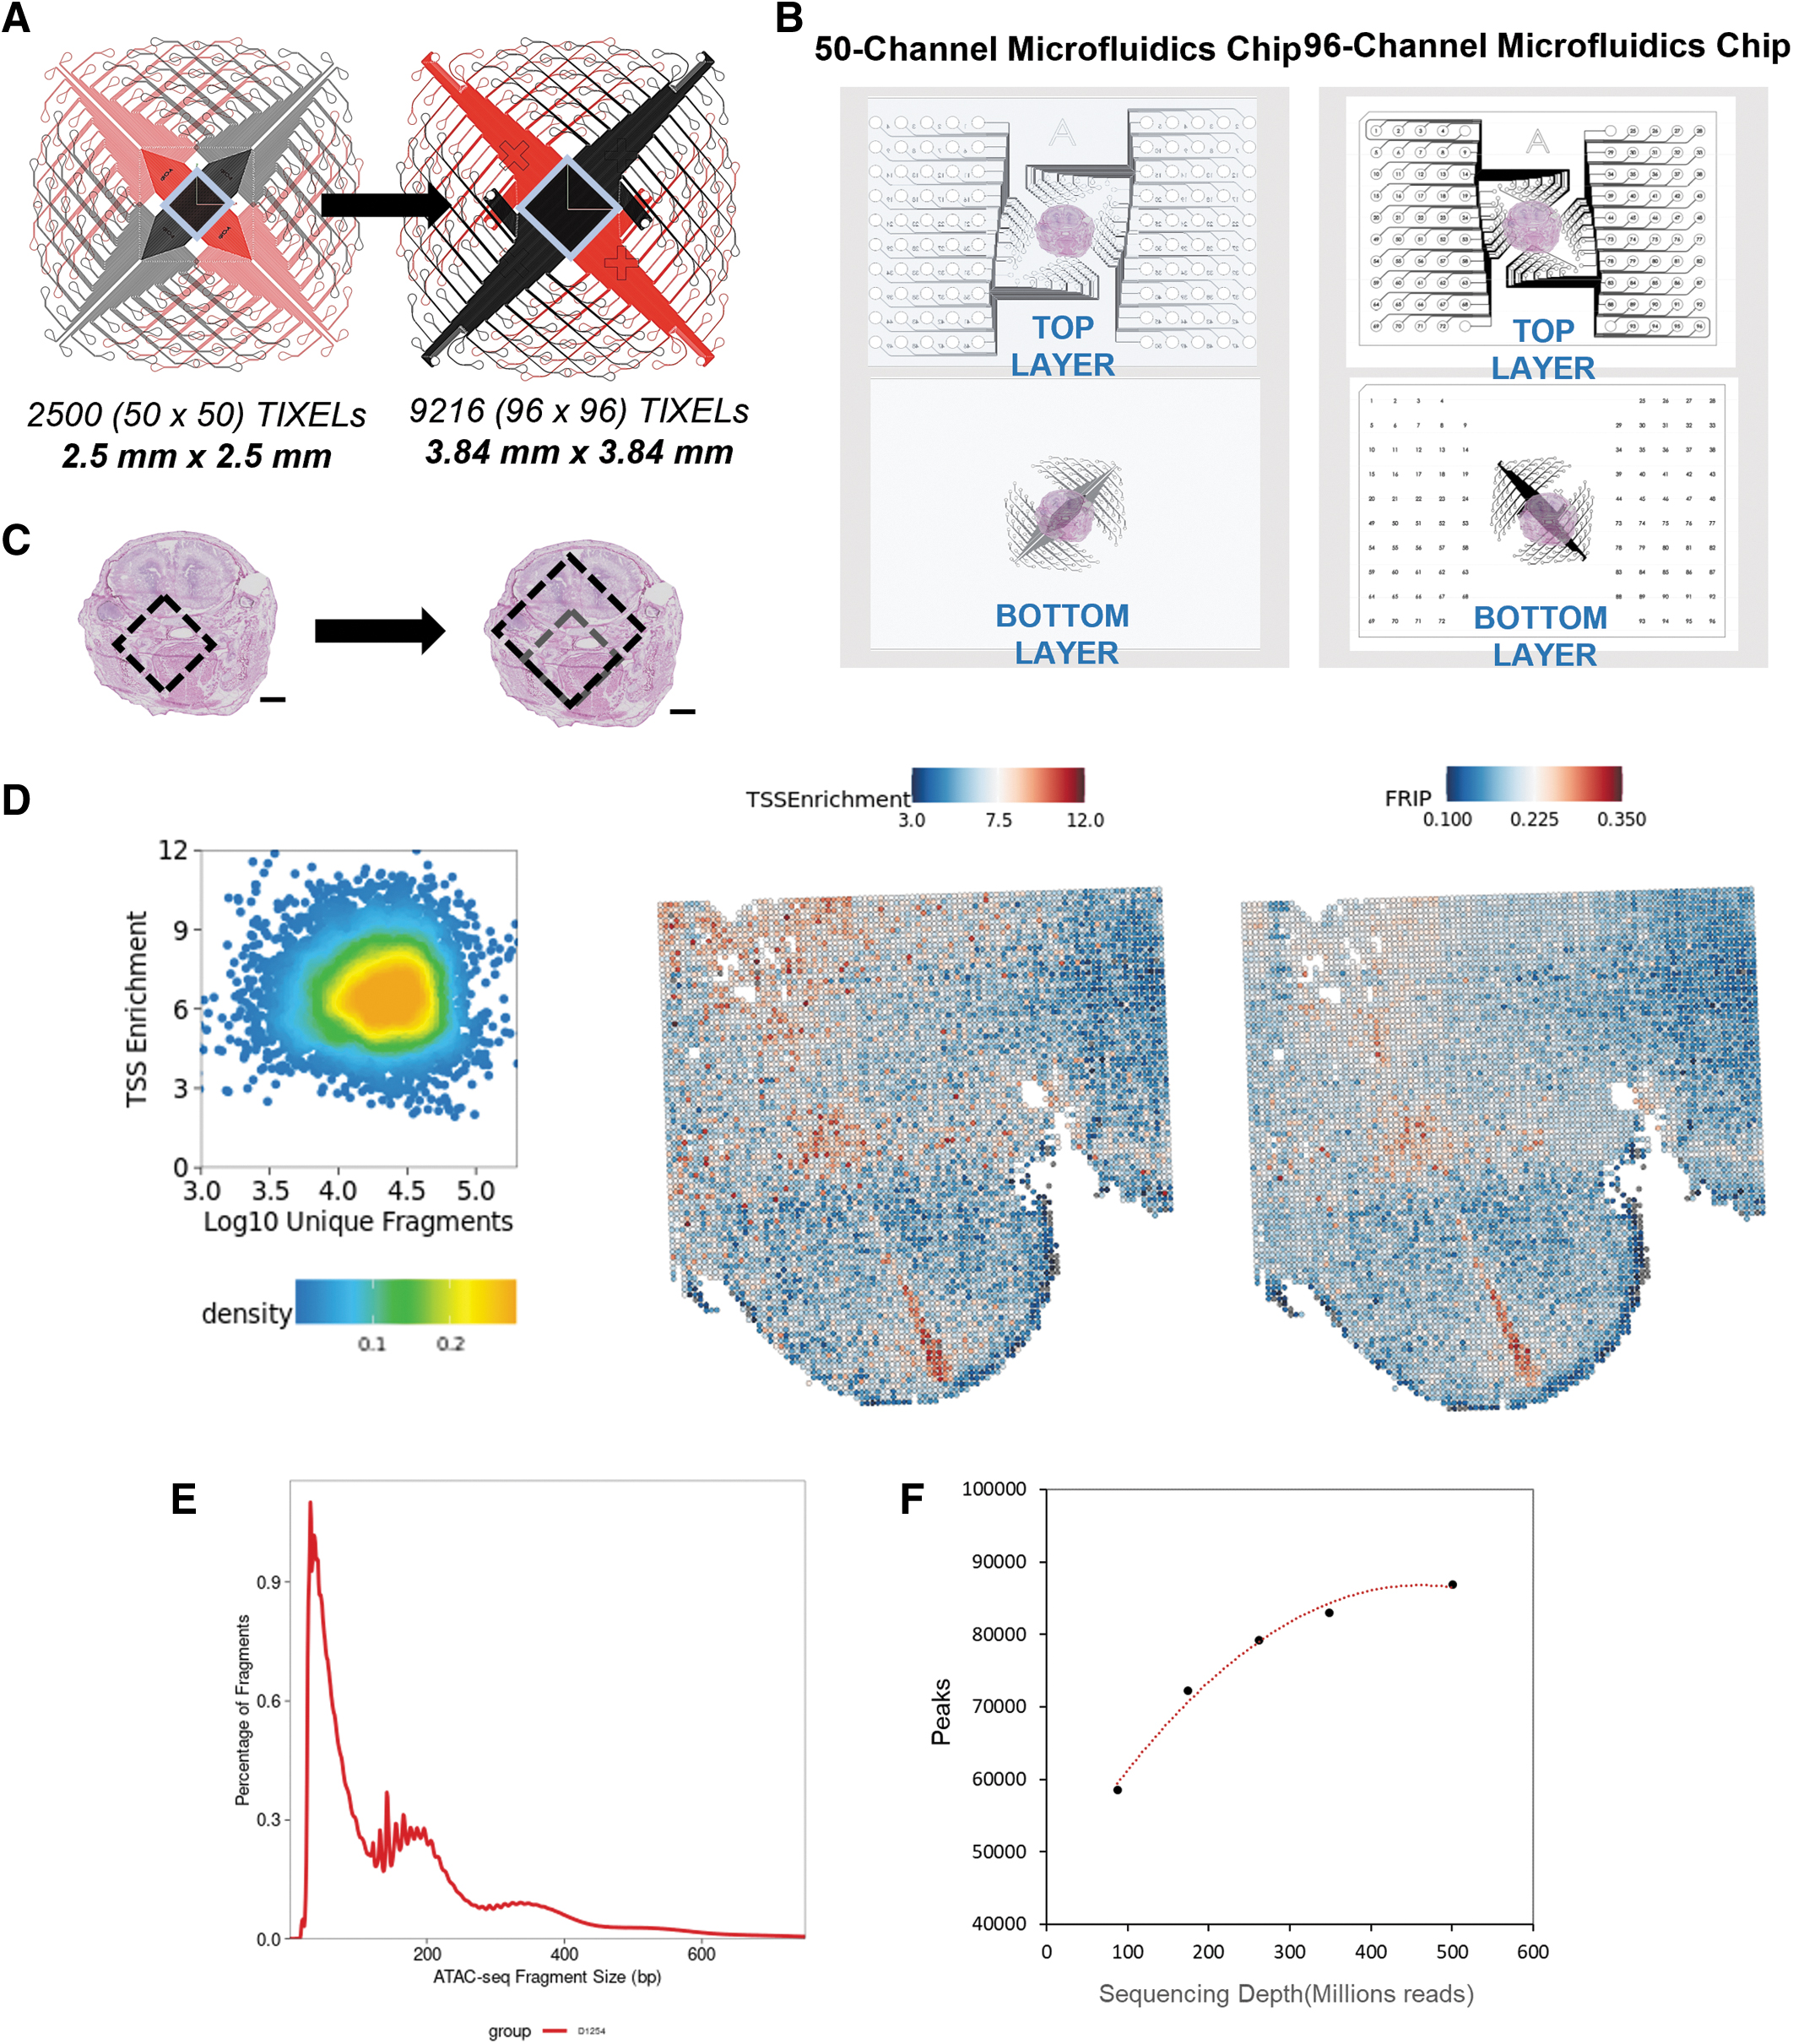
The 50-channel platform can be used for spatial mapping of a 2.5 mm × 2.5 mm FOV at 25 μm resolution, with 2500 Tixels total. Our newly developed platform can be used for spatial mapping of a 3.8 mm × 3.8 mm FOV at 20 μm resolution, with 9216 Tixels total (Fig. 3C). To enable Portal96, the number of inlets was increased, and outlets were decreased. Common outlet technology 26 was incorporated to create the new microfluidics chip.
Spatial ATAC-seq using the Portal96 chip was assessed using standard performance metrics with a resulting median TSS of 6.45, a median Fraction of Reads in Peaks of 0.19, and 19,824 fragments per Tixel. The distribution is uniform across the tissue, with regional spikes corresponding to specific morphological features (Fig. 3D). The ATAC-seq fragment distribution exhibits the anticipated periodicity, with peaks evident at both nucleosome-free and mononucleosome regions (Fig. 3E). Lastly, to determine the optimal sequencing depth required to saturate the library, we observed saturation around 90,000 peaks when using 500M reads (150PE sequencing), which translates to ∼50,000 reads per Tixel (Fig. 3F).
To evaluate the utility of the new platform, we performed spatial ATAC-seq on two adjacent 10 μm horizontal sections of mouse brain to capture the ventral hypothalamus (Fig. 4A). 27 One section was analyzed with the 50-channel microfluidics platform and one section was analyzed with the 96-channel microfluidics platform (Fig. 4B). Targeting of the same region with both chips was made possible by the spatial aligner built into the AtlasXpress clamp (Supplementary Fig. S4).
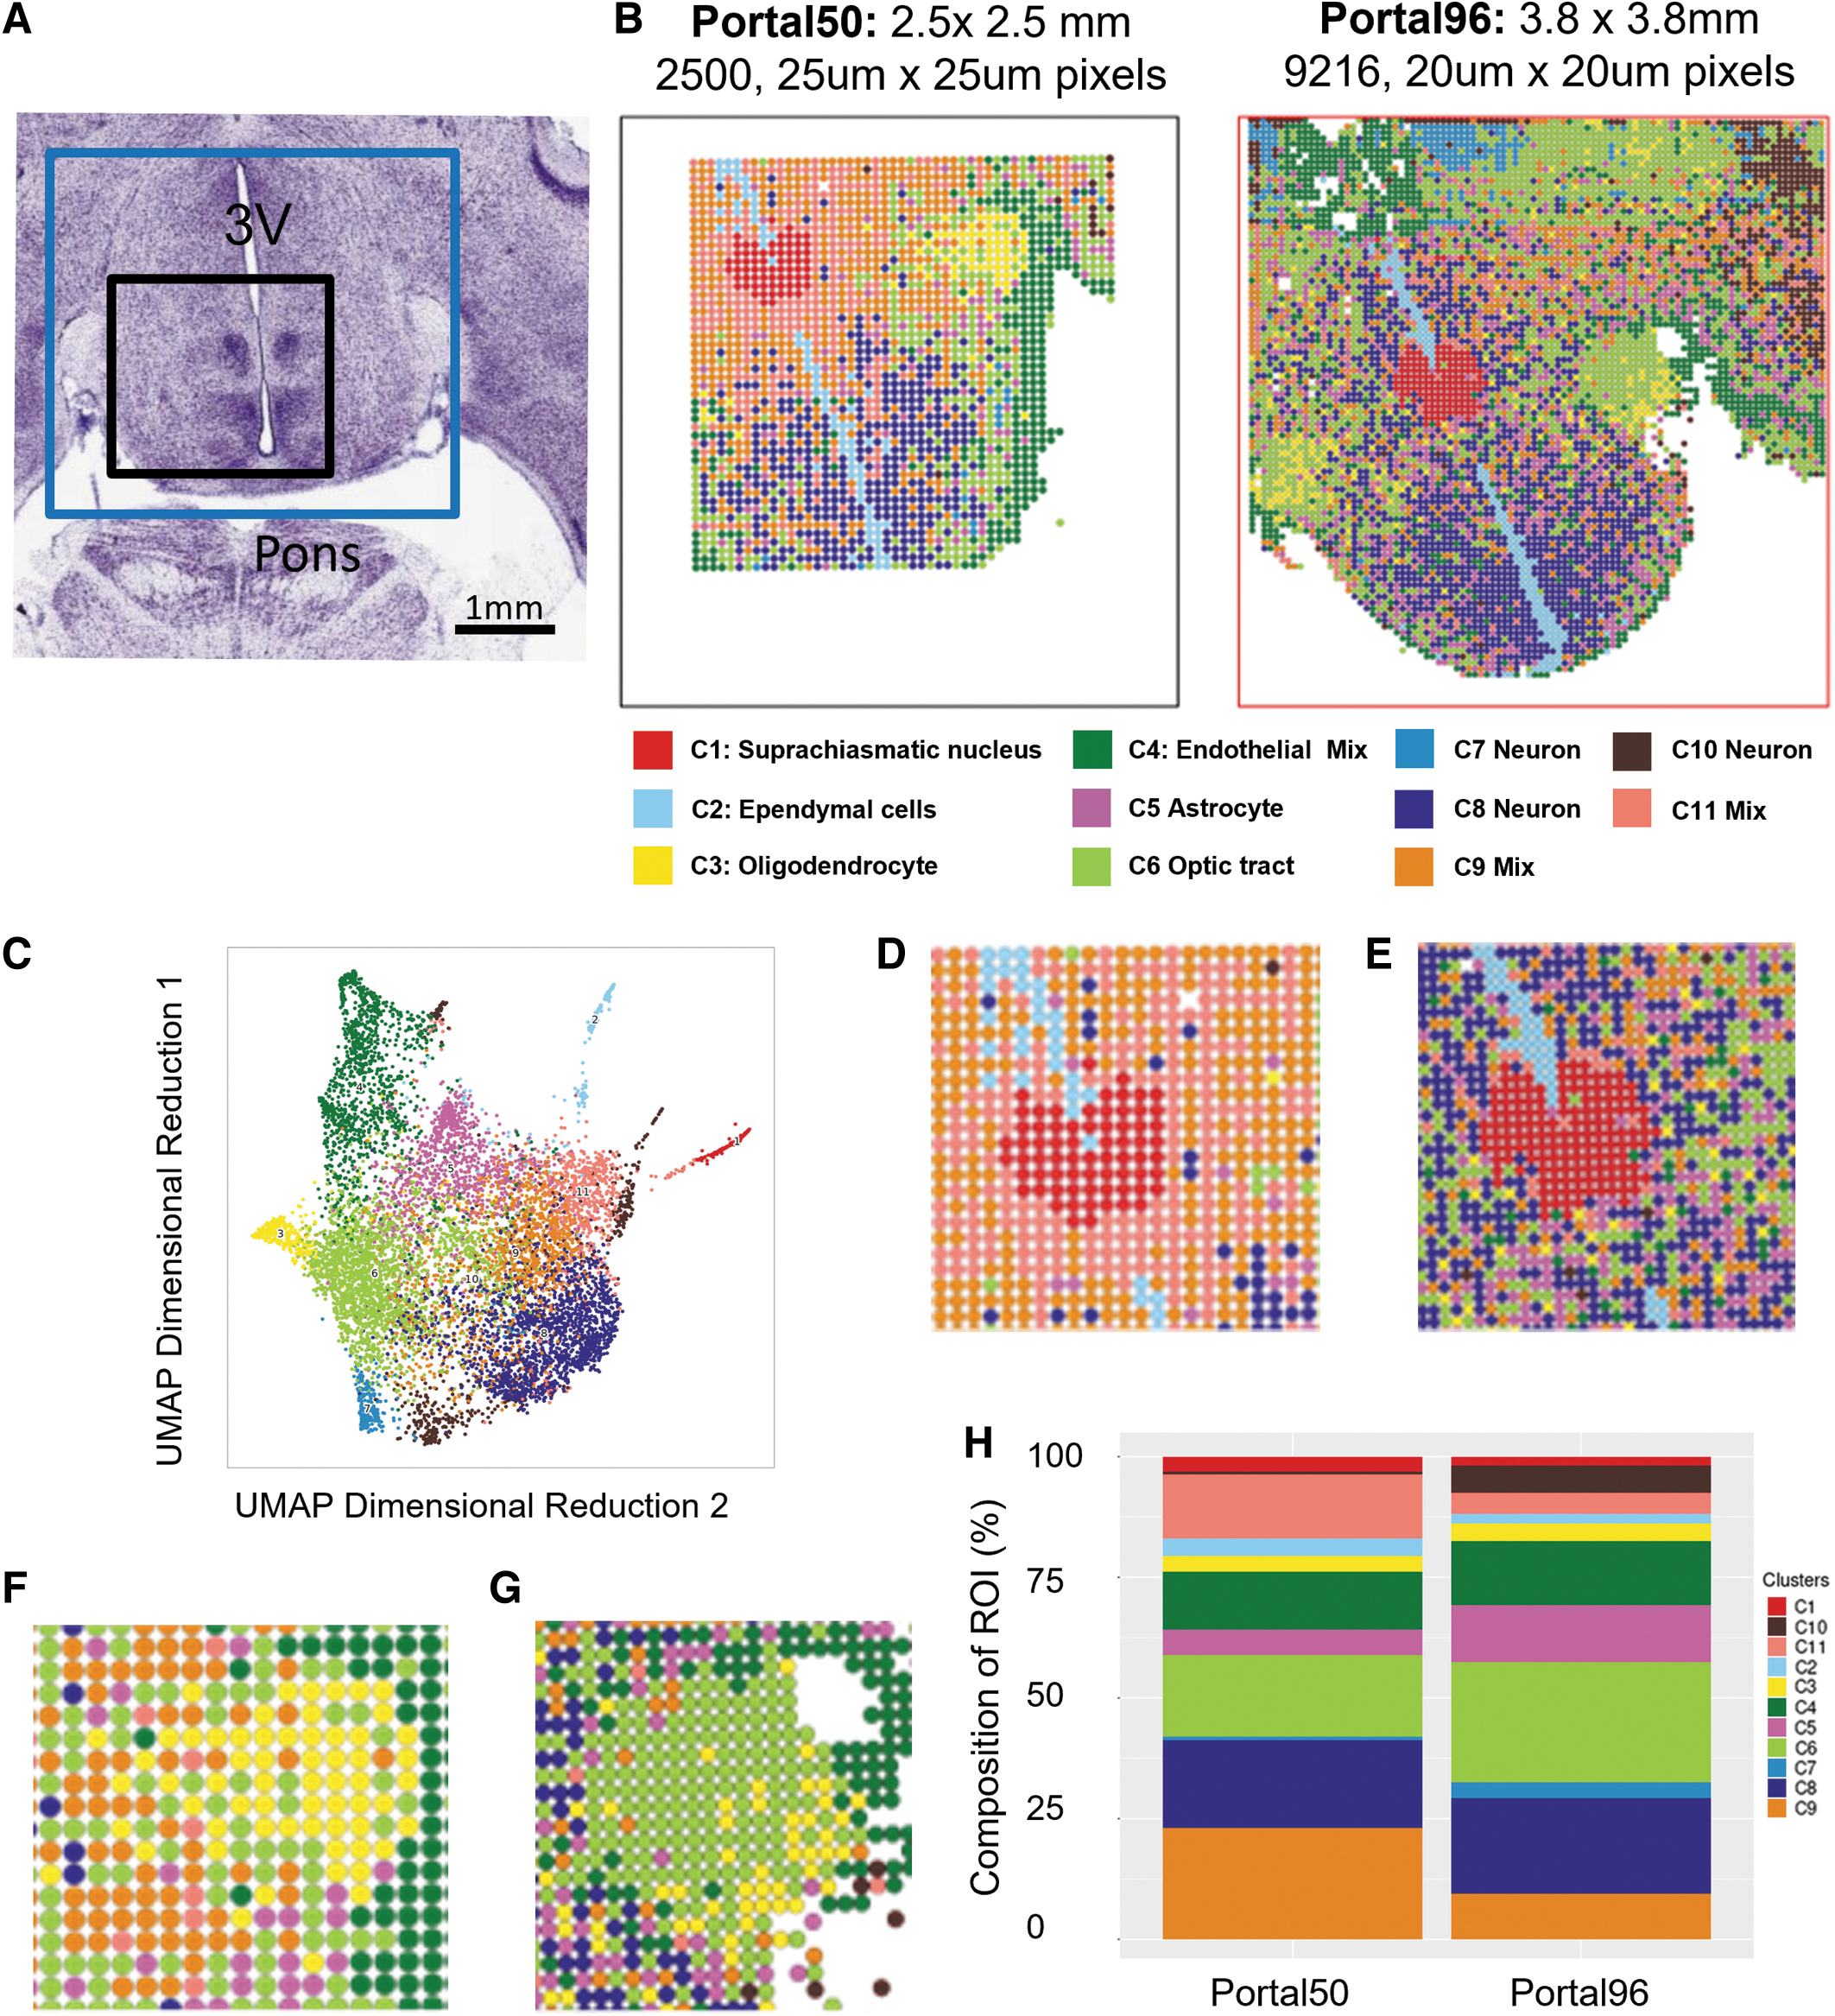
Cell types were identified by gene activity scores of marker genes 28 corresponding to levels of chromatin accessibility pooled from both spatial ATAC-seq runs (Fig. 4C) and matched to annotated brain anatomy. 27 Clusters were spatially mapped, and cell types were found to correspond with known structures of the ventral hypothalamus (Fig. 4B).
With the increased FOV, additional regions of cluster 6, identified as the optic tract, are captured (Fig. 4B). Clusters 7 and 10 were largely hidden in the 50-channel platform but are able to be analyzed in the 96-channel platform. With the increased resolution of the 96-channel platform, mixed populations of clusters 9 and 11 (Fig. 4D) are identified as distinct subpopulations of astrocytes and neurons in the 96-channel (Fig. 4E).
The 96-channel platform also more precisely locates the oligodendrocyte population within the optic tract regions. With the smaller, lower resolution FOV it appears that oligodendrocytes make up the whole of the anatomical region that identified as the optic tract (Fig. 4F). However, the increased FOV and increased resolution of the new platform reveals defined edges of the optic tract, with discrete Tixels identified as oligodendrocyte populations distributed throughout the optic tract (Fig. 4G).
The improved resolution also helps identify more distinct populations of astrocytes (cluster 5), clusters 8 and 10 (Fig. 4A). Quantification of the cell type composition in each FOV shows increased complexity and additional cell populations are captured by the 96-channel platform (Fig. 4H). Thus, the new platform provides a more granular view of the tissue of interest, in this case, the hypothalamus.
Refined spatial ATAC-seq mapping of cell neighborhoods and regulatory elements in the mouse hypothalamus
To provide meaningful context to the spatial ATAC-seq analysis with the new platform, we examined marker genes defining specific cell type in spatial differentiated clusters. Unsupervised clustering of chromatin accessibility scores for known marker genes 28 of various glial and neuronal cells indicate that glial cell populations are prominent in clusters 2, 3, 4, and 5, whereas neuron subpopulations are present in all other clusters (Fig. 5A).
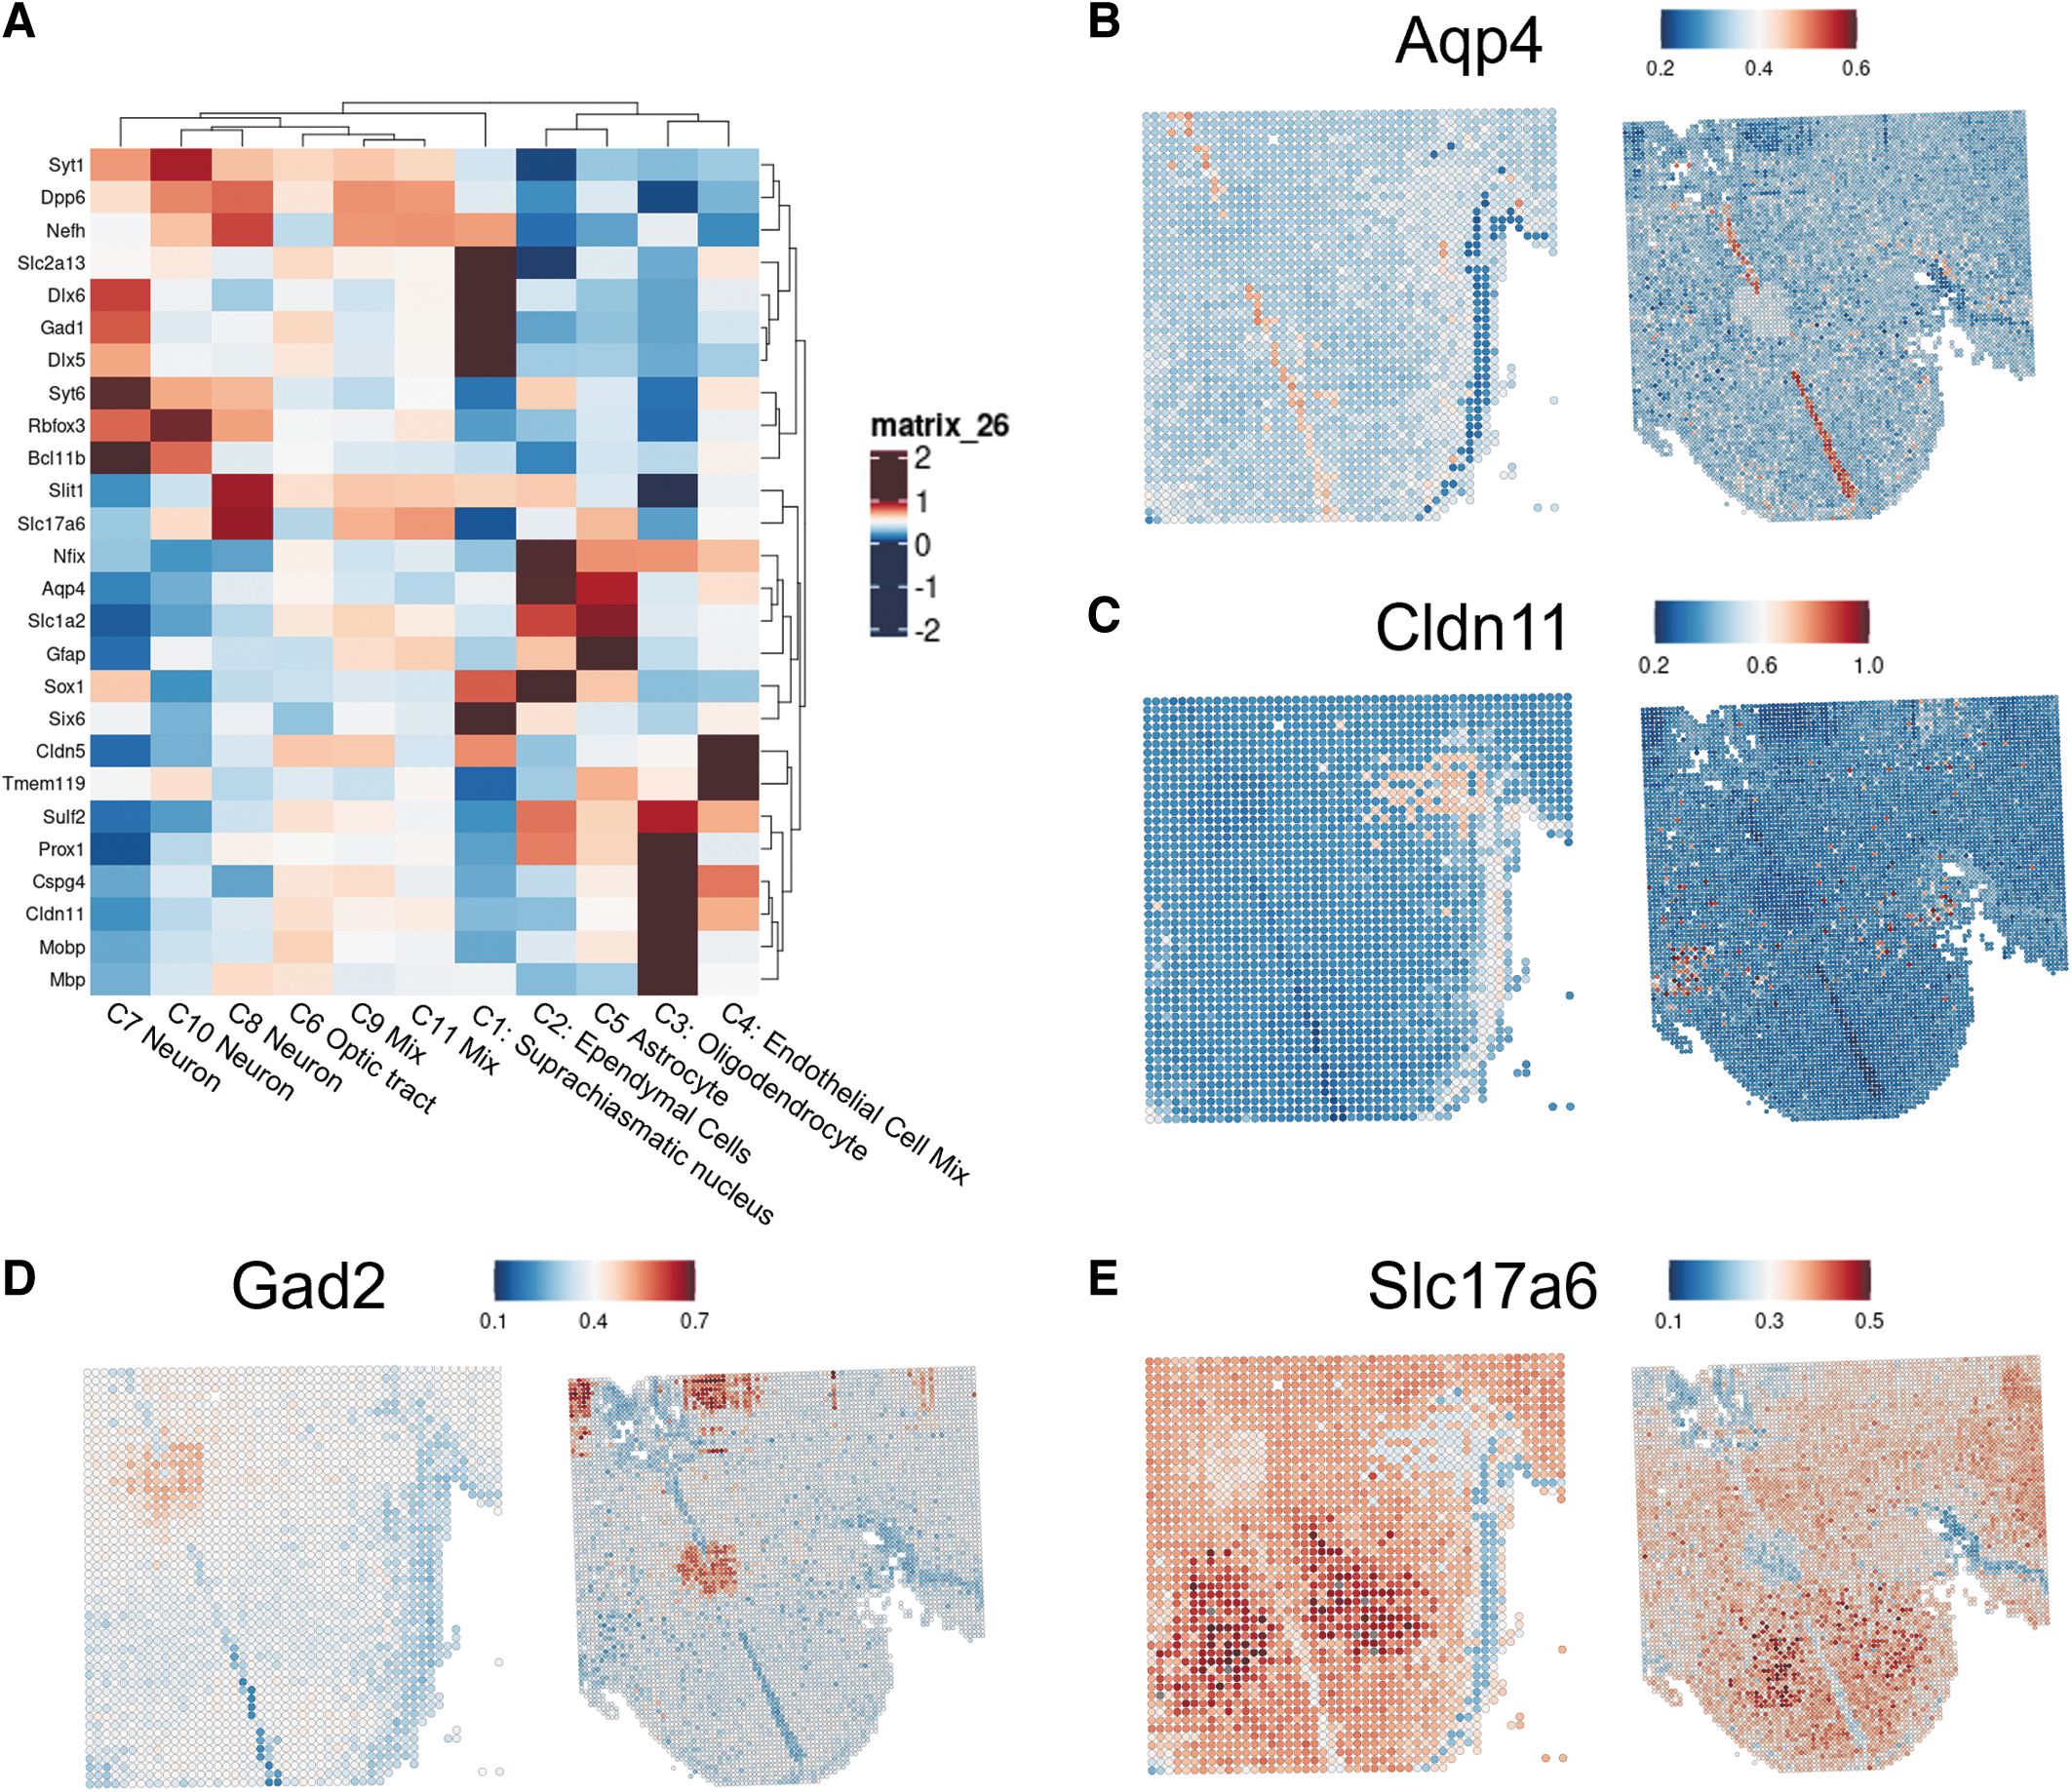
When mapping gene activity scores for selected marker genes, we find that spatial clustering aligns with anatomical features of the ventral hypothalamus. Accessibility of
However, use of the 96-channel platform leads to identification of subpopulations of oligodendrocytes throughout the hypothalamus, which were previously undetectable with the 50-channel platform, suggesting that the new platform may be better equipped to identify relatively rare cell populations in a given tissue section.
Distinct subpopulations of neurons can also be identified by chromatin accessibility of functional protein coding genes. For instance,
We were also able to identify spatially differentiated, accessible transcription factor binding motifs, which can help define the potential regulatory networks of chromatin accessibility and specific transcription factors in each spatial cluster. We find that sets of transcription factor motifs are specifically accessible in cluster 1 (SCN), cluster 2 (Ependymal cells), cluster 4 (Endothelial cell mix), and cluster 10 (Neurons) (Fig. 6A).
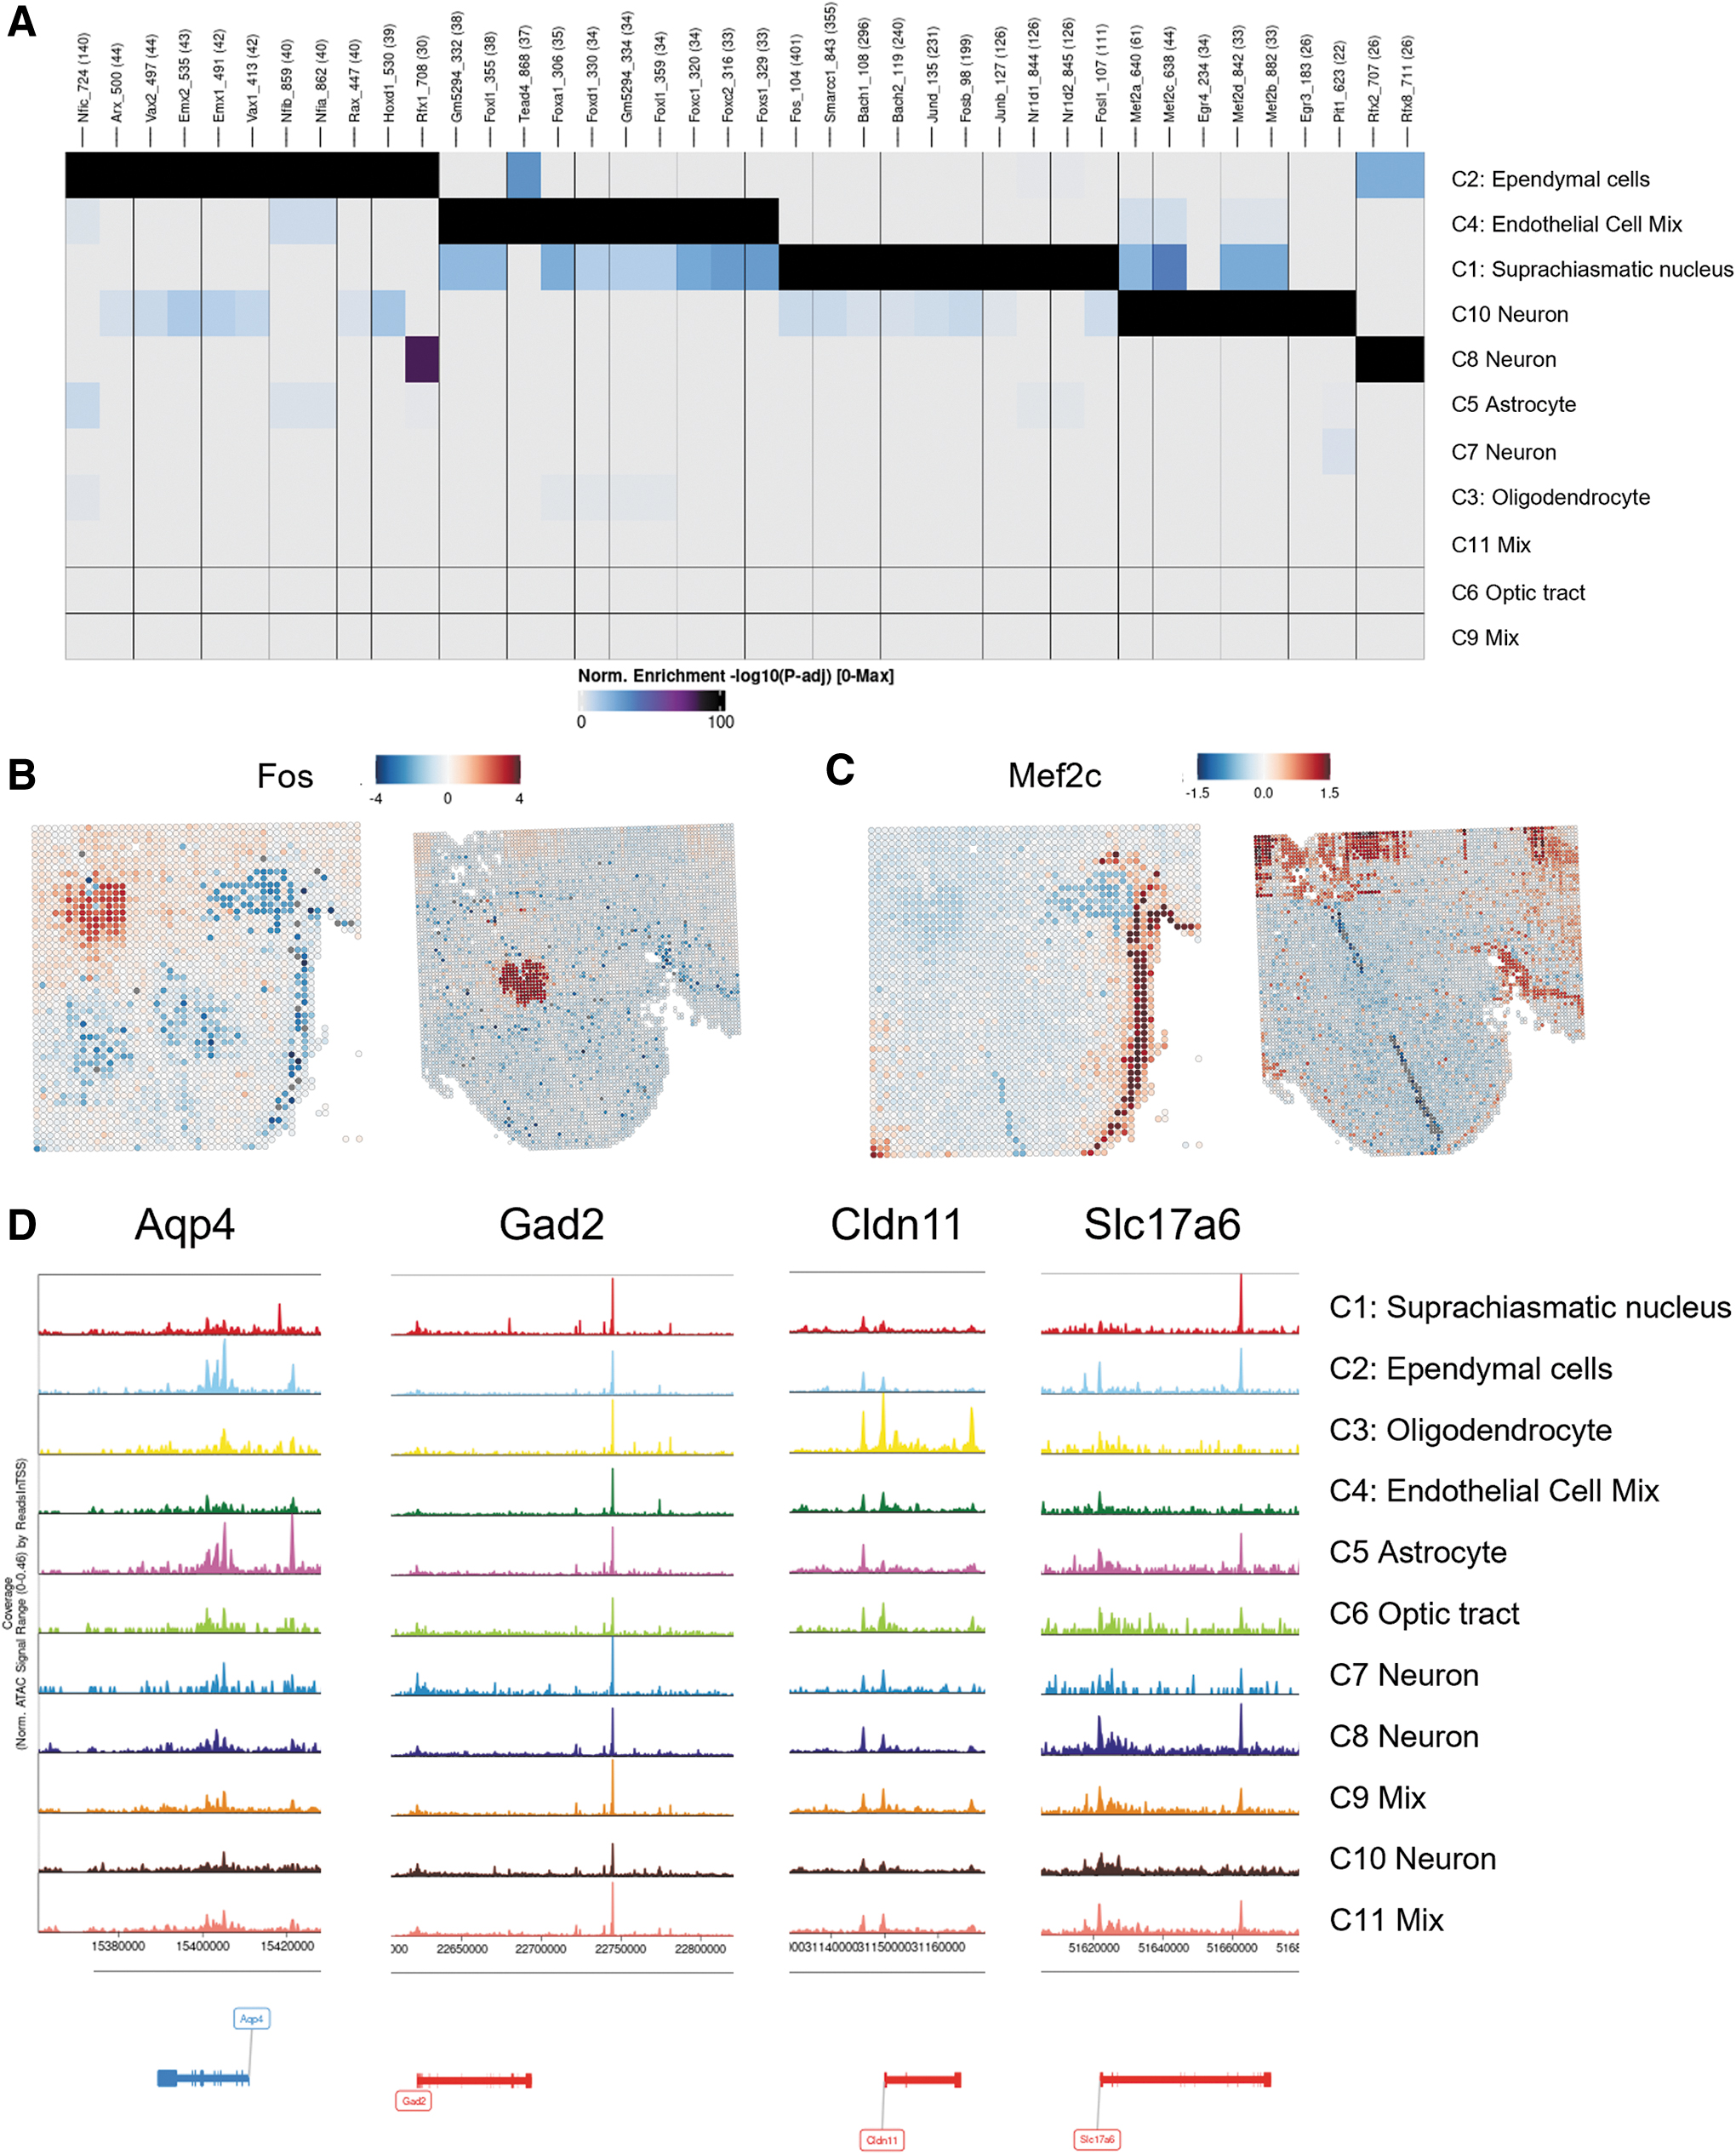
Notably, the Fos binding motif is highly accessible in the SCN, defined by cluster 1 (Fig. 6B). The Fos gene itself is also accessible in the SCN (Supplementary Fig. S5A), suggesting that cFos expression is key for regulation of SCN neurons. Transcriptional expression of cFos is tightly regulated by circadian rhythms in the SCN, which can in turn regulate circadian transcriptional programs by cFos binding. 33
The specificity of the Fos binding motif accessibility, limited to the SCN, is improved by the 96-channel platform (Fig. 6B). We also find that the Mef2c motif is significantly accessible in neurons in cluster 10. Mef2c as a transcriptional activator or repressor has been implicated in regulating activity or morphology of excitatory synapses or GABAergic synapses, 34 respectively. Most significant enrichment of the Mef2c binding motif present in cluster 10 is revealed by the 96-channel platform (Fig. 6C). This cluster also shows significant accessibility of the Mef2c gene (Supplementary Fig. S5B), suggesting that Mef2c actively regulates the genome in cluster 10 neurons.
Furthermore, we observed differences in regions of open chromatin at putative cis regulatory elements35,36 for marker genes of various cell types. Spatial ATAC-seq reads show increased open chromatin at an enhancer and promoters for
These results suggest that the chromatin state at regulatory elements in the genome is cell type and spatial context specific. Taken together, these results suggest that spatial epigenomic mapping with increased FOV and resolution greatly improves insight into the regulatory and cellular context for gene expression in specific cell types.
Discussion
We developed a streamlined platform for performing spatial epigenomics utilizing the chemistry and principles of DBiT-seq. 4 We demonstrate the utility of profiling histone modifications and chromatin accessibility at 25 μm within a 2.5 mm × 2.5 mm FOV by identifying cell types and features of gene regulation in the mouse hippocampus. Furthermore, we have illustrated the increased precision of spatial ATAC-seq at 20 μm within a 3.8 mm × 3.8 mm FOV for larger and more complex samples.
We observed improved identification of mixed cell populations in the mouse hypothalamus. The improvements made on the platform are unbiased to the biological analytes being targeted. Although epigenetic information was shown by spatially profiling chromatic accessibility, the improvements in data quality will translate to other assays used with the same hardware. 8
The Bigger Picture
Areas for further development include the integration of single-cell deconvolution and integration with other spatial omics, such as transcriptomics and proteomics. Owing to the Tixel size, tissue elements in spatial ATAC-seq or CUT&Tag may contain multiple nuclei depending on average cell size in a particular tissue. Using cell-type deconvolution methods or integrating spatial maps with high-resolution immunofluorescence imaging of tissue could address this challenge.
Spatial multiomics applications have been demonstrated using the DBiT-seq workflow8,37 but have not yet been applied to our 96-channel, 20 μm resolution platform. Although our current focus is on spatial epigenomics, we plan to further apply this improved chip to other omics already demonstrated with the platform, including transcriptomics, proteomics, and other areas of epigenomics.4–8 Multiomics with our second-generation commercial platform is an anticipated improvement to the technology.
This advancement in the DBiT-seq technology is addressing a blind spot to most researchers by providing both spatial and epigenomic information directly from tissue samples. Epigenomic analysis through spatial ATAC-seq or CUT&Tag adds the much-needed spatial context missing from single-cell sequencing applications. Whereas this study provides insight into the cellular epigenomics and architecture of normal mouse brain tissue, the next applications for this technology will compare diseased versus normal tissue to understand the epigenomic changes underlying disease.
Future studies will address the chromatin accessibility and histone modifications inherent to tumor biology and neurodegenerative diseases. Discoveries around epigenomics in these diseases will lead to a greater understanding of pathogenesis and lead to identification of targets to guide future therapeutics development. Thus, mapping the epigenome is an essential step in understanding regulation in gene expression underlying various disease states. The utilization of spatial epigenomics in translational research will be transformative to developmental biology, neuroscience, and oncology, among others.
Methods
Portal96 microfluidics chip design
The microfluidic chips were designed using both AutoCAD and SolidWorks software. Each chip polarity required 2 models for their respective bottom layer and top layer. The number of tissue interfacing channels were increased in the new microfluidic chip design by converging 96 inlets to 4 outlets. The channels merge after crossing the FOV of the chip. Four of the user interfaceable holes were used as outlets and the remaining 96 holes, compatible with multichannel pipettes, were converted into inlets.
Chips' photomasks and wafers were manufactured, and the microfluidic layers were casted from the masters out of polydimethylsiloxane (Dow Corning 1317318) per manufacturer instructions. To avoid backflow of the merged barcodes in the outlets, cyclical flow was implemented, 26 and the ligation incubation was done while the microfluidic chip flowed using the AtlasXomics Docking Station (AXO-0399).
Design of the microfluidic chip clamp
Modeling of the AtlasXpress Gen 3 (AXO-0316) was done using SolidWorks software. The clamps were manufactured and assembled in preparation for their qualification of clamping 20 μm channel microfluidic chips. To improve the 25 μm resolution to 20 μm without sacrificing reliability, the clamping mechanism of the AtlasXpress was optimized to create a hermetic seal between channels, thus preventing channel crosstalk. The AtlasXpress and 96-channel chip geometry have been validated to reliably flow over tissue ≤10 μm thick.
Tissue preparation
For spatial CUT&Tag, C57BL/6J mouse hippocampus was procured from Jackson Laboratories (JR: 000664). For spatial ATAC-seq, CD-1 (ICR) mouse brain was purchased from BioIVT (MSE00BRAIN-0112935). Both tissues were fresh frozen blocks embedded in Optimal Cutting Temperature compound. Fresh frozen tissue was sectioned to 10 μm thick, affixed to super frost plus slides (Fisher Scientific 12-550-15), and stored at −80°C. Adjacent sections of the same tissue blocks were used between the Portal50 and Portal96 DBiT-seq runs.
Sample optimization and assessing tissue quality
To ensure optimal tagmentation, we conducted an
To assess tissue integrity, tissue artifacts, and sectioning quality, we utilize our fluidics and apply alternating fluorescent dyes to an adjacent section obtained from the same block. The flow QC is considered successful if there are no instances of merging fluorescent barcodes (red and green alternation) and if the tissue remains intact after the flow test. See Supplementary Figure S1 for more details.
Spatial ATAC-seq assay
Spatial ATAC-seq assay (AXO-0303) was performed using AtlasXomics' protocols. In brief, the tissue was fixed with 0.2% paraformaldehyde (PFA) for 5 min and then quenched with glycine and dried. The tissue was then processed using the optimized parameters, 15 min of permeabilization with 0.2% NP40, and 30 min of tagmentation. Tagmentation was stopped and tissue was washed and dried for spatial barcoding.
Spatial CUT&Tag assay
Spatial CUT&Tag (AXO-0423) was performed using AtlasXomics' protocols. In brief, the tissue was fixed with 0.2% PFA for 5 min and then quenched with glycine and dried. The tissue was then permeabilized for 5 min and incubated 1:50 primary antibody (α-H3K27me3 antibody: 9733 Cell Signaling Technology, α-H3K4me3 antibody: 39159 Active Motif, α-H3K27ac antibody: ab177178 Abcam) overnight in antibody buffer.
Secondary antibody (ABIN101961 Antibodies-Online) was incubated for 30 min to 1 h 1:50 in secondary antibody buffer. The sample was then washed with 150 wash buffer and pA-Tn5 (1:100) in 300 wash buffer was incubated for 1 h. Excess pA-Tn5 was removed, and sample was washed before adding tagmentation buffer (1 h at 37°C). Tagmentation is stopped and tissue was washed and dried for spatial barcoding.
Spatial barcoding
Ligation Master Mix was prepared and aliquoted for each spatial barcode in a 96-well plate format (AXO-0310, Portal50), (AXO-0422, Portal96). For Portal96, alignment of the microfluidic chip's FOV to the desired tissue section was performed using the integrated aligner in the AtlasXpress Gen 3 clamp (see Supplementary Fig. S4 and Supplementary Data S2 for more details).
Vacuum is then applied to the outlets of the Chip A (AXO-0267 Portal50, AXO-0396 Portal96) and spatial ligation-barcode mix is flowed across the tissue within channels using the Portal96 or Portal50 preset on the Docking Station (refer Supplementary Data S3). This is then repeated for Chip B (AXO-0270 Portal50, AXO-0397 Portal96) and the tissue is then imaged and lysed overnight. The lysate is then removed, and the DNA is purified.
NGS library preparation
NGS library preparation for CUT&Tag and ATAC-seq was performed using standard NGS amplification methods (see Supplementary Data S1).
Sequencing
Single-index, 150 × 150 paired-end sequencing was performed on a NovaSeq 6000 (Illumina, 20012850) or NextSeq 2000 (Illumina, 20038897) with 15% PhiX. We targeted a depth of 200 million reads for spatial CUT&Tag, 300 million reads for Portal50 ATAC-seq and 500 million reads for Portal96 ATAC-seq.
Data preprocessing
Preprocessing follows closely with the spatial ATAC-seq publication in Nature. 6 In brief, the resulting FASTQ files were aligned to the mouse reference genome (mm10), filtered to remove duplicates and counted using Chromap. 38 The browser extensible data-like fragments files were generated for downstream analysis. The fragments file contains coordinates of sequenced DNA molecules mapped to Tixel barcodes.
Data visualization
Spatial epigenome visualization follows closely with the spatial ATAC-seq published in Nature. 6 In summary, pixels on tissue samples were identified from microscopy images using the AtlasXomics software, AtlasXbrowser, 39 to create Seurat-compatible metadata files. After reading the fragment file into ArchR, pixels not on tissue were removed based on the generated metadata. Data underwent normalization and dimensionality reduction using ArchR's implementation of iterative latent semantic indexing, followed by graph clustering and Uniform Manifold Approximation and Projection embedding.
Gene accessibility scores and matrices were produced with ArchR's Gene Score model, and marker regions/genes for clusters were identified with ArchR functions. Visualization of spatial data utilized the ArchR-to-Seurat pipeline; pixel size was scaled for enhanced clarity. Genome browser tracks were generated in ArchR. Finally, processed data were loaded into a custom RShiny App for easy visualization. Contact AtlasXomics for access to bioinformatics data preprocessing and visualization pipelines.
Footnotes
Acknowledgments
We would like to thank the Yale Comparative Pathology Research core for tissue processing services. We would also like to sincerely thank Professor Rong Fan's lab at Yale University for inventing DBiT-seq and establishing its immense potential. And we also would like to thank Chong Xia at the Institute of Systems Biology (ISB), who was instrumental in modeling the initial design for photomask generation.
Authors' Contributions
Conceptualization and design by Z.K., G.R., and J.B. Methodology by J.G., J.M., M.W., A.T., D.M., M.R., J.S., and S.D. Data acquisition by G.R., A.T., J.G., A.M., M.R., Z.K., and J.P. Analysis by J.M., N.S.C., C.N., J.G., and J.B. Interpretation and visualization of data by J.G., K.N., and C.N. Writing, review, and editing by K.N., C.N., Z.K., and G.R. Administrative, technical, or material support by K.W., D.M., and D.L.
Author Disclosure Statement
All authors are employees/former employees, consultants for, and/or shareholders at AtlasXomics.
Funding Information
The work in this study was funded by private investors and through a NIH SBIR grant (1R44CA287890-01).
References
Supplementary Material
Please find the following supplemental material available below.
For Open Access articles published under a Creative Commons License, all supplemental material carries the same license as the article it is associated with.
For non-Open Access articles published, all supplemental material carries a non-exclusive license, and permission requests for re-use of supplemental material or any part of supplemental material shall be sent directly to the copyright owner as specified in the copyright notice associated with the article.