
Abstract
Head and neck squamous cell carcinomas (HNSCCs) are the seventh most common cancer and represent a global health burden. Immune checkpoint inhibitors (ICIs) have shown promise in treating recurrent/metastatic disease with durable benefit in ∼30% of patients. Current biomarkers for HNSCC are limited in their dynamic ability to capture tumor microenvironment (TME) features with an increasing need for deeper tissue characterization. Therefore, new biomarkers are needed to accurately stratify patients and predict responses to therapy. Here, we have optimized and applied an ultra-high plex, single-cell spatial protein analysis in HNSCC. Tissues were analyzed with a panel of 101 antibodies that targeted biomarkers related to tumor immune, metabolic and stress microenvironments. Our data uncovered a high degree of intra-tumoral heterogeneity intrinsic to HNSCC and provided unique insights into the biology of the disease. In particular, a cellular neighborhood analysis revealed the presence of six unique spatial neighborhoods enriched in functionally specialized immune subsets. In addition, functional phenotyping based on key metabolic and stress markers identified four distinct tumor regions with differential protein signatures. One region was marked by infiltration of CD8+ cytotoxic T cells and overexpression of BAK, a proapoptotic regulator, suggesting strong immune activation and stress. Another adjacent region within the same tumor had high expression of G6PD and MMP9, known drivers of tumor resistance and invasion, respectively. This dichotomy of immune activation-induced death and tumor progression in the same sample demonstrates the heterogenous niches and competing microenvironments that may underpin variable clinical responses. Our data integrate single-cell ultra-high plex spatial information with the functional state of the TME to provide insights into HNSCC biology and differential responses to ICI therapy. We believe that the approach outlined in this study will pave the way toward a new understanding of TME features associated with response and sensitivity to ICI therapies.
Introduction
Head and neck squamous cell carcinomas (HNSCCs) are tumors that develop in the lip, oral cavity, larynx, salivary glands, nose, sinuses, or the skin of the face. They represent the seventh most common cancer globally with >650,000 new cases and >300,000 deaths annually. 1 The primary risk factors include tobacco use, excessive consumption of alcohol, and infection with human papilloma virus. 2 The current treatment regimen for HNSCC remains surgery and radiotherapy with/without chemotherapy, but resistance and tumor recurrence contribute to an overall poor prognosis. 3
While immunotherapies have been approved in the recurrent/metastatic setting for HNSCC, and some have shown to provide a durable benefit, better predictive biomarkers are needed to identify HNSCC patients who will achieve therapeutic benefits.4–6
Immunosuppression is a characteristic hallmark of HNSCC and analysis of immune checkpoints PD-1/PD-L1, FOXP3+ regulatory T cells and CD8+ tumor infiltrating lymphocytes in the tumor microenvironment (TME) has been explored extensively. 4 However, there are no validated biomarkers to predict immunotherapy responsiveness across HNSCC patients, likely due to the high degree of intra- and inter-tumoral heterogeneity.
A promising avenue in this regard is the recent emergence of spatial biomarkers that seem to better predict patient outcomes to immunotherapy. For example, a retrospective analysis of immune cell neighborhood frequencies in cutaneous T cell lymphomas has highlighted the potential for spatial analysis of tumor-associated immune cells as a means to stratify immunotherapy-sensitive and -resistant cohorts. 7 Several additional studies now support the utility of spatial biomarkers.8–11
To date, most studies on spatial biomarkers have been focused on immune cell populations within the TME. However, tumor biology is much more complex and spans a wide range of biological mechanisms and pathways.12,13 For example, cellular metabolism is critical to the functioning of all cells and metabolic reprogramming in cancer plays an important role in tumor progression, immune activation, and metastasis.14–17
Studies investigating metabolic tissue signatures in HNSCC are limited and lack spatial context that would be critical to analyze the metabolome at the single-cell level. 18 Coupling spatial analyses of the tumor immune microenvironment with information about cellular metabolism and stress could, thus, provide valuable new insight into the HNSCC biomarker landscape and identify predictive signatures of response and resistance.
In the present study, we developed an ultra-high plex single-cell spatial protein analysis of HNSCC. Our workflow (Supplementary Fig. S1) is based on CO-Detection by indEXing (CODEX).19,20 CODEX employs cocktails of DNA-tagged antibodies to stain tissue, which is then followed by iterative steps of hybridization with complementary, fluorescently labeled probes for imaging (Supplementary Fig. S1A).
This results in the generation of imaging data with dozens of antibody readouts, thereby enabling the extraction of high-parameter, spatially resolved single-cell data from solid tissue samples.21–23 Crucially, CODEX is based on optical imaging and thus offers established technical advantages of high resolution, scalability of imaging area, as well as wide-ranging flexibility.
The commercialized version of CODEX, the PhenoCycler® Fusion (Akoya Biosciences, The Spatial Biology Company, Marlborough, MA) is widely deployed and the workflow is seamlessly compatible with a wide range of other applications. In this study, we applied a 101-plex antibody panel spanning biomarkers from the hallmarks of cancer, including immune checkpoints, tumor-promoting inflammatory biomarkers, markers related to angiogenesis, invasion, and metastasis, as well as pathways implicated in the deregulation of cellular energetics, proliferation, evading growth suppression, and apoptosis.12,13
The sum of our data allows us to not only provide a comprehensive account of the tumor immune microenvironment, but also provide insights into the metabolic state and biology of different regions within the tumor; in doing so, our data describe an intricate interplay between immune infiltration versus the metabolic and stress responses of tumor cells within these regions.
Results
Development of an ultra-high plex antibody panel for comprehensive spatial phenotyping of human formalin-fixed paraffin-embedded tissues
High-plex single-cell spatial phenotyping of human tissues has led to valuable insights into the immune contexture that plays a critical role in tumor surveillance, regression, and recurrence.7,8 To date, these studies have mainly focused on the tumor immune microenvironment with antibody panels designed to identify immune cell lineages, immune activation states, immune checkpoints, as well as some tumor specific markers. However, the sheer complexity of tumor biology warrants a more comprehensive and multi-dimensional spatial phenotyping approach to analyze the TME.
To this end, we developed an ultra-high plex antibody panel that encompasses antibodies for detection of not only immune and cancer cells, but also markers that identify cellular metabolism, apoptosis and stress, tumor invasion and metastasis, as well as cellular proliferation and deregulation. We first evaluated the performance of this panel on human formalin-fixed paraffin-embedded (FFPE) tonsil tissues.
Evaluating antibody panel performance on a tonsil tissue
Antibodies were previously validated in comparison with orthogonal standard immunohistochemistry (IHC) staining in matched human FFPE tissues19,24 and by qualitative evaluation (Supplementary Fig. S2A, B) of staining patterns with datasets from antibody suppliers and publicly available databases. 25 In addition, antibodies were titrated to determine optimal concentrations and screened with multiple fluorophores (Supplementary Fig. S2C) to select the optimal reporter channel for maximum signal-to-noise ratio.
The optimized panel configuration was then run on human tonsil and tumor tissue in triplicate to assess reproducibility; a negative control, run in parallel, demonstrated the specificity of staining (Supplementary Fig. S2D). For the metabolic and stress markers, mechanistic evaluation in knockdown models would be essential for further validating specificity.
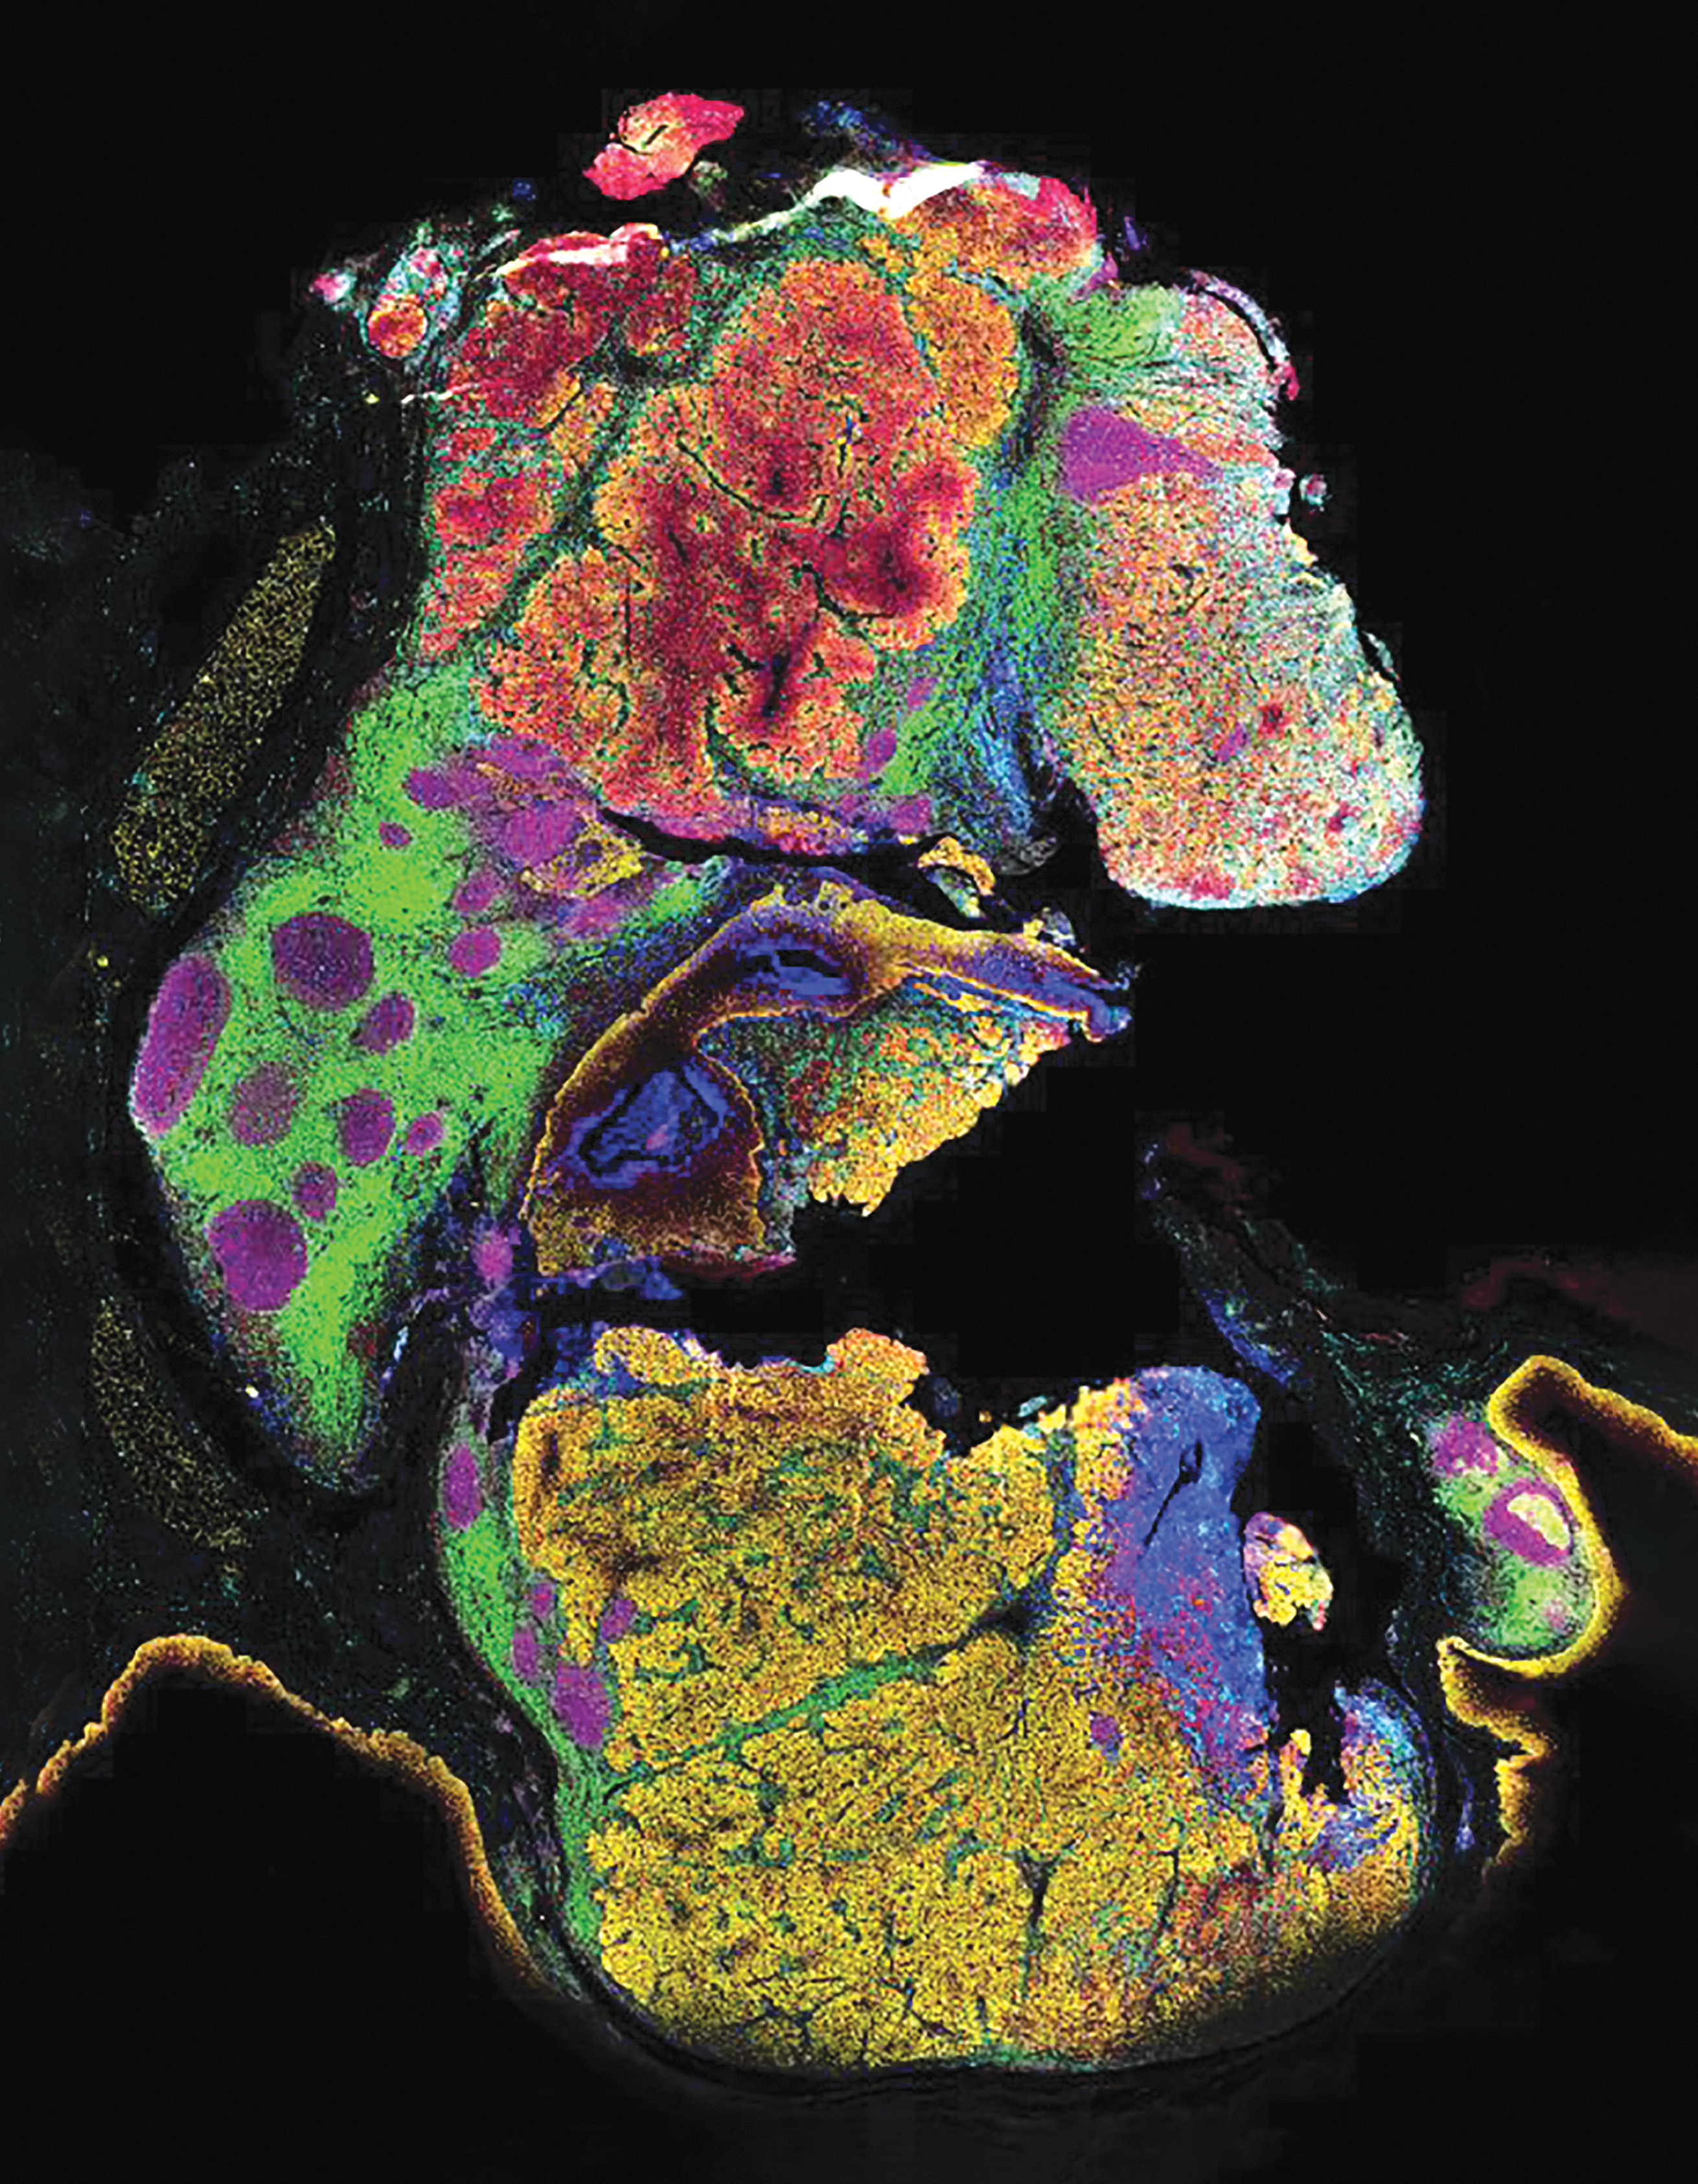
All antibodies were then assembled into an ultra-high plex panel of 101 markers and deployed on a human FFPE tonsil tissue for comprehensive spatial phenotyping and characterization of the tissue microenvironment (Supplementary Fig. S3). Three markers were imaged per cycle with a total of 38 cycles of reporter hybridization, imaging, and de-hybridization to reveal the spatial localization of all 101 proteins across the entire tissue section. A representative image (Fig. 1A) showing epithelia (CD227/MUC1), T cells (CD3e), B cells (CD19), stroma (Vimentin), and blood vessels (CD31) recapitulates regional and cellular tonsillar features such as germinal centers and tonsillar crypts.
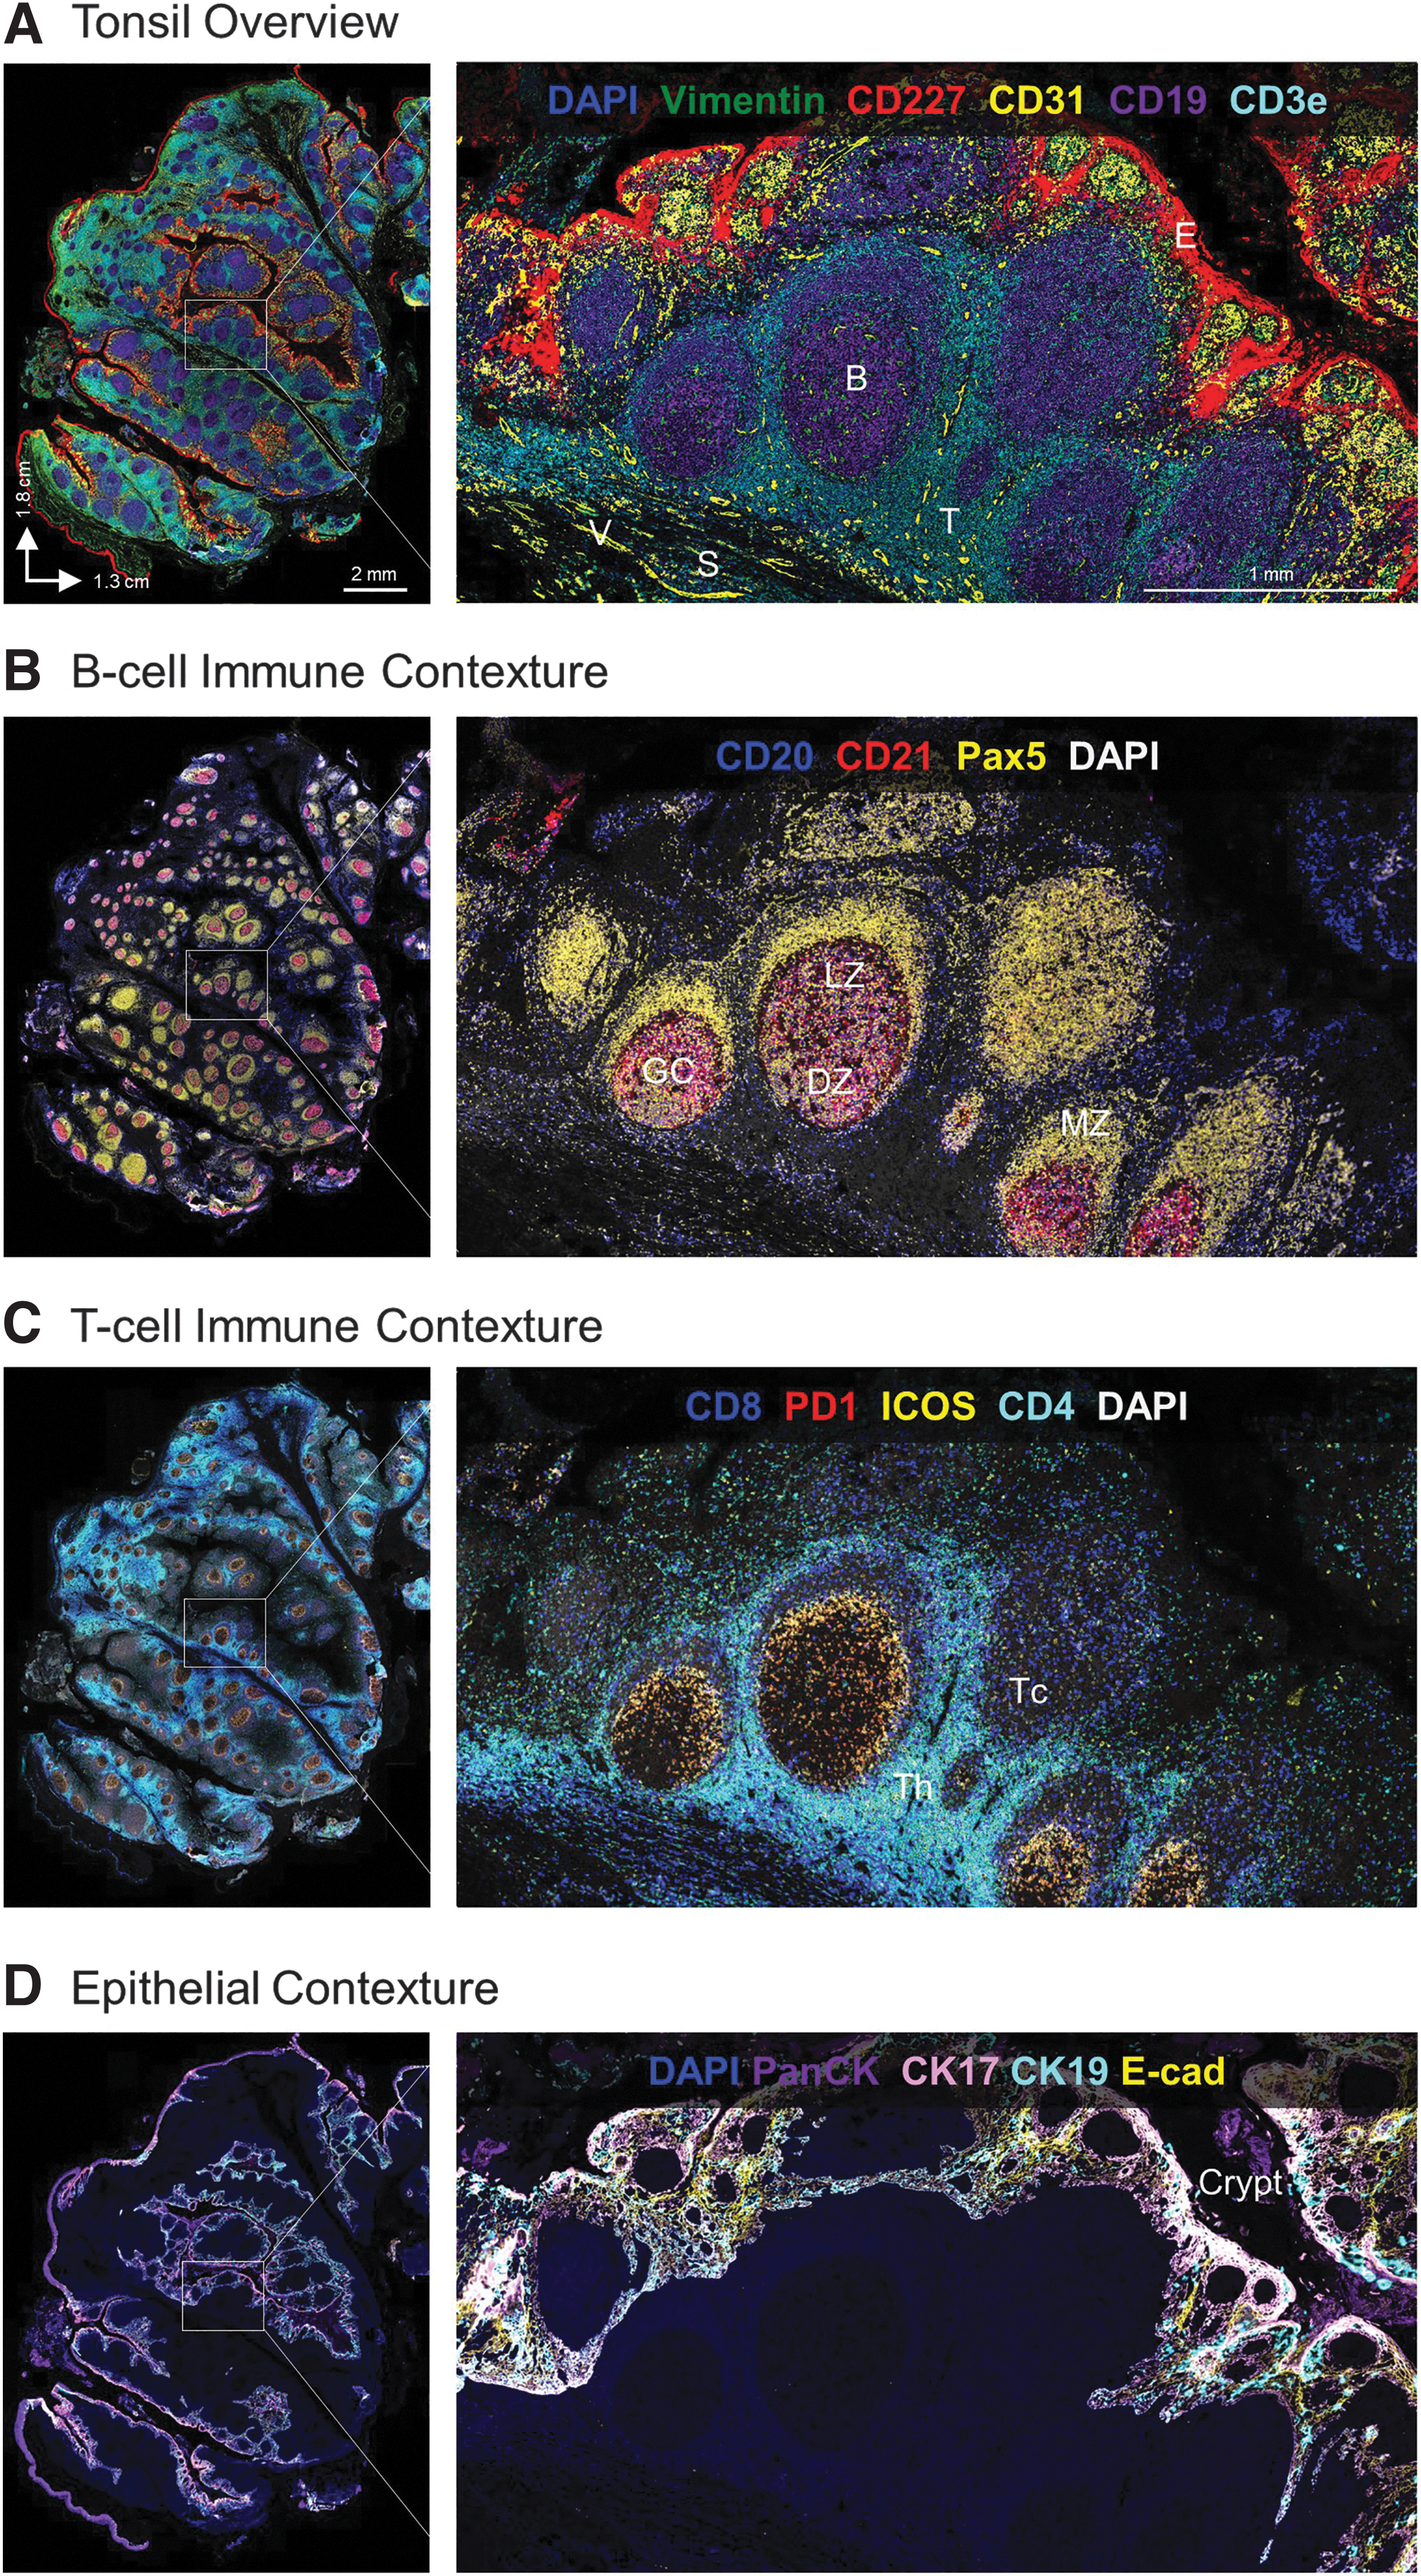
A deeper dive into the spatial biology of the tonsil reveals additional distinct cellular subsets within the tissue microenvironment. First, we examined B cells (CD20+ CD21+ Pax5+ cells), which are responsible for production of antigen-specific immunoglobulins and the humoral arm of the adaptive immune response. Within secondary lymphoid tissues such as tonsil, B lymphocytes aggregate to form distinct lymphoid follicles, which on activation expand to form prominent pale regions called germinal centers.
In response to antigen exposure, rapidly proliferating B cells push primary follicle cells to the periphery, generating a mantle zone around the germinal center. The characteristic microenvironment of the germinal center is visible here in Figure 1B, with densely packed B cells forming the dark zone and a sparsely populated region of B cells forming the light zone along with T follicular helper cells and follicular dendritic cells. 26
T lymphocytes are another critical component of adaptive immunity and are found in T cell rich zones bordering germinal centers where they play an important role in B cell selection and survival. Different subsets of T cells such as CD4+ follicular helper T cells, CD8+ cytotoxic T cells, and FOXP3+ regulatory T cells have unique spatial expression patterns within tonsil in concordance with their functional significance. The complexity of heterogeneous T cell subsets and their regulation by immune checkpoints such as ICOS and PD-1 requires multiplexed analysis of all the relevant markers at single-cell resolution, as shown in Figure 1C.
Apart from immune subsets that comprise the majority of tonsil tissue, the luminal surface is lined by non-keratinizing stratified squamous epithelium. 27 The epithelium (marked by cytokeratins and E-cadherin) (Fig. 1D) invaginates and forms tonsillar crypts in response to antigenic stimulation. The structure of the crypt, lined by alternating patches of reticulated epithelium with lymphoid cells and patches of squamous epithelium, facilitates the initial step of an adaptive immune response; the number of crypts correlates with the extent and reactivity of the lymphoid component.
An interactive dataset (https://dataset.akoyabio.com/PCF-Tonsil100plex/) shows additional layers of information that can be obtained from this tonsil tissue. Collectively, these data confirm the accuracy of our 101-plex panel to capture regional and cellular morphological features of human FFPE tonsil tissue. Moreover, they confirm the possibility of conducting deep characterization of cellular subsets in situ within single specimens.
Combining the acuity of histology with high-parameter single-cell biomarker readouts provides critical insights into the structural and functional complexity of human tissues and the processes that maintain the balance between homeostasis and disease. We next proceeded to systematically analyze these data using an unsupervised bioinformatic single-cell analysis approach.
Unsupervised clustering and regional analysis of ultra-high plex staining data
The single-cell spatial organization of the tonsil tissue was evaluated by conducting an unsupervised analysis of a subset of biomarkers related to the immune system and tissue architecture. To this end, we performed nuclear segmentation with Stardist and unsupervised Leiden clustering of all 2.25 million cells present in the tonsil tissue (see the Materials and Methods section for more details). Thirty-four biomarkers were included in this analysis, including cell lineage markers, immune checkpoints, and structural markers.
As shown in the clustering dendrogram (Fig. 2A) and accompanying t-distributed Stochastic Neighbor Embedding (t-SNE) and Uniform Manifold Approximation and Projection (UMAP) plots (Fig. 2B, C), certain biomarkers—indicative of specific cell types—readily grouped with one another and revealed 11 distinct phenotypic clusters. The cellular identity of each cluster was subsequently assigned based on the expression profiles of the 34 markers in each segmented cell. Monocytes, M2 macrophages, CD8+ T cells, CD4+ T cells, proliferating cells, natural killer cells, dendritic cells, and M1 macrophages were identified as having high expression of CD11b, CD163, CD8, CD4, Ki67, CD57, CD11c, and CD68, respectively.
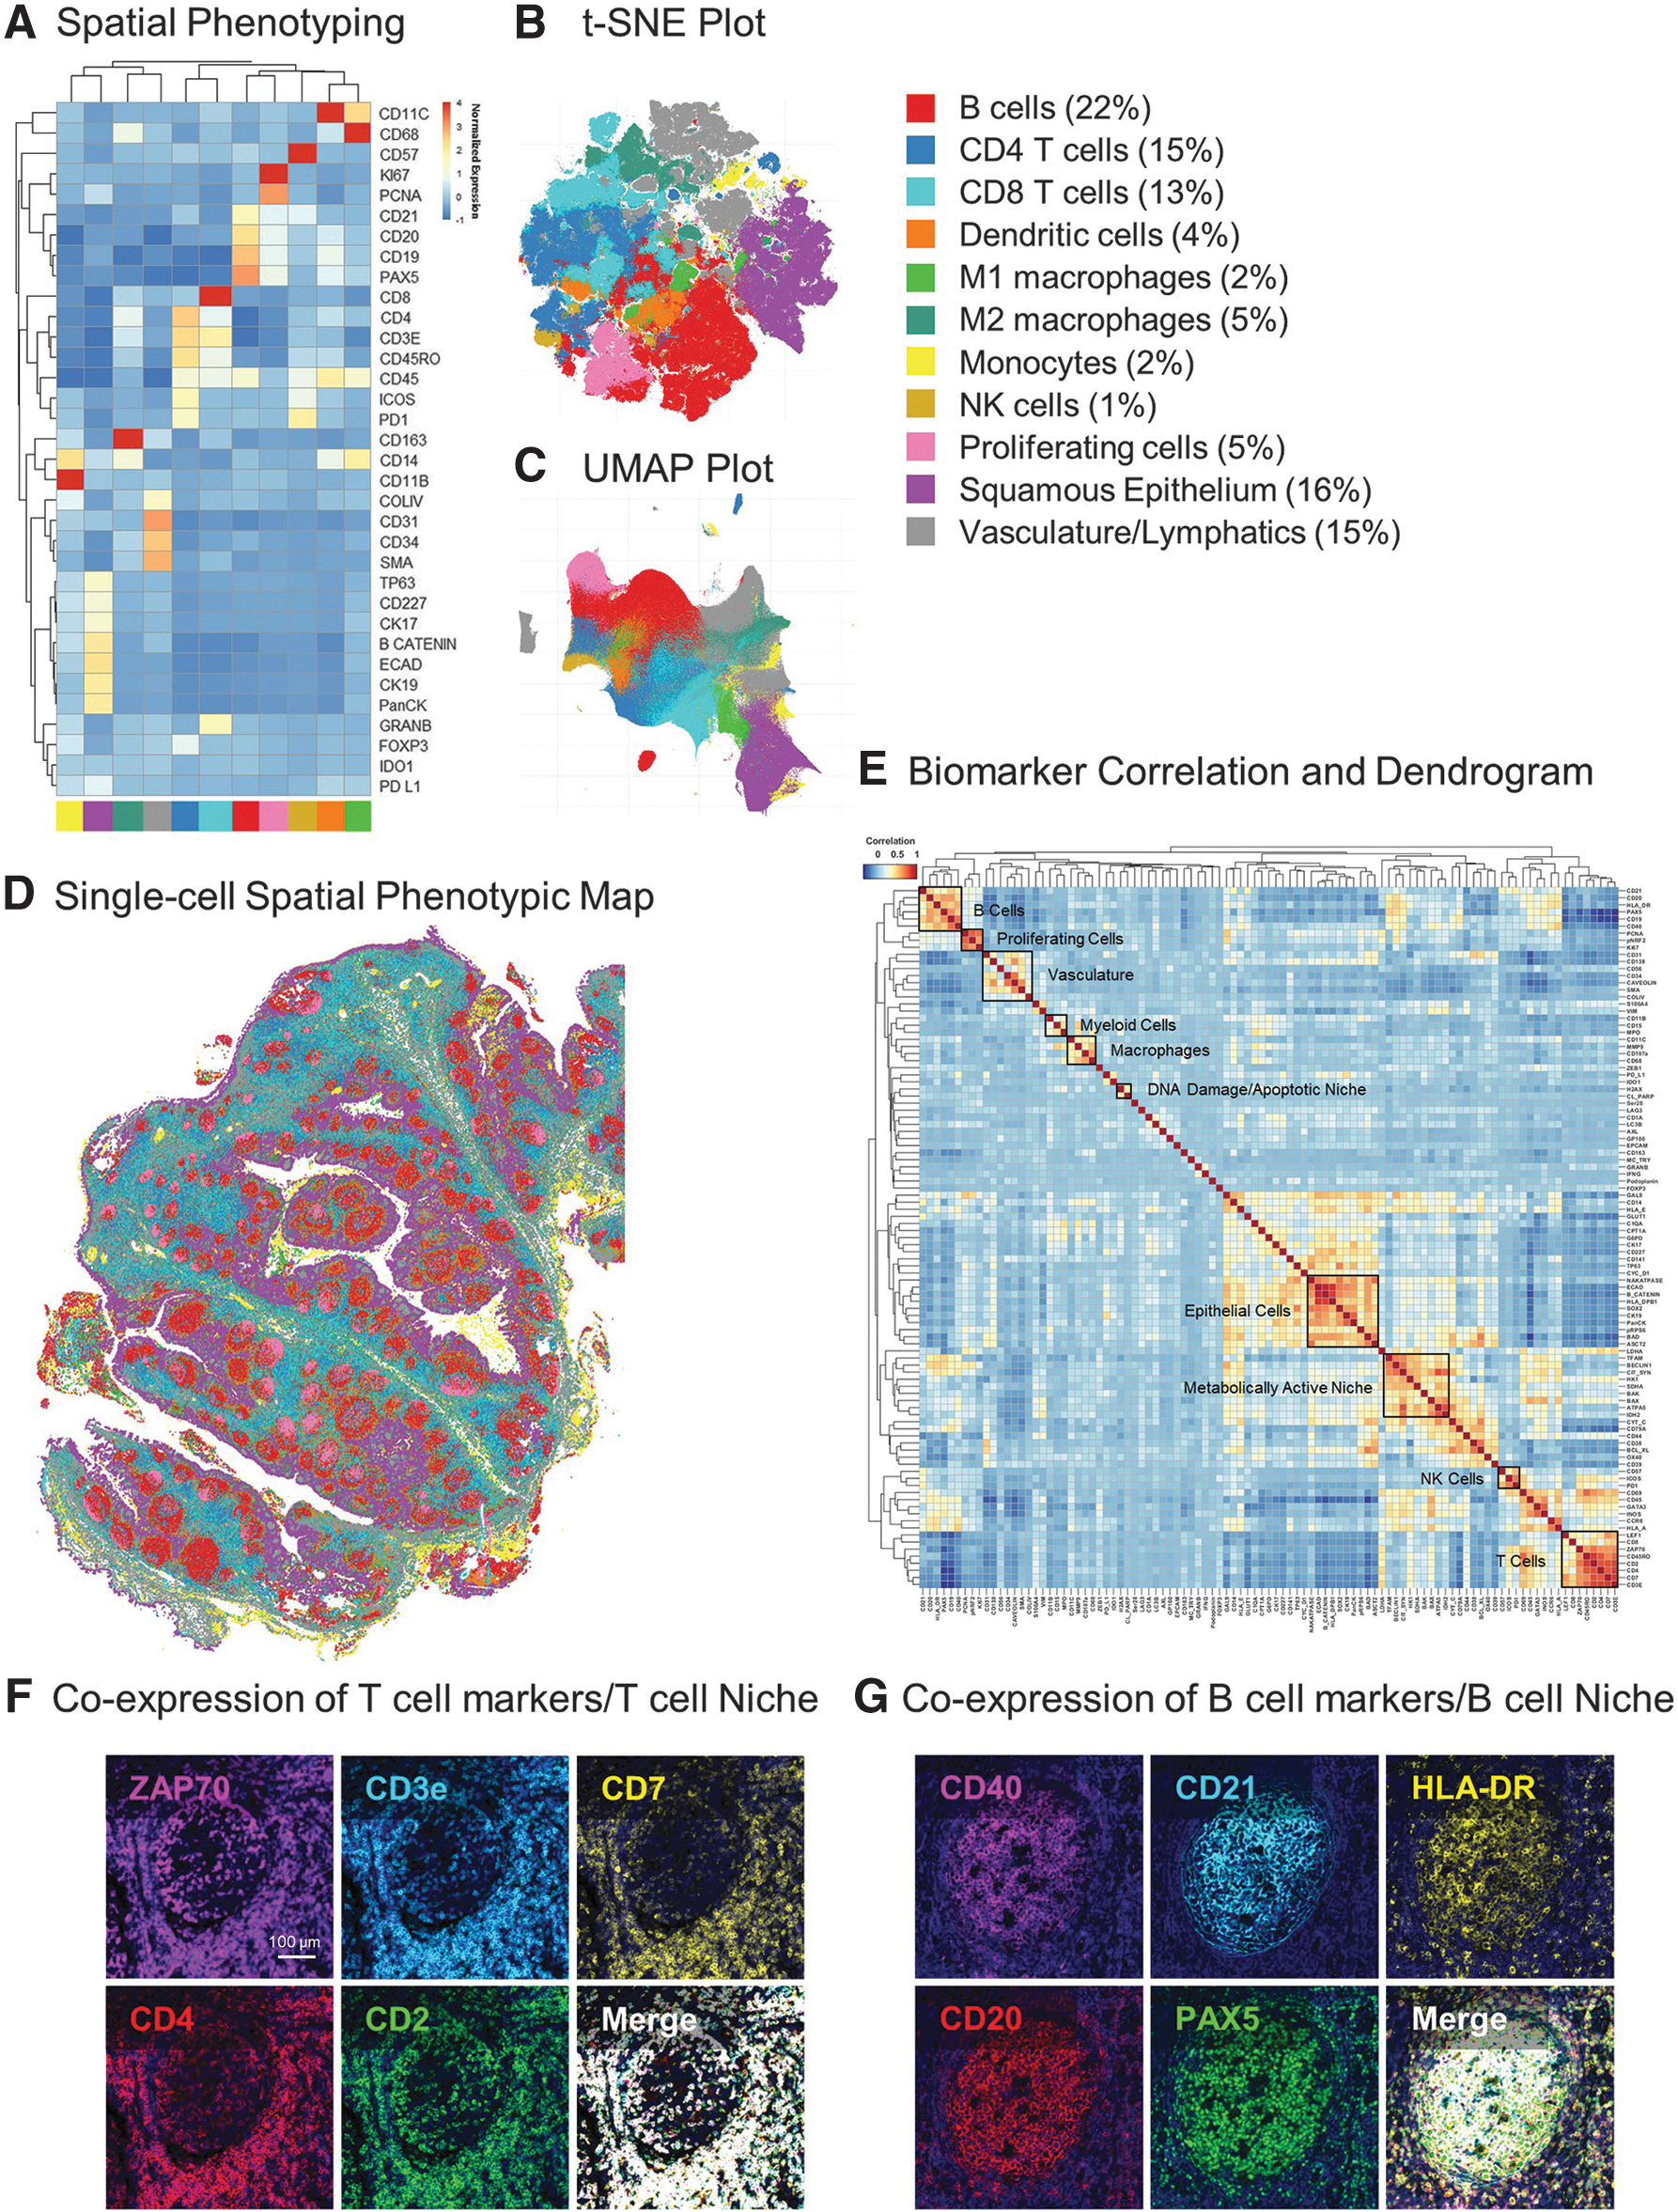
B cells were identified by the expression of cell lineage markers, namely CD19, CD20, CD21, and Pax5, which is involved in B cell development and function. In addition, epithelial (TP63, CD227, CK17, β-catenin, E-cadherin, CK19, and PanCytokeratin) and vascular (Collagen IV, CD31, SMA, CD34) clusters were annotated based on the expression of known markers for each phenotype. The overall abundance and distribution of the 11 phenotypes demonstrates high percentages of B (22%) and T cells (28%), which is consistent with the immune function of tonsil tissue (Fig. 2B, C).
Each phenotyped cell can also be mapped back on to the xy coordinates of the tissue, thereby revealing its spatial coordinates and localization relative to other cells; in this way, we generated a spatial phenotypic map of the cellular organization of the tonsil tissue at single-cell resolution (Fig. 2D).
After targeted spatial phenotyping of tonsil tissue into 11 major phenotypes, we extended our unsupervised clustering to additional markers in the panel. The marker correlation dendrogram in Figure 2E shows correlations between immune, cell lineage, metabolic, proliferation, stress, and structural markers in the panel. Markers that co-expressed in certain cell types grouped adjacent to one another, resulting in distinct expression matrices where related molecules indicated the type and state of a particular cell.
For example, ZAP70, a tyrosine kinase involved in T cell development and lymphocyte activation, was found to colocalize with T cell lineage markers CD3, CD7, CD4, and CD2 in the bottom right corner of the dendrogram (Fig. 2E). This observation could also be confirmed with single-cell resolution anatomical data, as is shown in the co-localization of ZAP70 to T cells in tonsil tissue (Fig. 2F). Similarly, PAX5, a critical transcription factor for the commitment of lymphoid progenitors to the B cell lineage, was highly expressed in CD20+ CD21+ B cells along with CD40 and HLA-DR (Fig. 2E, G).
Epithelial, myeloid, macrophage, and vascular markers were also found to associate together in distinct clusters, thus providing further verification of our panel content. Overall, analysis of the multiplex panel of immune and structural markers in human tonsil tissue revealed 11 distinct cellular phenotypes. These phenotypes can be further expanded upon and classified based on the expression of metabolic, proliferation, and stress markers to get deeper insights into the spatial, cellular, and functional heterogeneity within this tissue.
Spatial immune phenotyping of a human head and neck cancer reveals six distinct cellular neighborhoods
Figure 3A shows the H&E-based pathological annotations for an HNSCC clinical tissue sample from a patient with a partial response (PR) to immunotherapy. The histological examination based on eosinophilic and basophilic affinities revealed valuable morphological information, including a normal tonsil region with germinal centers, esophageal submucosal glands (ESMG) and dense tumor cell proliferation; however, it tells us little about the biological processes that underlie the cancer response and progression.
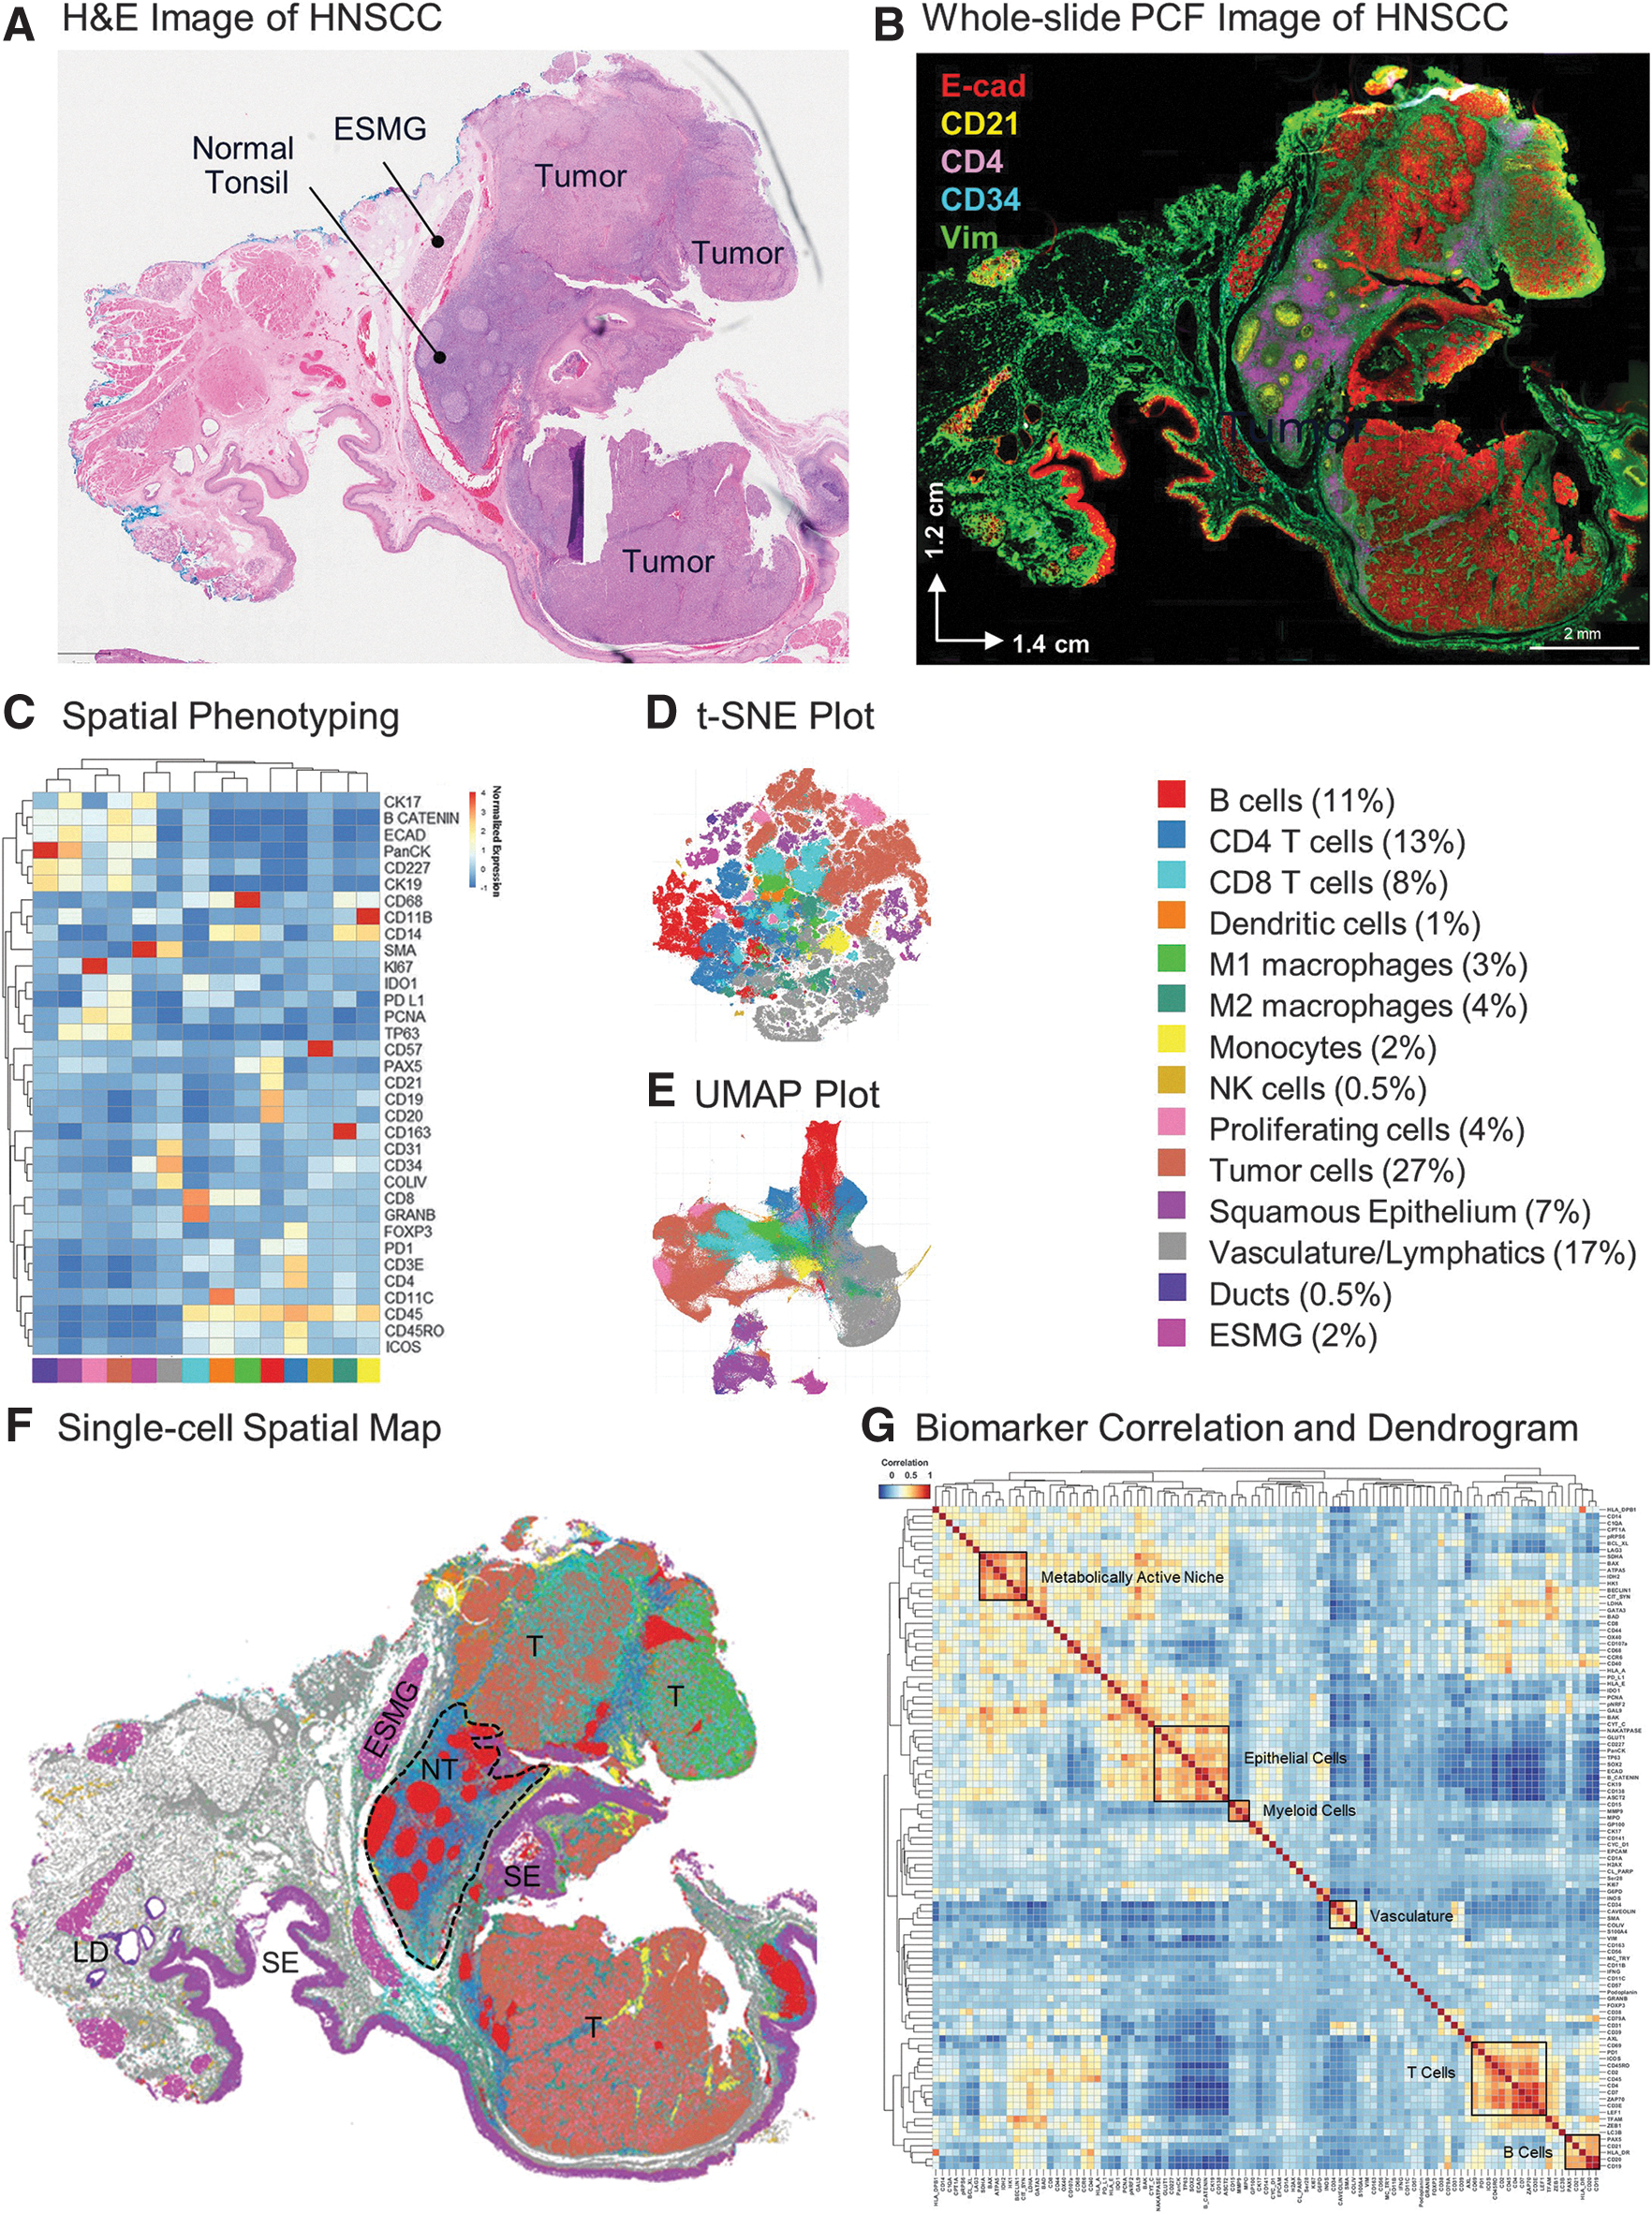
Tumorigenesis is complex and highly dynamic and requires the analysis of several biomarkers to generate a mechanistic understanding. To address this complexity, we applied our 101-plex antibody panel to this HNSCC tissue to analyze key hallmarks of cancer pathogenesis. StarDist segmentation identified 856,676 cells and we analyzed each of these for the expression of 101 protein biomarkers. A representative image (Fig. 3B) showing epithelial (E-cadherin), stromal (Vimentin), vascular (CD34), and immune cells (CD21+ B cells, CD4+ T cells) provides an overview of the tumor landscape.
Unsupervised clustering and spatial phenotyping with 34 immune and structural biomarkers, as was initially done in the tonsil (Fig. 2), allowed us to annotate 14 cell phenotypes, including immune cell subsets, vasculature, ESMG, and lymphatic ducts (Fig. 3C–E). A cluster expressing epithelial markers along with high expression of PD-L1 and PCNA was also found and annotated as tumor cells (Fig. 3C–E). Quantification of cell phenotypes revealed high percentages of tumor cells (27%), vasculature (17%), B cells (11%), CD4+ (13%), and CD8+ T cells (8%) relative to other cell types.
The spatial map (Fig. 3F) shows the single-cell geographical distribution of all 14 cell types and reveals the complex architecture of the tissue sample, which included large tumor regions (annotated T in Fig. 3F) as well as a relatively normal lymphoid region containing tonsillar germinal centers (NT in Fig. 3F). The marker correlation dendrogram in Figure 3G includes the full clustering analysis of biomarkers in our panel.
The correlation heatmaps depicted in Figures 2E and 3G illustrate the similarity between markers, as determined by pairwise correlation coefficients computed across all cells within the tissue. These heatmaps already reveal discernible marker clusters associated with specific cell types before any manual annotations, offering an initial insight into the presence of different cell types shown in Figures 2A and 3C. Similar patterns as in the tonsil tissue emerged with the HNSCC sample, with distinct matrices related to epithelial, vascular, and immune subsets. A plethora of additional correlations highlight the complexity of the tumor biology and warrant further investigation beyond the scope of this manuscript.
Tissues are organized into complex cellular neighborhoods (CNs) that orchestrate biological processes involved in maintaining tissue homeostasis in health and disease.7,8 Crucially, CNs can be identified by unsupervised bioinformatic analyses and thus provide an unbiased regional breakdown of a tissue's structure-function relationship. Our CN analysis of the 14 cellular phenotypes described earlier revealed six unique CNs, including CN1 enriched in tumor cells (78%); CN2 enriched in vasculature and lymphatics (81%); CN3 with an abundance of CD4+ T cells (63%); CN4, which consisted almost exclusively of B cells (87%); CN5 with a mixture of CD4+ T cells (11%), CD8+ T cells (17%), macrophages (17%), and tumor cells (12%); as well as CN6 consisting mainly of normal squamous epithelia (91%) (Fig. 4A, B).
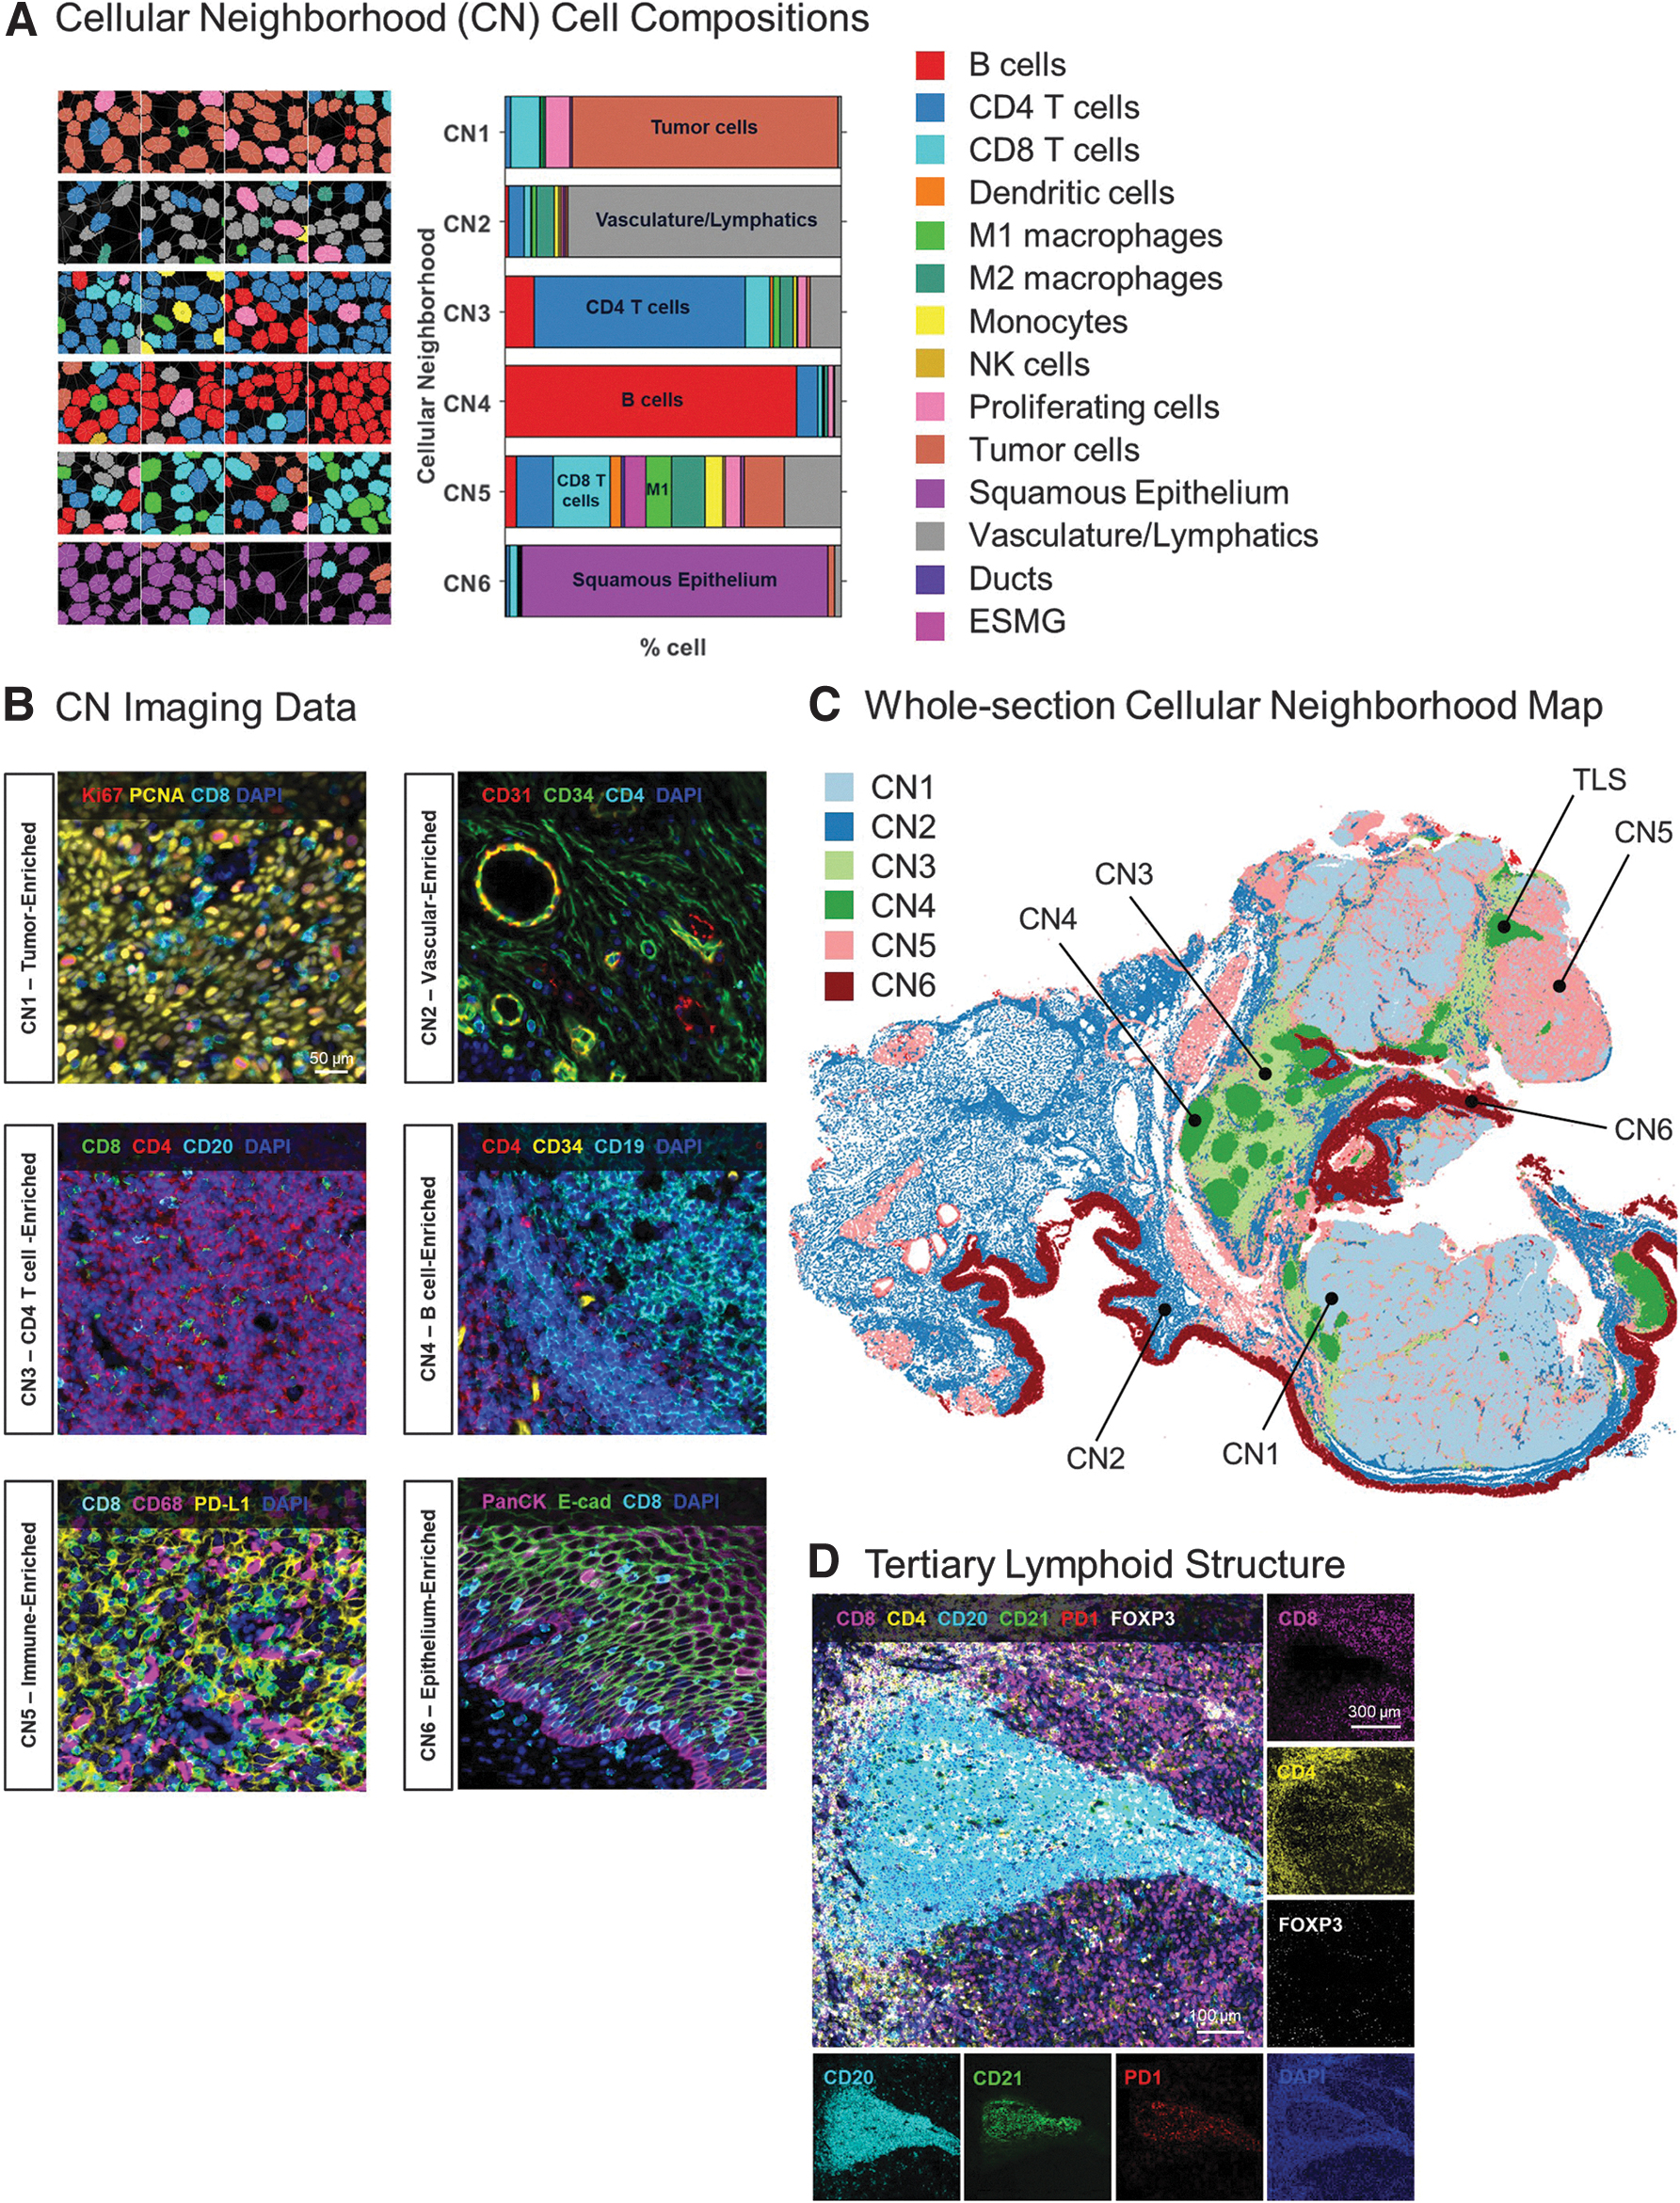
The spatial distribution of the CNs across the whole tissue section is shown in Figure 4C and corroborates well with the anatomical and cell phenotyping data shown in Figure 3. For example, CN3 and CN4 consist mainly of CD4+ T cells and B cells, respectively, and represent the regional morphology of healthy tonsil tissue, consistent with known tonsillar morphology. Interestingly, several small CN4 regions are also located within the tumor tissues and likely representative of tertiary lymphoid structures (TLSs) with CD20+CD21+ B cells surrounded by CD8+ cytotoxic T cells, CD4+ helper T cells, and FOXP3+ regulatory T cells (see TLS in Fig. 4C, D).
Another neighborhood, CN5 contains a sizeable population of CD8+ T cells and macrophages (see plot in Fig. 4A–C), which is consistent with the visible infiltration of M1 macrophages (green) and CD8+ T cells (cyan) seen in the single-cell phenotyping map (Fig. 3F). Overall, this result demonstrates the acuity of unsupervised CN analyses for obtaining objective compositional analyses of complex tissue samples.
Moving beyond the immune contexture: functional metabolic phenotyping of the head and neck cancer sample reveals additional degrees of intra-tumor heterogeneity
CNs have gained momentum as a potential prognostic biomarker to stratify immunotherapy responsiveness.7,8 However, evaluation of spatial biomarkers beyond the immune microenvironment has not been investigated in depth. We thus explored the spatial biology of metabolic, proliferation, and stress pathways across the HNSCC tumor to elucidate the functional underpinnings of tumor heterogeneity in greater detail.
Historically, mass spectrometry-based approaches for direct quantification of metabolites or extracellular flux analysis for the determination of oxygen consumption rates as a measure of glycolytic and mitochondrial respiration have been applied to study tissue metabolism.
However, these bulk assays lack single-cell, spatial context and a recent study demonstrated a new antibody-based proteomic method called single-cell metabolic regulome profiling (scMEP) as a valuable alternative for analysis of cellular metabolic states. 28 The scMEP data showed strong correlation with metabolic flux and activity measured via traditional orthogonal assays.
Using a similar approach to scMEP and the analytical logic described in tonsil tissue, we targeted our clustering analyses on 23 markers involved in metabolism, invasion, apoptosis, cell cycle, proliferation, and survival (Supplementary Fig. S3). Clustering based on these biomarkers allowed us to affirmatively annotate 14 unique functional cell phenotypes (Fig. 5A–C).
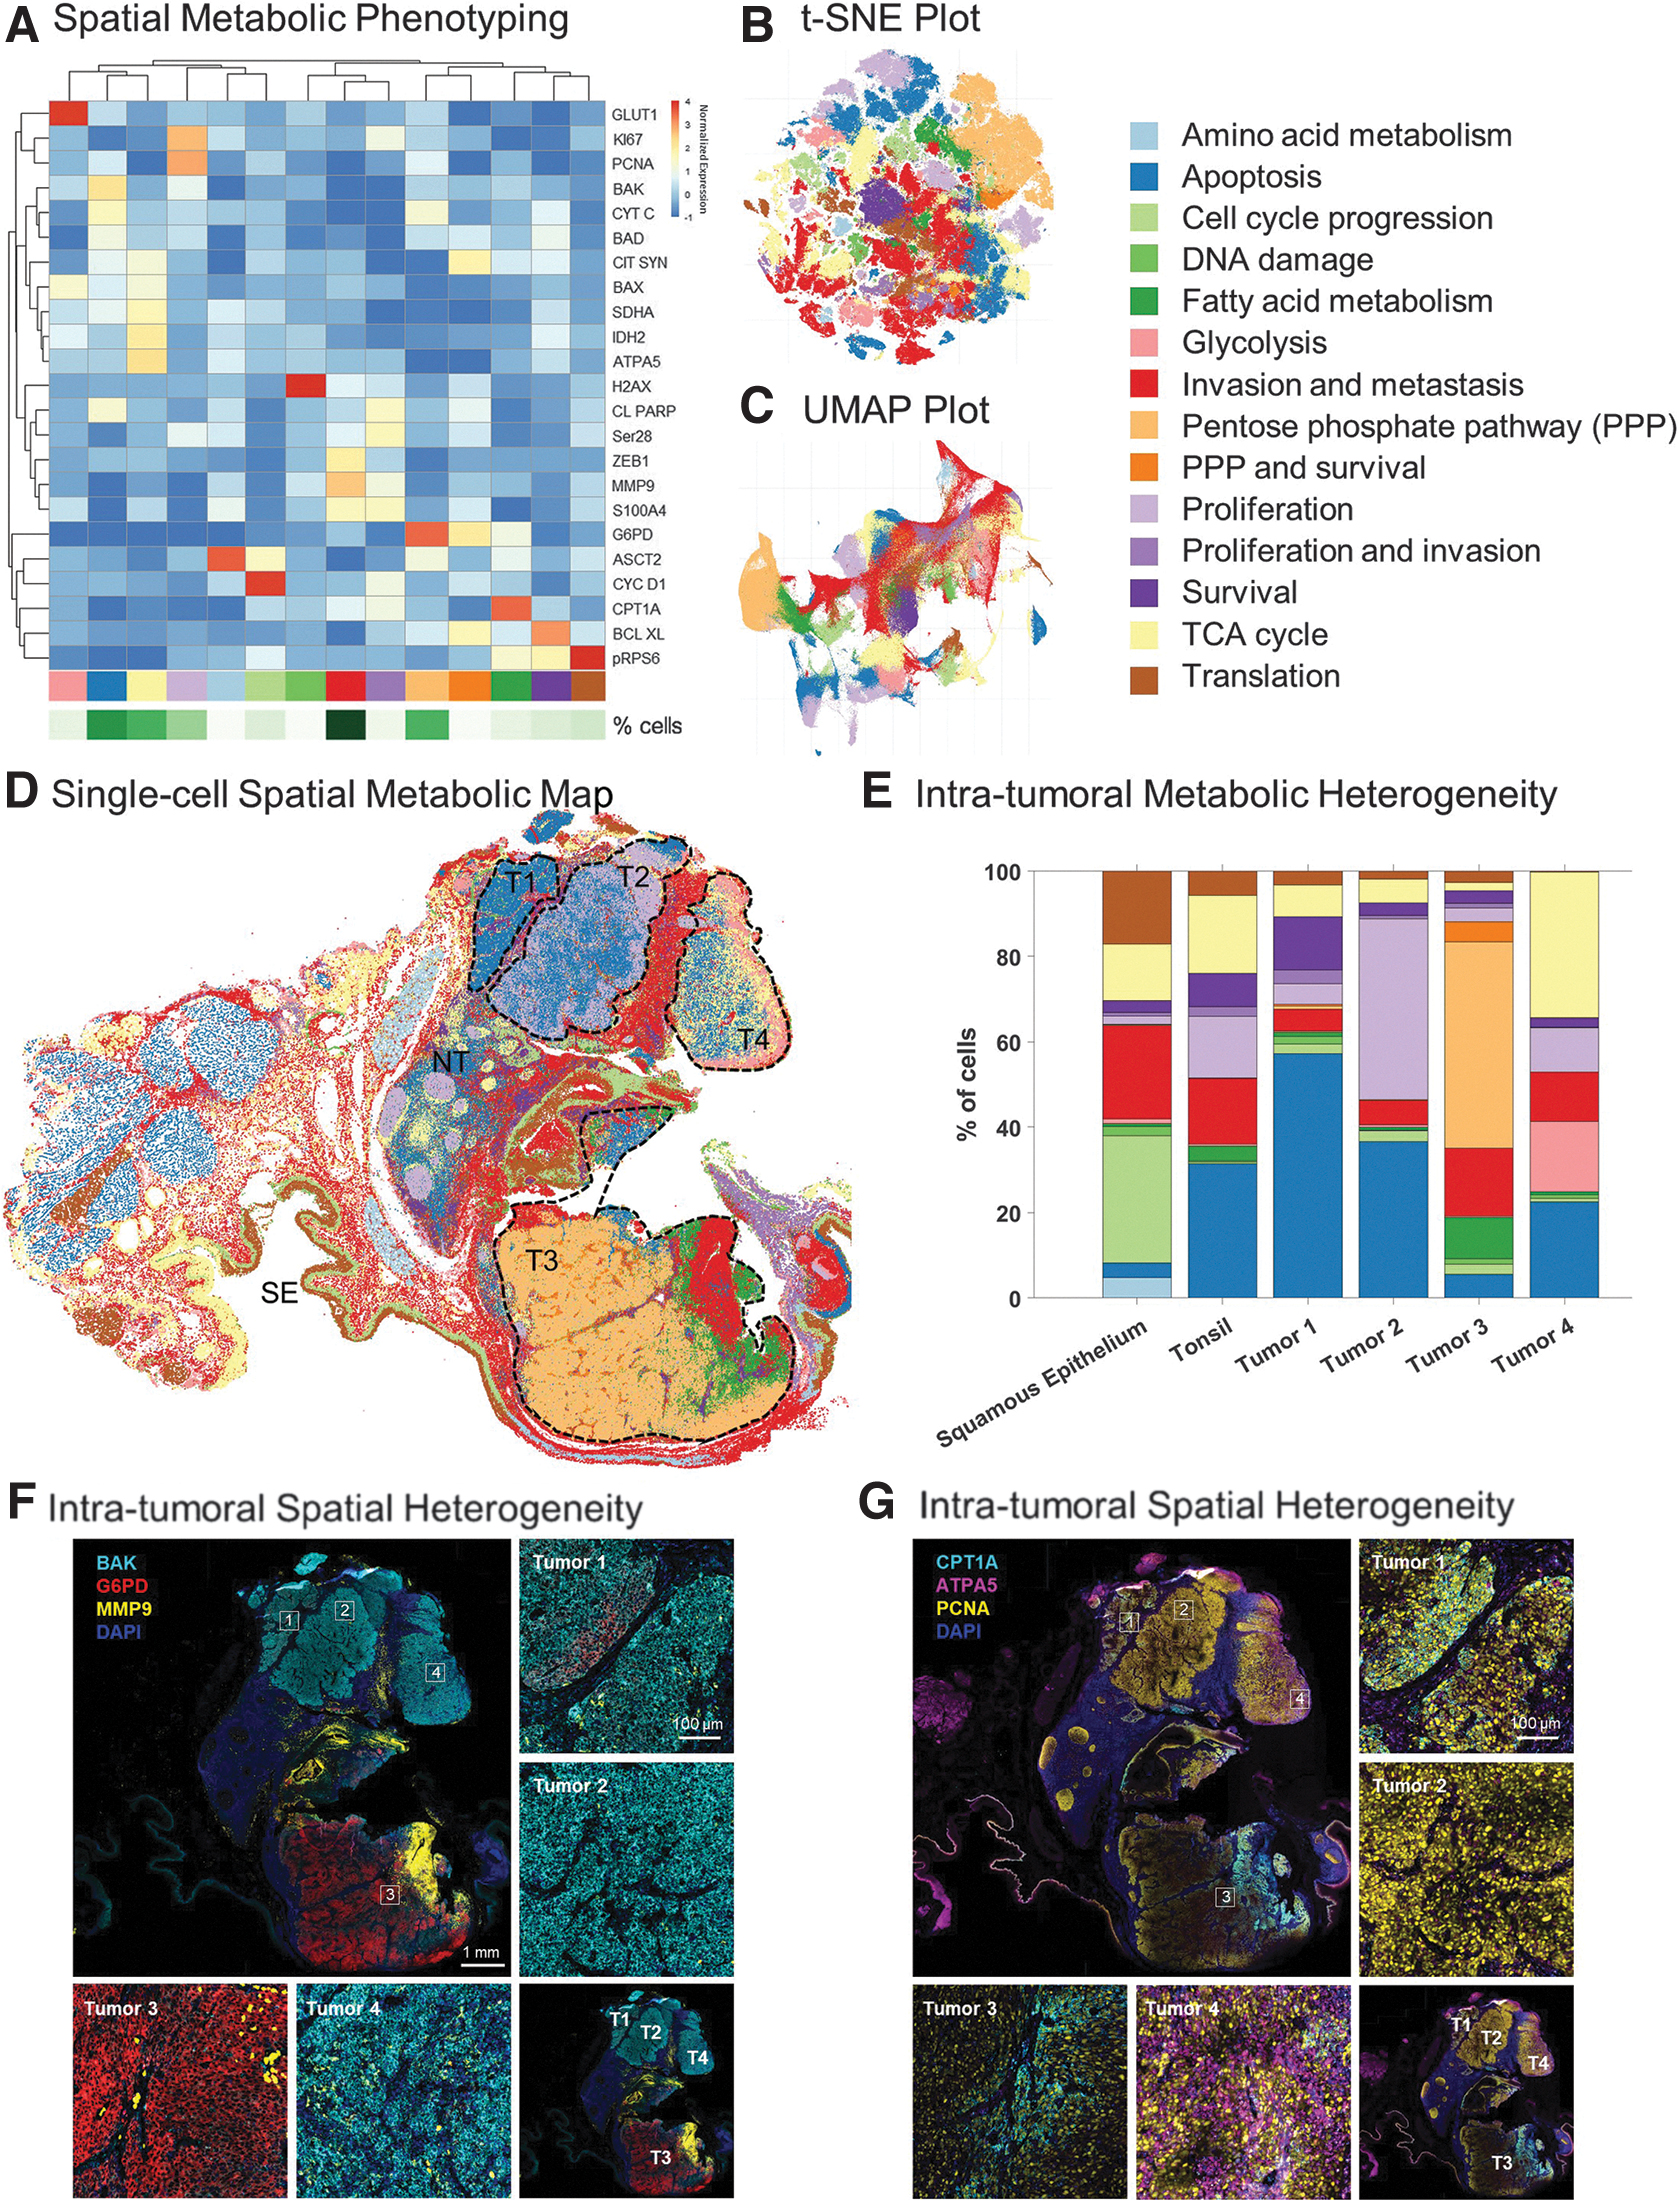
The spatial map (Fig. 5D) resulting from this analysis revealed added complexity and heterogeneity when compared with the neighborhood map obtained based on our analysis of immune markers only (compare Figs. 4C vs. 5D). Thus, while spatial phenotyping and CN analysis based on immune and structural markers revealed six CNs within the tissue sample (Fig. 4A–C), our analysis of metabolic and functional phenotypes revealed a more nuanced functional profiling across all cellular substrates that are contained within the sample (Fig. 5D, E).
Based on histological examination of the tissue, expression of epithelial markers, and spatial metabolic phenotyping, we, therefore, estimated that the tumor mass consists of four distinct regions. Tumor regions 1, 2, and 4 showed signs of apoptosis based on relatively higher expression of BAK, a pro-apoptotic regulator (Fig. 5F); all three regions were separated from one another by a distinct margin of immune and invasive cells (Figs. 3F and 5D).
Tumor region 2 also showed unique spatial features with a central core of apoptotic cells surrounded by a rim of proliferating cells (Fig. 5D). On the other hand, Tumor region 3 showed high levels of invasion as seen by higher expression of Glucose-6-Phosphate Dehydrogenase (G6PD) and MMP9 (Fig. 5D, F). G6PD is an enzyme involved in the pentose phosphate pathway and reported to be a mediator of clinical resistance.29,30 Together with carnitine palmitoyltransferase 1A, a rate-limiting enzyme in fatty acid metabolism implicated in metabolic reprogramming for cancer pathogenesis, 31 our data in Figure 5D, F suggest that Tumor region 3 represents a more active tumor phenotype, one that is actively involved in tumor promotion and metastasis relative to the rest of the tumor mass. In addition, elevated expression of ATPA5, an ATP synthase, in Tumor region 4 (Fig. 5G) along with pro-apoptotic and immune markers, suggests that this region is primed with the energy requirements for apoptosis and immune activation.
In a final analysis, we revisited the distribution of immune-related cell phenotypes (Fig. 3C) within the four metabolically distinct tumor regions identified above. Since this sample also contained a small region with intact tonsil architecture, it allowed us to compare the cellular distributions in the normal tonsillar region of the tissue versus the deviation that occurs with tumorigenesis. The normal tonsil region had predominantly B cells (36%), T cells (41%), and vasculature (16%) (Fig. 6A). In contrast, the tumor regions had a high abundance of proliferating tumor cells (25% to 63%) with relatively few B cells.
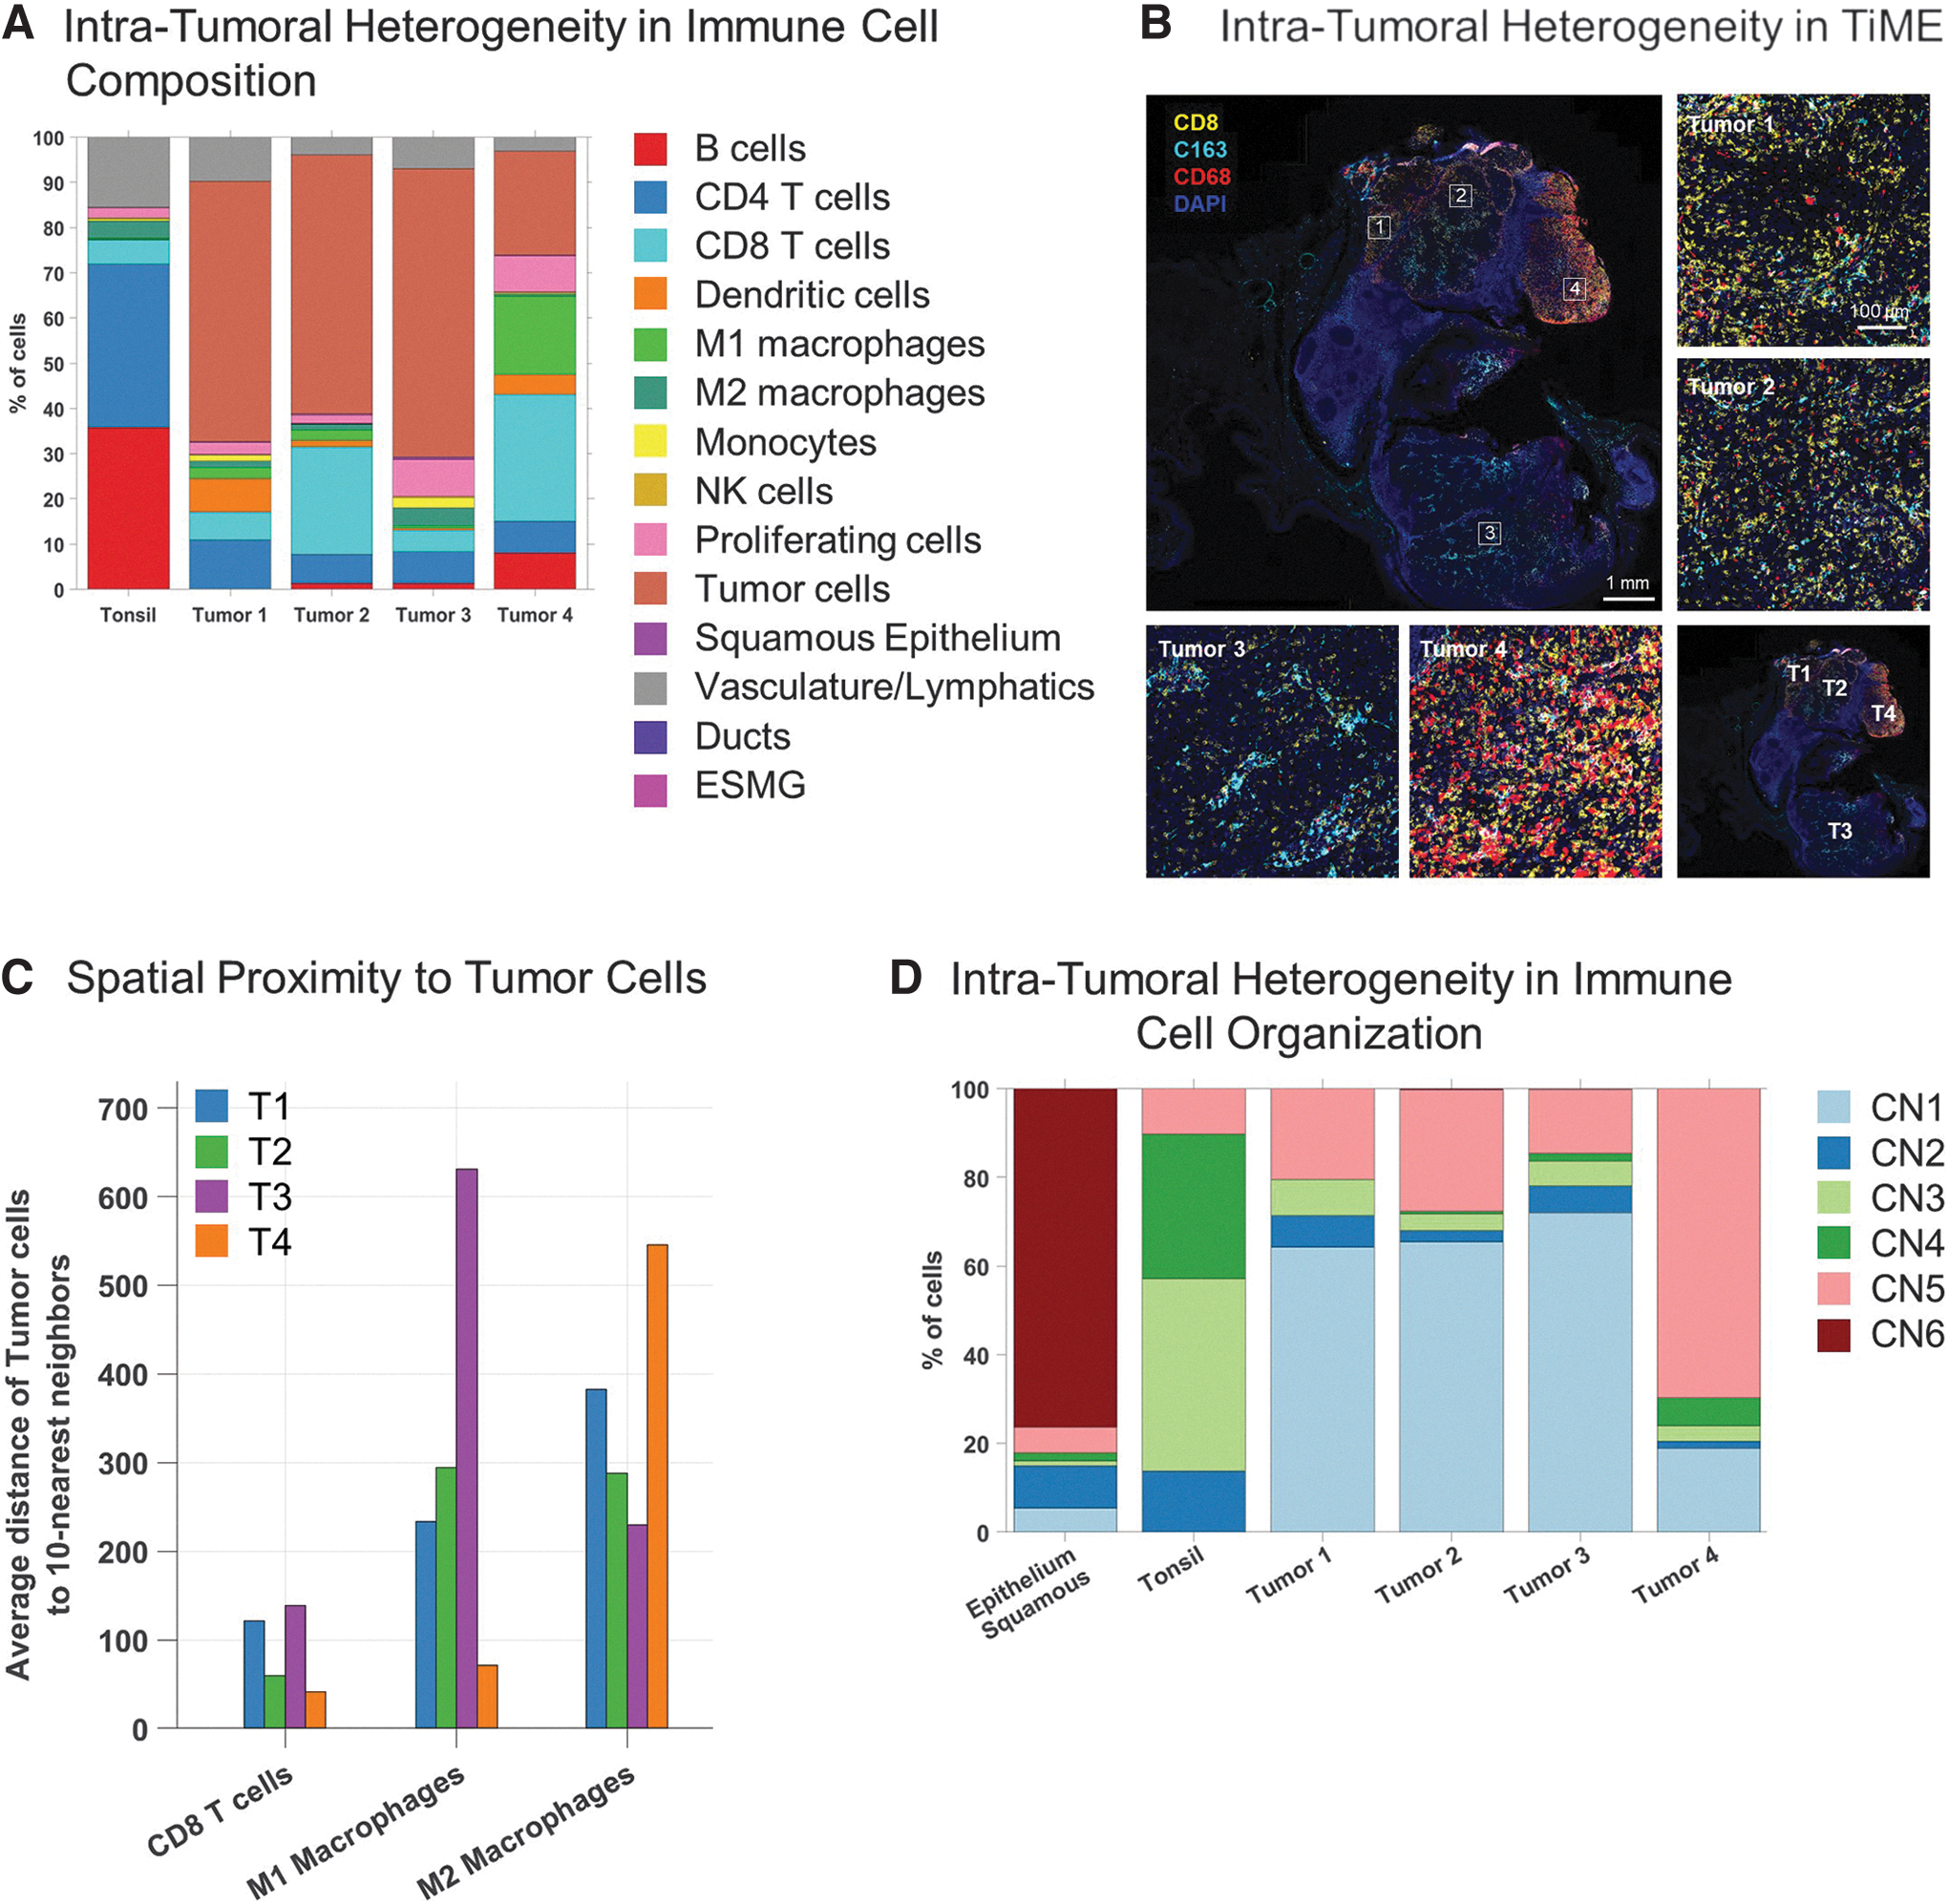
Interestingly, Tumor region 4 had a large B cell cluster, which displayed multiple morphological features that are indicative of TLSs (Fig. 4D). Tumor region 4 also showed high levels of CD68+ M1 macrophages (18%) and CD8+ T (28%) cells, suggesting high anti-tumor immune activity in this region (Fig. 6A). Tumor region 3, on the other hand, had higher levels of CD163+ M2 tumor-associated macrophages (3%) relative to M1 macrophages (0.4%; Fig. 6B).
Spatial proximity analyses of the four distinct tumor regions further revealed that M1 macrophages were found to be closely associated with tumor cells in Tumor region 4 whereas M2 macrophages were found to be farther away (Fig. 6C). This trend is reversed with a closer association of M2 macrophages relative to M1 macrophages with tumor cells in Tumor region 3. These results further highlight the importance of single-cell spatial phenotyping and analyzing cellular interactions within the context of the tissue architecture to understand the complex nuances of the TME.
Lastly, we re-analyzed the abundance of CNs within the four tumor regions versus adjacent healthy tonsil. The distribution of the CNs within the four tumor regions revealed differences in spatial organization of immune-centric cells at a macro level (Fig. 6D). A higher percentage of CN5 (mixed immune neighborhood) (69%) was observed in Tumor region 4 relative to the other three tumor regions (T1—20%, T2—28% and T3—15%).
Tumor region 4 also had a lower overall tumor burden with lower levels of CN1 (tumor-rich neighborhood; 18%) compared with Tumors 1 (63%), 2 (65%), and 3 (72%). The degree of intra-tumoral heterogeneity within this tissue section was also apparent by differences in the levels of CN3 (CD4-rich neighborhood) between the four tumor regions, with Tumor region 1 having a slightly higher percentage of CN3 (8%) compared with the other three regions (T2—3%, T3—6%, and T4—2.5%).
Overall, these data amount to a uniquely comprehensive account of the structural and functional topography of an HNSCC tissue sample. In doing so, our data highlight the potential utility of in-depth analysis of spatial phenotyping as a tool for clinical discoveries.
Discussion
HNSCCs remain an ongoing global challenge to public health. 1 Despite the approval of immunotherapies to treat metastatic and recurrent HNSCC, the overall survival rate remains low, partially due to heterogenous TMEs and plasticity of the HNSCC tumor immune landscape. 3 With molecular classification of HNSCC tumors and integrated genomic and epigenetics data from TCGA, new insights into the molecular and genetic landscape of HNSCC have now emerged.32,33
However, these studies lack spatial context and/or an evaluation of the tumor immune microenvironment at the functional level. Understanding the spatial context of the TME as well as key hallmarks of HNSCC pathogenesis, progression, and resistance will be a critical next step toward elucidating the complex tumor biology and mechanistic principles that underlie differential clinical outcomes.
Decoding HNSCC tumor biology: toward a holistic view of HNSCC tumor biology
Unsupervised spatial phenotyping of a patient's HNSCC sample allowed us to reconstruct the patient's tumor immune microenvironment with unprecedented detail. Starting with the identification of a dozen immune-related cell phenotypes throughout the tissue (Fig. 3F) to unsupervised classification of immune cell neighborhoods (Fig. 4C), our analysis provided a detailed spatial topography of the tissue.
Differences in immune infiltration across the tissue were immediately evident along with the presence of TLS (Fig. 4C, D). All of these findings relate to immunotherapy outcomes and hence harbor analytical value. For example, TLSs are a type of CN comprising a distinct organization of B cells, T cells, dendritic cells, and high endothelial venules.34,35 TLS have been reported to play a role in the anti-tumor response across multiple cancer types.36–39
The presence of TLS in most cases is associated with better prognosis, and, hence, they have emerged as a valuable predictor of response to immune checkpoint inhibitor therapy.38–41 The presence of the TLS, in the HNSCC tumor described here, in a region marked by infiltration of CD8+ and CD4+ T cells points to an immunologically active microenvironment in the top right of the tissue (Fig. 4C, D). Understanding the spatial organization and composition of TLS in the microenvironment of HNSCC, including the formation and dynamics of TLS through disease progression and treatment, will be important to understand more about the role of these structures in anti-tumor responses.
Many additional biological processes beyond the tumor immune microenvironment affect tumor progression and treatment responses. For example, deregulation of cellular energetics and metabolic reprogramming is a key hallmark of cancer. Although most studies focus on mass spectrometry or extracellular flux analysis for quantification of cellular metabolites, these studies lack single-cell resolution and spatial information.
A single-cell spatial metabolic profiling study of cytotoxic T cells in colorectal cancer specimens identified cells in unique tumor-specific metabolic states associated with distinct immune phenotypes and demonstrated the power of combining metabolic analysis with spatial resolution. 28 Leveraging expression data from 23 proteins involved in critical metabolic and stress pathways in tumors, we developed a spatial map of key cancer metabolism targets illustrating the predominant functional pathways in the HNSCC tumor.
Functional mapping across every cell within the entire tissue section led to deeper stratification and identification of distinct regions in the tumor with unique metabolic and stress profiles. Tumor regions 2 and 4, with high immune cell infiltration based on spatial immune phenotyping (Figs. 3F and 6A), also showed high expression of apoptotic markers (Fig. 5D–F), suggesting an active anti-tumor immune response in this region.
On the other hand, within the same tumor, Tumor region 3 with densely packed tumor cells had high expression of markers for DNA damage (pH2AX), invasion (MMP9), and pentose phosphate pathway (G6PD). Overexpression of G6PD has been reported in several cancers and is believed to mediate protection against oxidative stress.42,43 Moreover, increased levels of G6PD are associated with resistance and poor prognosis in the clinic.
Our data reveal the high degree of intra-tumoral heterogeneity with pro-tumorigenic and anti-tumor immunologically active regions in the same tissue. Combining phenotypic lineage information with metabolic and stress markers provides information (Supplementary Fig. S4A, B) on the key functional determinants of specific immune subsets and tumor cells.
Applying this spatial analysis framework to pretreatment HNSCC samples with clinical endpoints according to the RECIST 1.1 guidelines can aid in understanding the dynamic and evolving TMEs that contribute to response to immunotherapies. In our earlier investigation, we unveiled the intra-tumoral heterogeneity in HNSCC by examining preliminary data pertaining to the relative abundance of distinct cell types within tissue samples from four patients with complete response (CR), partial response (PR), stable disease (SD), or progressive disease (PD). 44
The cell phenotype distributions (Supplementary Fig. S5A, B) reveal the heterogeneity in composition and organization of the TME across these four cases. Additionally, spatial distribution of the metabolic markers (Supplementary Fig. S5C–F) illustrates the differences in the functional landscape of the disease. Linking the cell phenotype data with the metabolic expression patterns highlights the differential metabolic signatures within tumor cells and immune subsets, reflecting variations in the functional states of distinct cellular phenotypes (Supplementary Fig. S6A–D).
CD4+ and CD8+ T cells had higher expression of key tricarboxylic acid enzymes (ATPA5, SDHA, IDH2, and Citrate synthase) in samples from patients with complete (Supplementary Fig. S6A) and partial (Supplementary Fig. S6D) response relative to T cells in cases with stable (Supplementary Fig. S6B) and progressive (Supplementary Fig. S6C) disease.
While our data provide unique insights into metabolic regulation in HNSCC, orthogonal validation with direct measurements of metabolite abundance and pathway activity via mass spectrometry will be critical to further corroborate these findings. In addition, larger sample sizes and the utilization of machine-learning techniques, as demonstrated in pivotal spatial studies, 44 will be valuable for future research aimed at distinguishing key markers of response and resistance. Finally, mechanistic studies using knockdown models will be critical to validate the results for translational significance.
Spatial biomarkers and their translational relevance
H&E staining is routinely used in clinical practice to diagnose and classify cancers.45,46 The H&E-based pathological assessment of the HNSCC tissue sample studied here revealed a normal tonsil region and a large tumor (Fig. 3A). While histological examination of tissues based on eosinophilic and basophilic affinities of tissue structures can reveal valuable morphological information, they are limited in biomarker depth and do little to inform us about cellular phenotypes or functions.
In contrast, the data that we have obtained via antibody-based spatial phenotyping to detect protein expression and localization show a far greater depth of information than what is available via H&E staining, and they enable the exciting possibility of generating a holistic view of the TME and key cancer hallmarks in situ at single-cell resolution.
Indeed, several recent studies have highlighted the value of highly multiplexed spatial phenotyping of the tumor immune microenvironment for stratification of responses to immunotherapy. A study in colorectal cancer, for example, introduced a novel analysis paradigm—CN analysis—to analyze the organizational patterns of distinct immune cell types in the tumor. 8
Applying a 56-plex antibody panel across a cohort of advanced colorectal cancer tissues, the study revealed the correlation between clinical outcomes and distinct organizational patterns, including neighborhoods enriched for TLSs, T cells, macrophages, and granulocytes. In a similar retrospective study on cutaneous T cell lymphoma, researchers sought to identify differences in responsive and non-responsive cohorts following treatment with pembrolizumab. 7
Single-plex IHC studies for CD4, PD-1, PD-L1, and FOXP3 revealed no significant differences between the two groups, neither did an analysis of the tumor mutational burden. However, with a 55-plex CODEX panel, the authors found a higher frequency of CD4+ immune-activated CNs in responders versus non-responders. These findings were accompanied by significantly higher levels of Treg-enriched immune-suppressed CNs in the non-responding cohort before and after pembrolizumab treatment.
Thus, in contrast to several well-established clinical diagnostic biomarkers that failed to reveal a difference between responding and non-responding patients, CNs represent a new class of spatial biomarkers that harbor the possibility to better stratify immunotherapy patient cohorts. These types of findings emphasize the translational impact of high-plex biomarker discoveries to derive predictive signatures of clinical relevance.
Challenges and future directions
An ongoing challenge to the widespread deployment of high-plex spatial phenotyping technologies is the tradeoff between imaging resolution limits, biomarker plex level, and data collection speed. The PhenoCycler-Fusion technology combines high speed imaging with ultrahigh-plexing capability using oligo-conjugated antibodies to acquire whole-slide, single-cell proteomic data. Traditional immunofluorescence studies are limited by the number and availability of different species of primary antibodies along with the need for stripping or other harsh conditions to achieve higher plexing.
However, the PhenoCycler chemistry utilizing the conjugation of antibodies with unique barcodes and subsequent gentle isothermal reactions with complementary reporter dyes enables detection of hundreds of protein targets in the same section without compromising tissue integrity. This is critical in spatial studies where the preservation of tissue architecture is crucial to understanding the regional differences and interactions at the cellular level.
Developing ultrahigh-plex panels, however, requires systematic validation, including optimal clone selection, assessment of antibody staining patterns, panel design, and panel optimization to ensure consistency and high signal-to-noise ratio with minimal steric hindrance.24,47 Our comprehensive quality control (QC) process confirmed specificity of oligo-conjugated antibodies by benchmarking against the performance with standard 3, 3′-diaminobenzidine immunohistochemistry and appropriate controls (Supplementary Fig. S2A, D).
In addition, antibody expression patterns were evaluated qualitatively (Supplementary Fig. S2B) and verified with information from public databases. 25 The panel was configured for cycle efficiency and optimal fluorophore selection based on the target expression level (Supplementary Fig. S2C). Based on our evaluation, it is recommended to pair lower expressing targets with AF647 and more abundant targets with ATTO550 or AF750 in FFPE tissues due to the likelihood of autofluorescence in ATTO550 and varying camera quantum efficiency with AF750. Finally, reproducibility studies were also carried out to ensure robust performance (Supplementary Fig. S2D).
To our knowledge, ours is the first study to demonstrate in situ analysis of >100 proteins via optical imaging. Juxtaposing the H&E map (Fig. 3A) with the single-cell spatial phenotypic map (Fig. 3F), the whole-section immune CN map (Fig. 4C) and the metabolic functional map (Fig. 5D) unveils the different layers of complexity of the TME. The sheer complexity and depth of these single-cell spatial and functional data raises several hypotheses for the mechanisms underlying partial clinical responses and provides guiding principles for the application of such high-plexed discovery-based research tools to identify biomarkers of clinical significance.
The Bigger Picture
Further studies are warranted where this approach is used to screen larger cohorts of patients with pathological complete responses and progressive disease to distill multi-marker and multi-omic spatial signatures associated with therapy response and resistance. These tissue signatures can then be prospectively validated and developed into screening tools/companion diagnostic assays for predicting response to immunotherapies in head and neck cancer.
Materials and Methods
Tissues and experimental procedures
Panel development
FFPE human tonsil tissue was purchased from BioIVT (Westbury, NY) for development and validation of the 101-plex panel.
Tumor phenotyping
Retrospective HNSCC tissues (Supplementary Table S1) were collected before treatment and stored as FFPE blocks from the Royal Brisbane and Women's Hospital (RBWH) with Human Research Ethics HREC Approval No. LNR/2020/QRBW/66744 and The University of Queensland ratification. Patients were treated with pembrolizumab or nivolumab and categorized based on response to therapy according to RECIST 1.1, including CR, PR, SD, and PD. Serial sections of hematoxylin and eosin (H&E) staining were prepared by Pathology Queensland and reviewed by a pathologist for tumor/stroma demarcation.
The primary HNSCC case described in this study is from a male patient (55y) with recurrent pulmonary and nodal metastatic disease that developed two years after initial surgery and post-operative chemoradiotherapy with concurrent cisplatin for cT3N2M0 p16+ tonsil squamous cell carcinoma (SCC). On relapse, the patient was treated with 13 cycles of pembrolizumab and showed a PR in measurable disease. Treatment was ceased early due to the development of a grade 3 immune-related polyarthritis requiring oral corticosteroids and methotrexate with good effect.
The disease then developed subsequent progression ∼14 months after commencing immunotherapy, requiring palliative chemotherapy (carboplatin and 5-flurouracil). After an initial response to chemotherapy, the disease progressed further, and the patient died ∼33 months after starting immunotherapy.
Sectioning
Following equilibration of blocks at room temperature, 5 μm thick sections were cut using a Leica RM2125 RTS microtome and sectioned onto Poly-L-lysine coated slides (#3800081; Leica Surgipath Apex Superior adhesive slides). Slides were dried at room temperature overnight and stored at 4°C for long-term storage.
Reagents
Antibodies (Supplementary Table S2) were obtained from commercial vendors as indicated and conjugated to custom oligo barcodes according to instructions in Akoya Biosciences' antibody conjugation kit (Conjugation kit, #7000009; Akoya). Briefly, antibodies were reduced to expose thiol groups in the hinge region followed by conjugation to unique oligonucleotides. After multiple rounds of purification, oligo-conjugated antibodies were eluted and stored in Storage Buffer at 4°C. Complementary oligo-conjugated fluorophore reporters were obtained from Akoya Biosciences.
Sample processing
Slides were baked for 1 h at 55°C on a slide warmer (Premiere XH-2004) and dewaxed through two successive rounds of incubation in Histochoice Clearing Agent (PN# H103-4L; VWR) for 5 min each. Subsequently, the FFPE sections were dehydrated by sequentially incubating in 100% ethanol (PN# 79317-16GA-PB; Sigma Aldrich), 90% ethanol, 70% ethanol, 50% ethanol, and 30% ethanol twice each for 5 min. Slides were then rinsed three times in distilled water for 5 min to ensure no carryover of ethanol before target retrieval. Heat-mediated epitope retrieval was performed by incubating slides in a beaker containing Tris EDTA solution (pH 9; #S2367; Dako) in a pressure cooker for 20 min.
After 20 min, the beaker was removed from the pressure cooker and left to equilibrate at room temperature for 30 min. Slides were then rinsed through two rounds of incubation in distilled water for 2 min and stored in Hydration Buffer from the Sample Kit for PhenoCycler-Fusion (#7000017; Akoya Biosciences) until ready for staining.
For antibody staining, an antibody cocktail was prepared with optimal dilutions of each antibody in a buffer containing N, J, S and G blockers (#7000017; Akoya Biosciences). Samples were first allowed to equilibrate to room temperature in Staining Buffer for 20–30 min, followed by incubation in a pre-blocking solution made of N, J and S blockers in Staining Buffer.
The first antibody cocktail (containing the first 50 antibodies) was subsequently added to the slide, and slides were incubated overnight at 4°C. On the next day, slides were rinsed with Staining buffer and fixed with 1.6% PFA (PN# 15710; Electron Microscopy Sciences) in Storage buffer solution. A second round of antibody staining (with the remaining antibodies) was performed with incubation at room temperature for 3 h.
After washing with Staining buffer and fixation of the second set of antibodies in 1.6% PFA, samples were fixed in ice-cold methanol for 5 min at 4°C. A third round of fixation with PhenoCycler Fixative reagent was applied, and slides were stored in Storage Buffer at 4°C until ready to image.
Reporter plate preparation and imaging
Reporter Stock solution was prepared as described in the PhenoCycler-Fusion User Guide with 10 × Buffer (#7000019), Assay Reagent (#7000002), and Nuclear Stain (#7000003) from Akoya Biosciences. Individual tubes of 3 reporters/cycle, diluted in reporter stock solution, were prepared based on the cycle information in Supplementary Table S3. Subsequently, a 96-well plate was prepared with 1-well/cycle containing the corresponding working reporter solution for that cycle. Blank cycles containing only reporter stock solution without any added fluorophore reporters were included as the first and last cycle in each run for subtraction of autofluorescence background.
Antibody-stained slides were next equilibrated at room temperature in 1 × Buffer for at least 10 min. The flow cell (#240204; Akoya Biosciences) was assembled onto the slide as described in the user guide. The slides were incubated in 1 × Buffer again for 10 min to ensure secure sealing of the flow cell to the slide.
The slide was then transferred to the flow cell carrier and imaged on a PhenoCycler-Fusion (Akoya Biosciences) using the following exposure settings: DAPI—1 ms, ATTO550 channel—150 ms, AF647 channel—150 ms and AF750 channel—150 ms. Integration of the PhenoCycler automated fluidics cycler with the PhenoImager Fusion imaging system automated the entire process of reporter hybridization, imaging, and dehybridization to capture whole slide images of three markers (+DAPI for nuclear staining) at a time.
After images of all cycles had been acquired, the final QPTIFF file containing a composite image of all markers was viewed using the QuPath software (https://qupath.github.io/), where each channel can be turned on and off individually or collectively to reveal the spatial expression pattern of the marker(s) of interest.
Bioinformatic analysis
Computational image analysis was used to identify different cell types and characterize their spatial distribution in the tissue. The image analysis workflow is described in Supplementary Figure S1B. Before initiating data analysis, quality control was performed on each individual image by visual assessment across the whole slide; each marker was qualitatively evaluated based on signal intensity compared with the background and for staining specificity.
Other artifacts such as out-of-focus regions, tissue folding, and debris were manually annotated and excluded from the analysis. The subsequent step of image analysis consisted of cell segmentation, which identified individual cells across the tissue by determining their location and surface. This was followed by phenotyping the segmented cells based on their combinatorial antibody labeling intensities and characterizing the spatial organization of the different cell types with their spatial interactions in local CNs.
Segmentation
Nuclear segmentation was first performed using the deep learning method StarDist, utilizing its default parameters, and applying the 2D_dsb2018 model to the DAPI image. 48 To align with the training set's image resolution and enhance image contrast for prediction, preprocessing steps were implemented, which included reducing the image size by 50% and applying Contrast Limited Adaptive Histogram Equalization.
The cytoplasmic segmentation was established by expanding the nuclei through a morphological dilation of 6μm, which was applied to the labeled nuclear mask. The centroid of each cell was subsequently determined using the x-y coordinates of the nuclear object's centroid within the image. A comprehensive qualitative assessment of the segmentation was carried out for each individual slide, and it yielded consistently satisfactory results, affirming the robustness and reliability of the segmentation process (Supplementary Fig. S7A).
Phenotyping
After cell segmentation, the average intensity of each marker was calculated for each cell using the segmentation masks and the marker images. If the protein is localized in the nucleus, for example, Ki-67, PCNA, FOXP3, then the average intensity was calculated from the nuclear mask. Otherwise, if the protein is localized in the cell cytoplasm/membrane, for example, CD4, CD3, E-cadherin, then the average intensity was calculated from the cytoplasm mask.
Each protein expression was then z-scored across all cells in the slide such that each protein has a mean equal to 0 and a standard deviation equal to 1. For cell phenotyping, a particular subset of markers was selected depending on the question asked in our study, for example, immune cell subtyping or metabolic phenotyping (Supplementary Table S4). 28
Unsupervised clustering was performed using the Leiden algorithm implementation from the Scanpy toolkit with the GPU-accelerated Rapids package.49,50 Leiden resolution 1–6 were tested, and the resolution of 4 was chosen for manual cluster annotation as it presents a sufficient number of clusters that separate the cells into smaller groups differentiated by protein expression variability over the technical variability.
Cell phenotypes were then assigned based on protein expression patterns on a hierarchical clustering heatmap (Supplementary Table S4). Clusters with similar expression profiles were combined into one phenotype and a new heatmap was generated (Figs. 2A, 3C and 5A). Representative examples of cell phenotyping are shown in Supplementary Figure S7B.
Dimensionality reduction was applied for data visualization by means of UMAP and t-SNE using Scanpy and Rapids implementations.49,50 UMAP parameters were set to 20 for the number of neighbors, 0.05 for minimum distance, and 0.5 for spread whereas t-SNE parameters were set to 30 for perplexity, 12 for early exaggeration, and 200 for the learning rate.
Further, for the HNSCC tissue, regions of interest were annotated as Tumor region 1, Tumor region 2, Tumor region 3, and Tumor region 4 based on histological examination of H&E staining and inspection of PanCK and E-Cadherin expression by an anatomical pathologist before phenotyping. The four large tumor aggregates thus identified were subsequently validated through metabolic phenotyping obtained from the unsupervised clustering of key proteins involved in cellular metabolism and stress pathways. The number of cell types in each tumor was then calculated, and the relative cell percentages were compared between the different tumor regions.
CN analysis
The spatial interactions between different cell phenotypes were quantified using the CN method described previously. 8 This method provides critical information about the relative abundance of cell types within the local neighborhood of a cell. In this study, the neighborhood of a cell was first defined using a Delaunay graph, where a cell N is considered to be a neighbor of cell A if they are connected in terms of Delaunay triangulation (Supplementary Fig. S8A).
Then, for each cell, the cell-type percentages in its neighborhood were calculated. This step produces a neighborhood matrix where cells are characterized by the percentages of cell types in their local neighborhood. K-means clustering was then performed on all cells based on these percentages with k = {3,…,20}. The optimal number of CNs was determined as 6 based on Calinski-Harabasz criterion (see Supplementary Fig. S8B). 51 The average neighborhood percentages were also calculated for each CN and plotted on a heatmap (Supplementary Fig. S8C).
Footnotes
Acknowledgment
The authors thank The Passe and Williams Foundation for the grant support issued to A.K. and B.G.M.H.
Authors' Contributions
Concept/design: N.J., B.B.C., N.N., M.P., Su.B., A.K., and O.B. Resources: N.N., B.A., M.P., Su.B., B.G.M.H., A.K., and O.B. Methodology: N.J., B.B.C., N.N., N.M., D.K., A.P., Y.K., Su.B., O.S., Sh.B, Y.H., Y.Z., J.M., and C.C. Data analysis: N.J., B.B.C., N.N., A.P., Y.K., K.O.B., B.G.M.H., A.K., and O.B. Writing and review: All authors.
Author Disclosure Statement
N.J., B.B.C., N.N., N.M., D.K., J.D., R.M., A.P., Y.K., Su.B., O.S., Sh.B, Y.H., Y.Z., and O.B. are employees of Akoya Biosciences, Inc.; B.A., M.P., and Su.B. are employees of Abcam, Inc.; B.G.M.H. is an advisory board member of Merck Sharpe and Dohme, Bristol Myers Squibb, AstraZeneca, Pfizer, Takeda, Sanofi, and Eisai.
Funding Information
This study was funded by the Garnett Passe and Rodney Williams Foundation.
References
Supplementary Material
Please find the following supplemental material available below.
For Open Access articles published under a Creative Commons License, all supplemental material carries the same license as the article it is associated with.
For non-Open Access articles published, all supplemental material carries a non-exclusive license, and permission requests for re-use of supplemental material or any part of supplemental material shall be sent directly to the copyright owner as specified in the copyright notice associated with the article.