
Abstract
As recombinant adeno-associated virus (AAV) vectors expand the availability of gene therapy; high-speed low-volume analytical methods become more vital for manufacturing. Current approaches for characterization are time consuming and sample consuming. Stunner combines ultraviolet–visible (UV–Vis) spectroscopy, static light scattering (SLS), and dynamic light scattering (DLS) to characterize up to 96 samples in <1 h, using 2 μL per sample. These data can be used to precisely quantify critical AAV titer, empty/full ratio, size, and aggregation. This study compares this technique with quantitative real-time PCR (qPCR), enzyme-linked immunoassay (ELISA), transmission electron microscopy, and analytical ultracentrifugation using AAV vectors with multiple serotypes, genome sizes, and purification strategies. Recommended sample criteria were established to provide guidelines on the suitability of Stunner analysis on a per-sample basis. The data presented herein lay the groundwork in establishing the use of combined UV–Vis, SLS, and DLS as a powerful and flexible analytical tool for AAV gene therapy vector development and manufacturing.
Introduction
Therapeutic adeno-associated virus (AAV) vectors are rapidly progressing as highly efficient gene delivery tools, with applications in many different human diseases. The advantages of the viral vector platform include easily manipulated genomes, low immunogenicity, broad infectivity, high yield from relatively simple production processes, and the potential for long-term expression. 1 These features of the AAV-based viral vector make it the most commonly used viral vector being investigated and manufactured in the past two decades.
In general, recombinant AAV (rAAV) vectors are produced in mammalian or insect cells by cotransfecting the cell line with multiple plasmids that carry either vector DNA or helper DNA. After cell lysis, the intracellularly matured virions are purified and enriched by brief centrifugation clarification. Commonly used purification procedures include (1) density gradient ultracentrifugation of virions using either cesium chloride (CsCl) or iodixanol; (2) pore-size controlled ultrafiltration (UF) for target retention or filter out, such as parallel tangential flow filtration (TFF), UF, and buffer exchange dialysis filtration (also known as diafiltration [DF]), or column-based CIMmultus monolithic filtration (CMF); or (3) chromatography-based preparation, including ion exchange size-exclusion chromatography and antibody-based affinity chromatography.2,3
Each purification method has its own advantages and drawbacks. Usually, two to three different purification methods are combined to optimize final drug quality for in vivo use. The balance between the yield and purity of the final products varies for each individual purification strategy, and each method must be paired with analytical methods to confirm performance.
Currently, a suite of assays has been established by the national and international authorities as “ad hoc” procedures for viral titer quantification, ratio of fully packaged versus empty/partially packaged virions, vector integrity, and impurity. Each individual assay has a specific purpose for in-process and final drug monitoring and evaluation, such as quantitative real-time PCR (qPCR) for vector genome (vg) copies, enzyme-linked immunoassay (ELISA) for viral particle quantification, transmission electron microscopy (TEM) or analytical ultracentrifugation (AUC) for empty/full assessments, chromatography for multiple viral characteristics, and dynamic light scattering (DLS) for size and size distribution analysis.
However, performing the full suite of assays in a manufacturing environment is not only time consuming but also labor intensive. The burden of running a high number of assays for different quality assurance purposes has also increased the cost of drug development and manufacturing. Importantly, extended delays for analytical results on in-process samples may cause deviations in viral titer and, ultimately, gene expression efficiency between stored, processed, and analyzed batches.
Stunner (Unchained Labs) is a combination ultraviolet–visible (UV–Vis) spectrophotometer, static light scattering (SLS), and DLS instrument designed to rapidly assess genomic and viral capsid (cp) titers, empty/full ratio, and detect aggregation with a minimum of time, labor, and sample consumption. 4
The use of UV–Vis spectroscopy to estimate the AAV titer and empty/full ratio is a well-established, simple, and reliable method.5,6 However, the use of UV–Vis spectroscopy alone is limited by its inability to confirm whether light is absorbed from intact AAV capsids or unassembled protein and nucleic acids. UV–Vis spectroscopy analysis can also be impacted by turbidity from AAV capsids scattering light in the UV region, where absorbance is used for DNA/protein quantification of AAV. Advanced algorithmic fitting, such as that done on Stunner, can determine the turbidity of a sample to remove turbidity as a source of error.
Static and DLS are complementary methods to UV–Vis spectroscopy, previously used to measure the concentration of AAV capsids and other viral vectors in a sample.7,8 However, light scattering methods require information about the molecular weight (MW) and refractive index of the particle to accurately determine the capsid concentration. In this approach, UV–Vis spectroscopy contributes information used to estimate the refractive index based on the ratio of protein and nucleic acids in a sample.
By combining multiple detection technologies for the same sample through spectroscopy and light scattering techniques, Stunner provides a complementary analysis of the properties of an AAV sample. In the past, these concepts have been used individually for the evaluation of AAV vectors. In this article, we evaluate the combination of these technologies for the rapid assessment of AAV vectors with different serotypes and compare them with classical quantification and quality assessment methods.
Results
Stunner quantifies protein, DNA, and intact capsids in AAV samples and applies them to determine titer and empty/full ratio
The UV–Vis absorbance spectrum of a purified AAV is the combination of the absorbance from the viral capsid, single-stranded DNA (ssDNA) genome, and any impurities that might be present. Using the amino acid sequence of the viral capsid proteins, the ratio between VP1:VP2:VP3, and the inverted terminal repeat (ITR)-to-ITR length of the vector genome, Stunner Analysis deconvolutes, or separates, the overall absorbance spectrum into the contribution from proteins, DNA, other UV-absorbing compounds or impurities, and background turbidity. The absorbance spectrum of a CsCl-purified AAV9 vector with a 2.4 kb ITR-to-ITR genome length was measured and deconvoluted using Stunner's AAV Quant application (Fig. 1A).
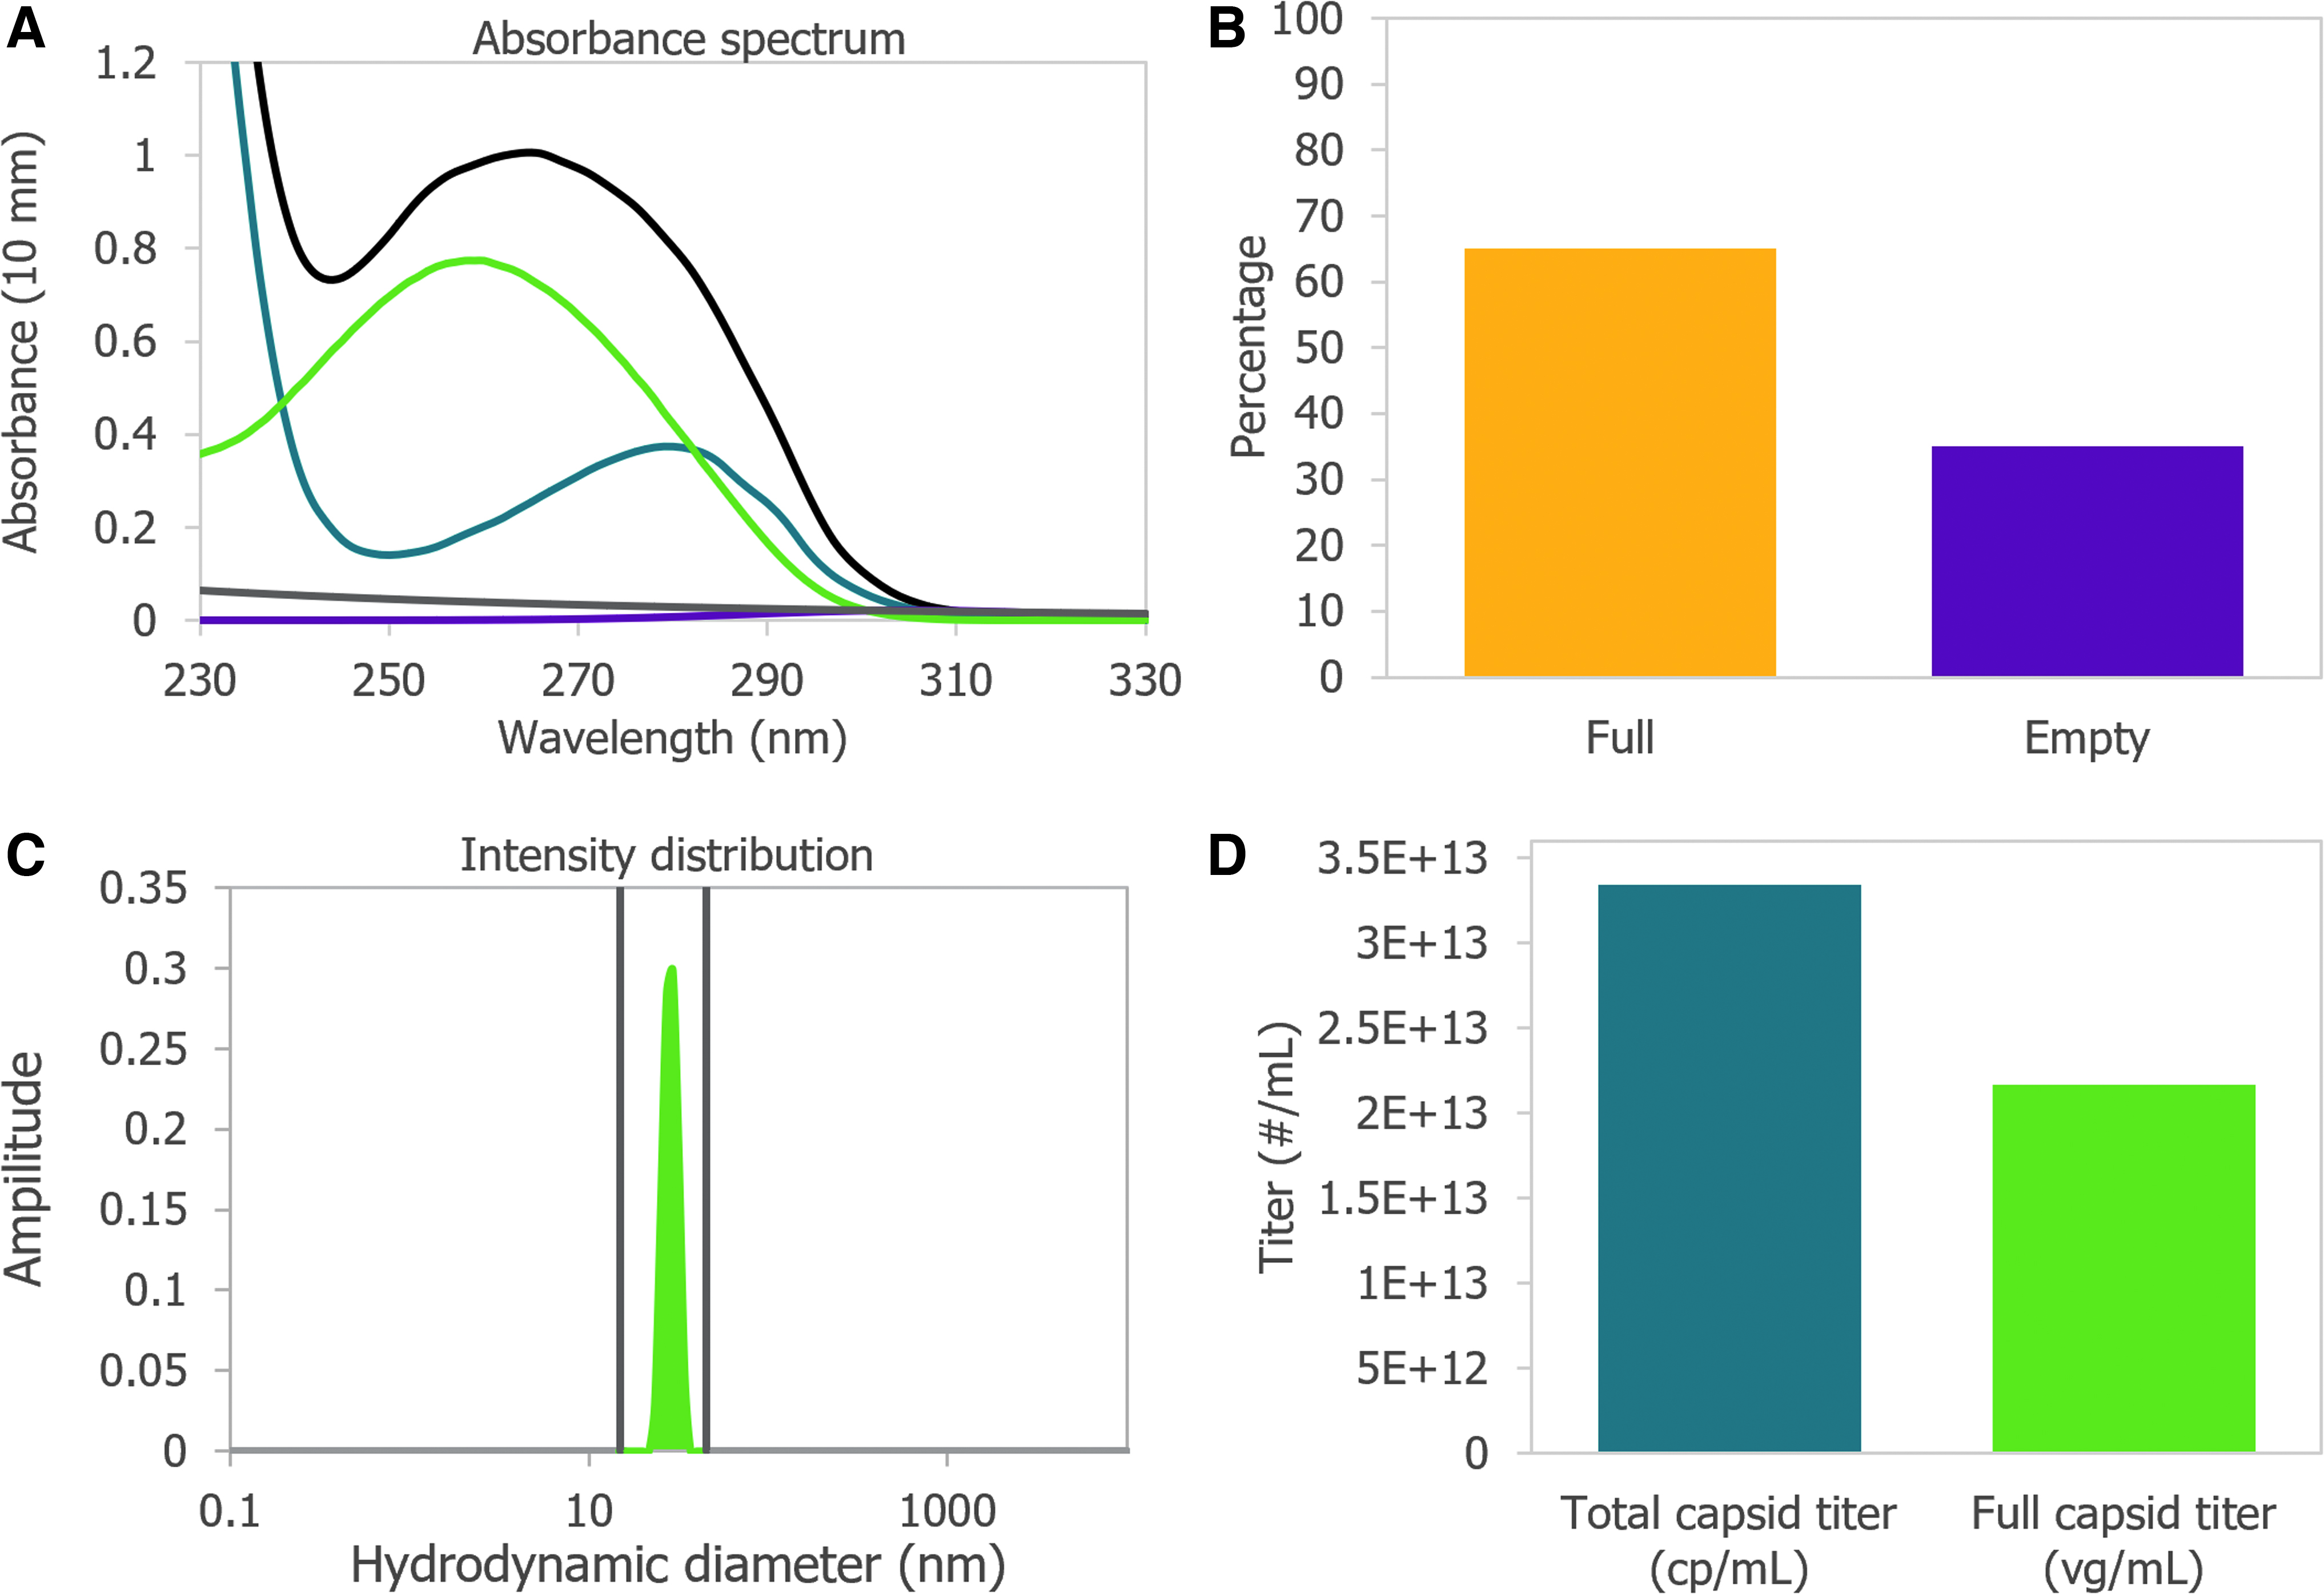
After deconvolution, the ssDNA titer of 2.2E+13 vg/mL equivalents was calculated from A260 of the DNA absorbance spectrum and the 752 kDa MW of a single genome. The protein titer of 3.3E+13 cp/mL equivalents was calculated from the A280 of the protein absorbance spectrum and the 4.0 MDa MW of the complete capsid. Protein titer is the maximum number of capsids that could possibly be assembled from the proteins in a sample.
The ssDNA titer is the maximum number of viral genomes if all the DNA measured by UV–Vis spectroscopy is encapsulated into assembled nonaggregated AAV particles. For a purified sample of AAV, the ratio of protein and DNA present is related to the viral capsid empty/full ratio. The AAV9 vector was determined to be 65% full by dividing the ssDNA titer by the protein titer (Fig. 1B). The vector was calculated to be 35% empty.
Intact AAV capsids have an expected hydrodynamic diameter of ∼25 nm. In purified AAV samples, anything larger is typically viral aggregates, and anything smaller is most likely small particles, including unassembled capsid proteins. To determine the proportion of light scattering that was attributable to intact capsids, the area under the DLS intensity distribution curve between 15 and 45 nm was divided by the total area under the curve and reported as the “capsid intensity.” The AAV9 vector had 100% capsid intensity, indicating there were no large aggregates and all the capsid proteins were assembled into intact capsids (Fig. 1C).
By combining all information from Stunner, the total number of intact AAV9 capsids was determined to be 3.34E+13 cp/mL (Fig. 1D). The full capsid titer of 2.17E+13 vg/mL was calculated using the sample's percentage full from Figure 1B and the total capsid titer. In some cases, UV–Vis spectroscopy will measure more protein in the sample than the total capsid titer or more DNA in the sample than the full capsid titer.
UV–Vis spectroscopy measures the total amounts of protein and ssDNA in a sample, whereas the total capsid titer includes information from SLS and DLS to calculate a titer for assembled nonaggregated AAV capsids. Differences between protein titer and total capsid titer are reported as a “free & aggregated protein” metric. Similarly, the difference between ssDNA titer and full capsid titer is reported as “free & aggregated ssDNA.” Both values were 0 for this nonaggregated AAV9 vector.
Dynamic range and precision of full and total titer of purified AAV vectors and empty capsids
Determining the dynamic range and precision of Stunner's quantification of titers and empty/full ratios using purified AAV samples of different serotypes and capsid contents is key to establishing its usefulness as a rapid high-throughput analytical method. A twofold dilution series of a purified AAV9 vector with a 4.8 kb ITR-to-ITR vector genome length in phosphate buffered saline (PBS) was measured in triplicate using Stunner's AAV Quant application (Fig. 2A). The stock sample had a full capsid titer of 1E+14 vg/mL and a total capsid titer of 2.8E+14 cp/mL.
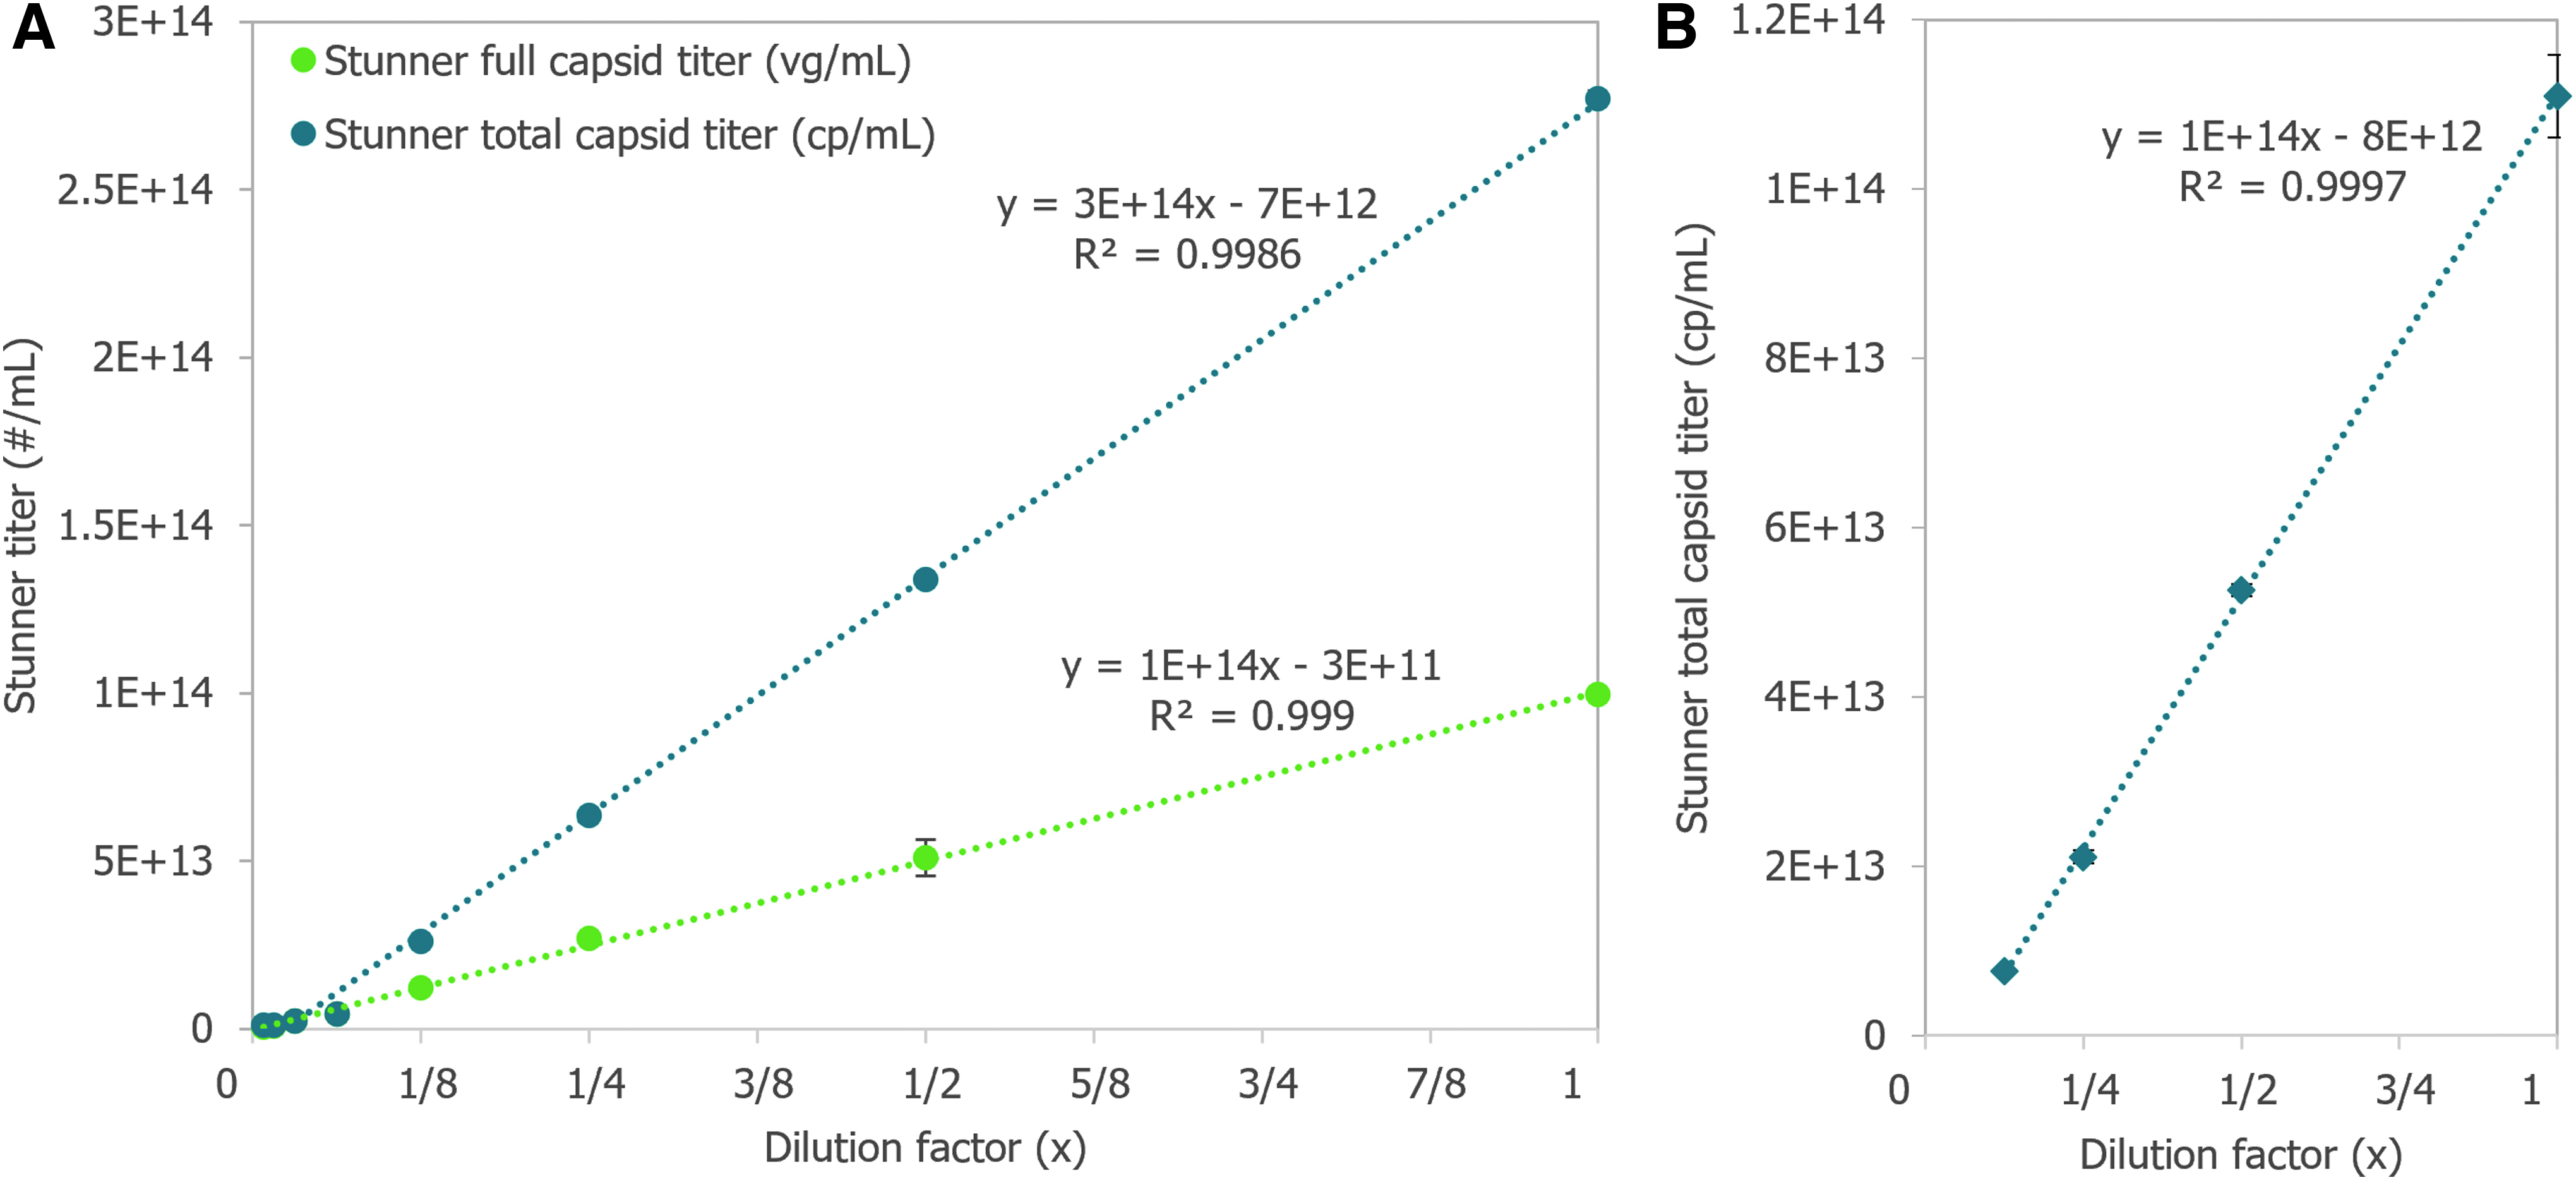
Dilutions with full capsid titers and total capsid titers above the lower limits of detection (LLOD) of 1E+12 vg/mL and 2E+12 cp/mL, respectively, had coefficients of variation (CVs) between 0.5% and 11.8%. The 16- and 32-fold diluted samples had full capsid titers close to 1/2 the previous sample's concentration, but Stunner indicated both samples had 100% full capsids, most likely due to residual iodixanol interfering with the ssDNA deconvolution. The full capsid percentage for samples down to an eightfold dilution ranged from 36% to 47% full. The 32-fold diluted sample had A260 and A280 values of 0.23 and 0.14, respectively, whereas the 64-fold dilution had A260 and A280 values of 0.08 and 0.05, respectively. The 64-fold diluted sample was below the LLOD for both full and capsid titers.
The total capsid titer of a twofold dilution series of an empty sample of AAV5 was measured in triplicate on Stunner (Fig. 2B). The total capsid titer of each dilution was approximately half of the previous sample, as expected, and the CVs for the sample ranged from 1.4% and 4.4%.
Stunner's linear range varies somewhat depending on the ITR-to-ITR genome length of a given AAV vector and how it was purified. By combining multiple detection techniques, the impact of coabsorbing impurities such as iodixanol is reduced, though not eliminated. These results can serve as an example on how to design an experiment to benchmark Stunner's linear range for a given AAV vector and show a high level of accuracy and linearity, based on the CVs <20% and r2 > 0.998.
Titer range for sizing and polydispersity of AAV vectors
Aggregated capsids are a significant and potentially hazardous process-related impurity for AAV vectors. 10 DLS is a high-sensitivity low-resolution method that can detect the presence of aggregated capsids or proteins for qualitative assessment even when these aggregates are in low abundance. It also determines the hydrodynamic size of AAVs in nonaggregated monodisperse samples and can be a semiquantitative estimate of size and size distribution of particles in aggregated or polydisperse samples.
The capsid diameter and polydispersity index (PDI) of a dilution series of an AAV9 vector with an ITR-to-ITR vector genome length of 2.4 kb were measured in duplicate by DLS on Stunner (Fig. 3A). The stock had a full capsid titer of 2.3E+13 vg/mL and a total capsid titer of 3.4E+13 cp/mL. The capsid diameter measured for each dilution ranged between 28 and 30 nm, consistent with the expected size of monodisperse AAV capsids. 11 The CVs for the capsid diameters were between 1.8% and 3.6%. The PDI increased with dilution from 0.01 for the stock sample to 0.05 for the 16 × diluted sample, but it remained <0.1 in all cases, indicating that the AAVs were monodispersed regardless of dilution.
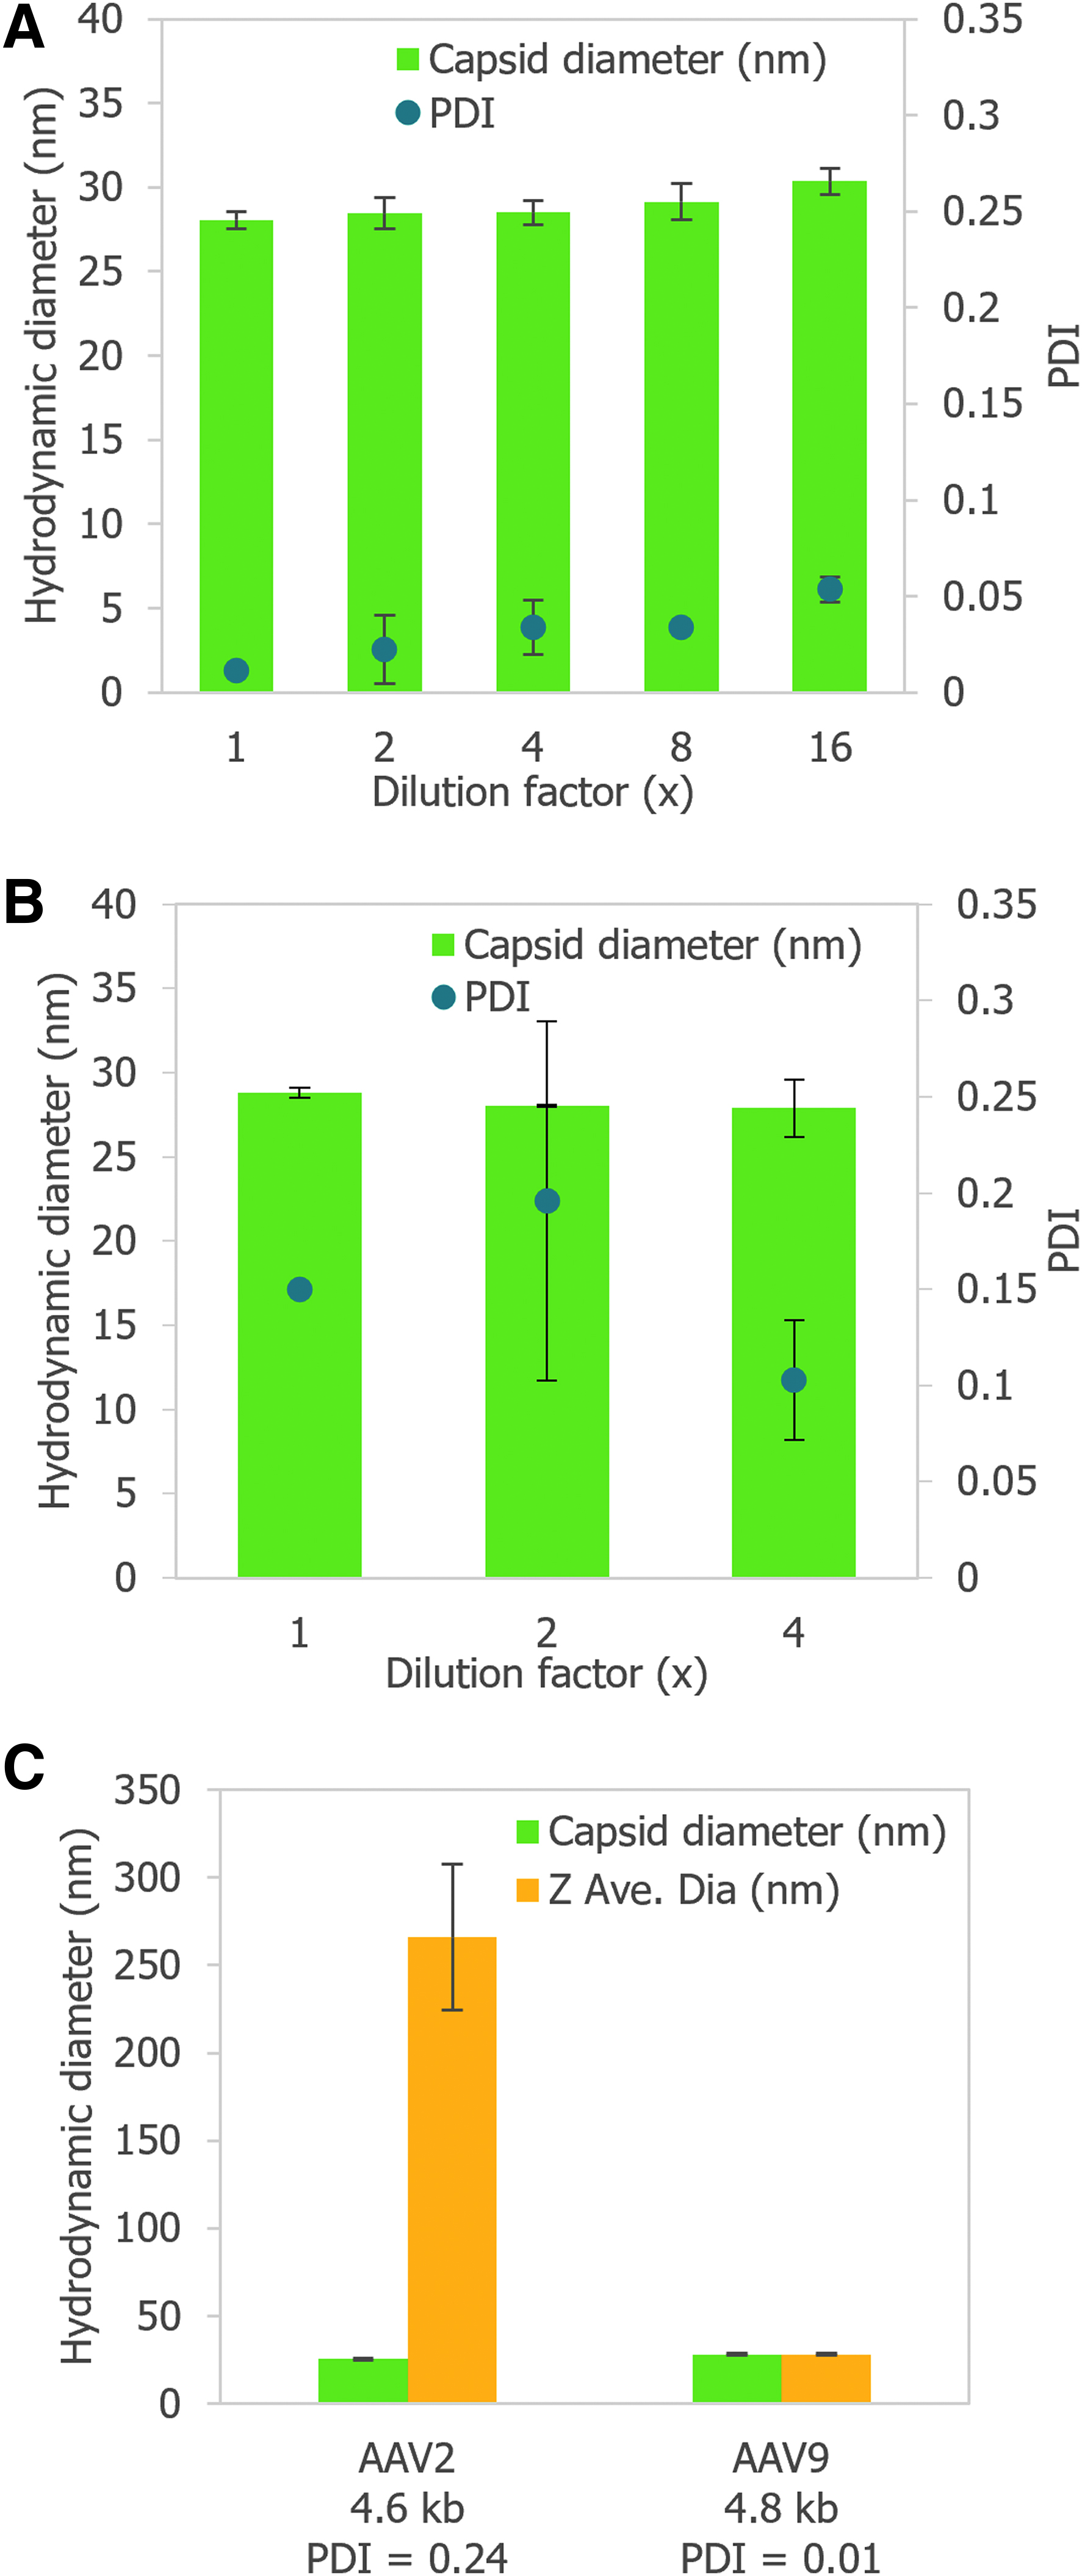
Although the LLOD by Stunner's AAV Quant application is ∼1E+12 vg/mL, depending on the size of the genome, sizing by DLS is typically more sensitive than quantification by UV–Vis spectroscopy. A sample of AAV8 with a 2.4 kb genome, qPCR titer of 8.0 × 10¹¹ vg/mL, and 74.8% full by TEM was diluted 2 × and 4 × , and then all three samples were measured by DLS on Stunner in duplicate (Fig. 3B). The capsid diameter and reproducibility remained similar across the three dilutions, ranging from 27.9 to 28.8 nm and 0.3 to 6% CV. The PDI was more variable across samples because of some moderate polydispersity but remained between 0.1 and 0.2.
Stability of AAV vectors is highly dependent on serotype. AAV2, for example, shows significant aggregation at high concentrations.11,12 The size and polydispersity of AAV2 and AAV9 vectors with ITR-to-ITR vector genome lengths of 4.6 and 4.8 kb, respectively, in the same buffer and capsid titers of 1E+13 cp/mL were determined by DLS with Stunner (Fig. 3C). AAV2 had a much higher average particle size than capsid particle size and a PDI >0.2, indicating the sample had large aggregates present in significant numbers.
AAV9 had similar average particle and capsid diameters, as well as a PDI <0.1, typical of a monodispersed sample. With suitable controls, capsid diameter, average particle size, and PDI can all serve as quality attributes for a variety of AAV vectors. The capsid intensity for the aggregated AAV2 sample was 23.4%, whereas the capsid intensity for the AAV9 sample was 100%.
Comparability of Stunner titers with qPCR and ELISA for several AAV serotypes and genes of interest
The utility of any novel method depends on its comparability to similar previously established assays. The standard methods to determine rAAV genome and capsid titers are qPCR and ELISA, respectively. However, multilaboratory studies have found that although these methods tend to be highly reproducible within an institution, there is often a high degree of variation for these assays between institutions, even for reference standard materials (RSMs).13–15 The turnaround time for qPCR and ELISA was also significant, and each method required at least several hours.
To assess the comparability of Stunner's AAV Quant application with these standard methods, titers were determined for six different AAV constructs of four different serotypes either in duplicate or triplicate (Fig. 4). The full sample titers from Stunner were within 30% of the qPCR results when the qPCR titer was >5E+12 vg/mL. Both qPCR and Stunner full titers were highly reproducible, with qPCR CVs between 2.9% and 5.6% and Stunner CVs between 0.4% and 6.5% for samples that were at least 20% full.
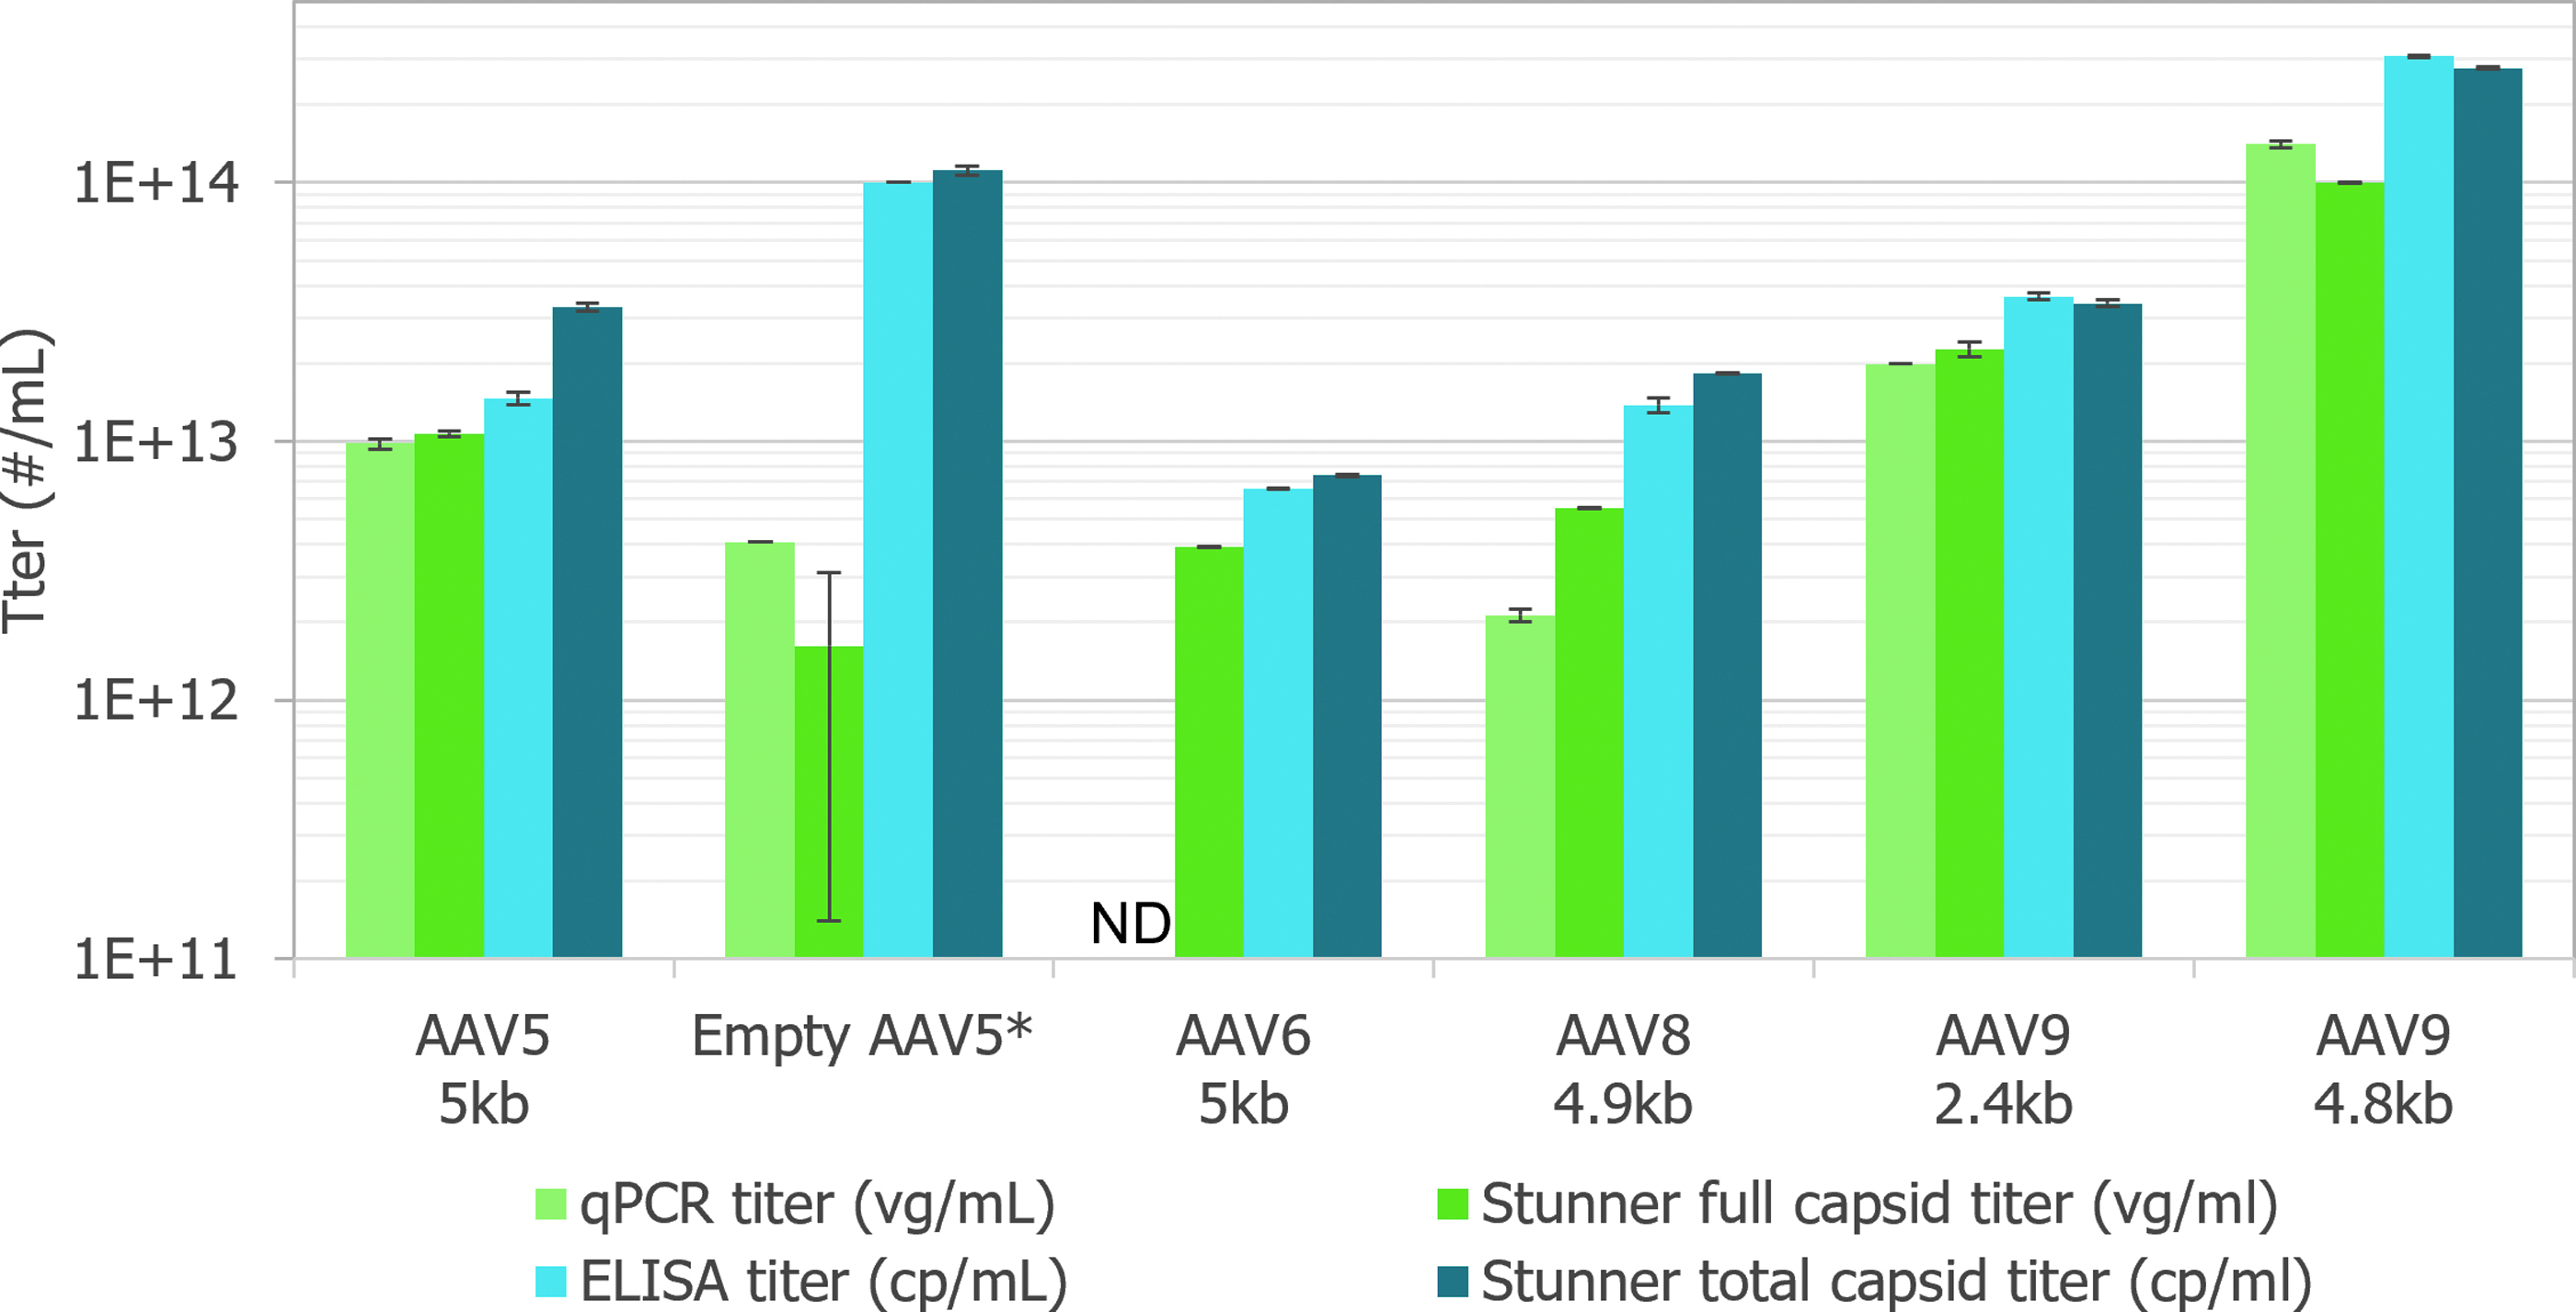
AAV titration ELISAs of intact assembled rAAV virions and empty AAV capsids require serotype-specific monoclonal antibodies (mAbs) in an optimized microtiter plate capture assay. 16 Stunner's total capsid titer uses UV–Vis absorbance spectra and the calculated extinction coefficient of each serotype, so it can be used for multiple serotypes in a single assay, reducing the time and effort necessary to determine capsid titers.
Aggregates can bind to surfaces differently from single molecules, which can impact AAV titrate ELISA precision. 17 By combining SLS and DLS with UV–Vis spectroscopy, the impact of aggregates on capsid titer precision is reduced. Stunner's total titer was typically within 30% of the ELISA titer. Reproducibility for Stunner total titers was similar to ELISA titers, with CVs between 0.4% and 4.4% for Stunner and between 0.4 and 5.9% for ELISA.
A qPCR standard curve or an ELISA titration curve allows the quantitative determination of samples of an unknown AAV titer. Unlike qPCR or ELISA, Stunner does not require any additional standards or reagents to determine full or total AAV titer. This reduces variability for outside sources, including choice of qPCR RSMs and primers or selection of serotype-specific titration ELISAs. The simpler Stunner workflow requires ∼1 h to measure 96 samples.
Comparability of Stunner percentage full to established methods
Most methods to determine the empty/full ratio of AAV vectors are either serotype specific or gene specific, as in the case of the qPCR/ELISA titer ratio, or are time intensive and sample intensive, as in the case of TEM and AUC.18,19 However, these techniques are also well-established analytical methods with large bodies of data in the literature. To assess Stunner's usability as a method for empty/full ratio, we compared Stunner results with the average qPCR/ELISA values for five different AAV vectors of three different serotypes, each with a different ITR-to-ITR genome length (Fig. 5A). One of these samples was predominantly empty capsids.
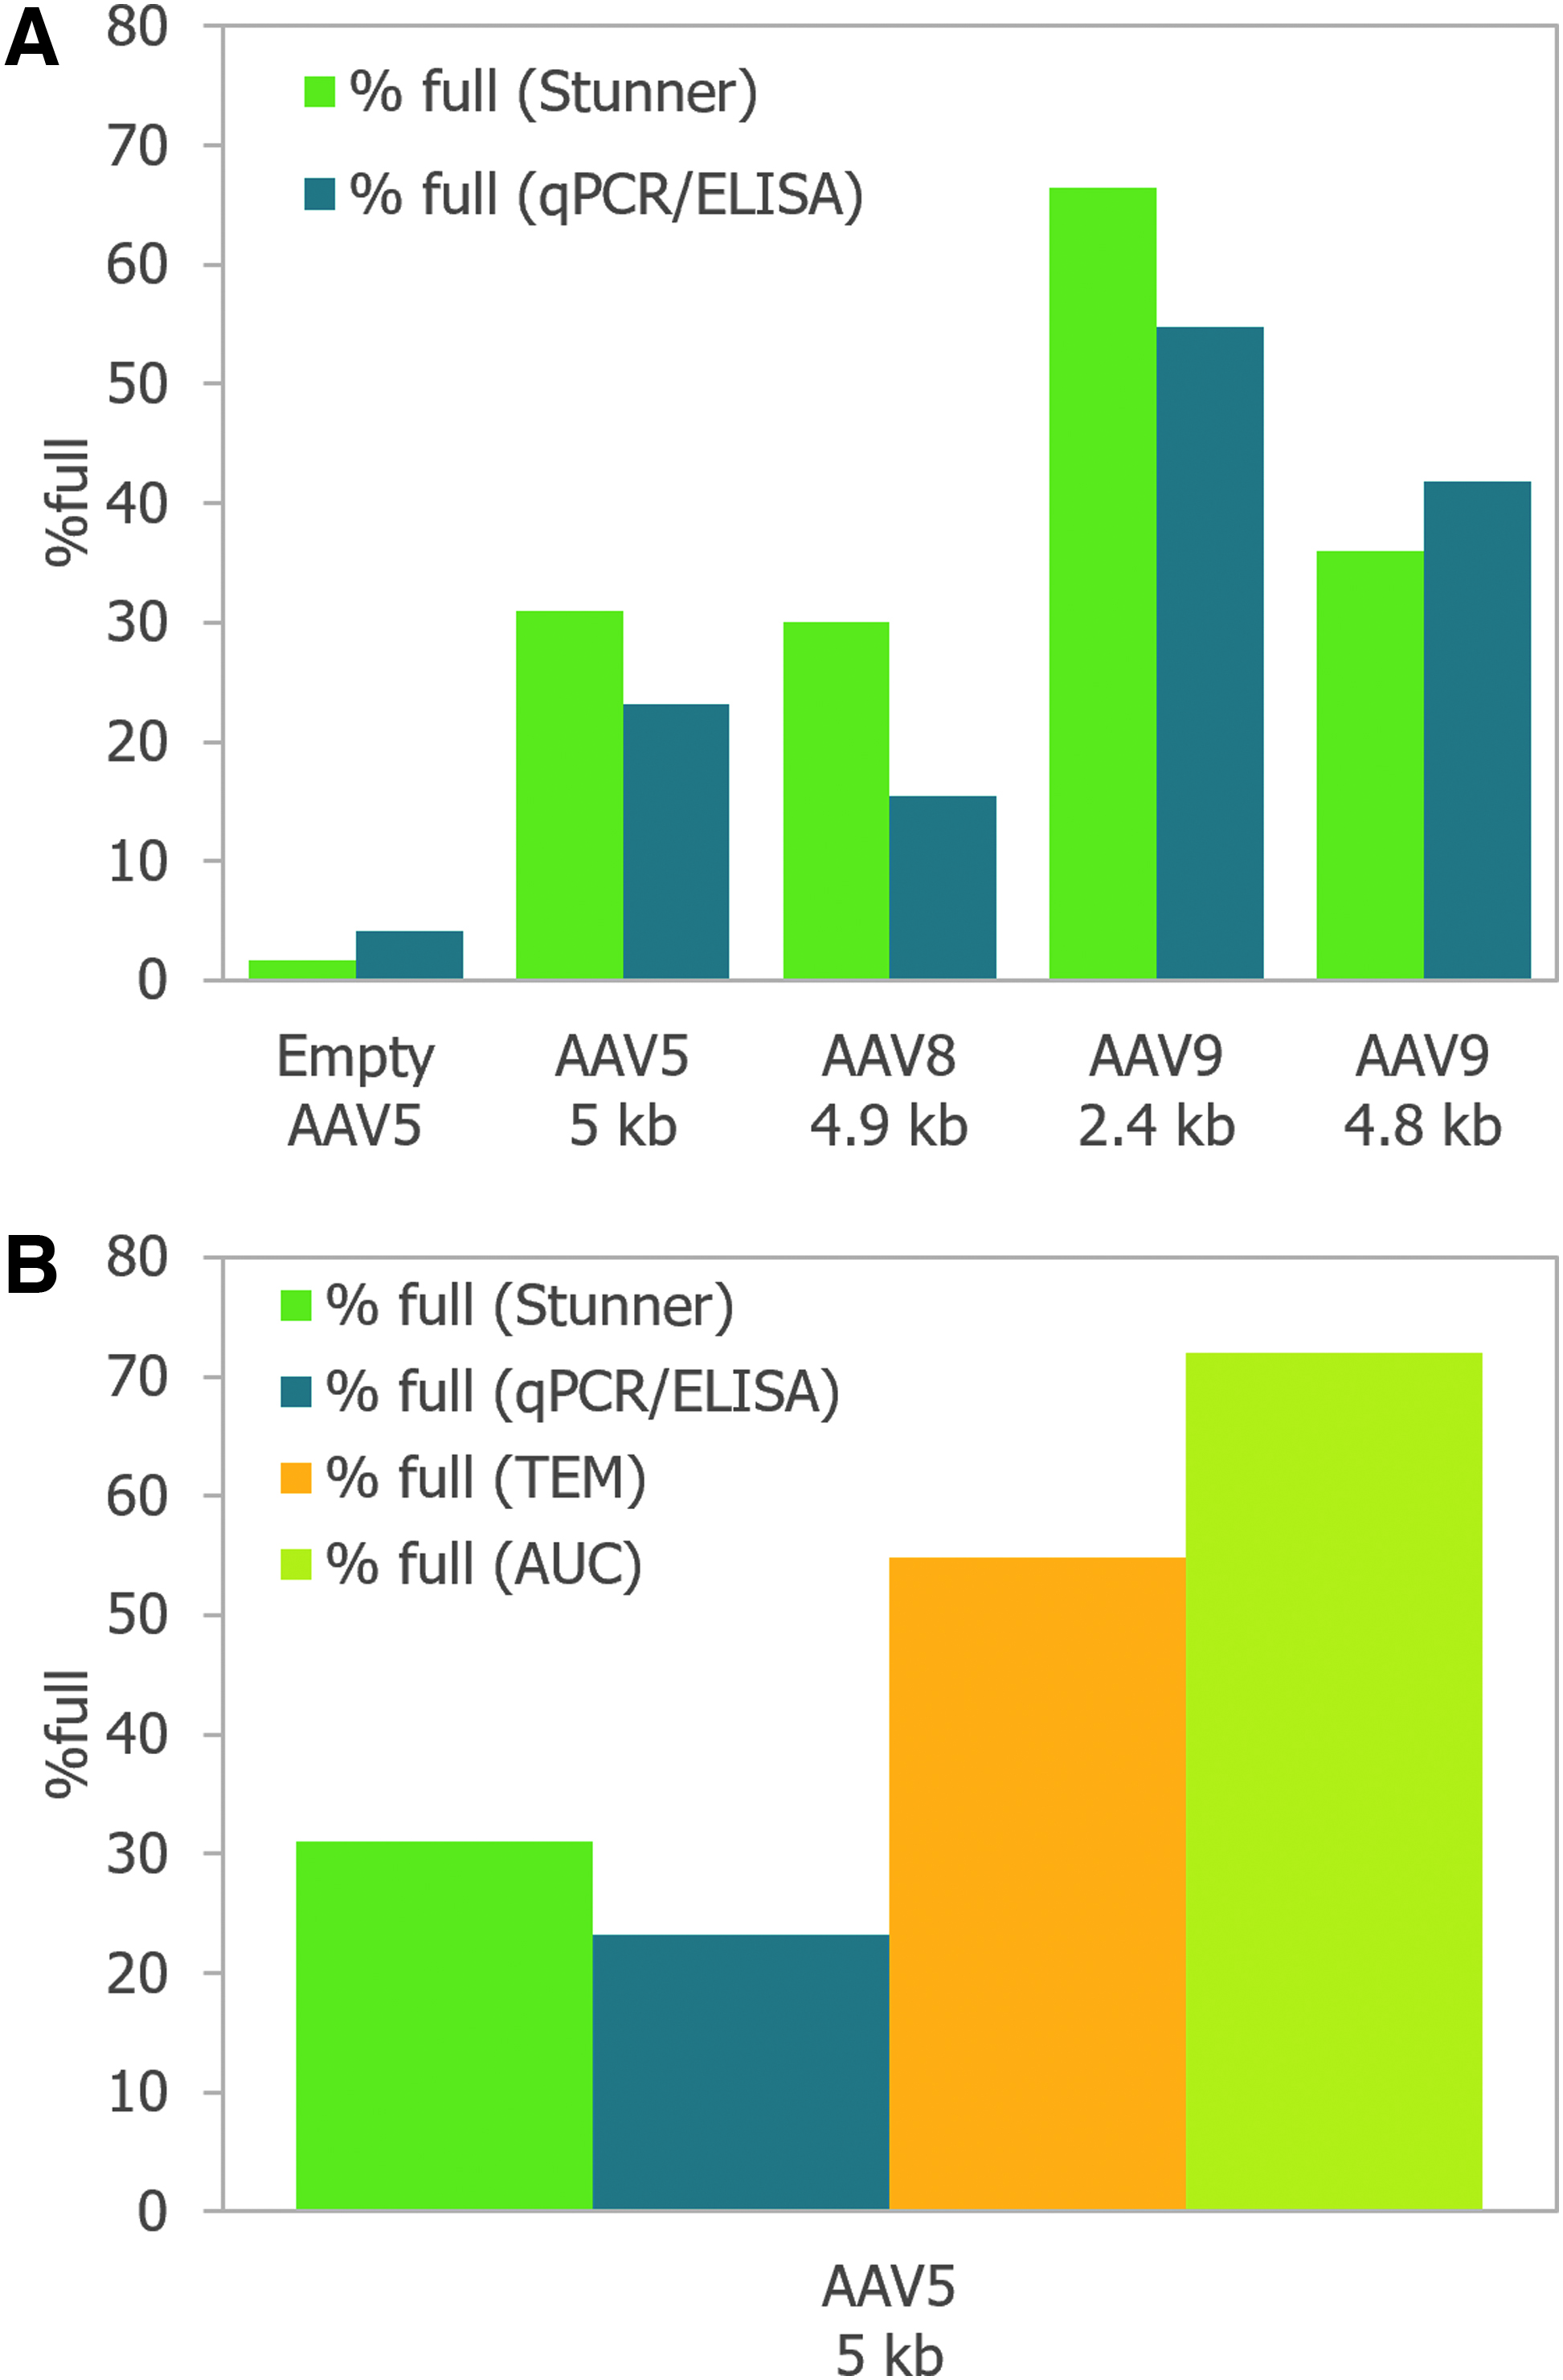
The empty/full ratios by the two methods were closely correlated; Stunner values were within 15% of the qPCR/ELISA percentage full value. Accurate quantification of percentage full of rAAV vectors is made more difficult because orthogonal techniques often provide different results. 20 By comparing the percentage full of an AAV5 vector with a 4.9 kb ITR-to-ITR genome length by four methods (Stunner, qPCR/ELISA, TEM, and AUC), we can see that the value is highly variable between different methods (Fig. 5B). For the same sample, the ratio of full to total capsids by Stunner was 33%, that by qPCR/ELISA was 23%, that by TEM was 55%, and that by AUC was 72%.
Using Stunner's UV–Vis deconvolution for AAV quality assessment
A260/A280 ratios are commonly used to indicate the overall ratio of capsid protein to DNA in AAV samples. Full AAV capsids have an A260/A280 ratio of 1.34–1.48, whereas empty capsids typically have an A260/A280 ratio of ∼0.6.6,20 Mixtures of empty and full capsids have intermediate A260/A280 ratios, and a larger value would sometimes indicate the presence of an excess of DNA. Impurities introduced during the purification process, especially from iodixanol density gradient ultracentrifugation, can also impact UV absorbances.
A UV–Vis absorbance spectrum of AAV9 with a full capsid titer of 1E+14 vg/mL and an ITR-to-ITR vector genome length of 4.6 kb was measured after iodixanol density gradient ultracentrifugation and buffer exchange into PBS (Fig. 6A). The A260/A280 ratio was 1.75, which could be interpreted as excess DNA, as in McIntosh et al. 20 However, after applying Stunner's AAV Quant deconvolution algorithms to the spectrum, it was apparent that residual iodixanol, not excess DNA, impacted the A260/A280 ratio (Fig. 6B). Iodixanol absorbs light in the UV range with a peak at ∼246 nm.
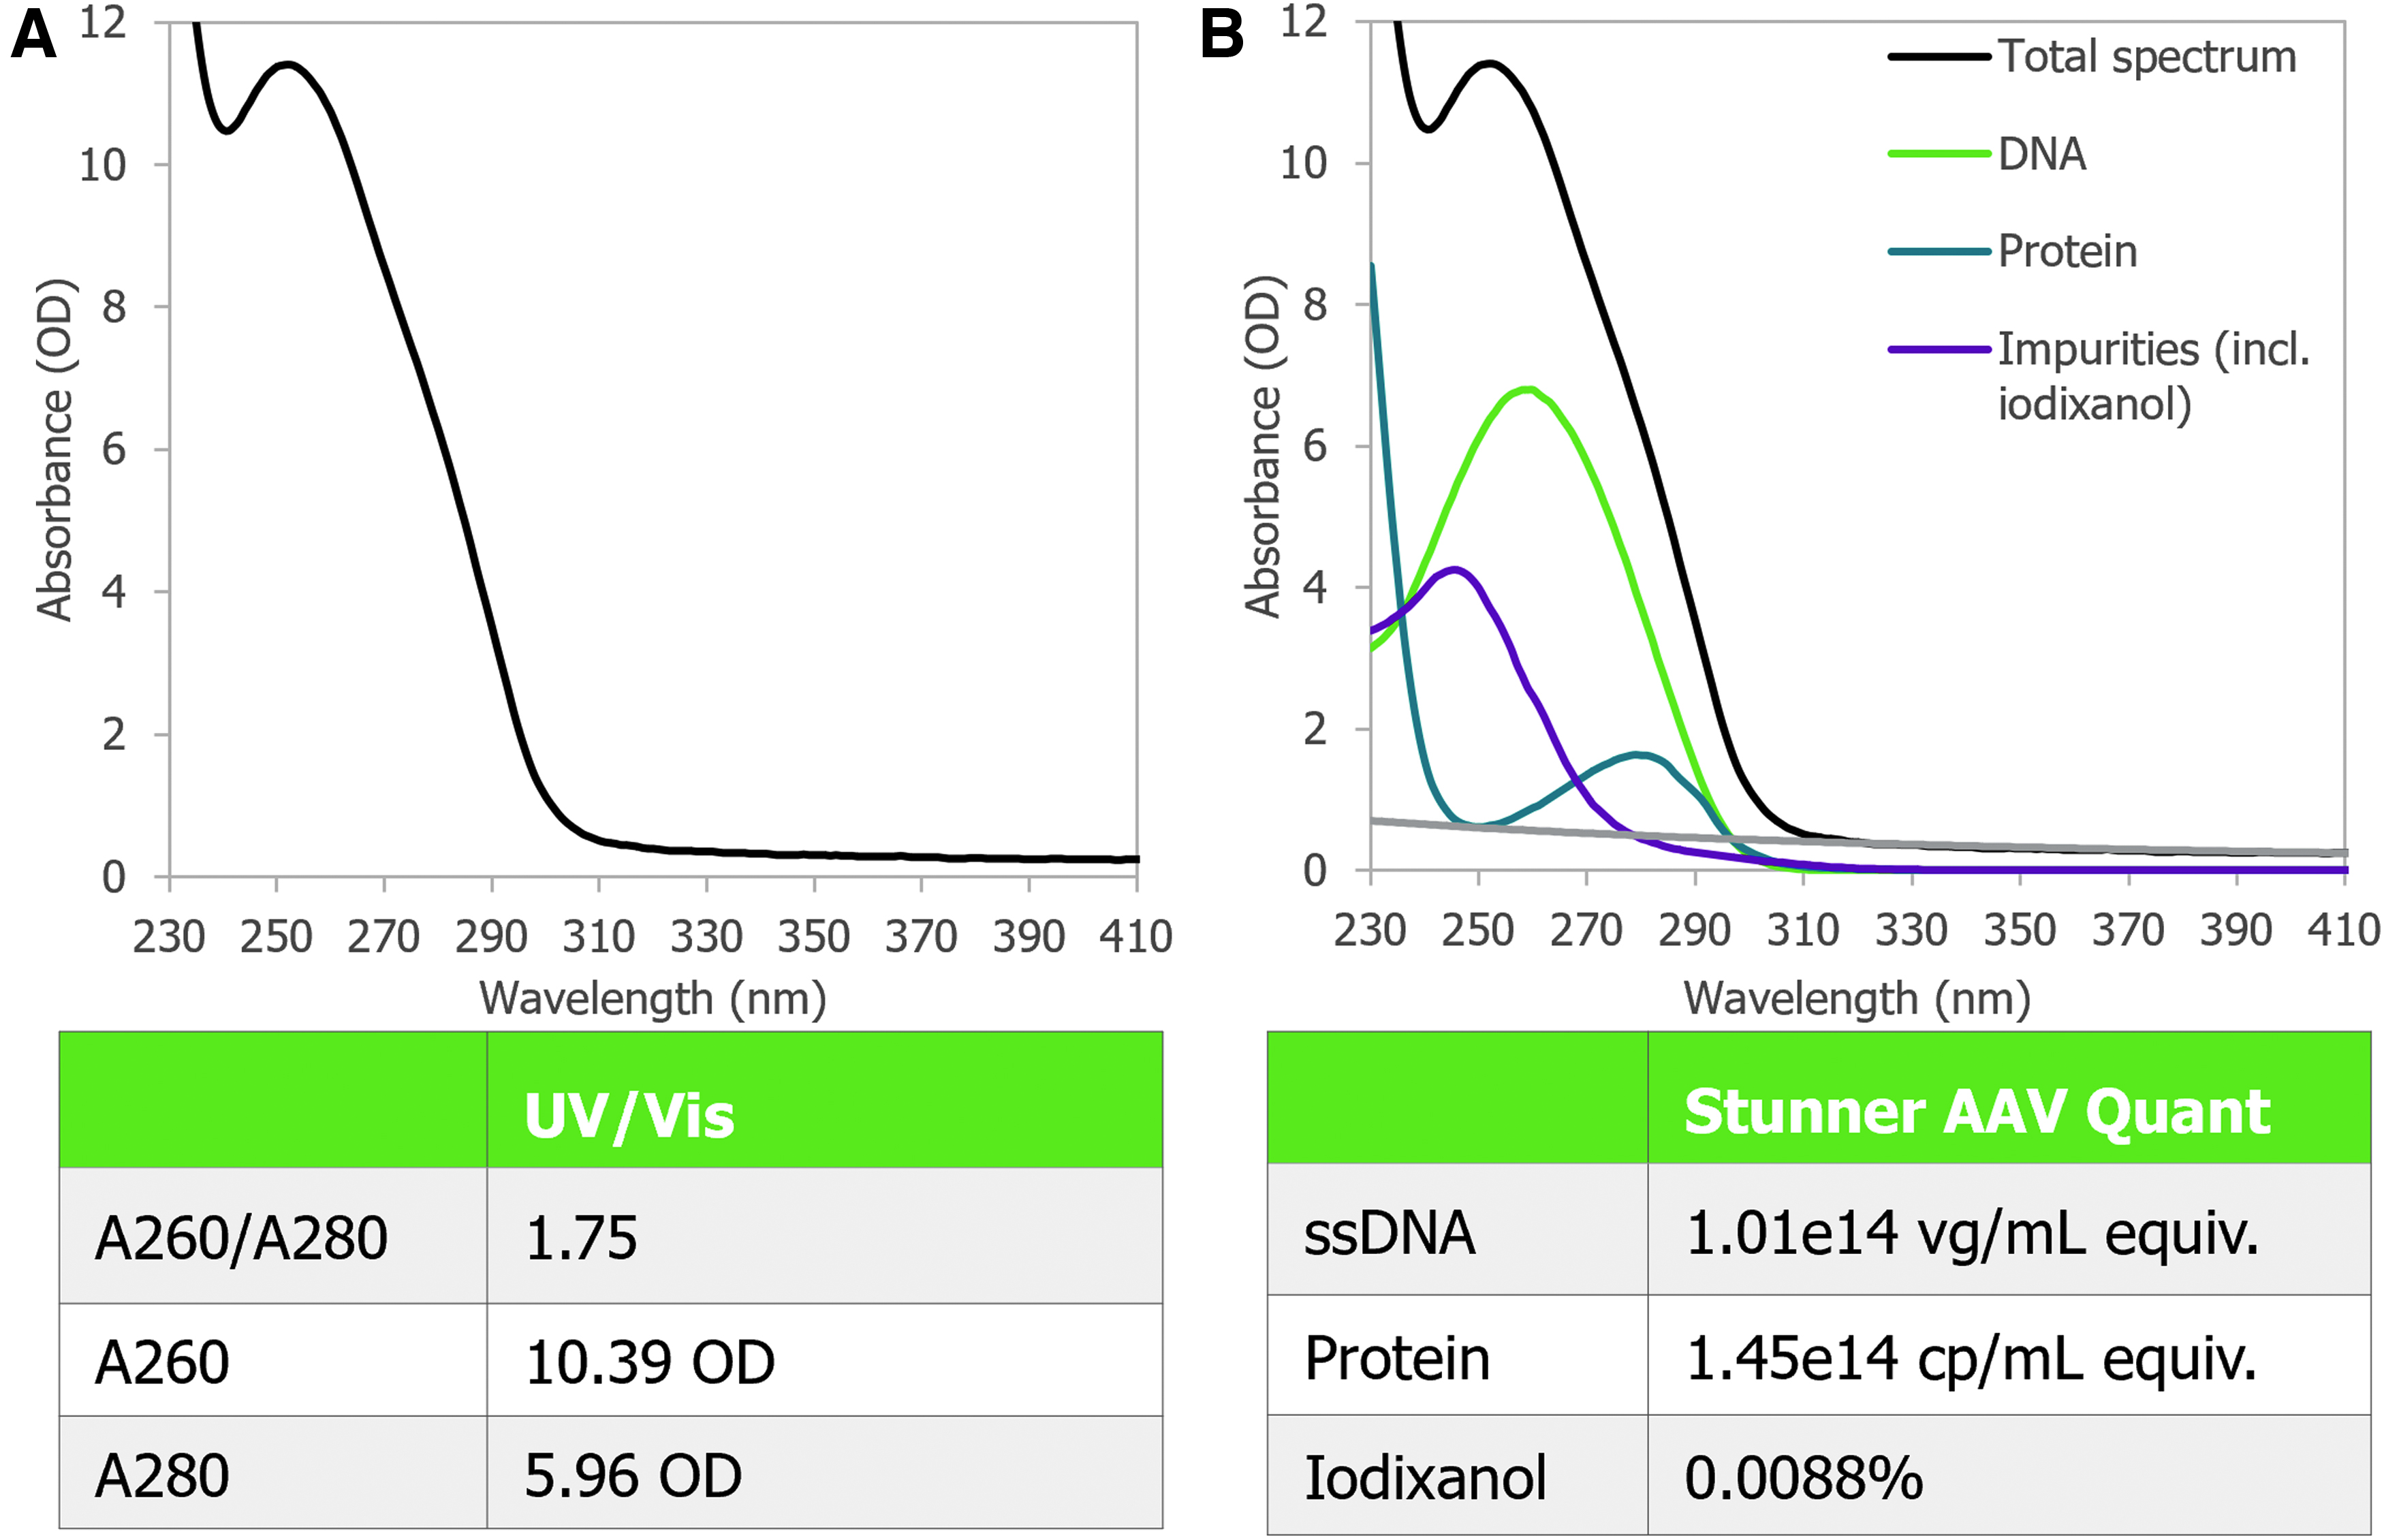
Automatic deconvolution allows for the independent quantification of viral DNA, capsid protein, and iodixanol by separating their contributions to the total absorbance spectrum, providing a significant improvement over traditional absorbance quality assessment. Only the AAV vectors with 4.8 and 4.6 kb ITR-to-ITR genome lengths from Figures 3, 4, 5, or 6 were purified using iodixanol density gradient ultracentrifugation and had detectable iodixanol.
Intact and aggregated AAV particles scatter light in the UV range, which would be mistaken for absorbance by traditional UV–Vis spectrophotometers. Stunner uses wavelength-specific turbidity background correction, shown in gray in Figure 1A, to compensate for this effect. Turbidity correction is based on the known behavior of Raleigh light scattering. 21 This eliminates the need for capsid denaturation, as was used in Sommer et al. when determining OD titers.
Stunner's AAV Quant is a more broadly applicable method of performing AAV quality assessments than UV absorbance measurements alone since it is less prone to errors from impurities, such as iodixanol, or from light scattering and turbidity.
Recommended sample criteria for precise AAV quantification by Stunner
Unlike qPCR and ELISA, which are relative methods, titration by Stunner is an absolute quantification method. As such, acceptance criteria based on the accuracy and precision of a standard curve are not applicable. Validating the performance of the assay with reference materials is appropriate, but the results and range will depend on the identity and content of the reference material. For example, the linear range of this method for a reference AAV with a 2 kb genome will differ from that with a 4 kb genome. Ultimately, lower limits of quantification and assay precision will be the combined result of process, product, and instrument performance. Sample criteria, based on physical measurements, provide guidance for the suitability and reliability of the quantification on a per-sample basis, in addition to accuracy and precision criteria. 22
The failure thresholds for these recommended criteria were based on the UV–Vis absorbance, SLS intensity, and DLS results from AAV vector dilutions, which had CVs >20% for either full capsid titer, total capsid titer, or capsid size (Table 1). All the sample criteria can be evaluated as part of the results from the AAV Quant application. AAV vectors with sufficiently high capsid content for deconvolution tend to have A280 >0.1 OD. Relatively large concentrations of UV-absorbing impurities interfere with UV–Vis quantification, so impurity absorbance needs <50% of the overall absorbance signal, which can be most easily determined by the ratio of impurity A230 to total A230.
DLS, dynamic light scattering; OD, optical density; SLS, static light scattering.
DLS and SLS require sufficient light scattering intensity, measured in counts per second (cps), for reliable measurements. Scattering intensity is related to the concentration of particles in solution and to their size. 23 AAV samples that can be reliably quantified tend to have scattering intensities >100,000 cps. For example, the scattering intensity, as measured by the derived intensity, for the 1 × , 2 × , and 4 × dilutions in Figure 3B were 2.6E+5, 1.5E+5, and 7.7E+4 cps, respectively. For the SLS-based AAV particle concentration to be reliable, most of the signal intensity should be due to intact capsids, not aggregates, and AAV samples that can be precisely quantified have capsid intensity >85%.
In cases where titer quantification by this method is not applicable for a particular sample, Stunner results can be used for quality assessments. For example, a PDI >0.2 tends to indicate the presence of capsids and large aggregates in an AAV sample, and UV–Vis deconvolution can be used to determine whether there is an overabundance of DNA in a sample. Failing one of or more of these criteria can indicate that a sample needs additional processing.
Discussion
rAAV vectors are an outstanding tool for therapeutic gene delivery, as demonstrated by both clinical and commercial successes. Although most biological candidates are still recombinant proteins/mAbs, viral gene therapy candidate products, fueled by these successes and investments, are growing at a faster pace. Similar to mAbs, viral gene therapy products, including rAAV, are considered and regulated as biological products.
This is appropriate, as biosafety concerns, such as demonstrating the absence of adventitious agents, are applicable to both. However, with regard to product characterizations, rAAVs are significantly larger than mAbs and are much more complex in nature, bringing unique challenges to characterization. To exacerbate this challenge, the amount of available volume for testing is more limited, as the final volume from a viral vector manufacturing process is much less than that from a mAb production process.
The Stunner instrument combines well-established UV–Vis spectroscopy with innovative techniques in SLS/DLS to provide rapid results from each technology individually and from the combination synergistically. UV–Vis spectroscopy evaluates the concentration of DNA and protein components in an AAV sample while detecting and quantifying manufacturing process impurities such as iodixanol. DLS rapidly detects the average hydrodynamic size and size distribution, enabling a qualitative assessment of purity, sensitive detection of aggregates, and confirmation of the expected size.
The pairing of UV–Vis and SLS/DLS technologies in Stunner adds valuable practical insight into the rapid estimation of titer since the two techniques complement each other. On their own, SLS and DLS can measure the light scattering behavior of AAV capsids, but an accurate measurement of either the empty/full ratio or refractive index is needed to calculate accurate titers. The percentage full calculation provided by UV–Vis spectroscopy is the missing piece of the puzzle to more accurately estimate titer based only on light scattering properties.
Our study with different rAAV vectors produced at the manufacturing production scale can measure titer, percentage full, aggregation, total protein, and total DNA content from a single measurement consisting of a 2 μL sample volume for one reading. With the use of the software, the analysis of the data can be performed in <1 min per sample, making the total assay turnaround time of ∼1 h for 96 samples. The sample for this assay should be sufficiently pure (e.g., 99% viral bands as evaluated by silver-stained sodium dodecyl sulfate–polyacrylamide gel electrophoresis [SDS–PAGE] gel) with an expected concentration of 1E+12 vp/mL range to produce accurate values. Host cells' contaminating nucleic acids or proteins will provide a high background reading, as the UV readings are not specific to AAV.
One of the challenges facing viral vector manufacturers is determining the empty/full ratio of particles produced during a manufacturing run. Empty particles are an undesired byproduct and have no therapeutic benefit and can potentially have detrimental clinical effects. It is still unknown what causes the formation of empty particles, but it is intrinsically linked to the production process. The percentage full value is a critical product attribute that must be analyzed to ensure the quality and safety of the product and can be used as a critical quality attribute to monitor the process consistency.
Using the same rAAV samples, we compared percentage full values generated from Stunner to the values using conventional methods. The combined UV–Vis and DLS technologies in Stunner produce percentage full and titer values that are very consistent with results from an optimized qPCR assay for full capsid titer and ELISA for total capsid titer. It is important to note that the Stunner analysis is not serotype specific, whereas qPCR and ELISA require gene-specific primers or serotype-specific antibodies, respectively, to perform the analysis.
Moreover, the time to complete the conventional molecular assays is much longer in comparison. More variation was seen when compared with TEM and AUC. Although not evaluated with the limited data set performed here, it is expected that the inter/intravariability seen with TEM/AUC would be much wider than is expected with the molecular assay.
Owing to the limited data set, it is difficult to determine from this analysis the actual true value for the empty/full ratio from the values presented here. Further analysis is needed to compare empty/full measurements given by the available techniques (e.g., AUC, TEM, combined UV–Vis/SLS/DLS, SLS/DLS, combined PCR and ELISA, and High-performance liquid chromatography (HPLC)) along with a full understanding of the standard deviation of each of the values for the methods.
With titer, percentage full, size, aggregation, total protein, and total DNA content from a single assay, the potential applications for the assay performed by Stunner span research, manufacturing, and QC needs for downstream samples.
Conclusions
The use of high-throughput low-volume analytical methods is increasingly central in conserving time and sample when assaying AAV titer, empty/full ratio, size, and aggregation. Stunner's approach to combine UV–Vis spectroscopy, SLS, and DLS makes for a promising technology that delivers multiple data points on a minimal sample volume and in a minimal time. This approach is applicable to multiple serotypes, genome constructs, and purification strategies and adds a complementary and orthogonal approach to other current techniques such as qPCR, ELISA, TEM and AUC.
Future study will be needed to explore the advantages and disadvantages of each method and to elucidate the optimal approaches for any given sample and purification strategy. In this article, we have taken the first step in that direction by recommending a set of sample criteria guidelines that inform whether samples are suitable for Stunner analysis. Combined UV/Vis, SLS, and DLS is a rapid and powerful analytical tool that fulfills a need for rapid and low-volume AAV gene therapy vector quantification, characterization, and quality assessment in development and manufacturing environments.
The Bigger Picture
Materials and Methods
Manufacture of AAV vector products
Specific detail on manufacturing conditions is available in Supplementary Table S1. In general, 293T cells in suspension were cotransfected with plasmid DNA that contains either genetically modified AAV with the desired gene fragment insertion or helper viral DNA for the rep and cap of AAV and E1/E4 of adenovirus (double or triple transfection) by polyethylenimine. The transfected cells were grown and selected in suspension culture, and finally expanded in a bioreactor for 48–72 h under optimal culture conditions.
The accumulated intracellular AAV vector virions were harvested and released from the cells by repeated freeze
The methods used for vector purification include (1) TFF, (2) UF/DF, (3) CMF, (4) CsCl density gradient ultracentrifugation, (5) iodixanol density gradient ultracentrifugation, and (6) size exclusion or ion exchange chromatography. The purified final AAV drug substance (raw material) and product (ready to use) were aliquoted and cryopreserved below −65°C for single use.
Viral particle quantification by sandwich ELISA
The serotype-specific capsid sandwich ELISA kits for AAV2, AAV3, AAV5, AAV6, AAV8, and AAV9 were purchased from Progen (Cat No.: PRAAV2, PRAAV3, PRAAV5, PRAAV6, PRAAV8, PRAAV9). For each AAV serotype, only assembled AAV viral particles from the test sample were captured by a conformational epitope-specific anti-AAV monoclonal antibody coated on the ELISA plate. The addition of a biotin-conjugated serotype-specific monoclonal antibody results in an immune complex.
The immune complex is detected by a streptavidin–horseradish peroxidase (HRP) conjugate upon binding of streptavidin to biotin. Addition of an HRP-specific substrate solution results in a color-change reaction whose absorbance measured at 450 nm is directly proportional to the amount of specifically bound AAV viral particles.
Each kit contains its unique serotype-specific AAV as a standard. Serially diluted AAV standards were used to generate a standard curve for viral particle quantification. To ensure the accuracy of the quantification, the test samples were also serially diluted proportionally to the optimal detection range of the assay.
Viral genomic copy quantification by qPCR
qPCR was used to determine AAV vector genome titer, amplifying either an AAV-specific gene fragment or the inserted gene of interest (GOI) fragment. For AAV-specific qPCR, a 62 base pair long fragment located in the ITR site was amplified (forward primer: 5′-GGAACCCCTAGTGATGGAGTT-3′, and reverse primer: 5′-CGGCCTCAGTGAGCGA-3′). For GOI-specific qPCR, the primer pairs were designed and provided by the customer. For genomic copy quantification, a linearized plasmid DNA specific for the individual rAAV vector was diluted to generate a standard curve [from 1 × 10⁸ genome copies (gc)/μL to 1 × 10³ gc/μL on a log10 scale].
In brief, the individual samples were pretreated with DNase I (NEB) at 37°C for 30 min to clear out unassembled extravirion DNA and contaminated host cell DNA. The assembled vector DNA was further released from the virion by proteinase K digestion (Thermo Fisher or NEB) at 37–56°C for another 10–30 min. The samples were then subjected to additional DNA purification by a Qiagen DNA purification kit or directly used after Proteinase K digestion for qPCR quantification. For accurate quantification, the samples were serially diluted to optimal concentrations to fall within the range of the standard curve. At least two to three dilutions within the detection range were used to determine the final concentration.
The PCRs were performed in 0.2 mL 96-well PCR plates by mixing samples with diluted primers and 2 × SYBR green PCR master mix (Thermo Fisher). The PCR was carried out on an Applied Biosystems QuantStudio 5 Thermal Cycler. The thermal cycling conditions included a hold at 50°C for 2 min, hold at 95°C for 10–15 min, 40 PCR cycles of denaturation at 95°C for 15 s, and annealing/extension at 56–60°C for 1 min, according to individual primer pairs. The thermal cycling was followed by a melt curve: 95°C for 15 s/60°C for 1 min/95°C for 1 s.
Vector genome titers were calculated by multiplying the genome copies per well with the dilution factors and assuming that one copy of double-stranded plasmid DNA is equivalent to two single-stranded vector genomes, therefore, multiplying further by a factor of 2 for final vector genome per milliliter.
Viral vector purity evaluation by silver staining
The purity of the drug substance or final drug product was checked and confirmed by silver staining (Supplementary Figs. S1 and S2). Viral particles (1 × 10¹⁰ to 5 × 10¹⁰) were serially diluted with gel loading buffer and/or drug formulation buffer, denatured at 95°C for 10 min and separated by SDS–PAGE on NuPAGE 4–12% Bis-Tris gels (Thermo Fisher) under reducing conditions. The AAV2 reference virus from ATCC (Cat No.: ATCC 1616) was used as a positive control.
After gel fixation (40% methanol and 10% acetic acid in deionized water) and washing (30% ethanol solution in deionized water), the gel was sequentially primed with sodium thiosulfate (12.65 mM, 1 min), stained with silver nitrate (6 mM, 20 min), and developed (sodium carbonate, 0.57 M for 20 s to 10 min). The visible protein bands were fixed and imaged for data analysis by densitometry. The size of each protein band was calculated by comparing the individual protein migration rate in the gel with a protein ladder (Mark12, Thermo Fisher). Densitometric analysis for entire gel lane band intensities (Band%) was performed with Bio–Rad Image Lab software.
AAV-specific protein identification by Western blot
AAV-specific capsid proteins (VP1, VP2, and VP3) in drug substances or final drug products were identified by specific rabbit polyclonal antibodies against VP1/VP2/VP3 (Cat. No.: 61084; Progen). Since all three capsid proteins are transcribed from the same DNA sequence and share homology, we confirmed that the capsid proteins from different serotypes of AAV, including AAV2, AAV3, AAV5, AAV6, AAV8, and AAV9, can all be recognized by this antibody.
Viral particles (1 × 10⁸ to 1 × 10⁹) were serially diluted with gel loading buffer and/or drug formulation buffer, denatured at 95°C for 10 min and separated by SDS-–PAGE on NuPAGE 4–12% Bis-Tris gels (Thermo Fisher) under reducing conditions. The separated proteins were electrically transferred onto a PVDF membrane. After blocking the membrane with 5% nonfat dry milk (BLOTTO, Rockland) in 1 × tris-buffered saline Tween 20 (TBST), it was developed with rabbit anti-VP1/VP2/VP3 antibody and HRP-conjugated goat antirabbit IgG H&L (Cat. No.: ab205718; Abcam).
The VP1/VP2/VP3 bands were visualized by the addition of WesternSure PREMIUM Chemiluminescent Substrate (Cat. No.: 926-95000; LICOR) and captured by a Li-Cor imaging system. The band sizes were determined on the membrane by comparing their migration rates with WesternSure Prestained Chemiluminescent Protein Ladder (Cat. No.: 926-98000; LICOR).
Consecutive UV–Vis light absorption and SLS/DLS analysis of the AAV vector samples by Stunner
Stunner (Unchained Labs) combines UV–Vis spectroscopy (from 230 to 750 nm) with DLS using a 660 nm laser. Using the built-in AAV Quant application, multiple parameters, including titer, empty/full ratio, size, and polydispersity, and protein and DNA quantification of AAV particles, can be obtained simultaneously. The instrument uses a specifically designed 96-well plate (Cat. No. 701-2025; Unchained Labs) to perform the assay. In brief, 2 μL undiluted or serially diluted sample in PBS was loaded in the wells in duplicate or triplicate.
The AAV Quant application was selected in the Lunatic & Stunner Client software using four DLS acquisitions of 5 s each. Autoblanking or water blanking was used to avoid the risk of overcorrection by buffer blanking during UV–Vis deconvolution. The UV–Vis and DLS results were analyzed with Lunatic & Stunner Analysis software using analytes of the indicated AAV serotypes and ITR-to-ITR genome lengths. In brief, SLS is used to assay the intensity of light scatter from a sample, which corresponds to a possible range of titers. DLS was next used to reduce the total SLS intensity to only the proportion attributable to AAV capsids and not particles larger or smaller than capsids.
Finally, UV–Vis spectroscopy results were used to determine an empty/full ratio that identifies the best titer result out of the range identified by SLS and DLS. The DLS results reported were z-average diameter, derived intensity, and PDI, which is square of the z-average standard deviation divided by the z-average. PDIs >0.2 indicate highly polydispersed samples, whereas PDIs ≤0.1 are typical of monodispersed samples. 24 Results were evaluated against defined criteria to confirm samples were within appropriate detection limits for the assay.
AAV vector characterization by other methods
Additional AAV vector product characterization was performed in contract testing laboratories to identify and confirm the drug qualities and quantities. Empty versus full viral particle assays by TEM were performed by Charles River Laboratories, Vironova, or Creative Biostructure. AUC was performed by Wuxi Biologics.
Statistical analysis of the data
Means and standard deviations were calculated for technical duplicates or triplicates. Empty/full ratio of vector particles was calculated by intravirion genomic copy numbers (qPCR)/assembled virion particle numbers (ELISA) × 100%. Student's t test was used for statistical analysis of the data.
Footnotes
Authors' Contributions
Q.Y., R.W.W., K.L., and A.C. conceived the idea and designed experiments. Q.Y, and T.K. performed the experiments and characterized the assay protocols. R.W.W., N.D., K.L. and A.C. evaluated analytical protocols. All authors discussed the results and wrote the manuscript.
Author Disclosure Statement
Q.-E.Y., T.K., and A.C. are all employees of Vigene Biosciences, A Charles River Laboratory Company. R.W.W., N.D., and K.L. are all employees of Unchained Labs.
Funding Information
This study was supported by Vigene Biosciences, A Charles River Laboratory Company, and Unchained Labs.
References
Supplementary Material
Please find the following supplemental material available below.
For Open Access articles published under a Creative Commons License, all supplemental material carries the same license as the article it is associated with.
For non-Open Access articles published, all supplemental material carries a non-exclusive license, and permission requests for re-use of supplemental material or any part of supplemental material shall be sent directly to the copyright owner as specified in the copyright notice associated with the article.