
Abstract
Foodborne illnesses cause a significant health burden, with Campylobacter and norovirus the most common causes of illness and Salmonella a common cause of hospitalization and occasional cause of death. Estimating the cost of illness can assist in quantifying this health burden, with pathogen-specific costs informing prioritization of interventions. We used a simulation-based approach to cost foodborne disease in Australia, capturing the cost of premature mortality, direct costs of nonfatal illness (including health care costs, medications, and tests), indirect costs of illness due to lost productivity, and costs associated with pain and suffering. In Australia circa 2019, the cost in Australian Dollars (AUD) of foodborne illness and its sequelae was 2.44 billion (90% uncertainty interval 1.65–3.68) each year, with the highest pathogen-specific costs for Campylobacter, non-typhoidal Salmonella, non-Shiga toxin–producing pathogenic Escherichia coli, and norovirus. The highest cost per case was for Listeria monocytogenes (AUD 776,000). Lost productivity was the largest component cost for foodborne illness due to all causes and for most individual pathogens; the exceptions were pathogens causing more severe illness such as Salmonella and L. monocytogenes, where premature mortality was the largest component cost. Foodborne illness results in a substantial cost to Australia; interventions to improve food safety across industry, retail, and consumers are needed to maintain public health safety.
Introduction
Foodborne illness is a significant cause of morbidity and mortality, with 40% of the global burden of foodborne disease in children younger than 5 years (Havelaar et al., 2015). Australians are estimated to experience an episode of foodborne gastroenteritis about once every 5 years (Kirk et al., 2014). In Australia and globally, norovirus and Campylobacter are among the most common causes of foodborne illness (Havelaar et al., 2015; Kirk et al., 2014). In addition to primary infection, some illnesses can lead to sequelae such as Guillain–Barré syndrome (GBS), irritable bowel syndrome (IBS), hemolytic uremic syndrome (HUS), and reactive arthritis (ReA). Estimates of the total cost of foodborne illness and its sequelae provide a measure of the impact on the population, while pathogen-specific costs can help to identify pathogens with a high disease burden.
The cost of foodborne illness has been estimated for several countries. In the United States, foodborne illness due to 15 specified pathogens was estimated to cost USD 15.5 billion each year circa 2013, with 84% of this total due to deaths (Hoffmann et al., 2015). In the United Kingdom, foodborne illness due to all causes was estimated to cost GBP 9.1 billion circa 2018, with 80% of the cost due to nonfinancial costs of pain, grief, and suffering (Daniel et al., 2020). A costing study of six pathogens in New Zealand estimated annual costs of NZD 163 million circa 2009, with campylobacteriosis resulting in the greatest cost (Gadiel and Abelson, 2010). In the Netherlands, the cost of illness due to 14 specified pathogens was estimated at EUR 423 million circa 2019, with norovirus contributing the greatest cost (Lagerweij et al., 2020).
The cost of foodborne illness in Australia was previously estimated by Abelson et al. (2006) to be Australian Dollars (AUD) 1.2 billion circa 2004, with productivity and lifestyle costs the largest component. Pathogen-specific costs were only provided for pathogens such as Listeria monocytogenes that do not cause gastroenteritis. This study updates that costing using a previously developed model of the burden of foodborne illness (Ford et al., 2014; Kirk et al., 2014) together with more recent data inputs, including data from an Australian discrete choice experiment (DCE) designed to estimate the willingness to pay (WTP) to avoid pain and suffering due to foodborne illness (Centre for Health Economics Research and Evaluation, 2017). We estimated total costs of foodborne illness and its sequelae and pathogen-specific costs for 10 foodborne pathogens selected through a prioritization process (Glass et al., 2016). As the COVID-19 pandemic may have influenced notification data (Davis et al., 2022), we elected to use data before the pandemic and provide costs circa 2019.
Methods
A detailed description of the costing model, including estimates of the burden of disease and the data inputs to the model, is provided in the Supplementary Material. All data used in this study is publicly available or previously published and so ethics approval was not required.
Our costing model included resources that were estimated and valued individually to allow costs to be disaggregated. The model includes the cost of premature mortality, direct costs of illness (including health care costs, medications, and tests), indirect costs of illness due to lost productivity, and nonfinancial costs associated with pain and suffering (Fig. 1). Premature mortality was costed using the value of a statistical life (VSL) (Australian Government Department of Prime Minister and Cabinet Office of Best Practice Regulation, 2019), while direct costs were sourced from administrative health care data. In our main analysis, we used the human capital approach to cost lost productivity, with the friction cost model (Hubbell, 2002) used in sensitivity analyses (Supplementary Material, Section 1.3). We estimated the costs of pain and suffering using WTP values from an Australian DCE (Centre for Health Economics Research and Evaluation, 2017) (Supplementary Material, Section 1.4).
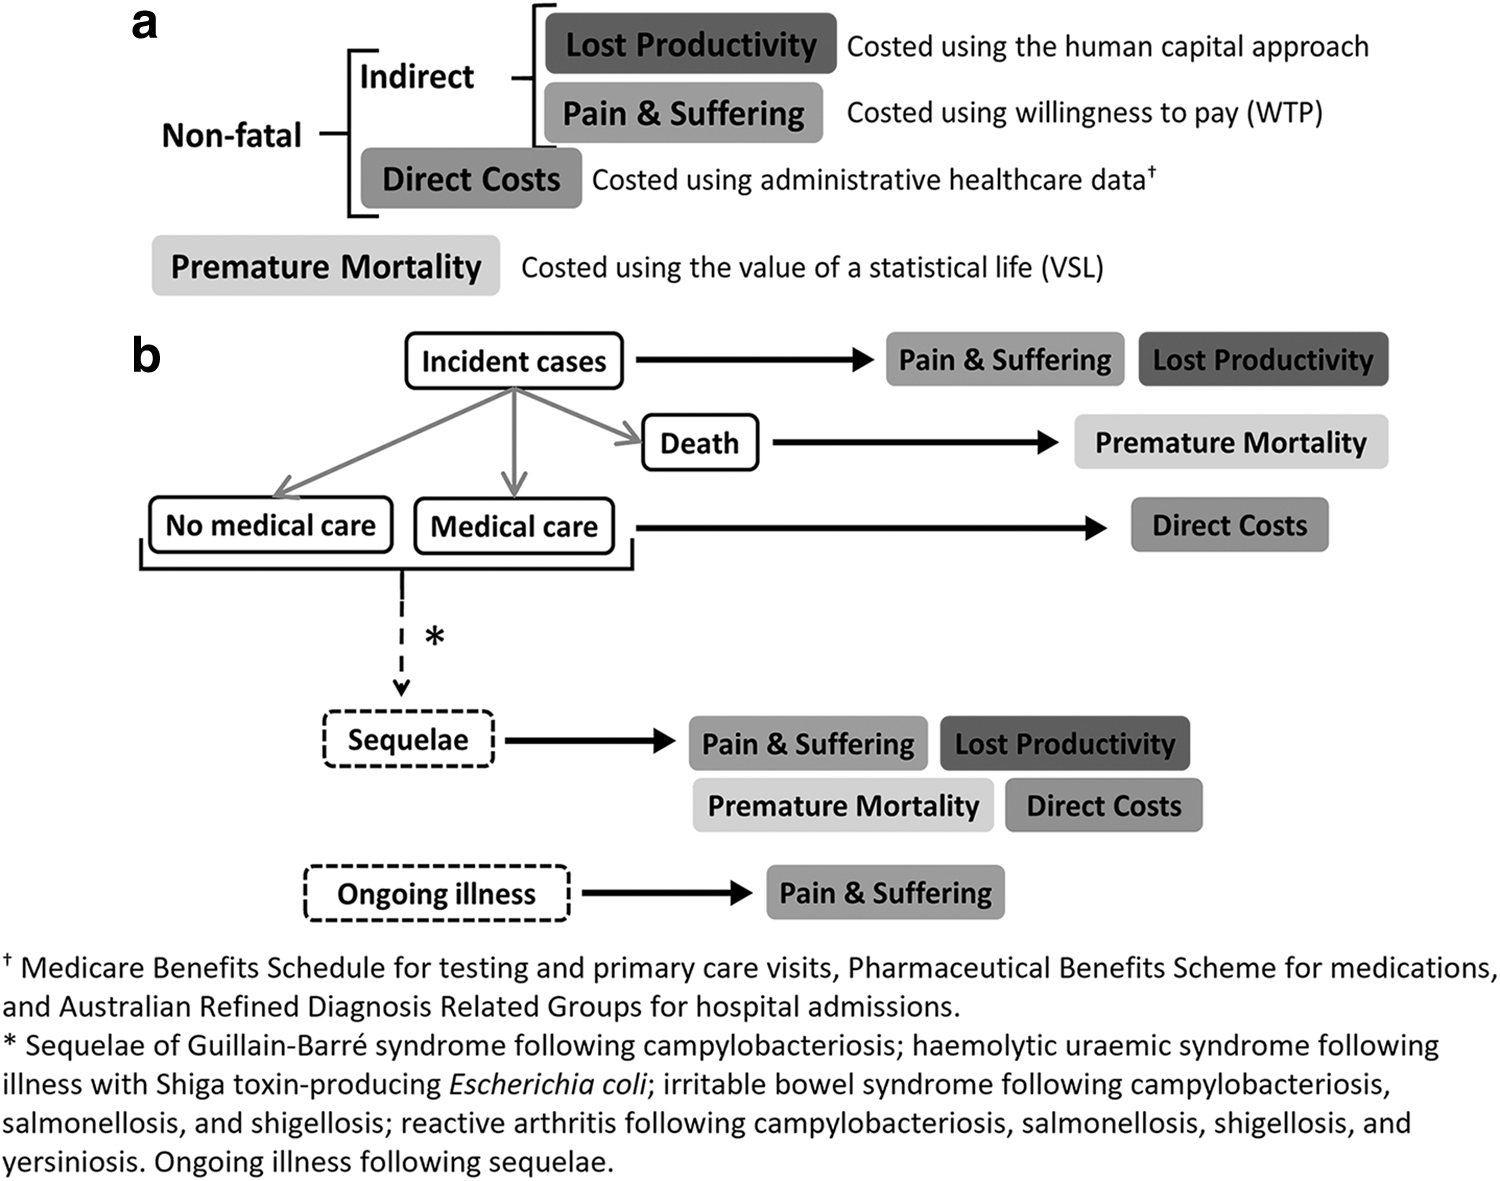
The costing model: (
Estimating the burden of illness
We first estimated the extent of foodborne illness. The estimation of epidemiological disease burden followed earlier work (Ford et al., 2014; Kirk et al., 2014) and captured illness, hospitalizations, and deaths due to foodborne disease and due to four sequelae: GBS, HUS, IBS, and ReA. Incidence was estimated using two main approaches. For notifiable conditions, the surveillance approach used national- or state-level surveillance data, adjusted for underreporting and overseas acquisition. For non-notifiable conditions, the pathogen fraction approach estimated the incidence of all-cause gastroenteritis and apportioned this across specific pathogens (Supplementary Fig. S1). We estimated the number of visits to primary health care or the emergency department from a national gastroenteritis survey for pathogens causing gastroenteritis and based on advice from clinicians for pathogens that do not cause gastroenteritis (such as L. monocytogenes) (Supplementary Material, Section 2.3).
Hospitalizations were estimated from administrative health care data for most pathogens, except those pathogens or illnesses for which we assumed that all incident cases were hospitalized (Supplementary Material, Section 2.4). Deaths were estimated using data provided by the Australian Bureau of Statistics (Supplementary Material, Section 2.5), with additional deaths in neonates due to listeriosis estimated from OzFoodNet annual reports (The OzFoodNet Working Group, 2021a; The OzFoodNet Working Group, 2021b; The OzFoodNet Working Group, 2018; The OzFoodNet Working Group, 2015). For both hospitalizations and deaths, we included an underdiagnosis multiplier, as recorded hospitalizations and deaths capture only laboratory-confirmed cases (Kirk et al., 2014). All burden of illness estimates were multiplied by the proportion of illness that is due to food, where this multiplier was estimated through an expert elicitation process (Vally et al., 2014). Estimates were additionally adjusted for the proportion of illness that was domestically acquired, as in previous work (Kirk et al., 2014).
Although foodborne illness is typically self-limiting, ongoing illness (symptoms that persist beyond the typical disease course) can occur following listeriosis and toxoplasmosis (Austhof et al., 2021). We captured these chronic disease states in health outcome trees (Supplementary Material, Section 4) but were not able to find Australian studies on health care usage or lost productivity, and the DCE estimating WTP to avoid pain and suffering did not include ongoing illness due to toxoplasmosis or listeriosis. We were therefore unable to cost ongoing illnesses for listeriosis or toxoplasmosis.
The incidence of sequelae (Supplementary Material, Section 2.6) was estimated by multiplying the incidence of primary illnesses by sequelae multipliers for pathogen/sequelae pairs, while hospitalizations and deaths were estimated as for primary illness. The proportion of cases of sequelae experiencing ongoing pain and suffering was determined from the literature (see health outcome trees in the Supplementary Material, Section 4). We were unable to find studies with sufficient follow-up to fully quantify this ongoing burden of disease and thus made the conservative choice to cost only pain and suffering beyond the first year of illness for sequelae.
Estimating the cost of illness
We used the VSL of AUD 4.9 million for fatalities as recommended by the Office of Best Practice Regulation (Australian Government Department of Prime Minister and Cabinet Office of Best Practice Regulation, 2019). Direct costs were sourced from the Medicare Benefits Schedule, the Pharmaceutical Benefits Scheme, and the Australian Refined Diagnosis Related Groups (Supplementary Material, Section 3.2). Lost productivity for cases and their carers was estimated using data from a National Gastroenteritis survey, the length of stay for hospitalized cases, and the literature (Supplementary Table S1), assuming a 5-day work week and using workforce participation data (Australian Bureau of Statistics, 2021).
Our primary estimates of lost productivity adopted the human capital approach, but we compared this with a friction cost model with a 3-month threshold and high (0.8) and low (0.3) multiplier (Supplementary Material, Section 3.3). Daily WTP values were used to cost pain and suffering for primary illness and yearly values for sequelae (Supplementary Tables S2 and S3, Supplementary Material, Section 3.4), costing ongoing pain and suffering for a proportion of those with sequelae (Supplementary Material, Section 3.5). Note that loss of personal time is not included in lost productivity. We separately value the cost of pain and suffering, which will overlap with the value of leisure and home production. To cost both could result in double counting.
We conducted an international comparison of the cost per case and the cost per population of this study with cost of foodborne illness studies conducted in the Netherlands (Lagerweij et al., 2020), New Zealand (Gadiel and Abelson, 2010), the United Kingdom (Daniel et al., 2020), and the United States (Hoffmann et al., 2015) to inform our estimates. Given a choice of U.S. studies (Minor et al., 2015; Scharff, 2012), we selected the U.S. study with the most similar costing approach to ours (both Minor et al. and Scharff used monetized Quality-adjusted life year [QALYs]). Costs were converted to 2022 U.S. dollars using the CCEMG–EPPI-Centre Cost Converter (
The model was implemented in R (version 4.1.2;
Results
Circa 2019, we estimated 4.7 million episodes of foodborne gastroenteritis annually, with norovirus, non-Shiga toxin–producing (non-STEC) pathogenic Escherichia coli, and Campylobacter the most frequent causes of illness (Table 1). Campylobacter, Salmonella, and norovirus were the most common causes of hospitalization for primary illness, with L. monocytogenes, non-typhoidal Salmonella, and Campylobacter the most common causes of death. While IBS and ReA were the most common sequelae following foodborne illness, GBS and HUS were the most common causes of death due to sequelae following foodborne disease.
Annual Cases, Hospitalizations, and Deaths Due to Foodborne Pathogens and Their Sequelae, Australia, Circa 2019
All cases assumed to be hospitalized.
UI, uncertainty interval.
Foodborne illness costs Australia AUD 2.44 billion (90% UI: 1.65–3.68 billion) each year circa 2019 (Table 2). Campylobacter (AUD 365 million), non-typhoidal Salmonella (AUD 140 million), non-STEC pathogenic E. coli (AUD 133 million), and norovirus (AUD 128 million) were estimated to have the highest cost when sequelae following primary illness are included (Table 2 and Fig. 2). Lost productivity was the largest component cost for all foodborne illness (64% of the total cost) and for Campylobacter (41%), norovirus (79%), Shigella (35%), non-STEC pathogenic E. coli (72%), Toxoplasma gondii (38%), and Yersinia enterocolitica (37%). Premature mortality was the largest component cost for L. monocytogenes (95%), non-typhoidal Salmonella (40%), and STEC (75%), with the latter largely driven by premature mortality due to HUS.
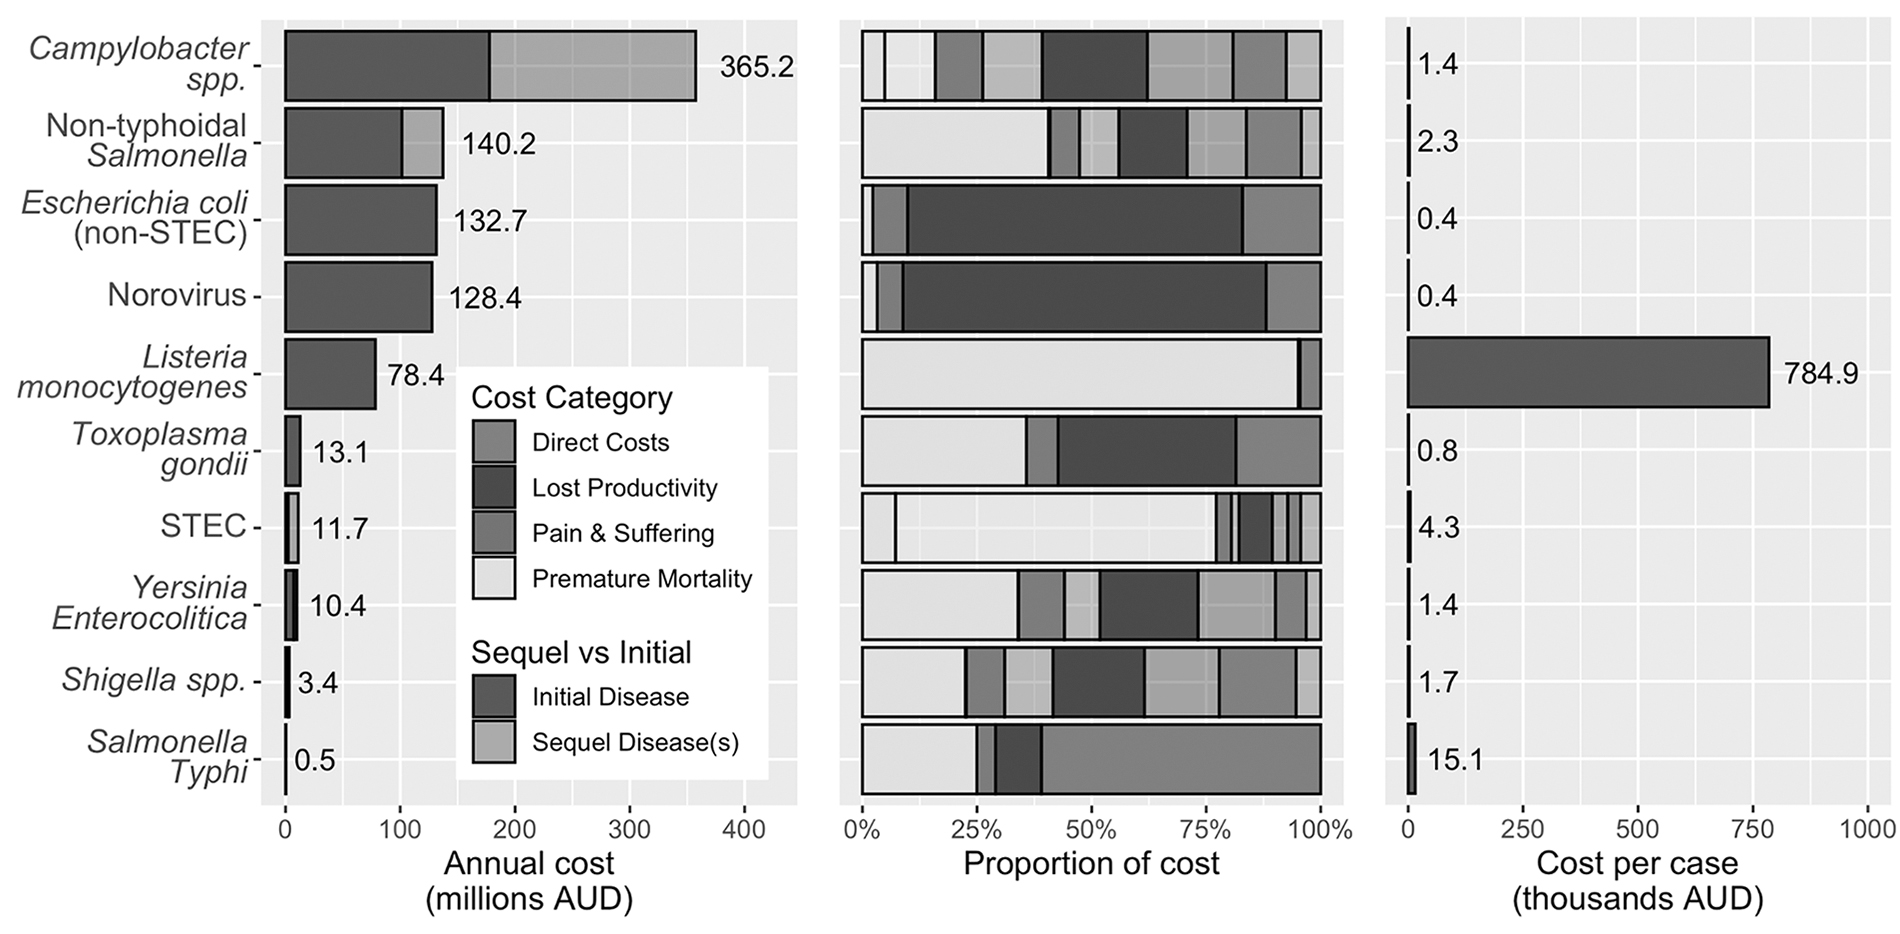
Total cost of illness, proportion of costs by category, and cost per case by pathogen including sequelae. AUD, Australian Dollars; STEC, Shiga toxin-producing Escherichia coli.
Cost of Foodborne Illness and Sequelae, Australia, Circa 2019
Includes costs due to sequelae.
All cases assumed to be hospitalized.
The largest component costs for Salmonella Typhi were the direct costs, largely related to hospitalization. Although the cost of pain and suffering was not the largest component cost for any individual pathogen, it was the largest component for IBS. Costs due to lost productivity were largely from the 5- to 64-year-old age group, with generally higher numbers of deaths and thus costs due to premature mortality in the 65+-year age group (results not shown). Using the friction cost method for estimating lost productivity in a sensitivity analysis reduced the total cost of foodborne illness to AUD 2.13 billion (friction cost high) and AUD 1.36 billion (friction cost low).
The pathogen with the highest estimated cost per case was L. monocytogenes (AUD 785,000; 90% UI: 482,000–1,590,000), followed by Salmonella Typhi (AUD 15,100; 90% UI: 11,700–33,200), and STEC (AUD 4330; 90% UI: 2210–10,000), with costs per case of over AUD 1000 for Campylobacter, non-typhoidal Salmonella, Shigella, and Y. enterocolitica (Fig. 2).
Table 3 presents the cost per case and the cost per population for the 10 pathogens from 4 other high-income countries as a point of comparison. The cost per case was highest for L. monocytogenes across all countries, with lower costs per case for pathogens such as norovirus that typically have a milder disease course. The cost per case estimated in this study for T. gondii was notably lower than other countries, even when considering interval estimates (e.g., the U.S. study puts a range of $2 billion to $4.9 billion per year on the total cost of foodborne toxoplasmosis). Within our study, the cost per population was highest for Campylobacter, Salmonella, norovirus, and non-STEC pathogenic E. coli. This is broadly similar internationally, although costs per population for T. gondii were higher in other countries, and costs per population for L. monocytogenes was higher in the U.S. study. Costs per population were generally low for less common pathogens such as Shigella, STEC, and Y. enterocolitica.
International Comparison of the Cost Per Case and the Cost Per Population in 2022 U.S. Dollars, Converted Using the CCEMG–EPPI-Centre Cost Converter
Cost per case = total cost/total cases; cost per population = total cost/total population.
Lagerweij et al. (2020).
Gadiel and Abelson (2010).
Daniel et al. (2020).
Hoffmann et al. (2015).
Discussion
Circa 2019, we estimated that foodborne illness and its sequelae costs Australia AUD 2.44 billion annually. Pathogens with the highest individual cost included Campylobacter, Salmonella, norovirus, and non-STEC pathogenic E. coli, with over half of the costs for Campylobacter due to its sequelae. Lost productivity was the largest component cost for all foodborne illness and most pathogens, with the exceptions being pathogens and their sequelae that cause more severe disease (L. monocytogenes, Salmonella, and STEC) where premature mortality was the largest component cost, and Salmonella Typhi where direct costs, primarily due to hospitalization, were the largest component.
Our primary model of lost productivity was the human capital approach, which values lost productivity based on average earnings and days of work lost due to illness (Supplementary Material, Section 1.3). Our alternative model—the friction cost model—recognizes that some work will be done by co-workers or by the unwell worker on return after their illness. Furthermore, the friction cost model assumes that workers will be replaced if the illness extends beyond the length of the friction period. Our assumption of a 3-month friction period is consistent with other studies (Health and Safety Executive, 2020; Kigozi et al., 2016; Pearce et al., 2018; Wilson et al., 2009) and had relatively little impact on cost estimates as few illnesses resulted in absence from work beyond the friction period.
In contrast, the friction cost value (representing the compensation effects of co-workers or returning workers) was influential, with the total cost of foodborne disease reduced to AUD 2.13 billion under the friction cost value of 0.8, and AUD 1.36 billion under the friction cost value of 0.3. A literature review of studies adopting the friction cost method found that few studies reported this friction cost value; however, among those that did, the most common value was 0.8 (Kigozi et al., 2016).
The cost of pain and suffering was estimated using WTP values from an Australian DCE (Centre for Health Economics Research and Evaluation, 2017) (Supplementary Materials, Sections 1.4 and 3.4). These WTP values were generally lower than those estimated from a similar study conducted in the United Kingdom (Economics for the Environment Consultancy Ltd et al., 2017), with particularly large differences for sequelae and for short-duration infectious gastroenteritis. Although both studies applied DCE methods, there were differences in the framing of the task and the attributes used to derive WTP measures, which could explain these differences (van der Pol et al., 2003). Increased standardization of DCE methods and the vignettes used to describe illness may assist in reducing international discrepancies in WTP values. Use of the VSL year or the monetary value of a QALY to measure pain and suffering are alternatives that have been considered elsewhere (Minor et al., 2015; Scharff, 2012).
An international comparison of the cost per case and the cost per population for the 10 costed pathogens across 5 high-income countries indicated that our costs were broadly comparable for most pathogens. A notable exception was our estimate of the cost per case of toxoplasmosis, which was substantially lower than estimates from the Netherlands and the United States. While some differences between international studies may be due to the approaches used, we attempted to minimize this by comparing studies with a broadly similar costing approach; it seems likely that the large differences for toxoplasmosis were due to our underestimation of ongoing illness.
Owing to a lack of long-term data, we did not cost ongoing illness following listeriosis or toxoplasmosis and considered only the costs of pain and suffering for ongoing sequelae. As such, costings for listeriosis, toxoplasmosis, and pathogens that can have sequelae are likely underestimated. Recent scoping reviews of post-infectious toxoplasmosis (Austhof et al., 2021) and of foodborne listeriosis (Pogreba-Brown et al., 2022) noted that very few studies followed up participants long-term. Similarly, there are limited data on long-term impacts of sequelae (Pogreba-Brown et al., 2020). Such studies tracking health care usage and lost productivity in individuals with ongoing illness are needed to fully cost these conditions.
Incidence of pathogens that are not notifiable in Australia was estimated using the national survey data from 2008 to 2009, population-adjusted to 2019. These data are now >10 years old and may no longer be representative of the Australian population. Notably, non-STEC pathogenic E. coli has one of the highest pathogen-specific cost estimated in this study, yet is very poorly understood. Further research may be needed to confirm this burden and provide evidence to support potential control measures. All estimates of the burden of foodborne disease rely on foodborne disease multipliers that capture the proportion of illness for each pathogen that is due to food. Further attribution of cases to the key foods responsible for illness may highlight priorities for intervention.
Estimating the total cost of foodborne disease provides evidence to support control efforts, while pathogen-specific costs help inform the prioritization of interventions toward those causing the greatest burden to society. The additional studies needed to inform this prioritization are those to assess cost-effectiveness (considering incremental costs and benefits) of possible interventions (Shiell et al., 1987), including consideration of costs to industry or costs of disease surveillance and control. Such studies would enable cost–benefit analyses of interventions in the community or in different industries.
Footnotes
Authors' Contributions
Conceptualization: K.G., J.M., B.D., S.S., and E.L. Methodology: K.G., S.B., E.L., and A.M. Software: A.M. Investigation: A.M., K.G., S.B., M.D.K., J.M., S.S., B.D., E.L., and D.M.C. Resources: S.B., D.M.C., A.M., S.S., J.M., and B.D. Writing—original draft: K.G., S.B., A.M., and D.M.C. Writing—review and editing: K.G., A.M., S.B., D.M.C., M.D.K., J.M., B.D., S.S., and E.L.
Disclosure Statement
No competing financial interests exist.
Funding Information
Funding for this study was provided by Food Standards Australia New Zealand (RFT NO 2020-21/03).
Supplementary Material
Supplementary Material
References
Supplementary Material
Please find the following supplemental material available below.
For Open Access articles published under a Creative Commons License, all supplemental material carries the same license as the article it is associated with.
For non-Open Access articles published, all supplemental material carries a non-exclusive license, and permission requests for re-use of supplemental material or any part of supplemental material shall be sent directly to the copyright owner as specified in the copyright notice associated with the article.