
Abstract
Salmonella enterica (S. enterica) is a commensal organism or pathogen causing diseases in animals and humans, as well as widespread in the environment. Antimicrobial resistance (AMR) has increasingly affected both animal and human health and continues to raise public health concerns. A decade ago, it was estimated that the increased use of whole genome sequencing (WGS) combined with sharing of public data would drastically change and improve the surveillance and understanding of Salmonella epidemiology and AMR. This study aimed to evaluate the current usefulness of public WGS data for Salmonella surveillance and to investigate the associations between serovars, antibiotic resistance genes (ARGs), and metadata. Out of 191,306 Salmonella genomes deposited in European Nucleotide Archive and NCBI databases, 47,452 WGS with sufficient minimum metadata (country, year, and source) of S. enterica were retrieved from 116 countries and isolated between 1905 and 2020. For in silico analysis of the WGS data, KmerFinder, SISTR, and ResFinder were used for species, serovars, and AMR identification, respectively. The results showed that the five common isolation sources of S. enterica are human (29.10%), avian (22.50%), environment (11.89%), water (9.33%), and swine (6.62%). The most common ARG profiles for each class of antimicrobials are β-lactam (bla TEM-1B; 6.78%), fluoroquinolone [(parC[T57S], qnrB19); 0.87%], folate pathway antagonist (sul2; 8.35%), macrolide [mph(A); 0.39%], phenicol (floR; 5.94%), polymyxin B (mcr-1.1; 0.09%), and tetracycline [tet(A); 12.95%]. Our study reports the first overview of ARG profiles in publicly available Salmonella genomes from online databases. All data sets from this study can be searched at Microreact.
Introduction
S
More than 2600 S. enterica serovars have been identified, S. enterica serovars Enteritidis and Typhimurium are the most commonly reported serovars causing human salmonellosis; however, other serovars appear to be more prevalent in other regions (Hendriksen et al., 2011). Changes in the occurrence of serovars or specific strains in human and animal populations may follow the introduction of the strain through international travel, human migration, food, animal feed, and livestock trade (Feasey et al., 2016; Key et al., 2020; Li et al., 2022a; Li et al., 2022b; Li et al., 2021; Pulford et al., 2021; Puyvelde et al., 2019).
However, despite the very large number of publications on the occurrence and diversity of Salmonella within individual countries, there are surprisingly few studies on the global distribution (Ferrari et al., 2019; Gutema et al., 2019; Qin et al., 2022; Ramtahal et al., 2022; Shen et al., 2022; Sun et al., 2021; Voss-Rech et al., 2017).
Whole genome sequencing (WGS) has been increasingly used to characterize bacterial isolates, for research, outbreak detection, and surveillance. A large part of these data are shared publicly and could potentially provide novel insights into the global distribution, diversity, and transmission of Salmonella serovars and AMR. Thus, a decade ago it was predicted that local sequencing and global sharing of WGS data would replace conventional testing and data sharing for global surveillance of probably initially foodborne pathogens, but eventually all pathogens (Aarestrup et al., 2012; Köser et al., 2012; Quainoo et al., 2017; Rossen et al., 2018; WHO, 2018).
However, despite being used for comparison with local surveillance initiatives, there has to the best of our knowledge never been any studies evaluating the usefulness of the publicly shared data for Salmonella surveillance.
This study aimed to investigate the current usefulness of these publicly available data for surveillance of Salmonella, the distribution overview of serovars, AMR, and the most common antibiotic resistance gene (ARG) profiles.
Materials and Methods
Data collection and standardization
A total of 191,306 Salmonella WGS data and metadata were downloaded from European Nucleotide Archive (ENA) (November 17, 2020). The metadata from the NCBI Pathogen Detection project was also downloaded and merged with the ENA metadata (November 17, 2020). Combined data that did not have information on either geographical location (country), isolation source (source), or year were excluded. Duplicate data from the same source or outbreak were also excluded. We did genome quality checking with FoodQCPipeline (CGE, 2016) and species confirmation with KmerFinder v.3.2 (default setting) (Clausen et al., 2018; Hasman et al., 2014; Larsen et al., 2014).
Low-quality genomes or non-S. enterica were excluded. Our final data set included 47,452 isolates from 116 different countries across 7 continents (Africa, Asia, Europe, the Middle East, North America, Oceania, and South America). The sources of isolates were clustered into 11 clusters (avian, bovine, environment, feed, food, human, nut/bean, others, plant, swine, and water). The isolates represented common serovars that were 70% of all identified serovars. The duration of isolation was 1905–2020. The data obtained from single countries might not reflect the epidemiological situation of Salmonella in the country because the reason for submitting the data to NCBI or ENA was not considered and remains unknown. All data sets can be searched at
Genome assembly and quality filtering
Assemblies were generated by the in-house software called FoodQCPipeline. The pipeline trimmed the raw reads using bbduk2 (part of BBtools version 36.49,
In silico analysis
The serovar of the 47,452 assembled genomes was predicted with SISTR v.1.1.1 with default setting (Yoshida et al., 2016) and compared with the reported serovar of the ENA and NCBI metadata. In case of disagreement between SISTR predictions and the informed serovar by ENA and NCBI metadata, the results of SISTR prediction with quality checking were considered. All failures of the quality checking results were classified as unidentified (n = 1729). For identification of ARGs, ResFinder v.4.1 was used with the default setting, at least 60% minimum length and 90% identity, for both chromosomal point mutation and acquired ARGs (Bortolaia et al., 2020; Camacho et al., 2009; Zankari et al., 2017).
Statistical analyses and visualization
The percentage of AMR was calculated by the number of positive-predicted AMR divided by the total number of samples (47,452). The proportion of ARGs was calculated by the number of positive-predicted ARGs divided by the total number of isolates in each continent, source, or serovar. The figures in this study were visualized in Microreact (Argimón et al., 2016).
Results
Information about the metadata
We found that only 25% of the isolates had sufficient epidemiological information to be useful for further analysis. The main reason for incomplete isolate data was lacking isolation year (70% of all downloaded data), whereas those isolates with missing country or source were 9.7% and 3.7%, respectively. The missing data were in isolates from humans in North America.
The distribution of S. enterica
The final data set consisted of WGS data and metadata of 47,452 S. enterica isolates. The data were classified into 11 sources and 22 serovars. The genomes were mainly from 2011 to 2020 (87.12%), followed by 2001–2010 (10.74%). Salmonella genomes were isolated from human (29.10%), followed by avian (22.50%), environment (11.89%), water (9.33%), swine (6.62%), bovine (6.49%), food (4.54%), plant (1.40%), feed (1.22%), nut/bean (0.33%), and others (5.72%).
The top 10 common serovars were Salmonella Enteritidis (13.84%), Salmonella Typhimurium (12.04%), Salmonella Newport (5.73%), Salmonella Infantis (5.50%), Salmonella Kentucky (4.55%), Salmonella Muenchen (3.04%), Salmonella Heidelberg (2.66%), Salmonella Javiana (2.41%), Salmonella Montevideo (2.38%), and Salmonella Anatum (2.35%) (Fig. 1 and Supplementary Data S1).

General information about distribution of Salmonella enterica, showing the most common years and serovars. The metadata and genomic analysis results of the 47,452 S. enterica isolates were categorized by year (number of isolates in each year period, n > 10)
The relative distribution of S. enterica isolates from South America was almost exclusively recovered from environment, water, or avian, whereas isolates from Europe, Africa, Asia, and especially Oceania were predominantly isolated from humans. The isolates from North America were mainly isolated from human and avian samples, whereas those from the Middle East were mainly recovered from human and food samples (Fig. 2).
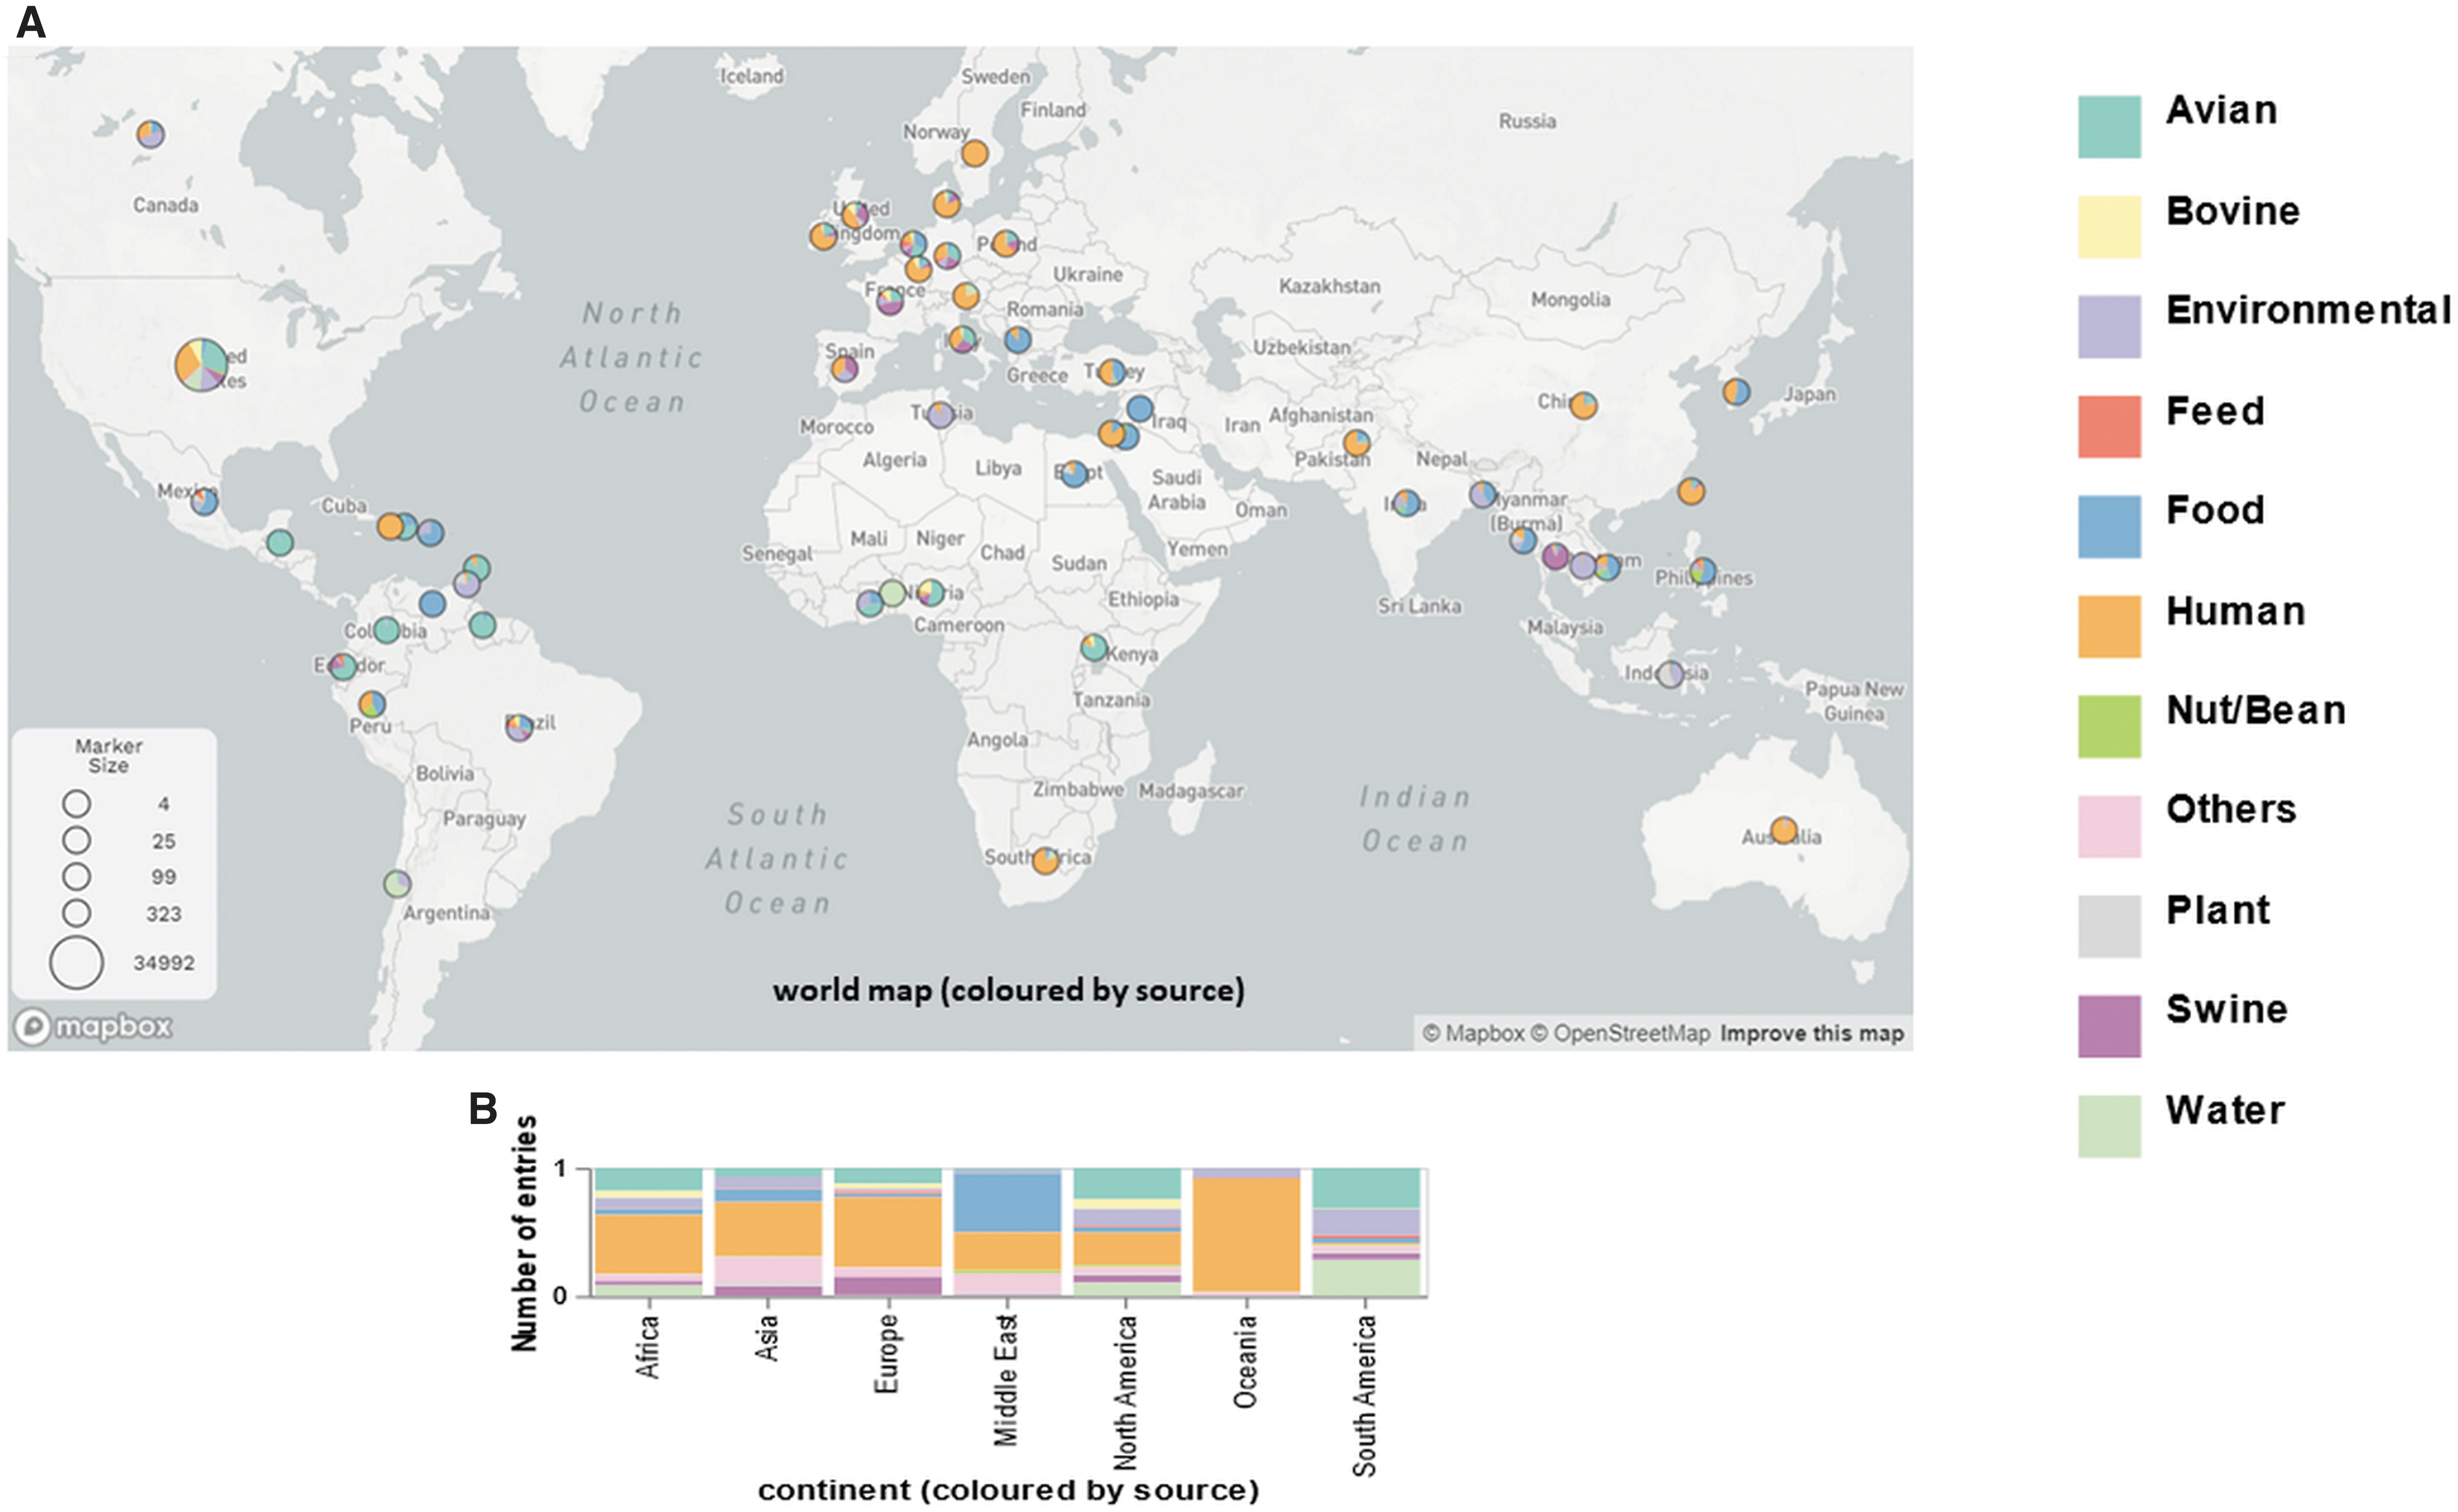
The distribution of Salmonella enterica in different isolation sources. The distribution of S. enterica was shown in the world map (number of isolates in each country, n > 10)
The distribution of Salmonella serovars was divided following the sources. In human samples, the most common serovars were Salmonella Enteritidis (8.54%), Salmonella Typhimurium (4.50%), and Salmonella Newport (2.00%). In avian samples, the most common serovars were Salmonella Kentucky (3.70%), Salmonella Enteritidis (3.16%), and Salmonella Infantis (2.76%). From environmental samples, the most common serovars were Salmonella Enteritidis (1.37%), Salmonella Newport (0.96%), and Salmonella Typhimurium (0.92%) (Supplementary Data S1).
From water samples, the most common serovars were Salmonella Newport (1.09%), Salmonella Typhimurium (0.78%), and Salmonella Muenchen (0.45%). From swine samples, the most common serovars were Salmonella Typhimurium (1.93%), Salmonella Derby (0.66%), and Salmonella Anatum (0.59%). From bovine samples, the most common serovars were Salmonella Dublin (1.03%), Salmonella Typhimurium (0.76%), and Salmonella Montevideo (0.68%) (Supplementary Data S1).
The distribution of AMR
To study the distribution of AMR, we investigated the resistance in each class of antimicrobials from WGS data of S. enterica. The results showed the percentage of AMR for aminoglycoside (98.39%), tetracycline (23.85%), folate pathway antagonist (18.63%), β-lactam (15.78%), phenicol (7.94%), fluoroquinolone (3.36%), polymyxin (1.18%) and macrolide (0.51%) (Supplementary Data S2).
The gene aac(6′)-Iaa (92.22%) was commonly found in S. enterica genomes. The gene was also detected together with other aminoglycoside genes as aac(3)-IV, aac(6′)-Iaa resistance gene profile (2.55%), and aac(3)-VIa, aac(6′)-Iaa resistance gene profile (1.11%). The aac(3)-IV, aac(6′)-Iaa profile was predominantly harbored by Salmonella Infantis. The aac(3)-VIa, aac(6′)-Iaa profile was predominantly harbored by Salmonella Heidelberg (Supplementary Fig. S1 and Supplementary Data S3).
Common β-lactam resistance gene profiles were bla TEM-1B (6.78%), bla CMY-2 (2.82%), and bla CTX-M-65 (1.68%). The bla TEM-1B was predominantly harbored by Salmonella Heidelberg, Salmonella Typhimurium, and Salmonella Saintpaul. The bla CMY-2 was the second most common resistance profile and was predominantly harbored by Salmonella Heidelberg and Salmonella Dublin. Furthermore, bla CTX-M-65 was predominantly driven by Salmonella Infantis. In addition, there were other β-lactam resistance gene profiles, bla CARB-2 (1.03%) and bla CMY-2, bla TEM1-B, bla TEM-206 profile (0.54%). The bla CARB-2 was predominantly carried by Salmonella Typhimurium. Whereas the bla CMY-2, bla TEM1-B, bla TEM-206 profile was driven by Salmonella Dublin (Fig. 3 and Supplementary Data S4).

The proportion of β-lactam resistance gene profiles in Salmonella enterica (positive prediction = 7490 isolates) was categorized by serovar.
Common fluoroquinolone resistance gene profiles were parC[T57S], qnrB19 profile (0.87%); aac(6′)-Ib-cr, parC[T57S] profile (0.54%); and qnrB19 profile (0.43%). The parC[T57S], qnrB19 profile was predominantly harbored by Salmonella Heidelberg. The aac(6′)-Ib-cr, parC[T57S] profile was predominantly carried by Salmonella Heidelberg. The qnrB19 was driven by several serovars (Fig. 4 and Supplementary Data S5).

The proportion of fluoroquinolone resistance gene profiles in Salmonella enterica (positive prediction = 1596 isolates) was categorized by serovar.
Common folate pathway antagonist resistance gene profiles were sul2 (8.35%); sul1 (4.23%); and dfrA14, sul1 profile (1.56%). The sul2 was predominantly harbored in Salmonella Reading, Salmonella Typhimurium, and Salmonella Dublin. The sul1 was predominantly carried by Salmonella Heidelberg, Salmonella Infantis, and Salmonella Derby. The dfrA14, sul1 profile was predominantly driven by Salmonella Infantis (Supplementary Fig. S2 and Supplementary Data S6).
Common macrolide resistance gene profiles were mph(A) (0.39%), mef(B) (0.07%), and msr(E) (0.03%). The mph(A) and mef(B) profiles were found in several serovars. The msr(E) profile was predominantly harbored by Salmonella Agona and Salmonella Typhimurium (Supplementary Fig. S3 and Supplementary Data S7).
Common phenicol resistance gene profiles were floR (5.94%), catA1 (0.51%), and cmlA1 (0.45%). The floR profile was predominantly carried by Salmonella Infantis and Salmonella Dublin. The catA1 profile was predominantly harbored in Dublin. The cmlA1 profile was prominently driven by several serovars (Supplementary Fig. S4 and Supplementary Data S8).
Common polymyxin resistance gene profiles were mcr-1.1 (0.09%), mcr-5.1 (0.04%), and mcr-3.1 (0.02%). The mcr-1.1 profile was driven by several serovars. The mcr-5.1 profile was predominantly carried by Salmonella Typhimurium and Salmonella 1,4,[5],12:i:- (Supplementary Fig. S5 and Supplementary Data S9).
Common tetracycline resistance gene profiles were tet(A) (12.95%), tet(B) (8.00%), and tet(G) (0.88%). The tet(A) profile was the most common tetracycline resistance profile predominantly harbored by Salmonella Derby, Salmonella Infantis, and Salmonella Dublin. The tet(B) profile was predominantly carried by Salmonella Kentucky. The tet(G) profile was predominantly harbored by Salmonella Typhimurium (Supplementary Fig. S6 and Supplementary Data S10).
Distribution of AMR in the United States
We found the same resistance gene profiles in the United States as in other countries. Common aminoglycoside resistance gene profiles were aac(3)-IV, aac(6′)-Iaa profile (2.06%) and aac(3)-VIa, aac(6′)-Iaa profile (1.33%). Common β-lactam resistance gene profiles were bla TEM-1B (4.33%), bla CMY-2 (3.36%), and bla CTX-M-65 (1.24%). Common fluoroquinolone resistance gene profiles were parC[T57S], qnrB19 profile (0.83%); aac(6′)-Ib-cr, parC[T57S] profile (0.69%); and qnrB19 (0.38%).
Common folate pathway antagonist resistance gene profiles were sul2 (7.68%); sul1 (4.22%); and dfrA14, sul1 profile (1.15%). Common macrolide resistance gene profiles were mph(A) (0.21%), mef(B) (0.04%), and msr(E) (0.03%). The most common phenicol resistance gene profile was floR (5.58%). Common polymyxin resistance gene profile was mcr-1.1 (0.003%). Common tetracycline gene resistance profiles were tet(A) (12.47%) and tet(B) (7.85%).
Discussion
WGS has enhanced studies about genomic diversity among Salmonella. It is also useful for global surveillance and AMR tracking (Gupta et al., 2019). We found that the highest number of Salmonella genomes with sufficient epidemiological information to be useful for surveillance, and studies of global dissemination were from the United States. Although Salmonella genomes from 116 countries were included, however, 25% of the genomes could skew the actual percentage of AMR and ARG profile results through incomplete metadata that were excluded.
This study suggests that the global generation of WGS data and sharing of completed metadata, especially year, country, and source, are essential and challenging for a continuous global surveillance overview of Salmonella apart from the cost of equipment and reagents and skills of laboratory technician and bioinformatician.
Salmonella Enteritidis and Salmonella Typhimurium were the most common serovars observed among the Salmonella serovars that was consistent with previous studies on global or regional collections (CDC, 2018a; EFSA-ECDC, 2021; Hendriksen et al., 2011; Rodrigues et al., 2020). The important isolation sources of both serovars were avian and human samples from several continents.
This study showed that >98.00% of S. enterica harbored the aac(6′)-Iaa gene. This was consistent with the study by Srednik et al. (2021) that found that Salmonella Dublin isolates (100%) in the United States recovered from cattle carried aac(6′)-Iaa gene detected using ResFinder. Consistently, S. enterica isolated from duck, chicken, and pig farms and retail markets in Eastern China harbored aac(6′)-Iaa gene by 95.00% (Tang et al., 2022).
This gene was not reported using AMRFinderPlus because it was ubiquitously found in Salmonella genomes and the presence or absence of this gene did not confer aminoglycoside resistance as a cryptic gene (Feldgarden et al., 2021; Magnet et al., 1999; Ramirez and Tolmasky, 2010; Salipante and Hall, 2003). The Resistome Tracker, a tool for exploration of AMR, stress, and virulence genes, showed that common aminoglycoside resistance genes were aph(6)-Id and aph(3″)-Ib (FDA, 2022).
Common β-lactam resistance gene profiles in S. enterica were bla TEM-1B, bla CMY-2, bla CTX-M-65, and bla CARB-2. Salmonella Enteritidis and Salmonella Typhimurium are the important serovars related to extended-spectrum cephalosporins (ESCs) in human infections (Arlet et al., 2006). These four profiles consisted of 12.31% of the 15.78% β-lactam resistance. The bla TEM-1B profile was dominantly harbored in Salmonella isolates worldwide (Eguale et al., 2017; García et al., 2019; Tang et al., 2022). A NARMS report showed that bla TEM, bla CMY, and bla CARB were the top three β-lactam resistance genes in the United States (CDC, 2018b).
This was consistent with the results from the Resistome Tracker that showed that bla TEM and bla CMY-2 were common β-lactam resistance genes (FDA, 2022). In addition, bla CTX-M-65 was predominantly carried by Salmonella Infantis. Several reports linked bla CTX-M-65 in Salmonella Infantis isolates in foods to those in humans (Brown et al., 2018; Granda et al., 2019; Martínez-Puchol et al., 2021). The bla CARB-2 profile was predominantly carried by Salmonella Typhimurium. The resistance to ESCs is a threat to public health and should be a concern (Livermore, 2012; Monte et al., 2020). Therefore, our information is useful for surveillance of β-lactam resistance in Salmonella especially in countries that use PCR-based detection.
Fluoroquinolone resistance usually results from a point mutation, predominantly in the conserved quinolone resistance-determining regions (QRDR i.e., gyr, par) and plasmid-mediated quinolone resistance [PMQR i.e., qnr, aac(6′)-Ib-cr, oqx] (Cuypers et al., 2018). Our results highlighted parC[T57S], qnrB19 profile; aac(6′)-Ib-cr, parC[T57S] profile; qnrB19 profile; parC[T57S], qnrS1 profile; and qnrS1 profile are the resistance profiles that could confer low-level resistance to fluoroquinolone (Acheampong et al., 2019; Nordmann and Poirel, 2005).
The five profiles composed 2.31% of the 3.36% fluoroquinolone resistance. The Resistome Tracker showed that gyrA[D87Y] and qnrB19 were common fluoroquinolone resistance genes (FDA, 2022). A study of Salmonella in Brazil showed that parC[T57S] was the most frequent in animal-based food (Rodrigues et al., 2020). Fluoroquinolones and third-generation cephalosporins are recommended for treating invasive Salmonella infections or patients at risk of developing an invasive infection (Shane et al., 2017).
Common folate pathway antagonist resistance gene profiles were sul2; sul1; and dfrA14, sul1. These three profiles composed of 14.14% of the 18.63% of folate pathway antagonist resistance. The sul2 profile was predominantly carried by Salmonella Typhimurium and Salmonella Dublin. This was consistent with the Resistome Tracker that showed that sul2 and sul1 were common folate pathway antagonist resistance genes (FDA, 2022). Interestingly, the dfrA14, sul1 resistance gene profile was predominantly harbored by Salmonella Infantis.
Common macrolide resistance gene profiles found in our study were mph(A), mef(B), and msr(E). These profiles composed of 0.49% of the 0.51% macrolide resistance. The mph(A) was predominantly carried by Salmonella Newport. The Resistome Tracker similarly showed that mph(A) was the most common macrolide resistance gene (FDA, 2022).
A common phenicol resistance gene profile was floR. The gene consisted of 5.94% of the 7.94% phenicol resistance gene profiles. The gene was predominantly harbored by Salmonella Infantis and Salmonella Dublin. The results from the Resistome Tracker showed that floR was the most common phenicol resistance gene (FDA, 2022).
There are two main resistance genes displaying resistance against polymyxin, (1) alteration of polymyxin resistance gene (i.e., pmr) and (2) plasmid-mediated colistin resistance mechanism (i.e., mcr). The most common mcr gene in our study was mcr-1.1 corresponding to 0.09% of 1.18% of the overall polymyxin resistance genes. Whereas mcr-9 (0.99%) was not associated with colistin resistance in Salmonella and Escherichia coli (Tyson et al., 2020).
Common tetracycline resistance gene profiles were tet(A) and tet(B). Both profiles consisted of 20.95% of the 23.85% tetracycline resistance. The Resistome Tracker also showed that tet(A) and tet(B) were common tetracycline resistance genes (FDA, 2022). In addition, a study of Salmonella in the last four decades in Brazil showed that tet(A) was highly frequent among analyzed WGS data (Rodrigues et al., 2020).
Conclusions
S. enterica can be found as a commensal organism or pathogen in animals and humans. AMR in S. enterica has increasingly impacted both animal and human health and remains a public health concern. Public online WGS data and shared metadata can improve global surveillance especially by supporting studies on Salmonella epidemiology and AMR. The results showed the distribution overview of serovars, AMR, and common ARG profiles. Salmonella Enteritidis and Salmonella Typhimurium were found on all continents and mainly recovered from avian and human samples.
Common AMR in S. enterica according to the class of antimicrobials was tetracycline (23.85%), folate pathway antagonist (18.63%), and β-lactam (15.78%). The most common ARG profiles in S. enterica were β-lactam (bla TEM-1B), fluoroquinolone (parC[T57S], qnrB19), folate pathway antagonist (sul2), macrolide [mph(A)], phenicol (floR), polymyxin B (mcr-1.1), and tetracycline [tet(A)]. This study showed that updating and sharing data are one of the key points for better surveillance of Salmonella.
Footnotes
Acknowledgment
The authors thank Judit Szarvas for assistance in downloading metadata and genomic sequences including valuable bioinformatic advice.
Authors' Contributions
F.M.A. and P.L. conceptualized the study. N.N. and A.G. downloaded and analyzed data. N.N. visualized the results and wrote the first draft. N.N., F.M.A., P.L., and P.M.K.N. participated in the result analysis and discussion. F.M.A., P.L., and P.M.K.N. edited the final version of the article. All authors contributed to reviewing and approving the final article.
Disclosure Statement
No competing financial interests exist.
Funding Information
This study was supported by the Novo Nordisk Foundation (Grant: NNF16OC0021856: Global Surveillance of Antimicrobial Resistance).
Supplementary Material
Supplementary Data
Supplementary Figure S1
Supplementary Figure S2
Supplementary Figure S3
Supplementary Figure S4
Supplementary Figure S5
Supplementary Figure S6
References
Supplementary Material
Please find the following supplemental material available below.
For Open Access articles published under a Creative Commons License, all supplemental material carries the same license as the article it is associated with.
For non-Open Access articles published, all supplemental material carries a non-exclusive license, and permission requests for re-use of supplemental material or any part of supplemental material shall be sent directly to the copyright owner as specified in the copyright notice associated with the article.