
Abstract
The PowerPlex® 35GY System is a 35-locus, eight-dye, STR multiplex optimized for use with Spectrum CE Systems. It simultaneously amplifies all CODIS and ESS markers, along with Amelogenin and DYS391 for gender determination. Penta D, Penta E, and SE33 are included for expanded database searching capability. Ten additional nonrapidly mutating Y-STR loci are included to enable familial searching and to assist with forensic casework on sexual assault evidence. Lastly, two Quality Indicators are added to provide indications of sample quality and amplification performance. The PowerPlex® 35GY System is designed to amplify DNA from purified extracts as well as direct amplification of database sample substrates. The availability of 8 colors allows the inclusion of smaller, more numerous loci, thus increasing a laboratory’s chance of success with challenging samples. A multilaboratory developmental validation study was performed for the PowerPlex® 35GY System following SWGDAM guidelines. The results of the study demonstrate the reliability and robustness of the PowerPlex® 35GY System for use in human identification DNA typing applications.
Introduction
The PowerPlex® 35GY System is a 35-locus, eight-dye, multiplex optimized for use with the Spectrum CE Systems (Fig. 1). The kit supports both casework and database sample workflows. The dye system consists of the blue channel (Fluorescein-8C), green channel (JOE-8C), aqua channel (AQA-8C), yellow channel (TMR-8C), red channel (CXR-8C), purple channel (TOM-8C), and an orange channel (WEN-8C). The fragments of the internal lane standard 500 are detected in the CCO-8C dye channel (CCO ILS 500). 1
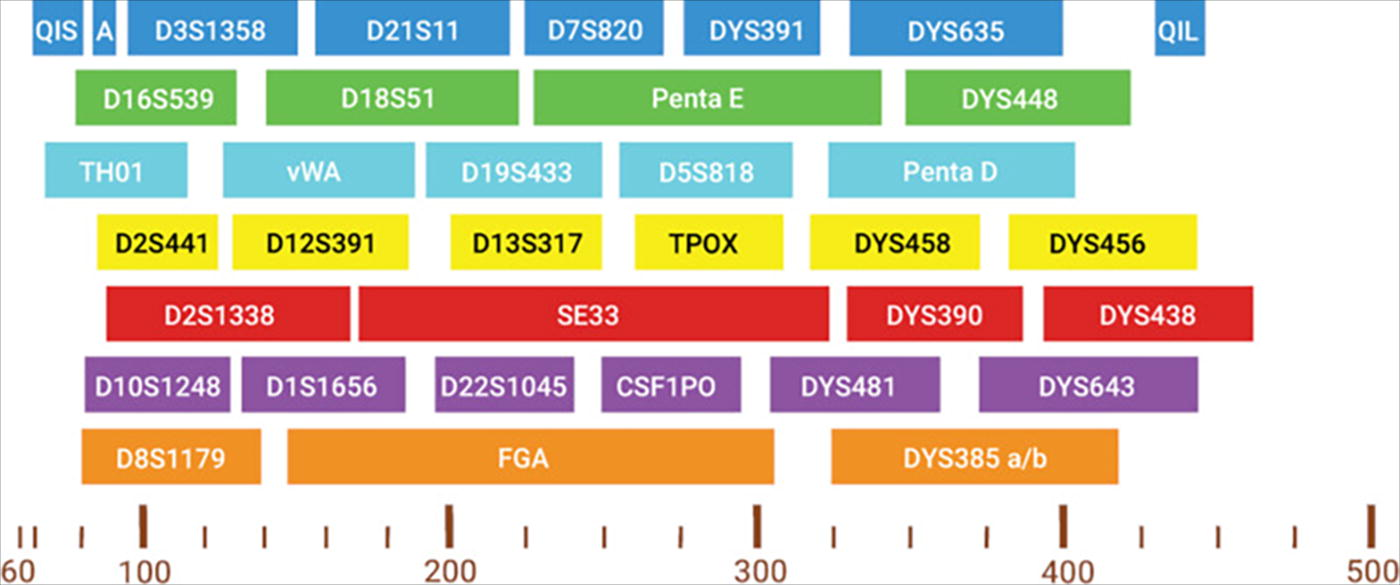
Layout by dye channel and base pair size of the PowerPlex® 35GY System Loci. QIS = Quality Indicator Small. A = Amelogenin; QIL = Quality Indicator Large.
The PowerPlex® 35GY System allows simultaneous amplification of the autosomal loci in the CODIS and ESS core set (CSF1PO, FGA, TH01, TPOX, vWA, D1S1656, D2S1338, D2S441, D3S1358, D5S818, D7S820, D8S1179, D10S1248, D12S391, D13S317, D16S539, D18S51, D19S433, D21S11, and D22S1045) as well as Amelogenin and DYS391 for gender determination. The Penta D, Penta E, and SE33 loci are included to increase discrimination and to enable searching of databases that encompass these loci. The expansion from six to eight dye channels allows for smaller amplicon sizes, exemplified by the presence of 15 autosomal loci smaller than 250 bp. Ten additional nonrapidly mutating Y-STR loci (DYS635, DYS448, DYS458, DYS456, DYS390, DYS438, DYS481, DYS643, DYS385a/b) are included for familial searching and to assist with the interpretation of sexual assault evidence profiles. Unlike forensic qPCR kits, which can solely quantify the concentration of Y-chromosomal DNA, the PowerPlex® 35GY System provides discriminatory power to help distinguish between male individuals, determine the number of male contributors present, or to establish paternal kinship. The system includes two Quality Indicators to enhance the analysis and interpretation of STR data. The Quality Indicator Small (QIS) and the Quality Indicator Large (QIL) cover the lower and higher base pair range of amplification products. The quality peaks aid in assessment of the overall success of the amplification reaction by helping to differentiate between degraded and inhibited samples.
A multilaboratory developmental validation study was performed following SWGDAM validation guidelines 2 to demonstrate the reliability and robustness of the PowerPlex® 35GY System. The laboratory sites that completed testing are New Hampshire State Police Forensic Laboratory (NHSPFL), Federal Bureau of Investigation (FBI), Forensic Genomics Innovation Hub (FGIH), Servicio de Criminalística de la Guardia Civil (SECRIM), the National Institute of Standards and Technology (NIST), and Promega Corporation. The combined results of these laboratories are presented to demonstrate the capabilities of the PowerPlex® 35GY System for use in human identification DNA typing applications.
Materials and Methods
DNA amplification
All data described in this article were generated with components from the commercial release of the PowerPlex® 35GY System.
Extracted DNA PCR amplification was performed following the default cycling protocol as described in the PowerPlex® 35GY System technical manual. 1 Unless otherwise indicated, extracted DNA amplification reactions contained 1.0 ng DNA in a final reaction volume of 25 μL.The reaction mix contained: 5 μL PowerPlex® 35GY 5X Master Mix, 5 μL PowerPlex® 35GY 5X Primer Mix, and up to 15 μL of template DNA/Water, Amplification Grade. The thermal cycling method for extracted DNA samples was: 96°C for 1 min; 29 cycles of 98°C for 5 s, 60°C for 1 min, and 72°C for 15 s; followed by a 60°C final extension for 10 min and a 4°C soak.
The default direct amplification protocol was performed following the cycling protocol as described in the PowerPlex® 35GY System technical manual 1 with a 12.5 μL final reaction volume. The reaction mix contained: 2.5 μL PowerPlex® 35GY 5X Master Mix, 2.5 μL PowerPlex® 35GY 5X Primer Mix, 1–4 μL PowerPlex® 35GY QI Reagent and Water, Amplification Grade to balance. Unless otherwise indicated, the default thermal cycling method for direct amplification used was: 96°C for 1 min; 25 cycles of 98°C for 5 s, 60°C for 1 min, and 72°C for 15 s; followed by a 60°C final extension for 10 min and a 4°C soak. For the direct amplification of swabs, the volume of Water, Amplification Grade is adjusted to include 2 μL of swab lysate in the reaction mixture.
A subset of lytic card samples was tested with a second direct amplification protocol designed for challenging samples. The extension phase for the challenging sample protocol is altered by reducing the temperature and extending the time. The protocol is as follows: 96°C for 1 min, 25 cycles of 98°C for 5 s, 60°C for 1 min, and 66°C for 1 min followed by 60°C for 10 min and a 4°C soak.
When conducting tests using either the default or challenging direct amplification protocols, it was necessary to modify the quantity of PowerPlex® 35GY QI Reagent added to the reaction: 4 μL for 23 cycles, 2 μL for 24 cycles, and 1 μL for 25 cycles. Incorporating additional QI reagent enhances the peak heights of the quality indicator peaks in direct amplification processes at the lower cycle numbers typically encountered.
Extracted DNA samples
Extracted human genomic DNA was purified using the Maxwell® FSC DNA IQ™ Casework Kit 3 and quantified with the PowerQuant® System 4 (Promega Corp). These samples were used for all studies, except the case-type, stutter, and concordance studies. Laboratories assessed case-type samples from their own collections representing types typically seen in forensic casework processing. Case-type samples were purified using either the Maxwell® FSC DNA IQ™ Casework Kit, 3 the PrepFiler™ Forensic DNA Extraction Kit, 5 or the EZ1&2 DNA Investigator Kit. 6 NIPT plasma samples were extracted with the Maxwell® RSC ccfDNA Plasma Kit. 7 The 2800M DNA was also amplified multiple times as part of the reproducibility and repeatability study. The 2800M is the human control DNA sample provided with the PowerPlex® 35GY System. 1 Stutter and concordance studies were conducted with NIST U.S. population samples. All samples used in the studies by participating laboratories were collected in accordance with the informed consent policies of each respective laboratory.
Unless otherwise specified, all amplification reactions for each study were performed in quadruplicate. A sensitivity study was conducted with two DNA donors using a two-fold serial dilution ranging from 4 ng to 7.8 pg. For the mixture study, a two-person, male:female mixture series was tested at 19:1, 9:1, 5:1, 2:1, 1:1, 1:2, 1:5, 1:9, and 1:19 ratios. In addition, a three-person, male:male:female series was tested at 1:1:10 and 1:1:20 ratios.
Various conditions were evaluated with a male DNA sample to assess the effects of changing the reaction volume (25 μL versus 12.5 μL), cycle number (28, 29, and 30 cycles), annealing temperature (58°C, 60°C, and 62°C), or PCR reaction components on the amplification reaction. Different reaction volumes were performed at 25 μL and 12.5 μL at either fixed DNA mass or fixed DNA concentration. For fixed DNA mass, 1 ng or 200 pg DNA was amplified per 25 μL or 12.5 μL reaction volume. For fixed DNA concentration, 40 pg/μL or 8 pg/μL was amplified per 25 μL or 12.5 μL reaction volume. Primer pair and master mix concentrations were assessed at 0.8X, 1.0X, and 1.2X.
The species study used commercially available nonhuman DNA purchased from ATCC (Manassas, VA), Coriell Institute (Camden, NJ), Novagen® brand, and Zyagen (San Diego, CA). Ten nanograms of each vertebrate animal or microbial species were amplified in duplicate. Four nonhuman primate species of chimpanzee, macaque, orangutan, and gorilla were amplified in duplicate at 1 ng.
The stability study evaluated the amplification of a male DNA sample with four common forensic inhibitors (Sigma-Aldrich). This was accomplished by testing different concentrations of hematin (0 μmol/L, 500 μmol/L, 750 μmol/L, and 1000 μmol/L), humic acid (0 ng/μL, 100 ng/μL, 200 ng/μL, and 300 ng/μL), tannic acid (0 ng/μL, 500 ng/μL, 750 ng/μL, and 1000 ng/μL), and EDTA (0 μmol/L, 750 μmol/L, 1000 μmol/L, and 1250 μmol/L). A male DNA sample underwent UV degradation using a Stratalinker™, with exposure levels set at 0 mJ, 50 mJ, 100 mJ, and 300 mJ.
Concordance testing was performed at NIST using a subset (n = 657) of the NIST 1036 U.S. population samples8,9 and the four single source components present in the Standard Reference Material® (SRM) 2391d (Components A–C, and E) 10 for a total of 661 samples. The same subset (n = 661) of the 1036 U.S. population samples was used to examine stutter ratio values. NIST samples were amplified in single replicates.
Stutter percentages (as a percentage of associated main allele) were determined for N − 1 and N + 1 repeat positions. Where applicable, stutter percentages were calculated for N − 2 repeat stutter positions (DYS481) and stutter positions that were 2 nucleotides shorter than the main allele (D1S1656, FGA, and SE33). Stutter peaks at the repeat position between heterozygous alleles that are two repeat units apart were not included to eliminate the additive effect of plus and minus stutter. Stutter was only calculated when the true allele peak heights were at least 5,000 RFU and did not exceed 20,000 RFU.
Direct amplification substrates
Testing was performed with a male donor for blood and buccal samples collected on FTA™ Cards (Whatman), male buccal cells collected on Bode Buccal® DNA Collectors (Bode Technology) and cotton swabs, as well as male donor blood collected on S&S 903 paper (Whatman). Laboratories evaluated donors from their own collections. Direct amplification reactions were performed using one 1.2 mm punch from cards. Bode Buccal® DNA Collector and S&S 903 paper were pretreated with PunchSolution™ Reagent (Promega Corp) as described in the manufacturer’s technical manual. 11 Cotton swabs were preprocessed with SwabSolution™ Reagent (Promega Corp) as described in the manufacturer’s technical manual, 12 and 2 μL of lysate was added to the amplification.
All direct amplification sample types were evaluated at different cycle numbers (23, 24, and 25 cycles) at both the default and challenging sample thermal cycler protocol. Lytic card substrates were tested to appraise the effects of changing the reaction volume (12.5 μL versus 6.25 μL). Unless otherwise specified, all amplification reactions were performed in quadruplicate. Informed consent was obtained for all samples used for experimentation purposes.
Thermal cycler compatibility
The PowerPlex® 35GY System was developed and optimized on the ProFlex™ PCR System 1 (Applied Biosystems, Foster City, CA). A sensitivity series (4 ng to 7.8 pg) was amplified at 29 cycles in 25 μL to demonstrate compatibility with additional cycler models (Table 1). An additional dilution series (20 ng to 100 pg) was amplified at 24 cycles with the direct amplification 12.5 μL protocol.
DNA fragment and data analysis
DNA fragment detection was performed on the Spectrum CE System, 8-Capillary 13 (Promega Corp). Calibrations were performed in accordance with the Spectrum CE System Operating Manual 14 and the respective instructions for the PowerPlex® 8C Matrix Standard 15 (Promega Corp). Each sample injected on the Spectrum CE System consisted of 1 μL of amplified sample or PowerPlex® 35GY allelic ladder with 9.5 μL of Hi-Di™ Formamide (Applied Biosystems) and 0.5 μL of the CCO Internal Lane Standard (ILS) 500. Samples were heat denatured at 95°C for 3 min followed by a snap cool of 3 min. All samples were injected at 2 kV for 15 s and run using the Promega 8-Dye (8C) protocol. Files generated by the Spectrum CE Systems (.promega format) were analyzed with GeneMarker® HID Software for Spectrum CE Systems 16 (v3.2.0). The appropriate panel, bin, and stutter values developed by Promega were used for analysis.
Average Peak Height was calculated for all studies by adding all detected peak heights from replicates then dividing by the total number of expected peaks. Allele dropout was treated as a 0 RFU peak in the sum. Quality indicator peaks (QIS and QIL) were excluded from peak calculations. Two-person mixture analysis consisted of counting alleles unique to the minor contributor, which were presented as a percentage of the total number of unique alleles expected.
Baseline noise and threshold analysis
The 1 ng sensitivity samples were analyzed to establish detection thresholds for extracted DNA, whereas the 5 ng sensitivity samples were analyzed to establish thresholds for direct amplification. The determination of analytical threshold (AT) was conducted by setting the reading threshold to 1 RFU in the GeneMarker® HID for Spectrum software. The average height and standard deviation of the noise peaks were determined for each dye channel. Ten times the standard deviation was added to each average noise value, then rounded up to the nearest 5 RFU to determine the AT for each dye. Noise levels were compared between different Spectrum CE Systems and determined to be similar, allowing one set of thresholds for data analysis of each sample type (Table 2). Direct amplification samples were further analyzed with a 20% global filter.
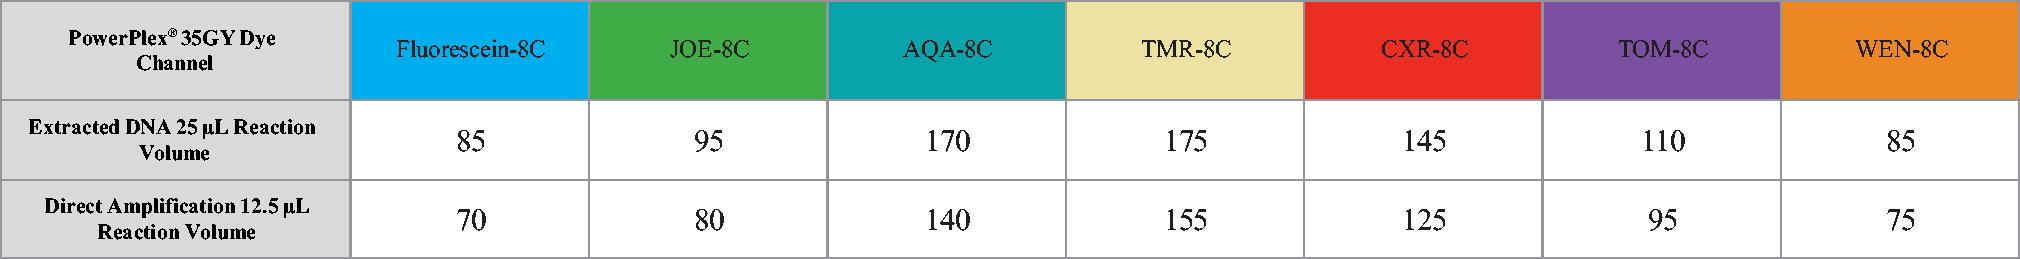
Each color represents its respective dye channel in the system.
Results and Discussion
Species specificity
Although primers in the PowerPlex® 35GY System are specifically designed to target human DNA, the presence of large quantities of nonhuman DNA may lead to nonspecific primer annealing, potentially resulting in the production of a detectable amplicon. Twelve microorganism species, ten vertebrate species (nonprimate), and four nonhuman primate species were amplified to test crossreactivity. Due to differences regarding how laboratories determine their detection thresholds, artifact peaks were identified using the lowest observed analytical threshold across all dye channels (85 RFU, observed for FL and WEN). No amplification products were detected in the 60 to 500 nucleotide size range for any of the microbial species tested (data not shown). Chicken, horse, and pig produced peaks above threshold (Table 3, Supplementary Fig. S1). These peaks were mostly located between panels or called off-ladder. The four nonhuman primate species yielded profile peaks due to the genetic similarities between humans and nonhuman primates. However, these profiles were distinguishable from human DNA due to the number of out-of-bin peaks, off-ladder peaks, and variant alleles (Supplementary Fig. S2).
Sensitivity study
The dynamic range of the PowerPlex® 35GY assay was evaluated on six different Spectrum CE systems. All test systems obtained 100% of alleles with DNA input concentrations as low as 125 pg. From 125 pg to 7.8 pg DNA, there was a decline in percent alleles called (Table 4). Average peak height results appeared similar across systems (Fig. 2). Peak heights were approximately 4,000 RFU to 5,000 RFU when amplifying 1 ng of DNA. Peak heights increased linearly with an increase in the DNA template. Regression line R2 values of 0.98 or higher were obtained for template amounts up to 2 ng of DNA (data not shown). Average peak height ratios when amplifying 1 ng of DNA were greater than 78% on all systems (data not shown). A representative graph of individual peak height ratios by template amount is shown in Supplementary Figure S3. The interdye balance of samples amplified with 1 ng of DNA was greater than 68% on all systems (data not shown).
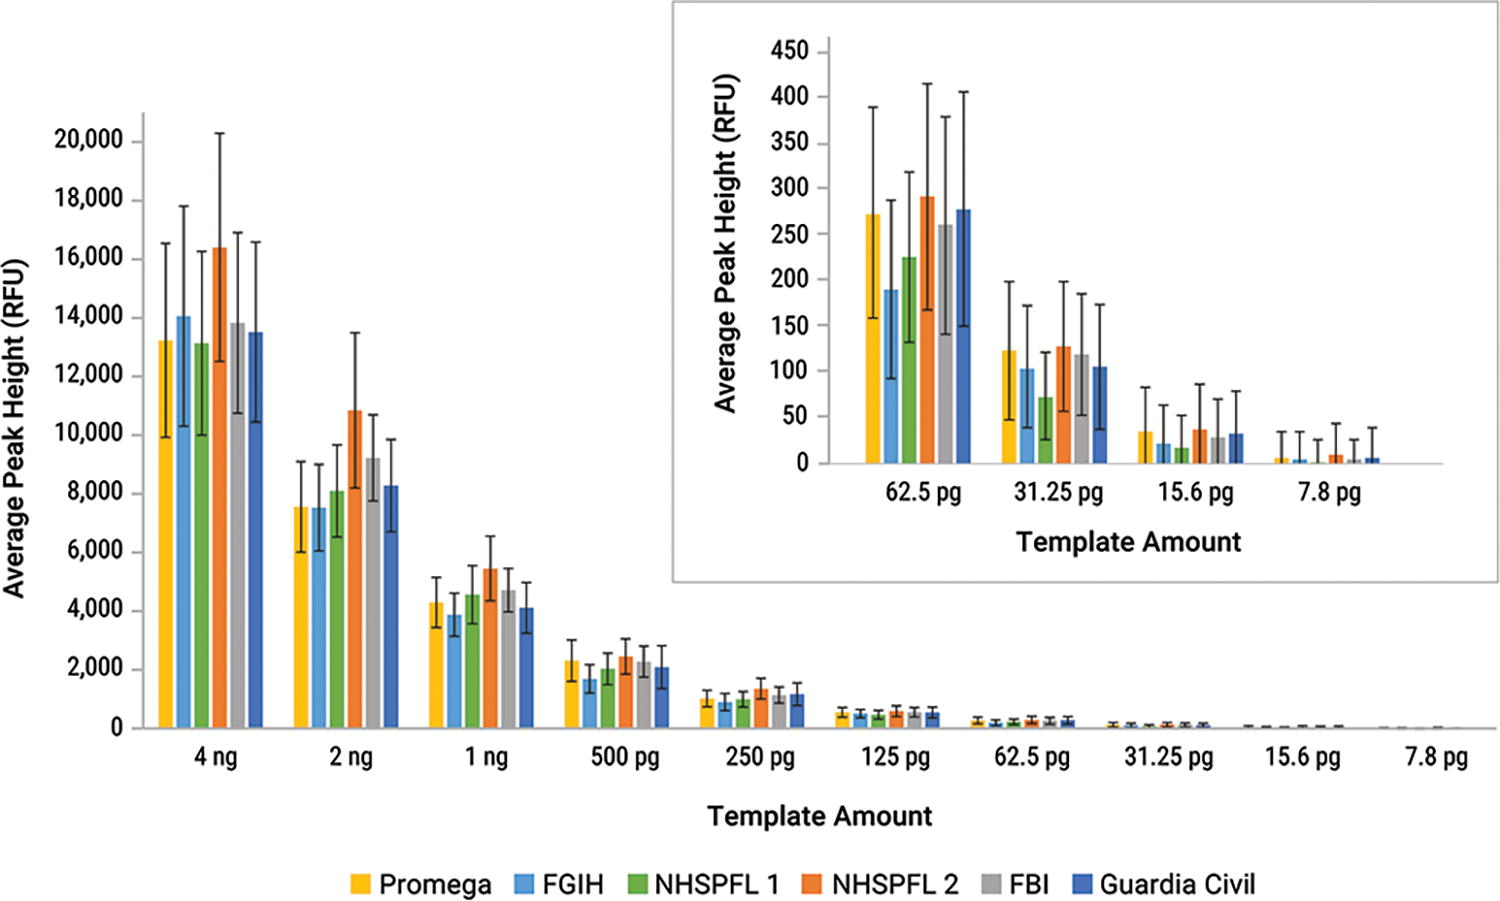
Average peak heights of sensitivity series amplified at 29 cycles with the PowerPlex® 35GY System at the 25 μL reaction volume. Error bars represent ±1 standard deviation (n = 8).

Each color represents its respective dye channel in the system.
Thermal cycler comparison data
The PowerPlex® 35GY System was tested on additional thermal cycler models with both a 25 μL and 12.5 μL reaction volume series. A direct comparison of average sample peak height between cycler models was examined from one Spectrum CE System. Average peak heights were similar between the tested thermal cycler models when amplifying 1 ng of DNA for the 25 μL PCR reaction volume, ranging between 4,000 RFU to 5,000 RFU (Fig. 3). One hundred percent of alleles were called on all thermal cyclers at 125 pg or higher (data not shown). These results are consistent with the previous sensitivity study results. Representative data from one male donor are presented. A similar pattern was observed for the data from the second male donor. Locus DYS391 exhibited roughly half the peak heights for non-cell-line DNA when amplified on the MasterCycler X50 as compared with other cycler models. An example of peak height variation by locus for 1 ng samples amplified on various thermal cyclers can be found in Supplementary Figure S4.

Average peak heights of additional thermal cycler sensitivity series amplified at 29 cycles with the PowerPlex® 35GY System at the 25 μL reaction volume. Error bars represent ±1 standard deviation (n = 4).
Average peak heights were similar between the tested thermal cycler models for the 12.5 μL PCR reaction volume, ranging between 4,200 RFU to 5,500 RFU when amplifying 20 ng of DNA (Fig. 4). Representative data from one male donor are presented. One hundred percent of alleles were called on all thermal cyclers at 2.5 ng or higher (data not shown). Locus DYS391 exhibited roughly half the peak heights for non-cell-line DNA when amplified on the MasterCycler X50 as compared with other cycler models when using the 12.5 μL PCR reaction volume.
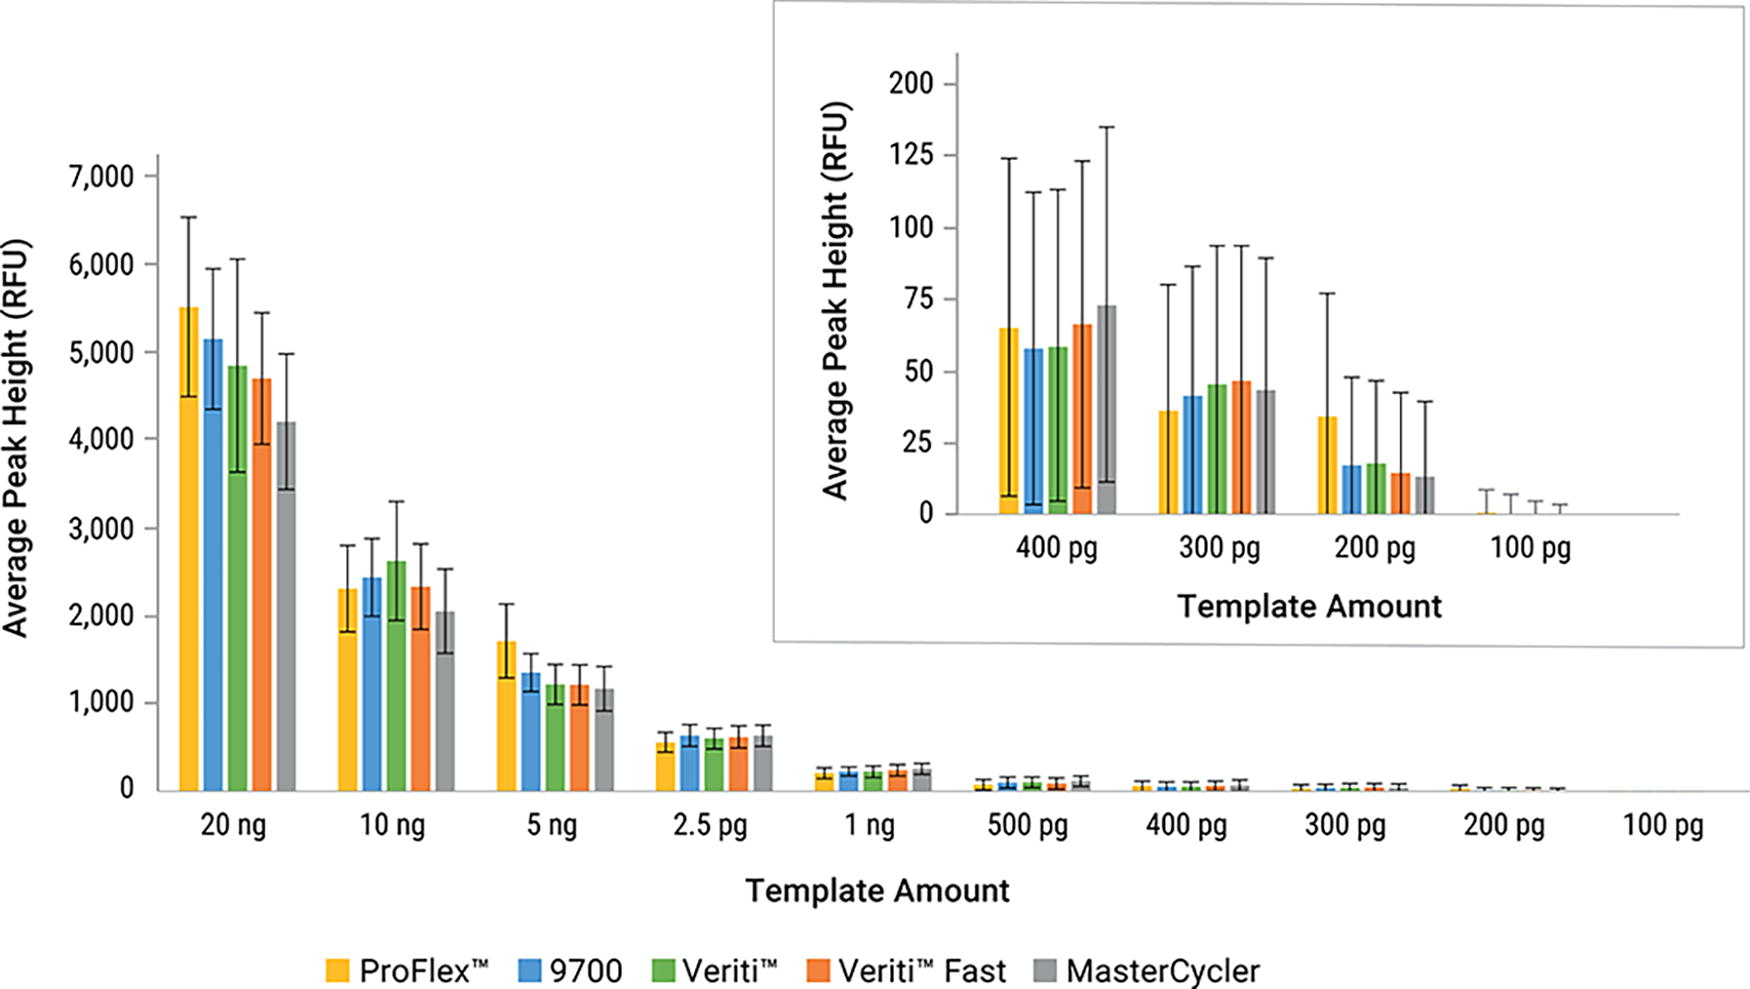
Average peak heights of additional thermal cycler sensitivity series amplified at 24 cycles with the PowerPlex® 35GY System at the 12.5 μL reaction volume. Error bars represent ±1 standard deviation (n = 4).
Stability study
Degraded samples
Exposure to heat and sun can often degrade DNA of forensic casework samples. The PowerPlex® 35GY results affirm that an increase in exposure to UV radiation results in a decrease of average peak height and percent profile (Fig. 5). The samples exposed to 100 mJ and 300 mJ of UV radiation resulted in partial DNA profiles of 90% and 75%, respectively. Preferential loss of the high-molecular-weight loci was observed. The average quality indicator ratio (QIL Peak Height/QIS Peak Height) remained at or above 1.0 for all degraded samples. A graph depicting the average peak heights related to percent profile for the degradation series is shown in Supplementary Figure S5.

Representative electropherogram of the Fluorescein-8C dye channel for a 1 ng sample exposed to increasing amounts of UV radiation amplified with the PowerPlex® 35GY System. The QI Ratio = QIL Peak Height/QIS Peak Height.
Inhibited samples
Environmental inhibitors can affect amplification performance when obtaining profiles from forensic samples. The PowerPlex® 35GY System demonstrates tolerance at a wide range of inhibitor concentrations and types. Complete profiles were generated in the presence of 750 μmol/L EDTA, 500 μmol/L hematin, and 500 ng/μL and 750 ng/μL of tannic acid. On average, 99% of alleles were detected at the humic acid 100 ng/μL sample (Fig. 6). The remaining concentrations resulted in partial DNA profiles. EDTA had the greatest effect on the percent profile, while tannic acid had the least effect. High-molecular-weight loci along with the TH01 and D7S820 loci were typically affected first.
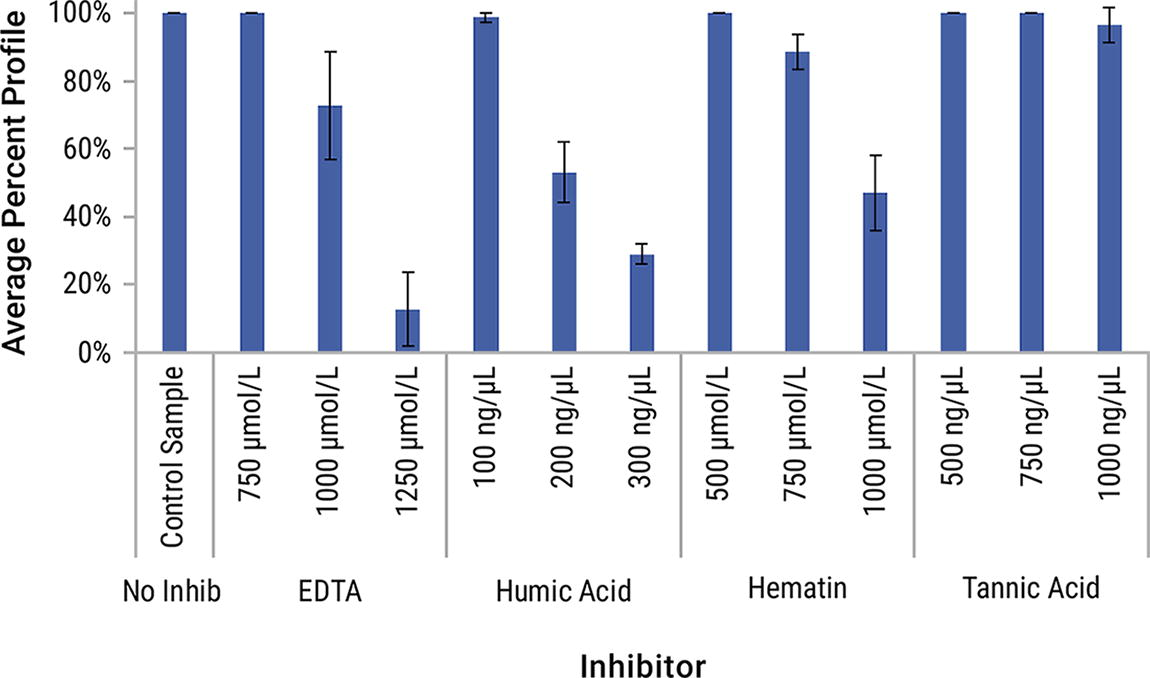
Average percent profile of inhibited samples with the PowerPlex® 35GY System. Error bars represent ±1 standard deviation (n = 4).
The PowerPlex® 35GY Quality Indicators are designed to aid in distinguishing degraded samples from inhibited samples. The QIL peak height is reduced when a sample contains higher levels of inhibition. A complete loss of the QIL peak was observed in the following inhibited sample concentrations: EDTA 1000 μmol/L and 1250 μmol/L, humic acid 200 ng/μL and 300 ng/μL, and hematin 750 μmol/L and 1000 μmol/L. Generally, dropout of the QIL peak coincided with dropout of higher-molecular-weight loci in the multiplex. A representative electropherogram of the Fluorescein-8C dye channel for hematin-inhibited samples amplified with PowerPlex® 35GY is shown in Supplementary Figure S6.
Precision and accuracy
Allelic ladder precision
Sizing precision is critical for accurate genotyping. The data from 24 PowerPlex® 35GY allelic ladders injected on five different Spectrum CE Systems were evaluated. All resulted in a standard deviation of ≤0.09 nt and size range ≤0.30 nt for all CE systems (Table 5). The maximum standard deviations observed were less than 0.16 nt, which is the maximum value to be within three standard deviations of a 0.5 nt binning window. This means that when PowerPlex® 35GY allelic ladders are included on a plate, sample alleles will fall within appropriate allele bins.
The PowerPlex® 35GY allelic ladder contains four loci with peaks separated by a single nucleotide: TH01, D2S441, D12S391, and D1S1656. Single-nucleotide resolution was achieved 100% of the time for each of these alleles. Representative loci demonstrating single-nucleotide resolution for the PowerPlex® 35GY System are displayed in Figure 7.

PowerPlex® 35GY System single-nucleotide allelic ladder resolution. The top panel is TH01 (73 nt to 116 nt). The second panel is D2S441 (81 nt to 125 nt) and D12S391 (134 nt to 194 nt). The bottom panel is D1S1656 (140 nt to 199 nt).
Reproducibility and repeatability
Forty-eight 2800M samples were evaluated for genotype concordance. All 2800M samples showed 100% concordance across instruments and were within plus or minus 0.5 nt of the corresponding allele in the PowerPlex® 35GY allelic ladder. All profiles obtained for the 2800M samples also matched the profile in the PowerPlex® 35GY technical manual. 1
Genetic marker characterization and concordance
Allele frequencies,17–22 Y-haplotype, and physical mapping23–26 have been well characterized and are available for the loci included in the PowerPlex® 35GY System. PowerPlex® 35GY genotypes obtained from the NIST U.S. population set and single-source Components A–C, and E of SRM 2391d were compared in a large concordance study with previously generated genotypes from other STR systems. Out of 38,999 alleles compared, 9 discordant calls were observed resulting in a 99.98% concordance between the PowerPlex® 35GY System and the NIST data set.
The first discordant sample generated a null genotype at DYS635 with the PowerPlex® 35GY System, while other systems produced a 24 genotype. Sequencing revealed a primer binding-site mutation as the cause for this discrepancy.
The second discordant sample generated an 8, 9.3 genotype at D7S820 with the PowerPlex® 35GY System as well as PowerPlex® Fusion 6C and Identifiler®, whereas other systems produced an 8, 11 genotype. Sequencing revealed the cause of this discrepancy to be a five-base deletion in the PowerPlex® 35GY System amplicon that is located outside the primer binding sites used in several other STR chemistries.
The remaining seven discordant allele calls were observed in SE33, including Component B of SRM 2391d and were caused by either a TTTT (6 occurrences) or a TTG deletion (1 occurrence) in the DNA region outside the primer binding sites used to generate the PowerPlex® 35GY System amplicon but included within the region amplified by several other STR chemistries.
All NIST SRM 2391d samples demonstrated 100% concordance between test sites. The PowerPlex® 35GY System is concordant at SE33 for Component B when using the NIST certified sequence of 18 repeats. 10 A 17 allele is reported for Component B at SE33 using other commercial CE multiplex kits; however, the certified sequence reveals 18 repeats with a 4-base pair (AAAA) deletion 85 base pairs upstream from the repeat, as noted in the Genetic Marker Characterization and Concordance section.
Stutter
Stutter peaks are common artifacts observed during the PCR amplification process. The stutter filter at each locus for the GeneMarker® HID for Spectrum CE Systems software was calculated using the average stutter ratio plus three standard deviations. The results of the stutter analysis can be found in Table 6. The table summarizes the minus and plus stutter for each locus in the PowerPlex® 35GY multiplex. The number of stutter peaks counted (n) along with the average stutter percentage, standard deviation (SD), and maximum observed stutter are shown. Additionally, DYS481 exhibited N − 2 repeat stutters, while SE33, D1S1656, and FGA exhibited N − 2 nt stutter.
Case-type samples
Forensic casework samples exhibit a wide range of different quantities, qualities, substrate types, and biological sample categories. Three laboratories evaluated 73 case-type samples from their own collections. A variety of sample types were successfully amplified using the PowerPlex® 35GY System (Table 7). Profiles generated were consistent with the expected source of DNA and the quantity. Full profiles were obtained from multiple sample types, including blood, bones and teeth, bullet scraping, cigarette butt, differential extraction fractions, envelopes, hair, saliva, mixed stain samples, and wearer DNA. When partial profiles were generated, genotype information was still attained, particularly at loci approximately 250 bp or less. Many partial profiles exhibited signs of degradation with sloping pattern, loss of high-molecular-weight loci, and balanced Quality Indicators. A few samples exhibited inhibition depicted by a sloping pattern with a reduced or completely lost QIL peak. Several wearer DNA samples included multiple contributors, or produced no profile, as expected with this sample type. Representative electropherograms for single-source hair and degraded blood can be found in Supplementary Figures S7–S8. DNA-dependent and-independent amplification artifacts are defined in the PowerPlex® 35GY System technical manual. 1
Case-type samples PowerPlex® 35GY System Summary
Mixture study
Forensic samples often contain DNA from more than one source. Two-person and three-person contributor mixtures were evaluated for the ability to resolve minor contributor alleles with the PowerPlex® 35GY System. Minor allele dropout was observed in the 19:1, 9:1, 1:9, and 1:19 two-person mixture ratios (Fig. 8). An average of 82% of unique minor contributor alleles were distinguishable in the 19:1 mixture ratio, 97% in 9:1, 97% in 1:9, and 81% in the 1:19 ratio. The minor donor contribution in these samples was 100 pg (9:1 and 1:9) and 50 pg (19:1 and 1:19), respectively. Multiple contributors were detected in the three-person mixture samples. On average, 98% of total alleles were detected in the 1:1:10 ratio samples and 89% of alleles of the 1:1:20 ratio (Fig. 8).

Average profiles obtained for two- and three-person mixtures with PowerPlex® 35GY System. The panel on the left represents the percentage of unique minor contributor alleles obtained from male to female two-person mixtures. The panel on the right represents the percentage of total alleles obtained from male to male to female three-person mixtures. X-axis represents the mixture ratio. Error bars represent ±1 standard deviation (n = 20).
PCR-based studies extracted DNA
Cycle number
One hundred percent of alleles were successfully genotyped across all test systems and cycle numbers (28, 29, and 30) for the sample amounts of 1 ng and 200 pg, except for 200 pg amplified at 28 cycles. An average of 98% of alleles was obtained for 200 pg at all test sites when amplified at 28 cycles (data not shown). An increase in cycle numbers resulted in an increase in average peak height for both target amounts. Peak heights increased by about a factor of two with each increment of the cycle number. Representative data obtained for a 1 ng sample from one test site is displayed in Figure 9.
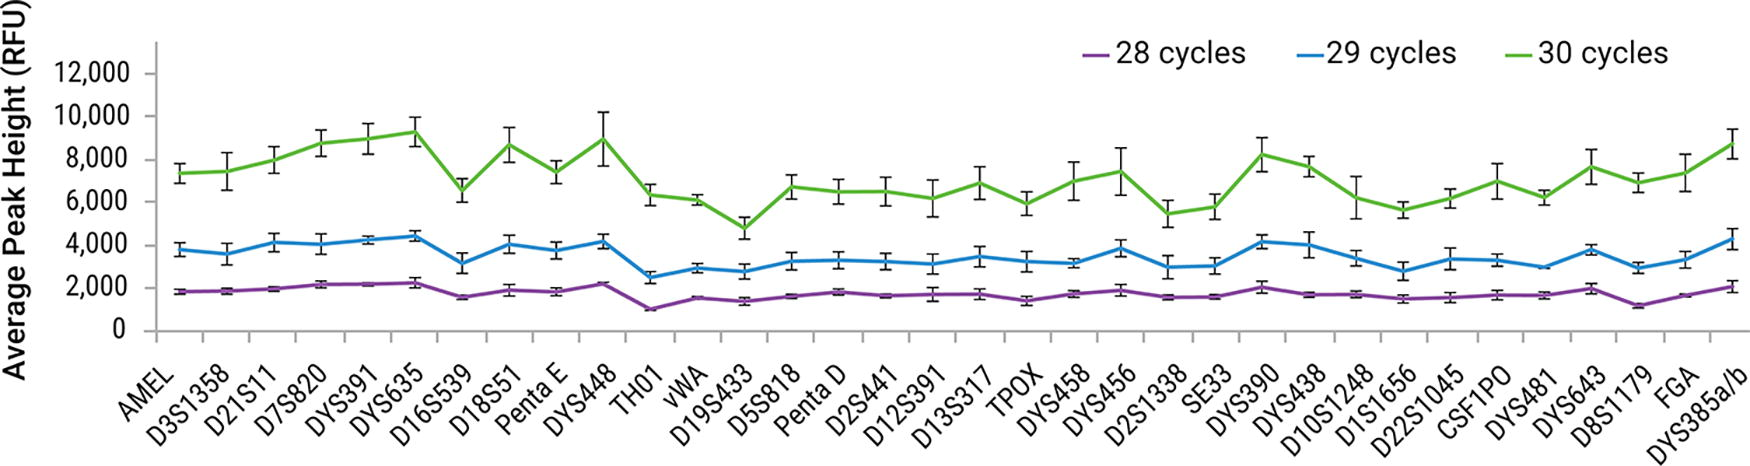
Average peak heights by locus obtained for 1 ng sample amplified at different cycle numbers with PowerPlex® 35GY System. Samples were amplified at 28 (Purple), 29 (Blue), and 30 (Green) cycles. Error bars represent ±1 standard deviation (n = 4).
Annealing temperature
One hundred percent of alleles were successfully genotyped across all test systems and annealing temperatures (58°C, 60°C, and 62°C) for the 1 ng samples (data not shown). In general, average peak heights were consistent across all temperatures tested, apart from DYS635 and TH01, which showed reduced peak heights at 58°C. TH01 exhibited increased peak heights at 62°C. Representative data obtained for a 1 ng sample from one test site are displayed in Figure 10.

Average peak heights by locus obtained for 1 ng sample amplified at different annealing temperatures with PowerPlex® 35GY System. Samples were amplified with annealing temperatures at 58°C (Green), 60°C (Blue), and 62°C (Purple). Error bars represent ±1 standard deviation (n = 4).
Reaction volume
Amplification reactions were conducted using volumes of 25 μL and 12.5 μL, either with a constant DNA mass or a constant DNA concentration. When the DNA mass was fixed, peak heights at the 12.5 μL volume were observed to double in comparison to those at 25 μL (Fig. 11). This increase is anticipated since the DNA concentration effectively doubles when the reaction volume is halved while maintaining the same total DNA mass.

Average peak heights by locus obtained for 1 ng sample amplified at different reaction volumes with PowerPlex® 35GY System. Samples were amplified at a 25 μL reaction volume (Green) and 12.5 μL volume (Blue). Error bars represent ±1 standard deviation (n = 4).
Conversely, when the DNA concentration was held constant, the peak heights showed no significant variation between the two reaction volumes (Fig. 12). Additionally, the balance between different loci remained stable across these conditions. One hundred percent of alleles were successfully genotyped across all test systems and reaction volumes.

Average peak heights by locus obtained for 40 pg/μL sample amplified at different reaction volumes with PowerPlex® 35GY System. Samples were amplified at a 25 μL reaction volume (Green) and 12.5 μL volume (Purple). Error bars represent ±1 standard deviation (n = 4).
Reaction components
Full profiles were obtained for all samples (data not shown). When varying the primer pair concentrations, the overall average peak height remained consistent between 1 ng samples. Representative data obtained for a 1 ng sample are displayed in Figure 13.

Average peak heights by locus obtained for a 1 ng sample amplified at different primer pair concentrations with PowerPlex® 35GY System. Samples were amplified with primer pair concentrations of 0.8X (Green), 1.0X (Blue) and 1.2X (Purple). Error bars represent ±1 standard deviation (n = 4).
When varying the master mix concentrations, the overall average peak height at some loci increased slightly with the 0.8X master mix concentration and decreased slightly with the 1.2X master mix concentration. Representative data obtained for a 1 ng sample are displayed in Figure 14.
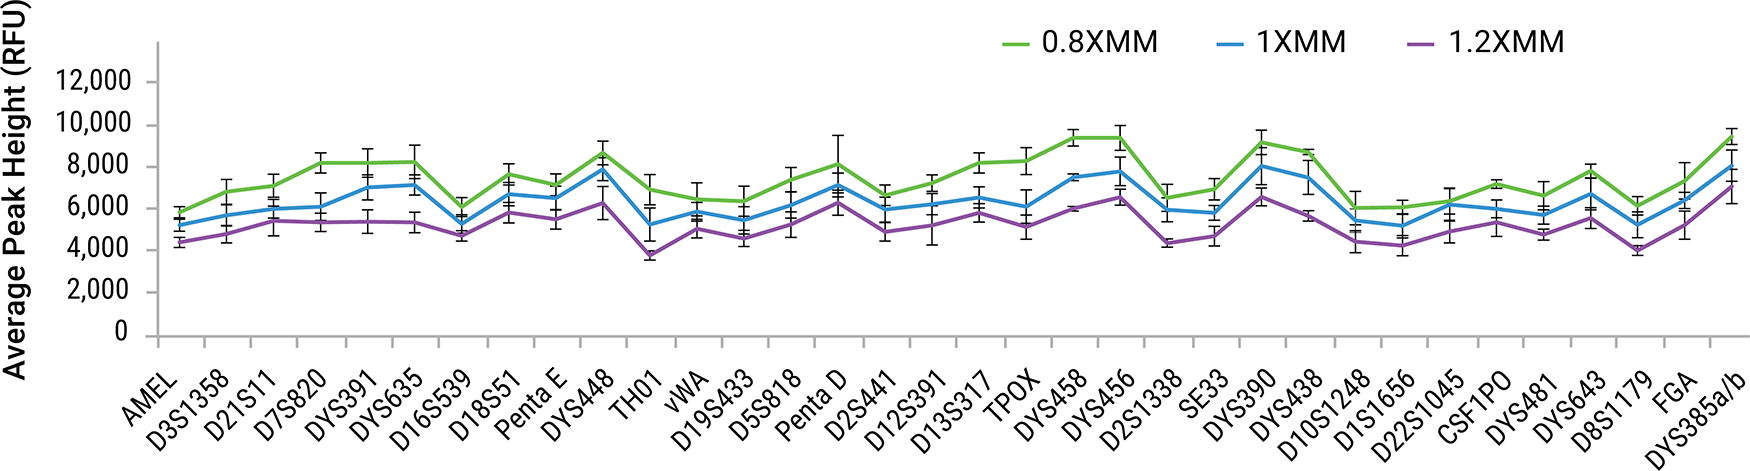
Average peak heights by locus obtained for a 1 ng sample amplified at different master mix concentrations with PowerPlex® 35GY System. Samples were amplified with master mix concentrations of 0.8X (Green), 1.0X (Blue), and 1.2X (Purple). Error bars represent ±1 standard deviation (n = 4).
PCR-based studies direct amplification
Cycle number
Replicates with complete loss of profile were considered an outlier due to sampling error and not included in calculations. As a result, one replicate was removed from buccal on FTA® for all cycle numbers at both the regular and challenging sample protocol.
For Bode Buccal® Collectors, using the default protocol, 100% of alleles were successfully identified across all tested cycle numbers. Similarly, for blood samples on 903 paper, all alleles were called at every cycle number, with the exception of the 24 cycle condition (Fig. 15). Given that 100% of alleles were seen at 23 and 25 cycles, this reduction from 100% at 24 cycles likely reflects sampling variation.
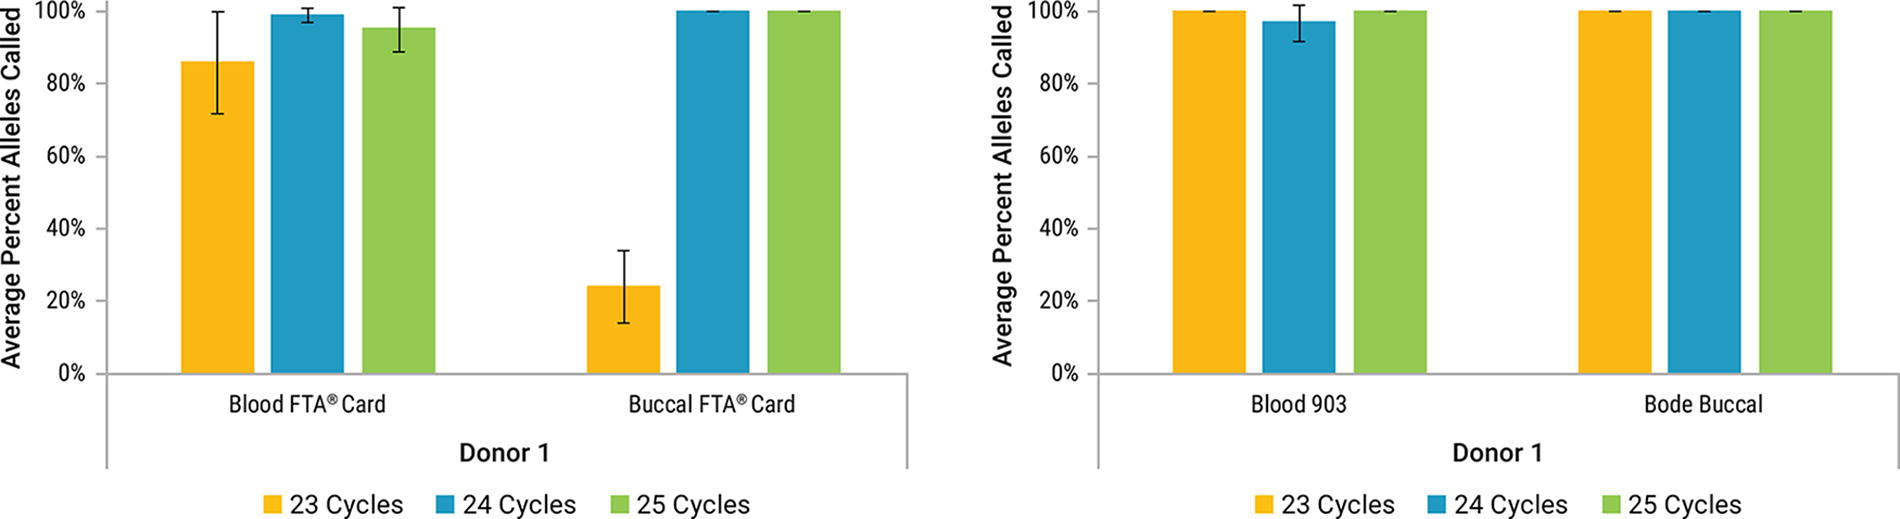
Average percent profile obtained for lytic storage cards (left panel) and non-lytic storage cards (right panel) amplified at different cycle numbers with PowerPlex® 35GY System using the default protocol. Samples were amplified at 23 (Yellow), 24 (Blue), and 25 (Green) cycles. Error bars represent ±1 standard deviation (n = 4; Buccal FTA® n = 3).
One hundred percent of alleles were successfully genotyped with the default protocol for buccal on FTA®, except for 23 cycles (Fig. 15). Eighty-six percent, 99%, and 95% alleles were recovered for blood on FTA® at 23, 24, and 25 cycles, respectively (Fig. 15). For blood samples on FTA® cards, the variation in the number of allele calls did not show a correlation with the cycle number (Fig. 15). This indicates that sampling variation plays a partial role in the percent recovery of alleles from this type of sample.
One hundred percent of alleles were successfully genotyped for the buccal swabs at all cycle numbers and with both the default and challenging protocol (data not shown). One hundred percent of alleles were successfully genotyped with the challenging sample protocol for all sample types at all cycle numbers tested, apart from buccal on FTA® at 23 cycles (Fig. 16).

Average percent profile obtained for lytic storage cards (left panel) and non-lytic storage cards (right panel) amplified at different cycle numbers with PowerPlex® 35GY System using the challenging sample protocol. Samples were amplified at 23 (Yellow), 24 (Blue), and 25 (Green) cycles. Error bars represent ±1 standard deviation (n = 4; Buccal FTA® n = 3).
Overall, increasing the cycle number increased the average peak height with both cycling protocols. An increase in performance of the large molecular weight loci was observed when using the challenging protocol. Smaller molecular weight loci were less affected when using the challenging protocol, except for D8S1179, which showed a slight decrease in peak heights relative to the other loci in the same dye channel (data not shown). The direct amplification data show that different cycle numbers and thermal cycler protocols used with the PowerPlex® 35GY System can accommodate a range of outcomes based on material sources.
Reaction volume
Replicates with complete loss of profile were considered an outlier due to sampling variation and not included in calculations. As a result, one replicate was removed from blood and buccal on FTA® for both reaction volumes.
Full profiles were obtained from all 12.5 μL reactions. All buccal FTA® samples at 6.25 μL reaction volume generated a full profile (Fig. 17). Blood on FTA® at the 6.25 μL reaction volume showed a reduction in alleles called, ranging from 16% to 100%. Testing at another site, also with blood on FTA®, resulted in partial profiles, ranging from 9% to 32% alleles called (data not shown). In general, average peak heights increased for buccal on FTA® when amplified at a reduced volume of 6.25 μL. Average peak heights for blood on FTA® were variable due to PCR inhibition as indicated by the loss of the QIL peak in these samples (data not shown.)
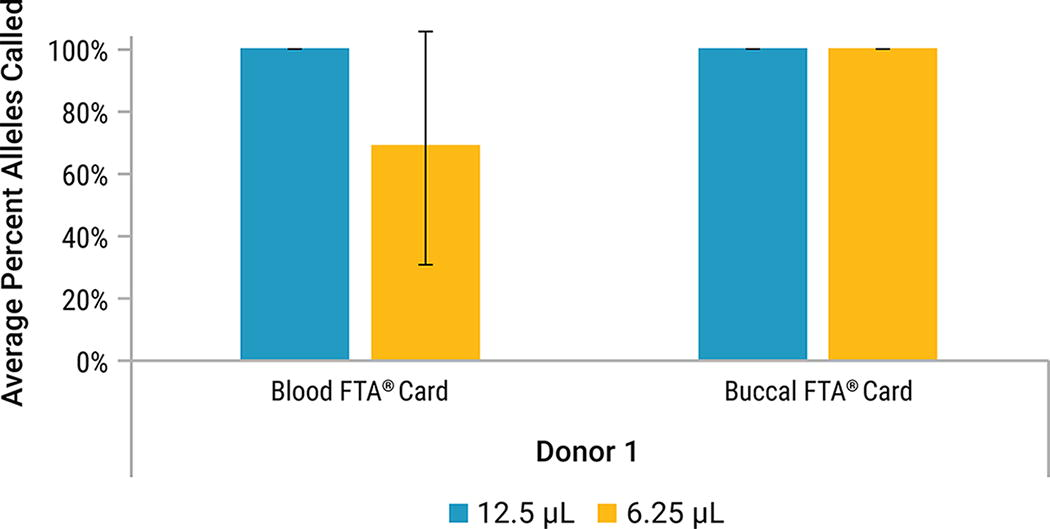
Average percent profile obtained for lytic storage cards amplified at different reaction volumes with PowerPlex® 35GY System using the default protocol. Samples were amplified at a 12.5 μL reaction (Blue) and a 6.25 μL reaction (Yellow). Error bars represent ±1 standard deviation (n = 3).
Conclusions
The PowerPlex® 35GY System is an 8-color multiplex designed for the Spectrum CE System. The system leverages its multicolor capacity to produce smaller amplicons for autosomal STR loci, thus significantly improving performance with degraded and inhibited samples. Additionally, the system incorporates 11Y-STR loci, allowing data generation for familial searching or mixture interpretation within a single amplification reaction.
The performance of the PowerPlex® 35GY System was examined by five forensic laboratories with adherence to SWGDAM validation guidelines. The strengths and limitations of multiple kit parameters were determined with extracted DNA and a variety of direct amplification substrates. PowerPlex® 35GY performance characteristics were established by experiments performed for this developmental validation study. The results indicate that the PowerPlex® 35GY System has specificity for human DNA, a large dynamic range for template amounts, is precise and accurate, and is robust enough to allow for compatibility with different thermal cycler models. It has also demonstrated the ability to overcome inhibitors, and to perform with a variety of sample types. Variability in results obtained from direct amplification storage cards may be significantly influenced by storage conditions, techniques of collection, the number and density of donor cells, and the location from which samples are punched. The results of the developmental validation study provide context for forensic laboratories when executing their own internal validation studies. The information documented in this work also verifies the reliability of the PowerPlex® 35GY System, making it suitable for use in a forensic DNA laboratory.
Footnotes
Acknowledgments
The authors acknowledge each of the collaborative institutions for their contributions of time and expertise to this work. They also acknowledge Anupama Gopalakrishnan, Mary Loten, Lisa Misner, and Rohaizah James from Promega Corporation for their contributions to this effort.
Authors’ Contributions
E.K.G.: Data Curation; Formal Analysis; Investigation; Visualization; and Writing—Original Draft. M.L.: Formal Analysis; Investigation; Visualization; and Writing—Review and Editing. J.A.P.: Formal Analysis; Visualization; and Writing—Review and Editing. J.J.S.: Investigation; and Writing—Review and Editing. J.M.D.: Investigation; and Writing—Review and Editing. P.M.V.: Investigation; Formal Analysis; and Writing—Review and Editing. C.R.S.: Investigation; Formal Analysis; and Writing—Review and Editing. M.O.’D.: Investigation. N.P.S.: Investigation. C.P.: Investigation. L.I.M.: Investigation. M.Z.: Investigation. L.F.: Investigation. J.J.F.-S.: Investigation. J.M.-G.: Investigation. K.A.L.: Investigation. S.L.M.: Investigation. D.R.R.: Investigation. K.D.: Investigation. R.S.M.: Investigation; and Writing—Review and Editing. D.R.S.: Conceptualization. C.J.S.: Conceptualization; and Investigation. J.M.T.: Methodology; Project Administration; Resources; Supervision; and Writing—Review and Editing.
Author Disclosure Statement
Promega Corporation Authors: All authors affiliated with Promega Corporation, apart from Storts and Sprecher, are current employees and receive a salary for their employment. Storts and Sprecher were employed by Promega and received salaries during the initial conceptualization and investigation stages of the research described in this publication. The research conducted at Promega and reported in this publication was funded by Promega Corporation. While Promega provided reagents to collaborating laboratories at no cost, it did not directly fund these collaborating entities.
National Institute of Standards and Technology: Related to NIST-affiliated author contributions: STR kit testing, genotype concordance, and stutter values using NIST U.S. population samples were supported by the NIST Special Programs Office: Forensic Genetics. Points of view in this document are those of the authors and do not necessarily represent the official position or policies of the U.S. Department of Commerce. Certain commercial software, instruments, and materials are identified to specify experimental procedures as completely as possible. In no case does such identification imply a recommendation or endorsement by NIST, nor does it imply that any of the materials, instruments, or equipment identified are necessarily the best available for the purpose.
The work contributed by NIST using U.S. population samples has been reviewed and approved by the NIST Research Protections Office. This study was determined to be “not human subjects research” (often referred to as research not involving human subjects) as defined in the U.S. Department of Commerce Regulations, 15 CFR 27, also known as the Common Rule (45 CFR 46, Subpart A), for the Protection of Human Subjects by the NIST Human Research Protections Office and therefore not subject to oversight by the NIST Institutional Review Board. Samples and/or data from the collaborating laboratories were not typed or analyzed by NIST authors.
New Hampshire State Police, Forensic Laboratory: The authors from the New Hampshire State Police Forensic Laboratory are free from any conflicts of interest regarding the research in this publication. There are none declared.
Forensic Genomics Innovation Hub (FGIH): The Forensic Genomics Innovation Hub Ltd has no relevant or material financial interests that relate to the research described in this article. With specific reference to any Conflicts of Interest Disclosures, none is declared.
Federal Bureau of Investigation Laboratory: None declared.
Departamento de Biología Servicio de Criminalística de la Guardia Civil: None declared.
Funding Information
No funding was received for this article.
References
Supplementary Material
Please find the following supplemental material available below.
For Open Access articles published under a Creative Commons License, all supplemental material carries the same license as the article it is associated with.
For non-Open Access articles published, all supplemental material carries a non-exclusive license, and permission requests for re-use of supplemental material or any part of supplemental material shall be sent directly to the copyright owner as specified in the copyright notice associated with the article.