
Abstract
Background:
Environmental justice (EJ) scholarship and activism have advanced procedural and distributive justice as integral tenets of public policy design and implementation. New attention is being directed toward underemphasized tenets of recognitional and restorative justice. In this article, we introduce a new open-access, living database and interactive mapping tool—the Coastal California EJ Conflicts Database—which facilitates comparative analyses of actor networks involved in perpetuating and resisting environmental injustices, the mobilization strategies they deploy, and outcomes of 87 EJ conflicts along the California Coast.
Methods and Results:
The database was built following an engaged, mixed-methods approach involving key informant interviews to inform database design, followed by content analysis of media coverage and key policy documents on EJ conflicts. Descriptive analysis of the database cases reveals that energy and water conflicts are the most common drivers of environmental injustice along coastal California. Leveraging social network analysis, we identified and mapped over 300 unique EJ, extractive industry, and government actors involved across all conflicts, with most EJ actors involved in multiple conflicts, while most extractive industry actors are involved in only a single conflict. Furthermore, we identified a suite of resistance and extractive strategies, which we categorized into four types: operational, legal, discursive, and political.
Conclusions:
Our descriptive assessment of EJ conflicts in this new database illuminates patterns of similarity in how conflicts emerge, evolve, and mimic tactics across different resources and geographies. We aspire for an open-access dataset and interactive map, alongside the descriptive analysis presented here, to inform more effective EJ mobilization and policy campaigns that move beyond only procedural and distributive justice outcomes, and toward recognitional and restorative justice.
INTRODUCTION
Despite decades of activism and scholarship, pollution and natural resource extraction continue to disproportionately impact the health, well-being, and livelihoods of communities who have been structurally disempowered and oppressed, including people of color, indigenous peoples, low-income, disabled, and immigrant communities.1,2 However, communities around the world actively resist these harms.3,4 In light of the growth, salience, and frequency of community-led mobilization for environmental justice (EJ), the work presented in this article was inspired by the questions: (1) how do EJ actors organize and leverage mobilization strategies to resist environmental harms and advocate for restorative justice in their communities and environments? and (2) how do industry actors organize and leverage extractive strategies to pursue environmentally destructive activities?
We examine these questions by compiling EJ conflicts across Coastal California, systematically cataloguing EJ conflicts documented in media, and linking these conflicts to corresponding socioenvironmental landscape data, including spatially explicit environmental harm assessments (i.e., CalEnviroScreen 4.0), environmental goods inventories (i.e., Healthy Places Index), and sociodemographics (U.S. EJSCREEN). This effort is aligned with other efforts to build repositories of EJ conflicts that systematically document injustices (e.g., www.EJAtlas.org) to facilitate cross-case analyses.5,6,7 Comparative analysis is powerful in its potential to illuminate broader patterns of power asymmetries, politics of resource use, “repeat offenders” and repeatedly impacted communities, and trends in extractive industry tactics and social movement strategies that shape outcomes across contexts.
California is the most populous state in the United States, and one often thought of having a progressive environmental agenda. EJ research in California, and comparably across contexts, has predominantly focused on local case studies around specific sources of pollution or conflict;8,9 however, there are multiple, recent, notable exceptions examining spatial distributions of cumulative environmental burdens, 10 the evolution of the EJ movement across the state, 11 and analyzing the state’s efforts to implement EJ policy. 12 Similarly, a large portion of EJ organizing in the state has distinctly place-based roots, focusing on local struggles to defend against pollution or other environmental harms, with leaders coming from impacted communities. 11 Despite the advocacy focus on local battles, EJ organizations have been central actors in pushing the state’s EJ efforts, including codification of EJ into legislation in 1999 (i.e., Cal Gov Code §65040.12). While progress, at least symbolically, has been made to advance the recognition of EJ at state decision-making levels, many argue that substantial progress toward distributional and restorative justice at the local-impact level has yet to be achieved.13,14 Important gaps remain in understanding patterns between and across individual EJ conflicts.
In this article, we present and summarize a new open-access, living database and interactive mapping tool, the “Coastal California EJ Conflicts Database.” This database documents 87 individual EJ conflicts across 19 coastal counties in California occurring between 1906 and 2022. This contribution focuses geographically on the coastal region of California, where roughly 70% of the total population of California resides, and there has been a long history of EJ organizing and both historic and on-going EJ research, particularly around the San Francisco Bay Area, Los Angelos, and Southern California.15,16
The research effort presented here was led by Science-to-Empower, a research organization based across multiple universities and extension teams and coming from a diversity of career stages (undergraduate to faculty) and professional backgrounds, which focuses on cocreating rigorous EJ research that is actionable for the defense of human and nature rights. This article presents emerging descriptive patterns across conflicts, focusing on three core research questions:
How are EJ conflicts distributed across California coastal landscapes, communities, and resource types? What EJ organizations, government entities, and private actors are involved in these conflicts and how are these actors organized across conflicts? What mobilization strategies are most commonly employed by EJ and extractive actors?
BACKGROUND
EJ literature has historically focused on quantifying and explaining patterns of injustices, including physical or health-related outcomes of environmental burdens and lack of representation in decision-making processes that determine environmental outcomes. 17 This scholarship has strong branches in both sociospatial quantitative analyses that have demonstrated significant correlation in how environmental harms and goods are disproportionately distributed across race and class lines—distributive (in)justice—and a breadth of empirical case studies that seek to illuminate causal mechanisms in inequitable processes that further procedural (in)justice.18,19
Other EJ dimensions such as recognitional and restorative justice remain the least understood by scholars 20 and rarely explored in policy making. 21 Recognitional justice argues for acknowledgment of the diverse identities associated with harmful conditions. 22 It is concerned with who is recognized as an actor 23 and whose values and interests are taken into account in the policy-making process and prioritized in decisions.24,25 As such, it requires a commitment to acknowledging those who are, or could be, adversely affected and an examination of the social, political, and cultural effects of potential interventions, in addition to financial and biophysical evaluations.26,27 Building on recognitional justice, restorative justice argues for the acknowledgment of past and on-going harms, as well as reparations to impacted communities.22,28,29 While fundamentally oriented toward healing, 29 it aims to acknowledge and rectify past environmental shortcomings and prevent future environmental inequalities by incorporating accountability. 30
In contrast, other areas of EJ scholarship are significantly less state-centric. Pellow’s (2018) critical EJ framework presents a strong critique of the state. 31 Scholars elevating abolitionist and decolonial ways of thinking advocate for solutions that do not wait for government recognition of injustices or policy changes to achieve more equitable outcomes.32, 33 This diversity of scholarly positions, focused on how to best advance just conditions, reflects the diversity of strategies leveraged by EJ practitioners and advocates as well.
An examination of the EJ social movement shows that EJ actors pursue a diverse repertoire of strategies “within, against, and beyond” the state. 34 On one hand, EJ actors work through “institutionalized” tactics, such as serving on advisory committees, participating in public input processes, attending meetings, running education and outreach campaigns, and securing representation on decision-making bodies and in elected positions. In contexts where these institutionalized tactics have not been successful, actors tend to pursue more “disruptive” political tactics, including public demonstrations and protests, social media campaigns, boycotts, and litigation.35,36,37
In Coastal California, where historic and recent EJ battles range from communities resisting toxic waste facilities, refineries, and industrial activities being sited next to residential neighborhoods,38,39,40,41 to demands for improved public access to coastline and green space, 42 this diverse suite of mobilization strategies has been documented in scholarship43,44 and can be seen in the diversity of campaigns supported by present day statewide EJ coalitions. 45 Historically, EJ advocates in the state leveraged more disruptive mobilization tactics, with more frequent and bold protests and disruptions of public hearings. 50 Recent decades have seen an increase in more “insider” tactics, including participating on state agency-led committees and initiatives, advocating through public comment processes, and focusing on educational and outreach activities.50,46,47
Up until now, empirical research on EJ movements’ efficacy provides mixed results. First, EJ activism efforts seem more likely to accrue successful outcomes when aimed at preventing future or expanded projects, rather than targeting shut-downs of existing operations.48,49 Second, when outside, well-resourced, and experienced environmental organizations are engaged in EJ movements 50 or when communities decide to engage in litigation or gain legal support and representation by public interest law clinics, 51 EJ advocates are more likely to succeed, albeit with mixed results in federal U.S. courts. 52 Leveraging cross-case comparative analyses has the potential to effectively advance the EJ social movement by improving our ability to distinguish between systematic patterns, versus context-dependent findings, with regard to what strategies contribute to effective EJ advocacy.
METHODS
We address our three guiding research questions by developing a comprehensive, comparative database of EJ conflicts across coastal California and analyzing patterns across conflicts.
Defining EJ conflicts
The unit of analysis for our database is an “EJ conflict.” We define EJ conflict following a set of criteria modified from Temper et al. (2015)
53
:
Conflict emerges from an activity (e.g., development, resource extraction, regulation, accident) that has the potential to or has already caused negative social or environmental impacts to a specific community or population. EJ organizations or community members claim negative impacts from the activity and are actively involved in the conflict in various forms of mobilization. The conflict involves at least two identifiable opposing actors or parties involved. A specific location and timeframe can be associated with the conflict. The conflict is documented or reported in publicly available online sources.
Thus, EJ conflicts in the database are bounded in scope and reflect specific occurrences of disagreement between multiple parties. In many cases, the instances we document are incidents embedded within or emblematic of larger and more expansive environmental injustices. For example, we document two conflicts related to oil spills, in which EJ actors were actively engaged. These cases illustrate some of the many social and environmental impacts of off-shore oil drilling, yet off-shore oil drilling generally is not captured as a conflict in itself in the database, given that not all off-shore drilling activities are actively resisted by EJ organizations. This illuminates a key challenge and limitation to the database—defining what constitutes an EJ conflict inevitably excludes certain injustices, when our case criterion cannot be supported based on available documentation. Notably, the criteria to define an “EJ conflict” were revisited and updated multiple times throughout the data collection process to ensure consistency across cases.
Database design leveraging literature and key informant interviews
Database design was informed by reviewing other similar EJ conflict tracking datasets54,55 and conducting semistructured interviews with individuals working in EJ organizations and on EJ programs in different state agencies across California. 56 We aimed to track consistent variables with other EJ conflict tracking efforts as much as possible to facilitate cross-regional comparative efforts; however, we also wanted to ensure that important and unique state context was captured to improve relevancy of this tool for California. A semistructured interview guide with eight multipart questions was designed with the aims of improving the research team’s understandings of how learning and information sharing occurs across EJ campaign development and to determine how a comparative conflicts database could best facilitate EJ organizations’ efforts. Interview-based research was conducted in 2021, while the COVID-19 pandemic continued to severely impact small community-based organizations’ capacity and resources available to spend on research. While the research team delayed interviews multiple times, ultimately a convenience sampling approach was followed, relying heavily on personal contacts and relationships with a few key informants working in larger EJ organizations at the statewide level and snowball sampling references provided by those initial contacts to reach organizing groups focused at smaller regional and local levels. 57 All data collection protocols were reviewed and approved by the University of California San Diego Institutional Review Board (Protocol number 801719). All interviewees were offered compensation for their time.
Representatives from 19 EJ organizations and five state agency EJ programs were invited to interview; a total of 13 interviews with eight individuals from EJ organizations and five individuals from state agencies were conducted (54% response rate). EJ organization interviewees represented large and small EJ organizations, working at scales ranging from hyperlocal, specific-neighborhood focused, to running statewide campaigns that bring together multiple small community-based organizations. Interviewees worked in the Bay Area, Central Coast, and Southern California; there were no interviewees that focused on North Coast communities. State agency EJ program staff were from five different state agencies that focus on the coastal region. Interviewees shared their data needs and suggestions for what information to track about EJ conflicts and how to best present this in the conflicts database and interactive map design. For example, EJ organizations were very interested in our ability to track and archive media coverage and legal or technical documents associated with cases, which they reported being helpful resources in designing campaigns around new, similar conflicts. EJ program staff at state agencies said the ability to query the database spatially would be most helpful to draw in historic conflict data when assessing present day projects or permit applications. We adapted the draft database design to incorporate as many of the ideas we heard from interviewees as possible; for example, in the online, interactive database, available media coverage on conflicts (that also served as archival data sources on the conflicts; see following “Data Collection” section) is hyperlinked to each case. In addition, the cases are mapped to their approximate locations, and the database can be queried by exploring the interactive companion map.
Data collection
EJ conflicts were identified following a mixed-methods approach including through the 13 previously mentioned key informant interviews, systematic web-scraping, and archival review. To systematically web-scrape, each coastal county in California was searched alongside 17 key conflict type search terms, for a total of 323 individual searches using Google Search engine between 2020 and 2022. We then researched each conflict identified in greater depth, reviewing available secondary data sources (i.e., media coverage, project permits, hearings, decisions, policy briefs, scientific research, legal documents, EJ organizations’ websites).
We categorized conflicts by their spatial type (e.g., discrete location, corridor, county-wide/regional scale, or statewide) and mapped them, following our best efforts to estimate the epicenter of the conflict. The objective of mapping conflicts was to understand what communities reside near conflict locations; however, the radius of impact from conflict centers varies greatly by the conflict type (e.g., a landfill may have much more localized impact than a cross-city freeway expansion project); thus, any future spatial analyses must take the specific conflict context into careful consideration before widely integrating social or environmental landscape data to assess the conflict (see Supplementary Data S1).
We coded variables of interest (i.e., actors, conflict drivers, strategies) for each conflict, following a deductive coding approach and using intercoder reliability checks throughout the coding process (see Table 1 and Supplementary Data S1). Conflicts actively unfolding during the research process (2020–2022) were checked for latest updates or any changes in decisions or outcomes as of summer 2022. After the initial dataset was compiled, coded, and organized, EJ organizations were approached and invited to provide expert review. The expert review process was on-going throughout 2022–23 with the open-access, living version of the database and continues to improve the accuracy and comprehensiveness of the dataset.
Summary of All Variables Available in the Database and Coding or Categorization
Despite our best efforts to conduct rigorous and timely research, we recognize multiple limitations to this dataset. Our reliance on online media means that the database is likely to overrepresent more recent, higher profile, and more urban conflicts that have more press coverage. Similarly, we are likely to underrepresent mobilization strategies that are less visible, while overrepresenting the use of “disruptive” strategies that gain media attention, such as protests and lawsuits. The database will remain a living repository of EJ conflicts that will be updated over time as conflicts progress and more conflicts are uncovered.
Data analysis
We mapped conflicts on top of sociospatial data layers including demographic data from the U.S. EPA’s EJSCREEN, cumulative pollution burden estimates from California EPA’s CalEnviroScreen 4.0, and environmental benefit accessibility from the Public Health Alliance of Southern California’s California Healthy Places Index. Incorporating these spatial datasets allows better understanding of how EJ conflicts relate to underlying environmental burden and benefit distributions and the demographic characteristics of the communities located in proximity to conflict locations (see Supplementary Data S1).
We evaluated frequencies and distributions of conflict drivers, mobilization strategies, and conflict outcomes using R Statistical Software. Social network analysis was used to visualize the actor network structures and evaluate the structural influence different actors hold; Gephi Graph Visualization Software was used for network visualization and analysis (see Supplementary Data S1).
RESULTS AND DISCUSSION
The Coastal California EJ Conflicts Database includes 87 conflicts across California’s 19 coastal counties. Eighty-two percent of conflicts (n = 71) have ended, whereas 18% (n = 16) are on-going or unresolved as of the time this article was being written (early 2023). Of the closed conflicts, 10% (n = 7) saw no resolution nor restorative justice for the EJ community. However, the vast majority, 74% (n = 64) of closed conflicts saw some level of progress, including some that have experienced restorative justice. For example, in 28% (n = 20) of closed conflicts, some level of compromise was reached; in 35% (n = 25) of closed conflicts, the extractive activity or environmental harm was stopped or stalled; and in 27% (n = 19) conflicts, some remediation, mitigation, or reparation payment was made.
Spatial and temporal distribution of conflicts
Geographically, conflicts are more concentrated around the population centers in the state, with over 50% of conflicts located in the San Francisco Bay Area, Los Angeles, and San Diego metropolitan regions (Fig. 1; Table 2). Over 70% of conflicts occur at a single discrete location, 3% at multiple discrete locations, 7% across a corridor, and 14% were classified at a county, regional, or state-wide scale. Understanding how conflicts differ in their spatial distribution may be important for understanding why EJ mobilization and resistance can look different across conflicts. For example, mobilizing to stop a specific development project might be driven by very local organizations and community members likely to be impacted, whereas conflicts spanning larger areas may draw in participation from actors working on regional or cross-regional issues.
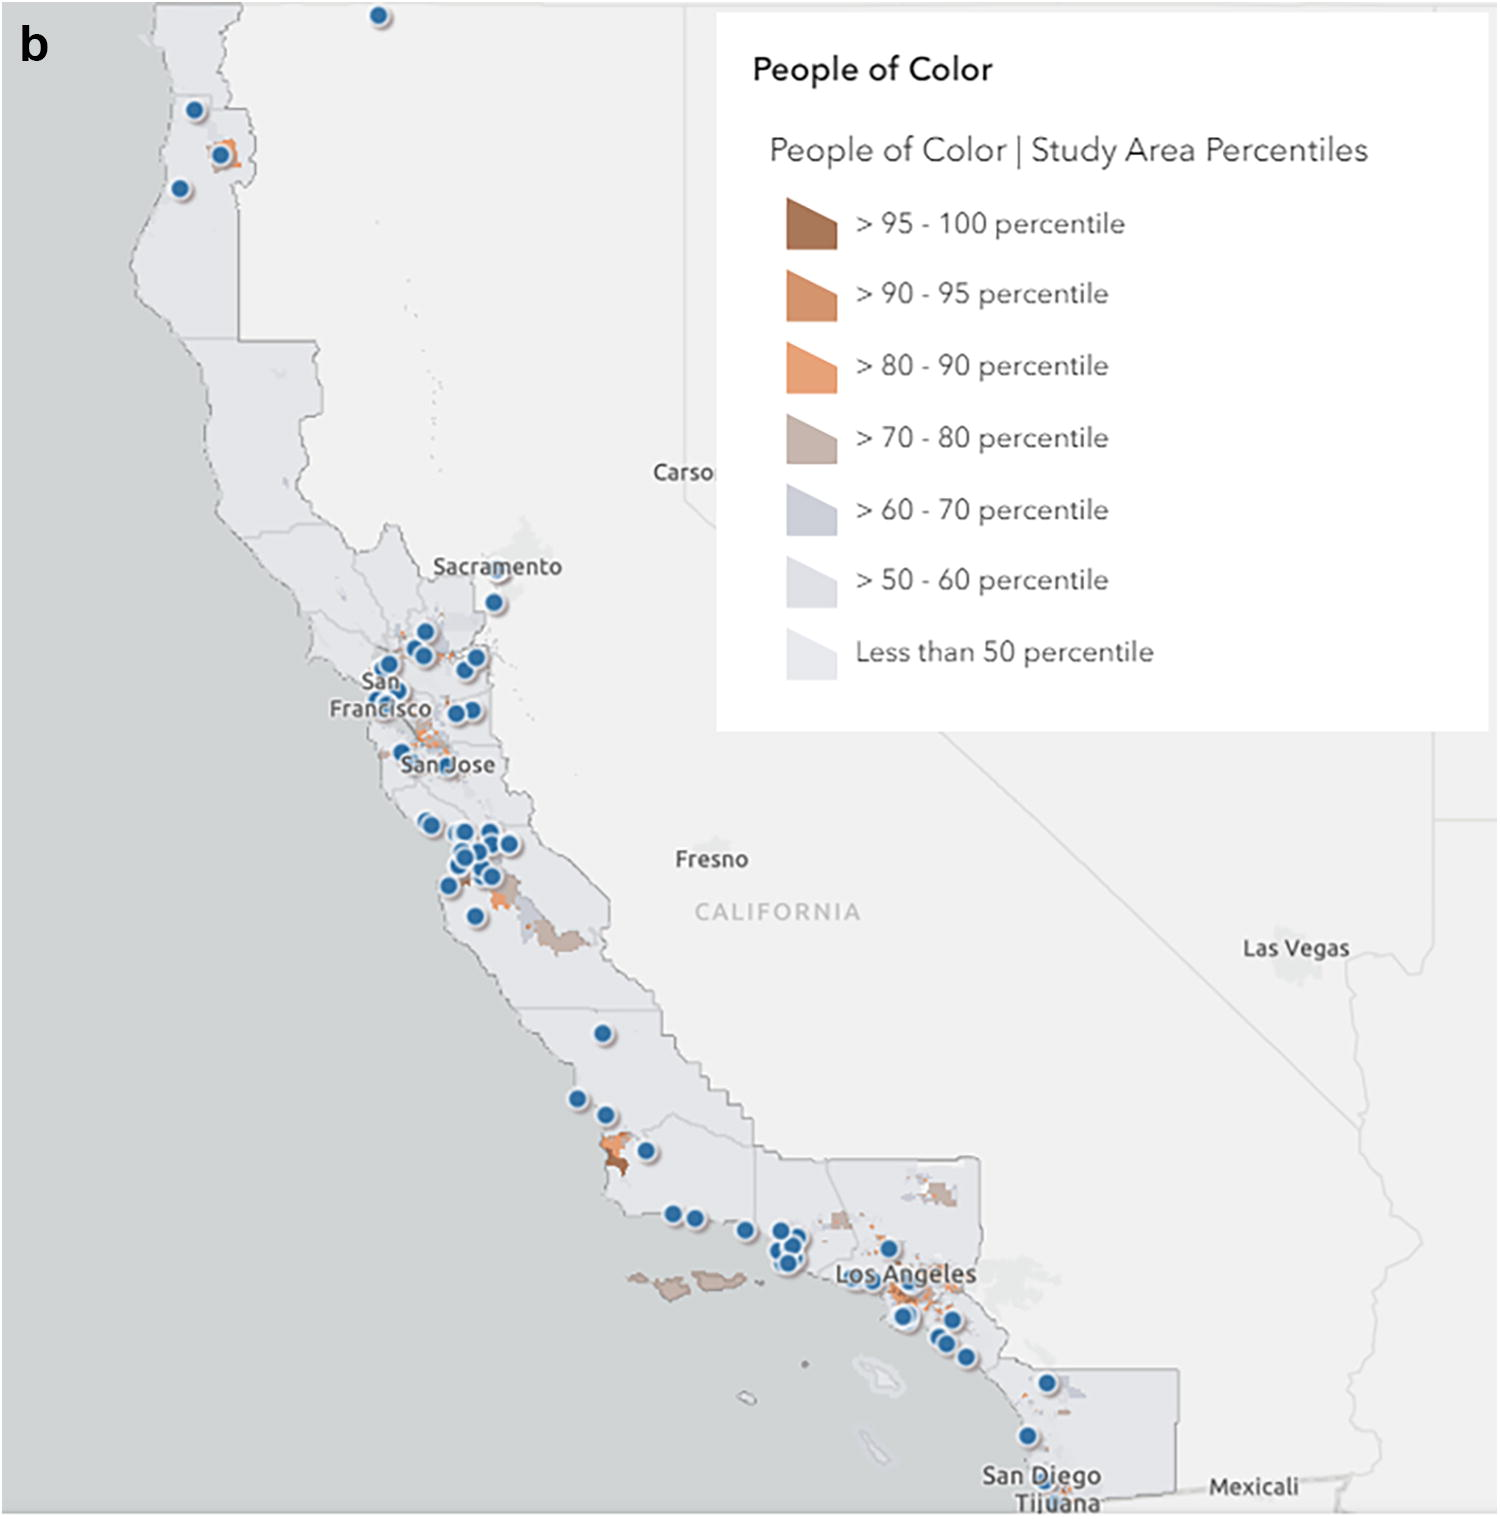
Panel (
Panel (b) EJ conflicts mapped on top of the base layer showing percentage people of color by census tract, based on data from the U.S. EJSCREEN.
Geographical Distribution of EJ Conflicts
Very few conflicts included in the database are documented to have started before the year 1999, which was the year California defined EJ in statute [i.e., California Government Code §65040.12(e)]. In fact, the majority (60%) of conflicts are documented to have begun after 2010 (Fig. 2). The increase in recently initiated conflicts likely illustrates the recency bias of the dataset that relied heavily on publicly available, online documentation; however, it may also be indicative of the growth of the EJ movement over the past decade, 58 the increasing acknowledgment and attention paid to these conflicts in California’s state agencies and courts, 59 and statutory grounding on which communities can resist extractive projects. 60
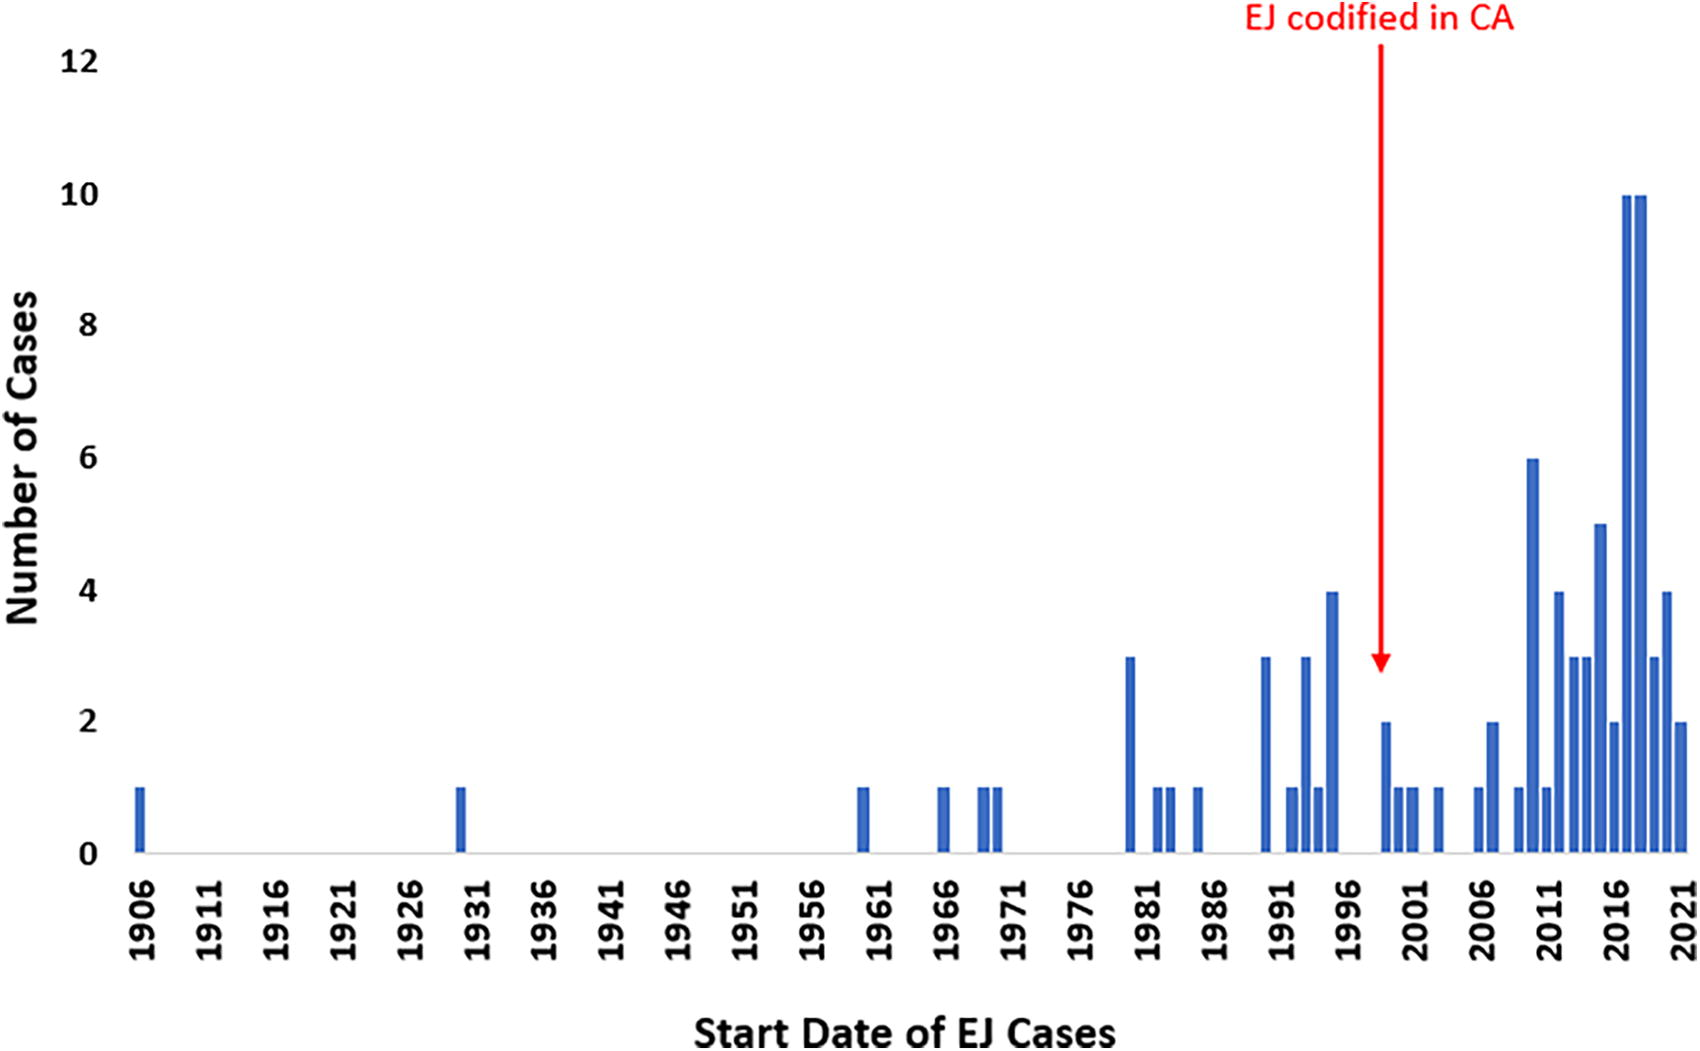
Start date of conflicts in the database. The state of California codified EJ in statute (California Government Code §65040.12
Conflict drivers
Energy activities are the most common conflict driver (25% of conflicts, n = 22). These included conflicts over fossil fuel extraction and refinement, off-shore oil spills, a nuclear power plant, and climate change impacts. Water management was the second most frequent conflict driver (18%, n = 16), including conflicts related to water supply distribution, water rights, dam/reservoir operations, drought impacts, and desalination. Public health impacts due to pollution and exposure to toxics was the third most common conflict driver (17%, n = 15). Additional conflict drivers included land development (10%, n = 9), open or green space access (8%, n = 7), transportation and infrastructure (e.g., ports) (7%, n = 6), waste disposal (7%, n = 6), and Tribal and Indigenous sovereignty conflicts (6%, n = 5) (see Fig. 1a). Many conflicts are multifaceted and intersect multiple resources or sectors; in addition to the primary conflict driver, other contributing drivers are also identified where relevant (see Supplementary Data S1).
The prevalence of these conflict drivers reinforces thoroughly documented patterns of environmental injustice across the state.61,62,63,64 Coastal California has long felt the impacts of fossil fuel generation, refinement, pollution, and exports given extensive off-shore drilling projects, 16 fossil fuel refineries across the state, 65 and at least six major marine oil spills since the 1960s. 66 Conflicts due to inequities in water quality, access, and affordability have also been widely documented across both the coastal and inland regions of the state.67,68,69 Furthermore, with the development of cumulative environmental burden assessment tools, such as the CalEnviroScreen, patterns of unequal distribution of environmental harms and goods across race and socioeconomic status have become increasingly clear in California, with race determined to be a more predictive factor than income. 70 Public health impacts, including exposure to pesticides and toxic wastes, are among the most unevenly distributed environmental harms with respect to race in the state 71 (see Fig. 1b.)
Actor networks
EJ network
Across all conflicts, we identified 178 unique EJ organizations involved in resistance and mobilization efforts. On average, conflicts have four actors involved, with a maximum of 20 unique EJ groups identified in one conflict. Twenty-one percent of conflicts (n = 18) have only one EJ actor involved, and 23% of conflicts (n = 20) had no identified EJ organizations actively involved; these conflicts were usually between individuals and government entities or private companies. Figure 3 visualizes the EJ network, with the most central actors depicted as larger nodes and listed in Table 3.
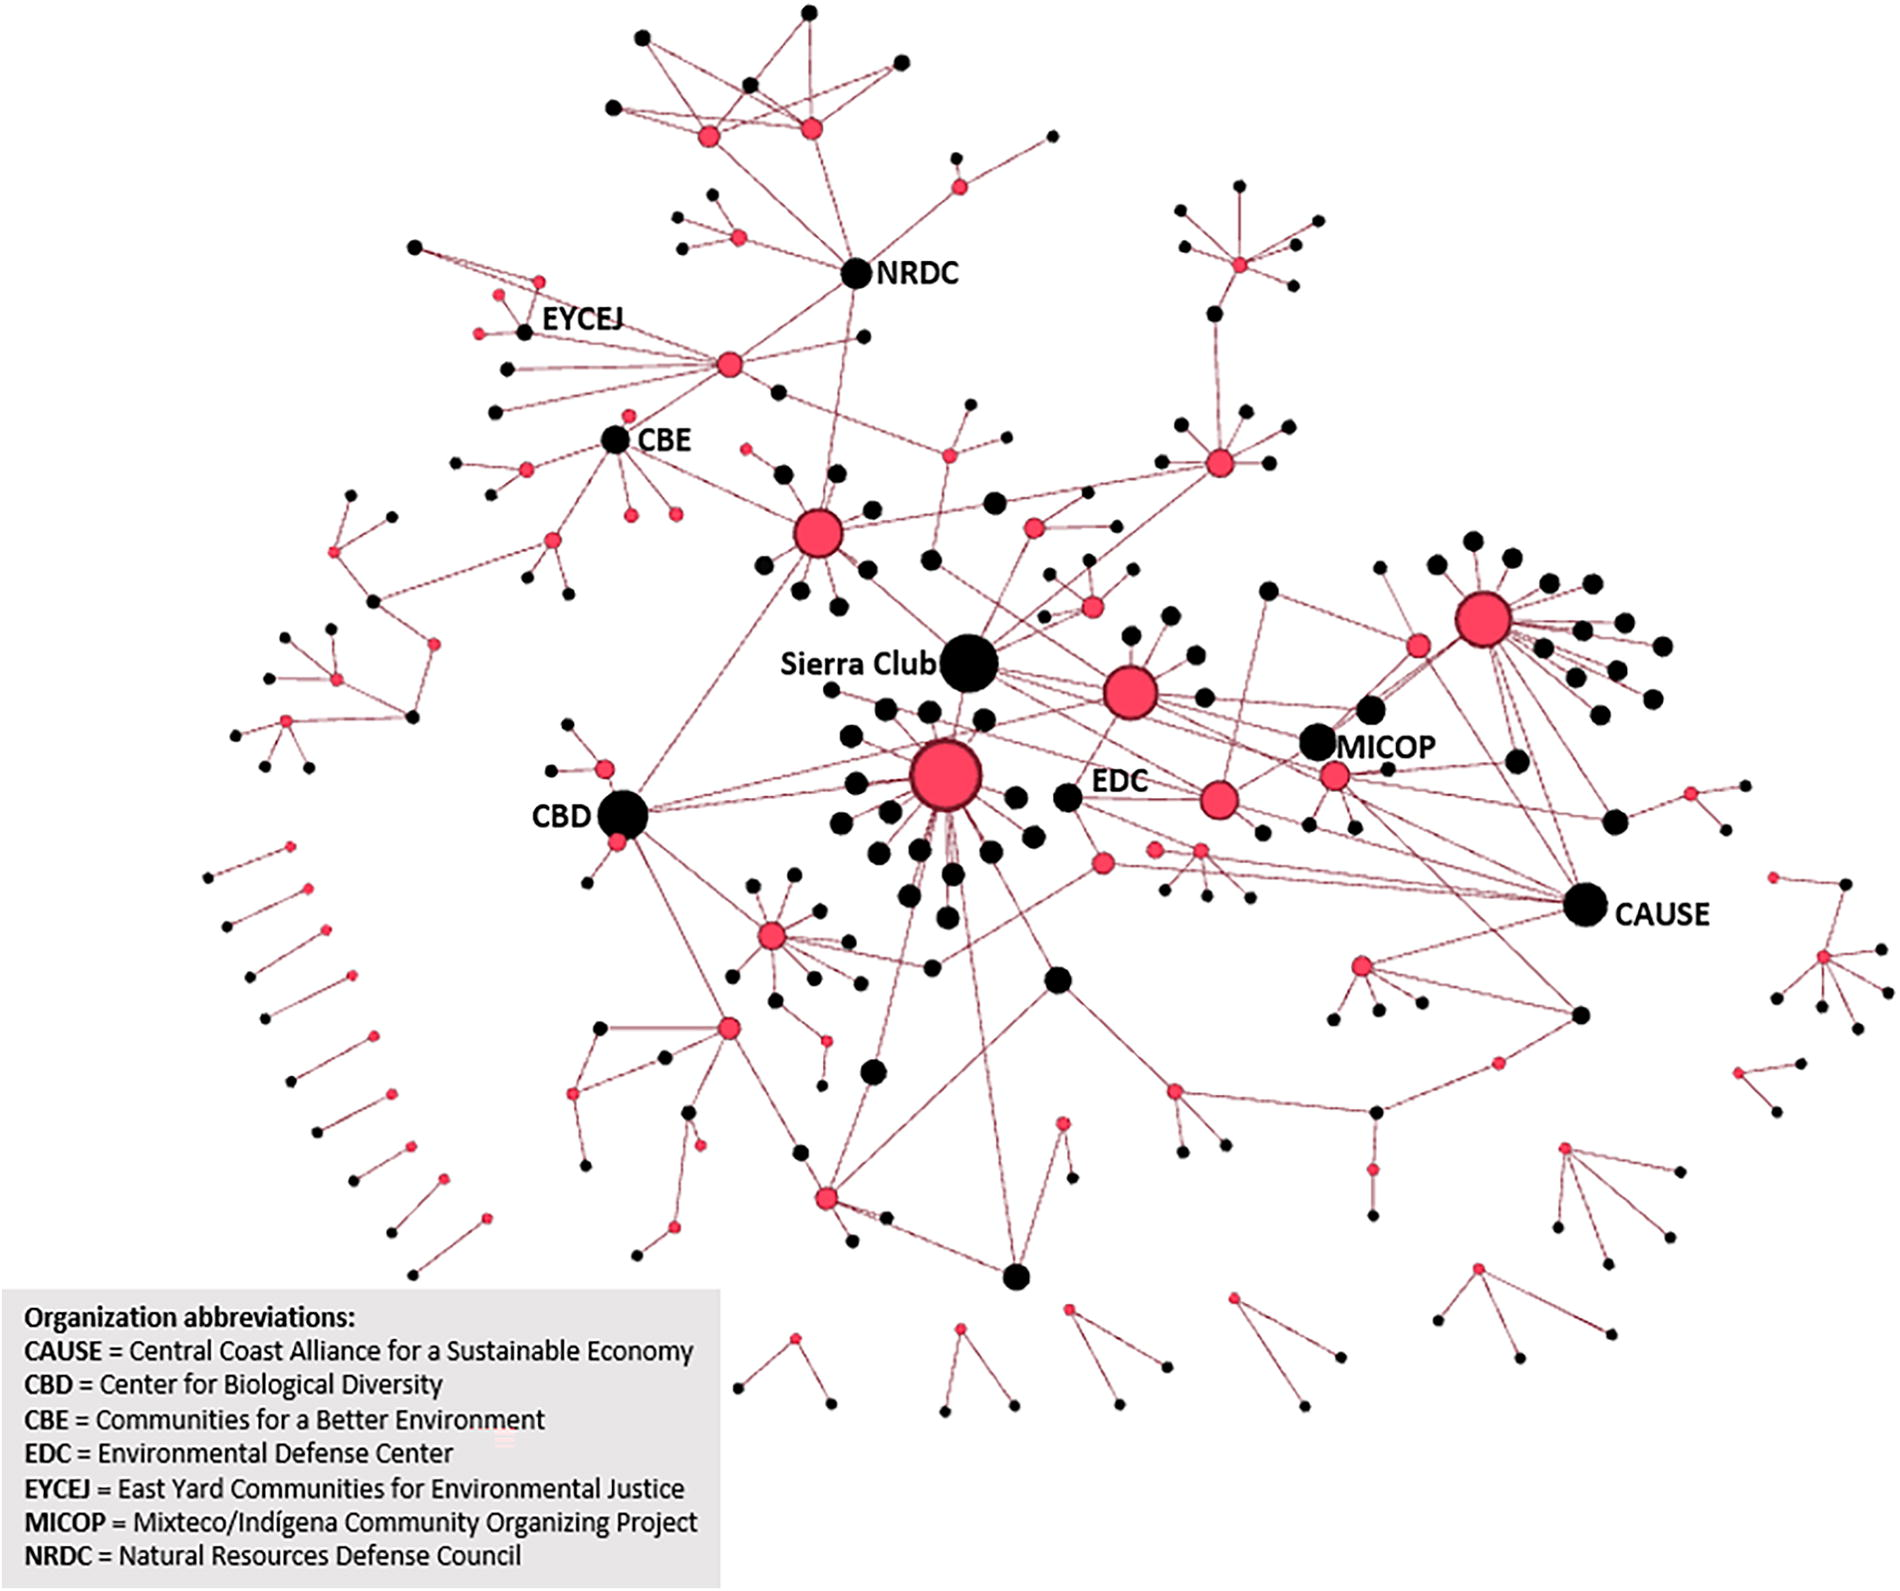
EJ network diagram. Cases are shown as red nodes, and actors are shown as black nodes; links demonstrate which actors are involved in which cases. Nodes are scaled by betweenness centrality, which is a measure that quantifies the number of times a node acts as a bridge along the shortest path between two other nodes, thus providing a proxy for the importance or centrality of each actor relative to all others. The most central EJ actors are labeled.
Most Central Actors in EJ and Extractive Activity Networks
Extractive network
Across all conflicts, we identified 114 unique actors involved in extractive activities. On average, there are two extractive actors involved in each conflict, with a maximum of 19 unique actors identified in one conflict. Fifty-one percent of conflicts (n = 44) have only one extractive actor involved, and 23% of conflicts (n = 20) had no extractive actor identified; these conflicts were primarily between government entities or individuals and EJ organizations. Figure 4 visualizes the extractive actor network, with the most central actors depicted as larger nodes and listed in Table 3.
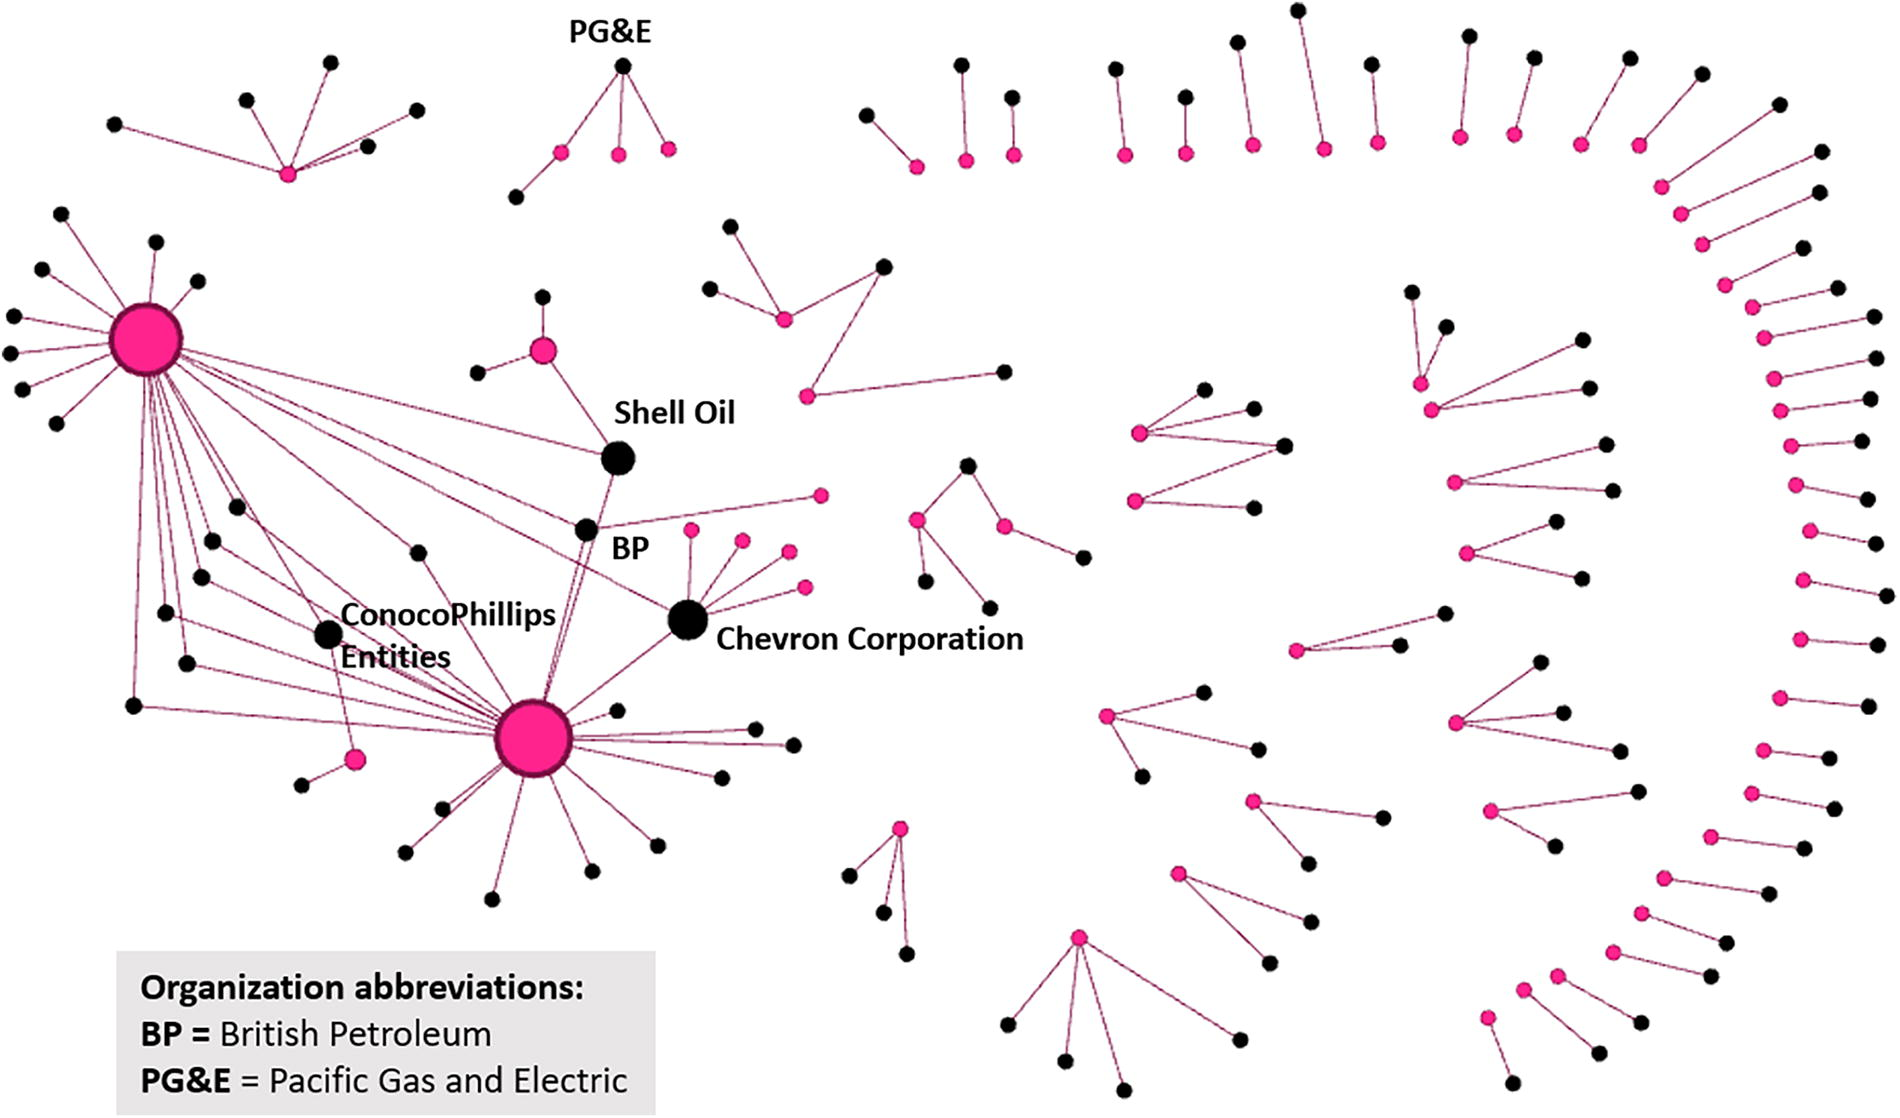
Extractive actor network. Cases are shown as red nodes, and actors are shown as black nodes; links demonstrate which actors are involved in which cases. Nodes are scaled by betweenness centrality, which is a measure that quantifies the number of times a node acts as a bridge along the shortest path between two other nodes, thus providing a proxy for the importance or centrality of each actor relative to all others. The most central extractive actors are labeled.
Conflict strategies
Resistance strategies
Communities and EJ organizations mobilize and resist extractive activities through a number of different strategies intended to call attention to, interrupt, prevent, or remediate the impacts of extractive industry activities on their communities’ health and well-being. We identified a total of 19 unique resistance strategies, which we categorized as operational, legal, discursive, or political strategies (see Table 1). An average of four strategies were used in each conflict (Fig. 5). A few cases had no clearly identifiable strategies, whereas in one case, we observed 16 different strategies used over time (i.e., Diablo Canyon Nuclear Power Plant, which is one of the longest running in the database). EJ actors primarily rely on operational and legal strategies. The most commonly employed strategy across all cases was the use of “Lawsuits, court cases, or judicial activism,” seen in 64% (n = 56) of conflicts. This was followed by operational strategies of “involving NGOs,” used in 52% (n = 45) of conflicts, and “community organizing,” used in 51% (n = 44) of conflicts.
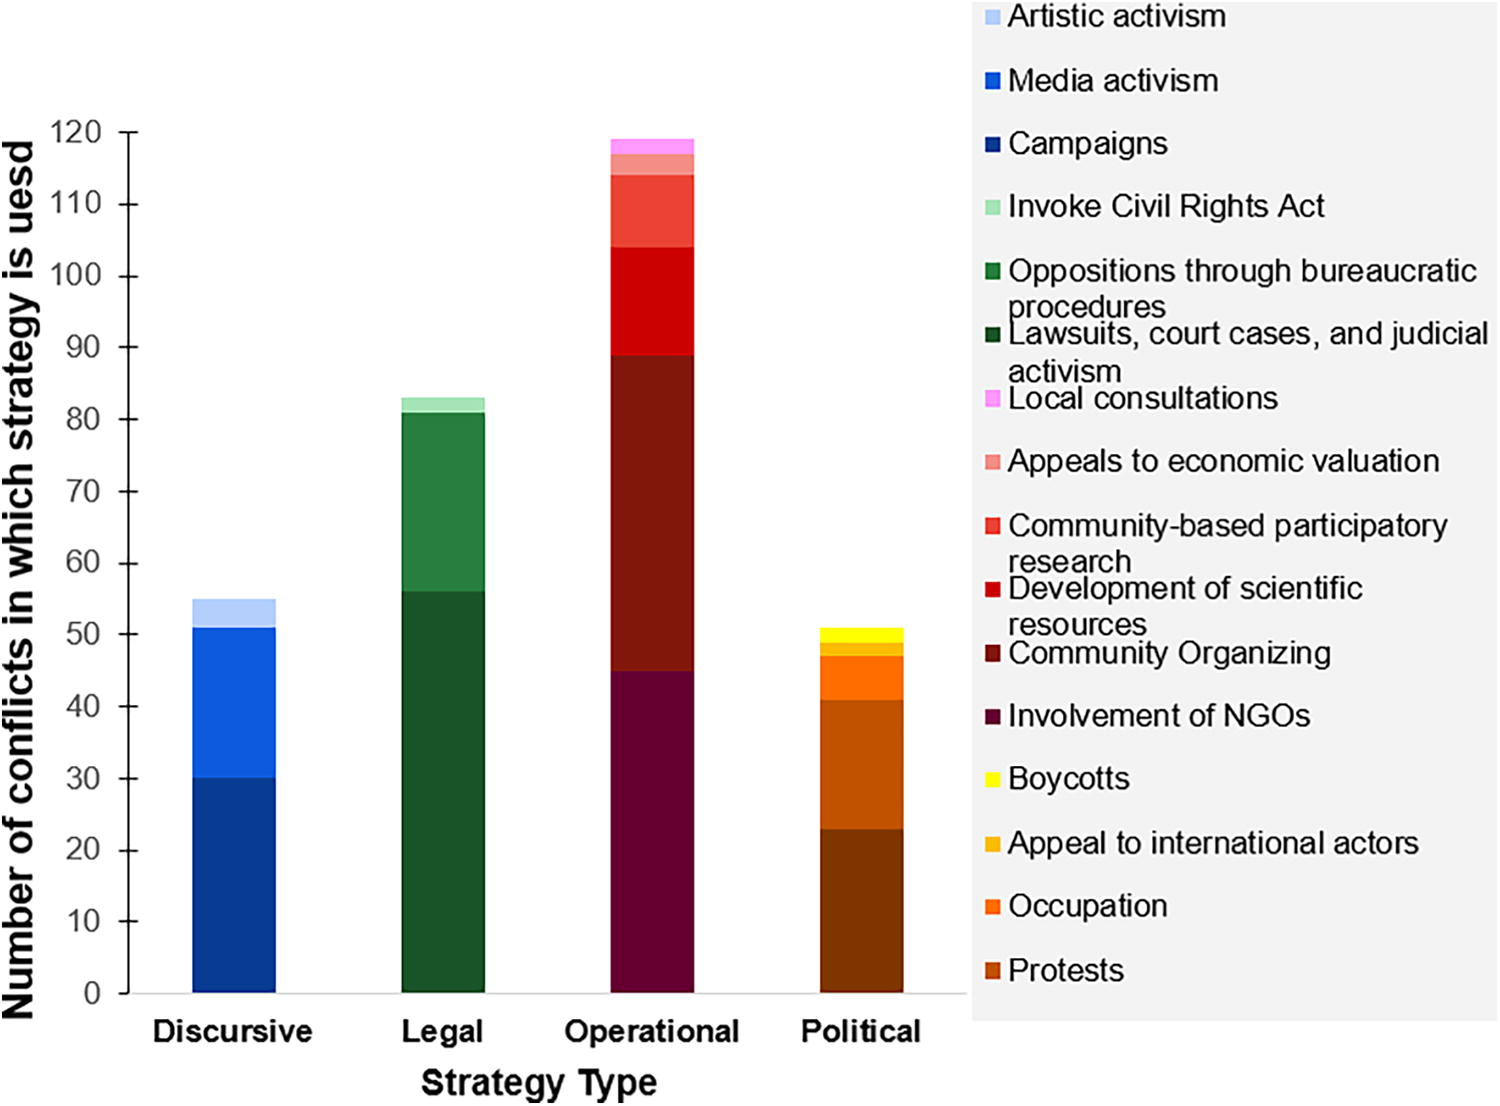
Use of resistance strategies by EJ actors across all conflicts. Strategies are grouped by type, with specific strategies indicated by color. Because more than one strategy could be used in each conflict, bars may sum to more than 100% of conflicts.
Extractive strategies
Industrial and private entities use multiple strategies to move their extractive activities forward. These strategies were also coded into the same four categories: discursive, legal, operational, and political. A total of 16 unique strategies were identified, with an average of two strategies used per case. A few cases had no clearly identifiable strategies, and one case had six different strategies in use (Fig. 6). Although EJ actors primarily relied on operational and legal strategies, extractive actors most often used discursive strategies. Specifically, “Denial of Impacts,” in which the extractive entity denied or underestimated the negative impacts the proposed activity would have on local communities, was the single most commonly employed strategy, used in 58% (n = 51) of conflicts. Operational strategies were the second most common strategy type observed across conflicts. Specifically, “Noncompliance with laws and regulations” and “Inadequate Environmental Impact Report (EIR)/Environmental Impact Statement (EIS)” were commonly identified in 28% (n = 24) and 25% (n = 22) of conflicts, respectively. EIRs and EISs are project assessments required by the California Environmental Quality Act and National Environmental Protection Act that document projects’ potential impacts on human and nonhuman environments and identify project alternatives or mitigation measures to offset negative consequences of the projects. An extremely common theme among EJ conflicts is for project proponents to underestimate or overlook anticipated project impacts in the EIR/EISs they prepare. Noncompliance with laws and regulations often included inadequate maintenance or safety standards at industrial facilities, leading to preventable accidents and exposures.
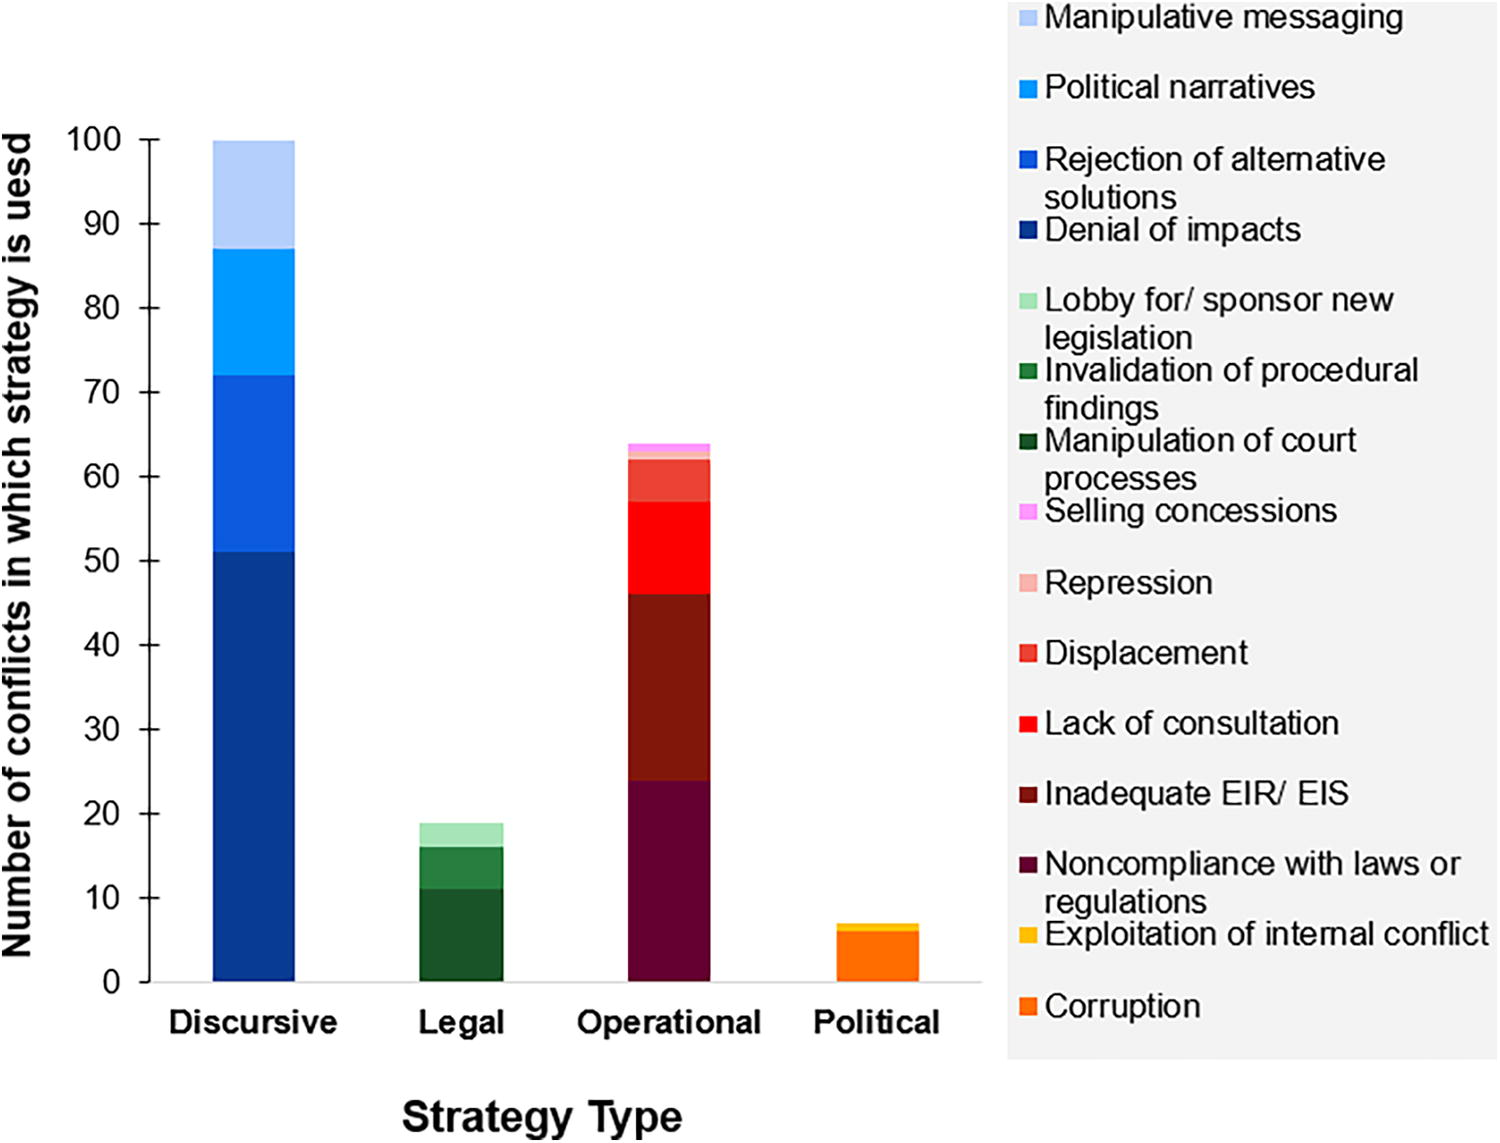
Use of extractive strategies across all conflicts. Strategies are grouped by type, with specific strategies indicated by color. Because more than one strategy could be used in each conflict, bars may sum to more than 100% of conflicts.
CONCLUSIONS
The 87 conflicts documented in the new Coastal California EJ Conflicts Database show how widespread EJ conflicts are across coastal California, though concentrated in more populated regions. Conflicts also occur across many different natural resources (i.e., energy, water, land, pollution) and involve both disproportionate exposure to environmental harm and exclusion from environmental goods. Reviewing these conflicts together depicts the extent and evolution of the EJ movement in California, showing how many diverse actors—from large multinational environmental nongovernmental organizations (e.g., Sierra Club and Natural Resources Defense Council) to small community-based organizations—are engaged in different conflicts and the diversity of strategies leveraged to resist extractive activities to protect the health, well-being, and livelihoods of communities. While we emphasize the value of comparative analysis across EJ conflicts and present an initial summary of the rich data compiled in the new database, there remains much to be explored in understanding the patterns across conflicts, as well as further in-depth dives on specific cases or pairwise comparisons.
This database, similar to others of its kind,72,73,74 builds significant potential for comparative analyses that can improve understandings of the involvement of different EJ actors and use of different mobilization strategies influence conflict outcomes, while accounting for other dimensions of conflict severity, intensity, and longevity, and the legal and political context in which they take place. For example, future analyses leveraging the database may seek to examine the efficacy of using a specific mobilization strategy by comparing the outcomes of all conflicts that leverage that specific strategy, while accounting and controlling for other differences across conflicts. This may help to illuminate whether there is a specific EJ mobilization strategy or suite of strategies that appear to be particularly effective under specific circumstances. Likewise, comparative EJ conflict databases also permit exploration around extractive activity actors, allowing the potential to reveal “repeat offenders,” including if and how the same actors use similar strategies across contexts or if there are strategies that make extractive activities particularly resilient to EJ resistance efforts. Evaluating the efficacy of strategies across contexts and what types of actors tend to use similar strategies can be helpful to inform the development of future campaigns. For example, the database could inform EJ organizations’ selection of mobilization strategies on a future conflict when specific extractive industry actors are involved, or the database could help inform proactive planning of an evolving campaign that leverages different strategies during various stages of conflict severity.
Further evaluations of strategies could explore long-standing questions proposed in EJ scholarship, such as whether community demographics and/or sociopolitical contexts influence the selection or efficacy of operationalizing different mobilization strategies.75,76 As previous literature has shown, the EJ movement has evolved in its adoption of different dominant strategies (i.e., insider versus outsider tactics) over the past few decades and across contexts in response to many factors, including institutionalization of EJ organizations, funders’ requirements, advocates taking up positions within government, and increased legal tools to leverage 77 . This database, and others of its kind, may be useful tools to inform a “third wave” evolution of the EJ movement, wherein campaigns strategically select from the diverse toolbox of mobilization strategies based on specific conflict attributes, actors (EJ, extractive industry, and government) involved, and demonstrated past successes or failures of specific strategies used in similar conflicts.
Moreover, there is potential for more sophisticated social network analysis with the actor-level data captured in the database. For example, we also see value in exploring how actors occupy different structural positions in EJ networks and whether and how this may promote learning, information or resource sharing, and collaboration across EJ conflicts. In addition, some EJ scholars that have examined “spillover” influences on the modern EJ movement, that is how actors, tactics, and ideas driving the EJ movement have been adopted from or spilled over from other related social movements, such as the Civil Rights movement and Chicano labor movement.78,79 The actor-level data in our database may allow for advancing this scholarship on spillover effects, by tracing whether and how the involvement of specific actors lead to the use of particular strategies, on the EJ or extractive industry sides, across conflicts over time. Further data collection and analyses should pay specific attention to which actors lead which mobilization strategies, to better understand how the engagement of different actors (EJ, extractive industry, or government) shape the coevolution of conflicts and outcomes over time.
While beyond the scope of this initial article to present the open-access living EJ conflicts database, a next important step to this work will be to analytically evaluate what factors influence conflict outcomes, across the wide range of conflict types, size, and scope catalogued in the database. As referenced in the background literature, available EJ research to date heavily relies on in-depth analyses of individual conflicts, rather than quantitatively assessing the social factors that influences the efficacy of EJ mobilization efforts across many conflicts. While most conflicts in the database have achieved some improvements in equitable outcomes, less than one-third of conflicts were classified as having reached restorative justice goals, or outcomes that deliver reparations for past environmental and social harms. As much progress as EJ activists have made in the past half century, advances have mostly centered around incorporating EJ into policy approaches, improving inclusion in decision-making processes by demanding more representation, and holding government agencies more accountable. Beyond the procedural and distributive progress, there is much work still to be done to adequately recognize past harms and move from recognition to retribution, through proposals for restorative justice. As this database documents, mobilization efforts in California are powerful in their ability to stand up to extractive activity actors and government entities that inadequately account for power asymmetries and permit activities that lead to disproportionately distributed environmental goods and harms. Understanding how EJ communities mobilize and resist harmful activities can help to inform policies and programs that seek to improve planning, consultation, project design, impact mitigation, and no-project alternatives. Moreover, understanding when and what facilitates effective mobilization against extractive activities can facilitate more effective EJ campaigns in future inevitable conflicts. In this way, we seek to empower the frontline communities and advocates fighting for justice and sustainability with information and resources from comparable conflicts to inform more effective strategies that move beyond the procedural and distributive, and toward recognitional and restorative justice. We aspire for the dataset, interactive map, and the descriptive analysis of the coastal California EJ conflict distributions, drivers, actors, and mobilization strategies presented in this article to advance comparative assessment and learning across EJ conflicts in California.
Footnotes
ACKNOWLEDGMENTS
The authors would like to acknowledge the time and expertise shared by numerous environmental justice advocates and researchers who provided project guidance, interviews, and expert reviews of the database. Moreover, we thank the tireless efforts of community residents and environmental justice advocates who advocate and fight to protect the health and safety of communities and environments.
AUTHORS’ CONTRIBUTIONS
J.R. contributed and provided leadership on paper Conceptualization, Methodology, Software, Validation, Formal analysis, Investigation, Resources, Data Curation, Writing—Original Draft, Writing—Review & Editing, Visualization, Supervision, Project Administration, and Funding Acquisition. L.E.M.B. contributed to paper Conceptualization, Methodology, Resources, Writing—Original Draft, Writing—Review & Editing, Funding Acquisition. J.C. contributed to paper Methodology, Software, Validation, Investigation, Data Curation, Writing—Review & Editing, and Visualization. J.D.P contributed to paper Methodology, Validation, Investigation, Data Curation, Writing—Original Draft, Writing—Review & Editing, and Visualization. J.F. contributed to paper Conceptualization, Methodology, Validation, Investigation, Resources, Data Curation, Writing—Review & Editing. A.Y. contributed to paper Investigation and Data Curation. H.P. contributed to paper Conceptualization, Methodology, Validation, Investigation, Resources, Data Curation, Writing—Review & Editing, Visualization. M.C. contributed to article Conceptualization, Methodology, Validation, Investigation, Data Curation, and Visualization.
AUTHOR DISCLOSURES
The authors have no conflict of interest disclosures to report.
FUNDING STATEMENT
This research was supported with funding from the University of California Davis’s The Green Initiative Fund (Project ID: W20-44) and California Sea Grant.
Supplementary Material
Please find the following supplemental material available below.
For Open Access articles published under a Creative Commons License, all supplemental material carries the same license as the article it is associated with.
For non-Open Access articles published, all supplemental material carries a non-exclusive license, and permission requests for re-use of supplemental material or any part of supplemental material shall be sent directly to the copyright owner as specified in the copyright notice associated with the article.