
Abstract
In recent decades, urban areas have faced increasing flood risk, disproportionately affecting marginalized groups. The 1930s redlining practices in the United States have had socioeconomic and environmental impacts in multiple cities. However, there remains an incomplete understanding of the relationship between redlining and urban flood risk. This study addresses this need by investigating the spatial distribution of green infrastructure (GI) and impervious surfaces, as influential factors in mitigating and exacerbating flood risk, respectively, in the flood-prone redlined zones in Houston, Texas. Census blocks that intersected with floodplains and redlining map categories were identified, assigning redlining classes based on the overlap percentages. The proportions of impervious surfaces and GI elements were extracted from land cover data. Their median ratios were compared across redlining categories, and significant clusters of high imperviousness and low GI were mapped. The study found higher imperviousness and lower GI median ratios in redlined zones with strict housing loan restrictions categorized as “Hazardous” and “Definitely Declining.” In addition, the significant clusters of high imperviousness and low GI were mainly located within these redlining zones. The spatial and temporal resolution limitations of available data are acknowledged. Higher-resolution land cover data spanning different periods and comprehensive flood hazard datasets including future climate change scenarios are recommended for more accurate analysis. This study linked prior research on flood risk disparities and historical discriminatory practices, revealing significant spatial relationships between Houston’s redlined zones and the distribution of GI and imperviousness in flood-prone areas.
INTRODUCTION
Flood risk can strongly be tied to social and environmental justice discourses. Environmental inequity as the biased distribution of landscape of risk has effectively made some communities more vulnerable to natural hazards such as flooding. 1 Social, political, or economic marginalization of some groups of people has impacted their socioeconomic status owing to disparities in access to resources. Consequently, such minorities are more vulnerable to floods and other natural disasters. It is also more likely for those people to reside in high-risk floodplains and less resistant structures. 2
Green infrastructure (GI) as a connected open and green spaces system can play an important role in flood mitigation. 3 It can be helpful for stormwater management, improving the natural infiltration and providing stormwater storage. 4 In addition, GI development can conserve the natural ecosystems and their services for urban communities. 5 It is also effective for mitigating the environmental impacts of urbanization, especially impervious surface development, carbon emissions, global warming, and climate change. 6 Moreover, equitable development of GI can provide fair access to green spaces, ecosystem services, and more decent neighborhoods for urban communities. 7
In contrast, imperviousness is an influential factor contributing to the flood hazard, affecting the hydrological cycle. Urbanization has caused the conversion of open and vegetated soils to impervious surfaces. In addition to exacerbating climate change, the vast development of such surfaces has reduced the infiltration rate and increased the runoff while minimizing the evapotranspiration by vegetation. 8 Therefore, urban communities that are more disconnected from the natural hydrological cycle and its flood-controlling functions are potentially at a higher risk. 9
Some previous urban planning and development decisions have impacted the environmental equity in the United States, causing unfair distribution of open spaces, GI, and impervious surfaces. 10 The redlining activities in the 1930s were examples of systemic discrimination efforts supported by federal agencies and local authorities. 11 To protect from foreclosure in the aftermath of the Great Depression, the Home Owners’ Loan Corporation (HOLC) created a neighborhood ranking system in more than 200 U.S. cities to assess the financial risk of housing loans. The HOLC worked with local bankers and realtors through the City Survey Program to classify the urban blocks into four categories. The first group shown in green and called “Best” or “A” was described as the hot spots of the most reliable areas where mortgage lenders were encouraged to make their maximum loans (75%–80% of appraised values) to the residents. The second class marked in blue was “Still Desirable” or “B” including the neighborhoods where the mortgage lenders could tend to commitments with a lower rate (65% of appraised values). The next category was presented in yellow and named “Definitely Declining” or “C,” indicating the urban areas known as “obsolescence and infiltration of lower grade population” where the mortgages should be made more conservatively with the rates much lower than the above groups. The last grade was displayed as “Hazardous,” “Red,” or “D” described as “under-desirable population or an infiltration of it.” The HOLC-recommended lenders refuse to make loans in such neighborhoods or only lend limitedly in an extremely conservative way. The results were reflected on each city’s color-coded document titled Residential Security Map used by the Federal Housing Administration and private lenders while deciding on housing loans for decades. 12
The community activists investigating the unfair lending practices in Chicago’s Austin neighborhood in the late 1960s coined the term “Redlining” for those efforts for the first time, referring to the red polygons drawn on the maps to decline loaning services to those neighborhoods. 13 Although the HOLC’s primary purpose was not racial segregation, the assessors’ evaluations affected by their ethnic and racial judgments changed the City Survey Program into a tool for discrimination against minorities and immigrants. 14 Consequently, it limited the financial resources and investment opportunities for neighborhoods that had racial minority residents. 15
Redlining was prohibited in the United States after being announced illegal by the Fair Housing Act of 1968, but its socioeconomic and environmental impacts on the redlined areas continued to exist. 16 In recent years, the new surge of social movements supporting minorities has heated the redlining discussions again. Through a new research interest in recent years, a few scholars have worked on environmental impacts such as urban heat 17 and green spaces or tree canopies. 18
A large part of the literature reflects the functions of GI in urban flood mitigation, and recent published work has related the GI spatial patterns to social contexts and backgrounds in cities. Specifically, by this point, we have not been able to find any published articles about the redlining consequences and flood risk. Therefore, this study was guided by the following research question to fill the need: What are the effects of social discrimination efforts of the past on today’s flood risk? We addressed the question investigating the impacts on the locations of GI and imperviousness as the effective factors on the risk. The goal was to test this hypothesis in the following study area: The distribution of GI and impervious surfaces as influential factors on flood risk in the U.S. urban communities is spatially correlated with the redlining maps of the 1930s.
This study built upon previous research investigating the uneven distribution of flood risk 19 and impact analysis of historical discriminatory practices 20 to examine the interconnections. We overlaid and analyzed the spatial patterns of GI and imperviousness in or adjacent to the flood-prone lands with HOLC’s Residential Security Map in Houston, Texas, using the appropriate geospatial data analytics and statistical methods to discover significant relationships.
The Methods section describes the study area and units, data collection, and analysis procedures. Next, the significant findings of the experiment are presented. Then, the limitations and caveats of the processes are discussed. Finally, the conclusions section provides an overview of the results, the implications and contributions to the field, and the potential avenues for future research.
METHODS
In this section, we provide details of the data collection and analysis stages used for the study area. We pay close attention to selecting methods that align with our research goal while taking into account the data availability.
Study area and scale
Houston has gained widespread concern for its recurrent flood events among the large cities in the United States. Notable examples include floods caused by Tropical Storm Allison in 2001, Hurricane Rita in 2005, Hurricane Ike in 2008, and Hurricane Harvey in 2017, as well as other deadly floods in 2015 and 2016. These events have resulted in significant human and physical losses within the area. 21
Located in the southeastern part of Texas, in close proximity to Galveston Bay and roughly 80 km away from the Gulf of Mexico, lies the city of Houston. It occupies a pivotal location where multiple interstate highways, namely, I-10, I-45, and I-69, intersect. The city’s population composition reflects a remarkable diversity, with ∼32% identifying as White, 21% African American, 8% Asian, 1% American Indian or other Natives, 21% of some other races, and 17% of two or more mixed races. 22
For our study, the census blocks of 2020 23 were the units of analysis. Census blocks delineated by various features such as streets, roads, railroads, bodies of water, observable physical or cultural features, and legal boundaries are the smallest spatial divisions used by the United States Census Bureau to collect and analyze data during the decennial census.
Data collection
The digitized Residential Security Map for Houston was downloaded from the American Panorama database published by the Digital Scholarship Lab at the University of Richmond. 24 We used the 10 m WorldCover 2021 (v200) 25 data of the European Space Agency (ESA) to obtain the impervious surfaces and GI components for our study. For mapping the 100- and 500-year floodplains, we downloaded the data of the Federal Emergency Management Agency (FEMA) from the website titled “FEMA’s National Flood Hazard Layer (NFHL) Viewer.” 26
Data analysis
Target blocks
Using ArcGIS Pro Version 3.1, 27 we extracted FEMA’s 100- and 500-year floodplains from the NFHL dataset. The 100-year floodplains demarcate areas of high risk, with a 1% chance of being inundated in any given year. The 500-year zones indicate moderate-risk locations, with a 0.2% likelihood of flooding occurring within a year. First, we overlaid the census blocks with the above zones to determine the at-risk blocks intersecting any of these layers with at least a 0.2% annual chance of flooding. Then, from those census blocks, we selected the ones with at least 50% overlap with the classes on the Residential Security Map. We assigned an HOLC code to each block by determining the category with which it had the greatest overlap. All subsequent experiments were conducted exclusively on these selected blocks, which we refer to as target blocks.
Imperviousness analysis
This stage of the study concentrated on the distribution of impervious surfaces within the target blocks in Houston. Recognizing that imperviousness can contribute to flooding even when found outside designated floodplains, we analyzed the entire area of the target blocks rather than solely considering the overlap with flood zones. For this purpose, we computed the count of grid cells categorized as “Built-up” in the WorldCover dataset for each target block, then multiplied it by the grid cell area (100 m2). The resulting values were then converted to hectares and normalized as percentages relative to the total block area.
We used data analysis software of R (R-4.2.3) to program statistical analyses on the result to examine the significant differences in the median imperviousness ratio in census blocks among the redlining groups. The quantile–quantile (QQ) plot and Shapiro–Wilk test indicated that the percentage values were not in a perfectly normal distribution. Therefore, we preferred to use the nonparametric Kruskal–Wallis analysis of variance, which is less sensitive to distributional assumptions, to assess the among-group variations.
Furthermore, we applied suitable methods to analyze the spatial pattern of imperviousness in relation to the HOLC categories. We used the Getis–Ord local statistics within ArcGIS Pro to identify the clusters of high values, known as hot spots, of impervious surface percentages with at least a 95% confidence interval. The technique generated z-scores and p-values for individual blocks while considering the neighboring ones, allowing for the detection of clusters.
Green infrastructure analysis
This phase of the study examined urban green spaces as potential components of GI that could mitigate flood risks within the target census blocks. We investigated areas of green spaces throughout the entire target blocks, rather than solely within their flood zones, because such components can still be effective for flood mitigation even if located in the vicinity of floodplains.
The number of WorldCover grid cells for each target block in the relevant categories including “Tree cover,” “Shrubland,” “Grassland,” and “Herbaceous wetland” was determined. Then, with a method similar to the one described for imperviousness, we calculated the GI area by multiplying the numbers by the grid cell size and normalized the results as block area percentages.
Similar statistical processes in R were conducted to examine the normal distribution and variations of the ratios. Because the results showed a nonnormal distribution, we applied the Kruskal–Wallis test to analyze the significant differences in the mean percentages of GI among the blocks in different redlining groups. Finally, we used the same model of local statistics to map the cold spots or clusters of low GI areas to investigate their overlaps with the HOLC classes.
RESULTS
In total, 1,131 target blocks, covering an area of 2,583 hectares, were identified in Houston, representing census blocks with a minimum of 50% overlap with HOLC’s redlining categories and at risk of a 100- or 500-year flood. Figure 1 provides a visual representation of the study area, highlighting the selected target blocks, digitized redlining zones, and the floodplains.
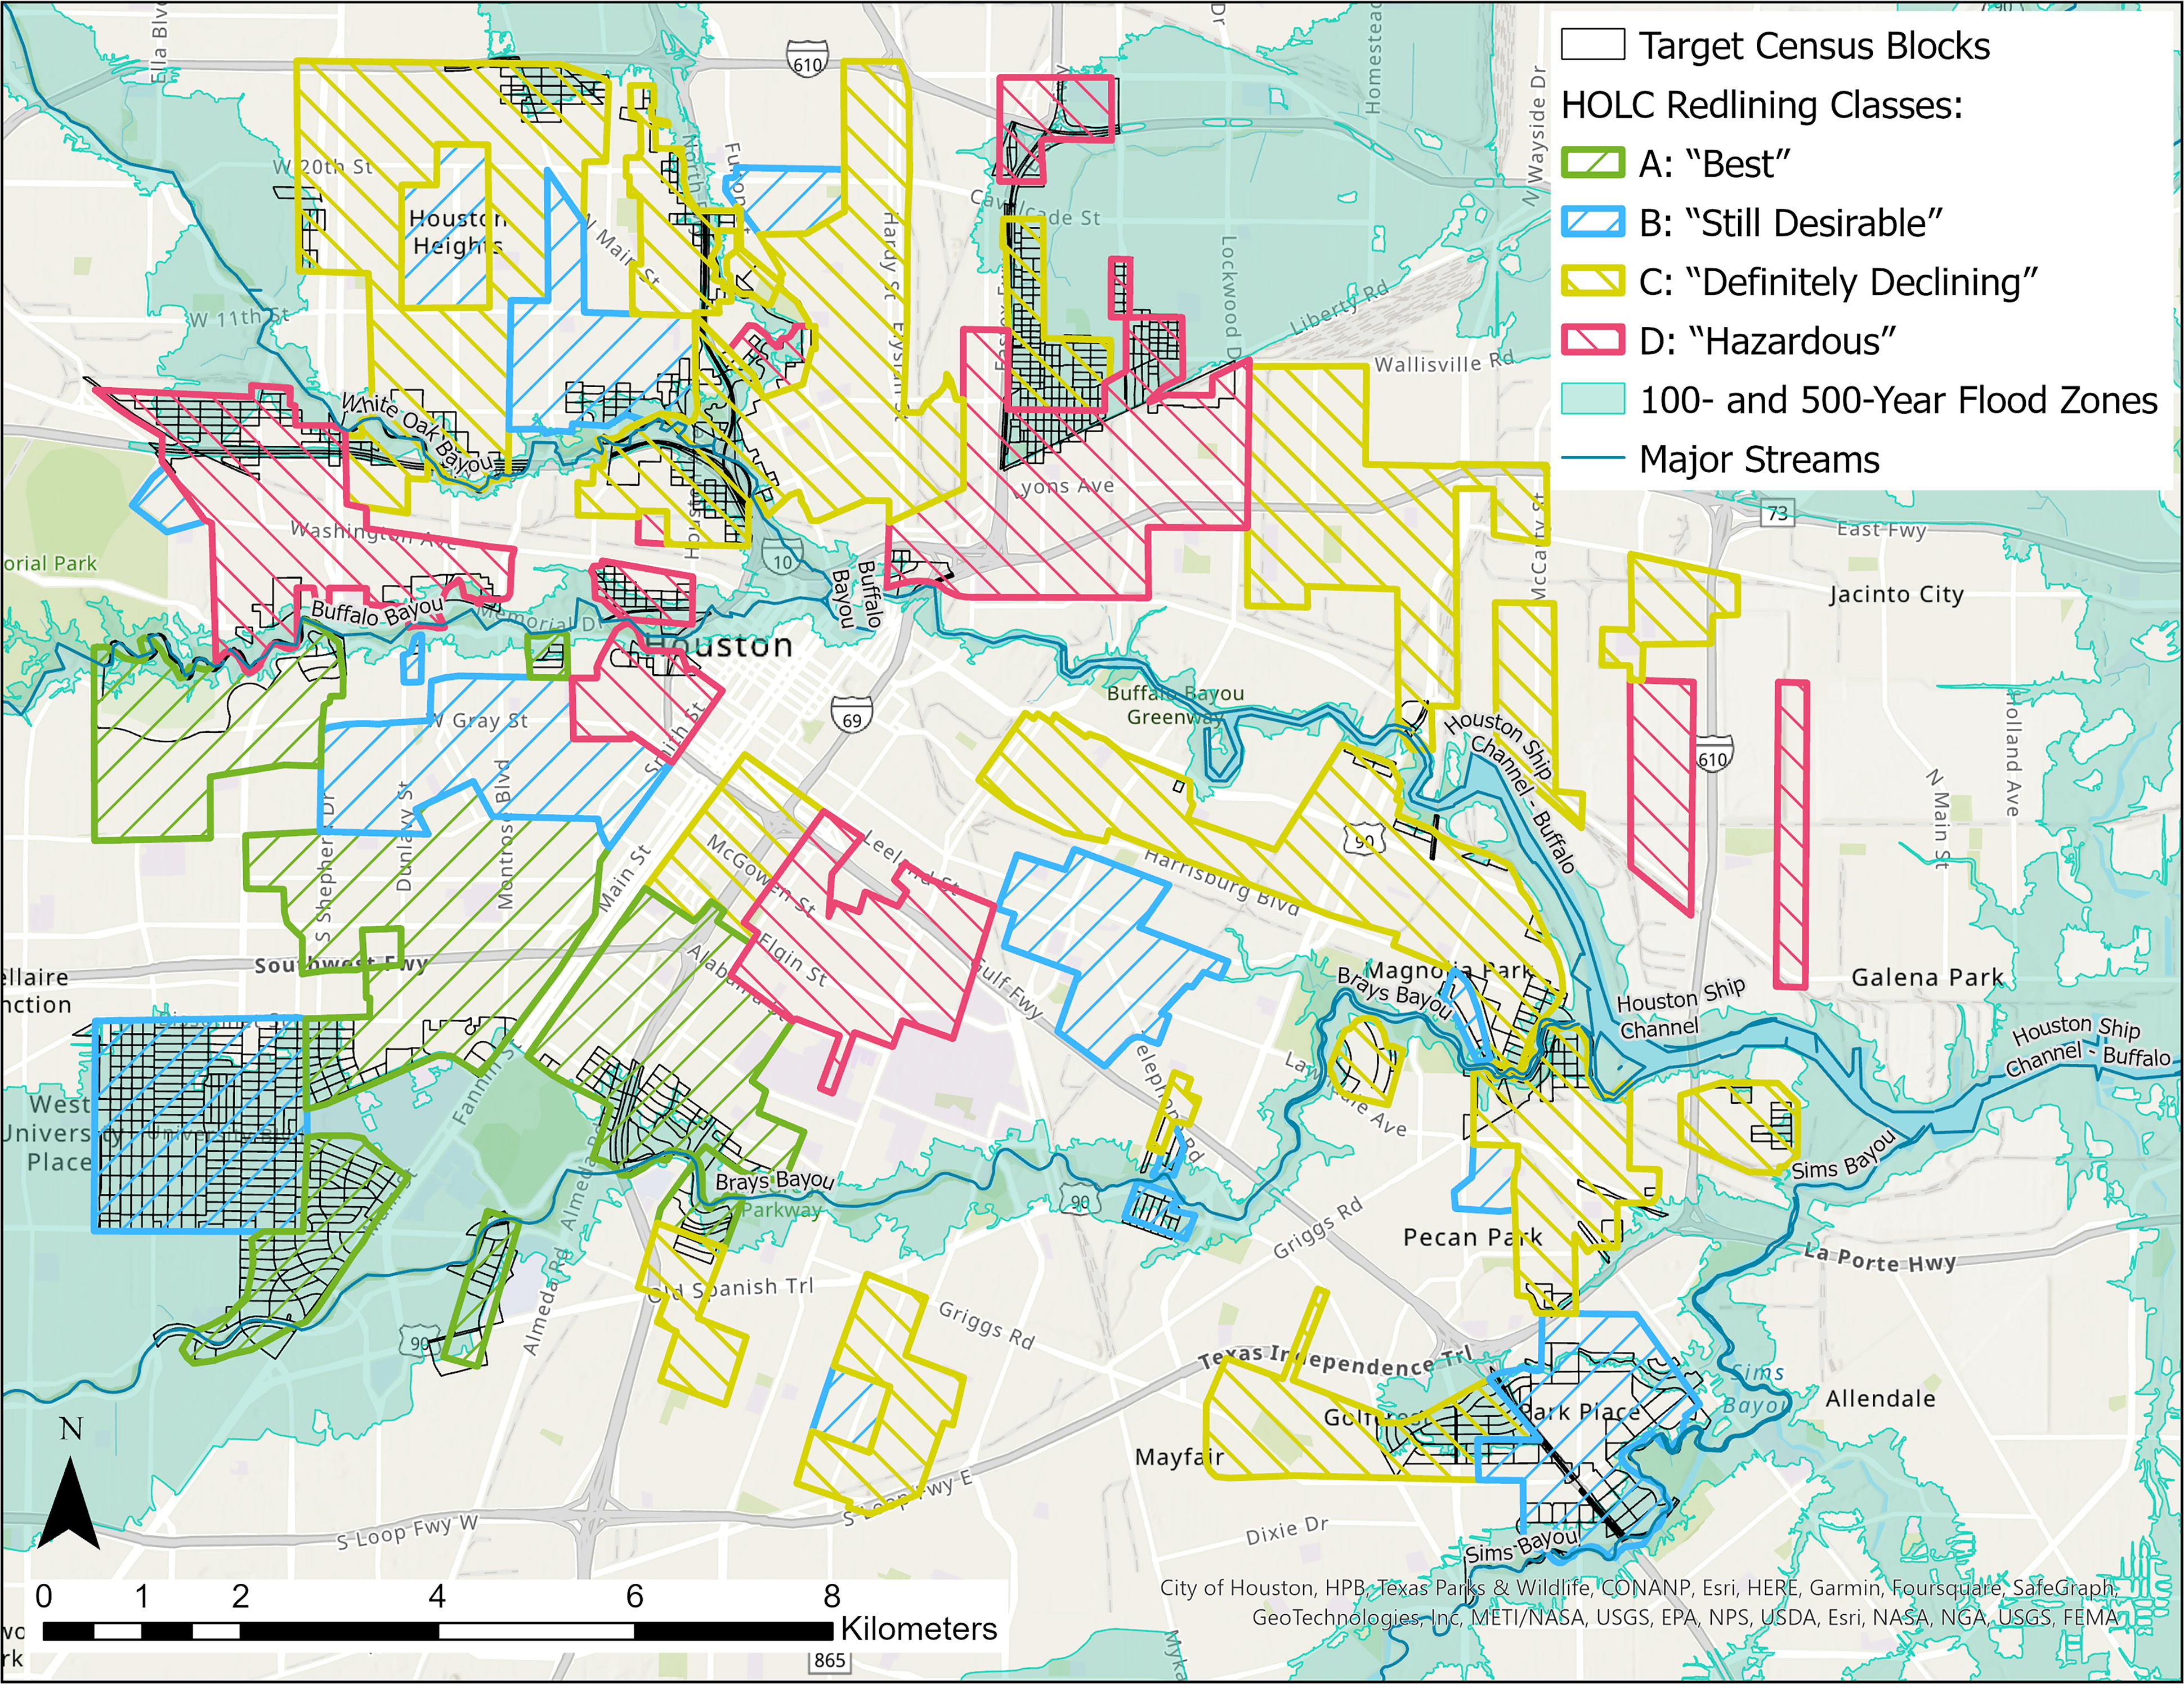
Target census blocks, the Home Owners’ Loan Corporation (HOLC) redlining classes, and Federal Emergency Management Agency’s (FEMA’s) flood zones in Houston.
Imperviousness and redlining
Figure 2 illustrates the impervious surfaces extracted from the WorldCover data within the target blocks. The analysis revealed that the median ratio of impervious surfaces across all target blocks was 52.0%. Table 1 presents the median percentages in the census blocks of each HOLC grade. As seen in the table, the ratios exhibited an increasing trend from classes “A” to “D.”
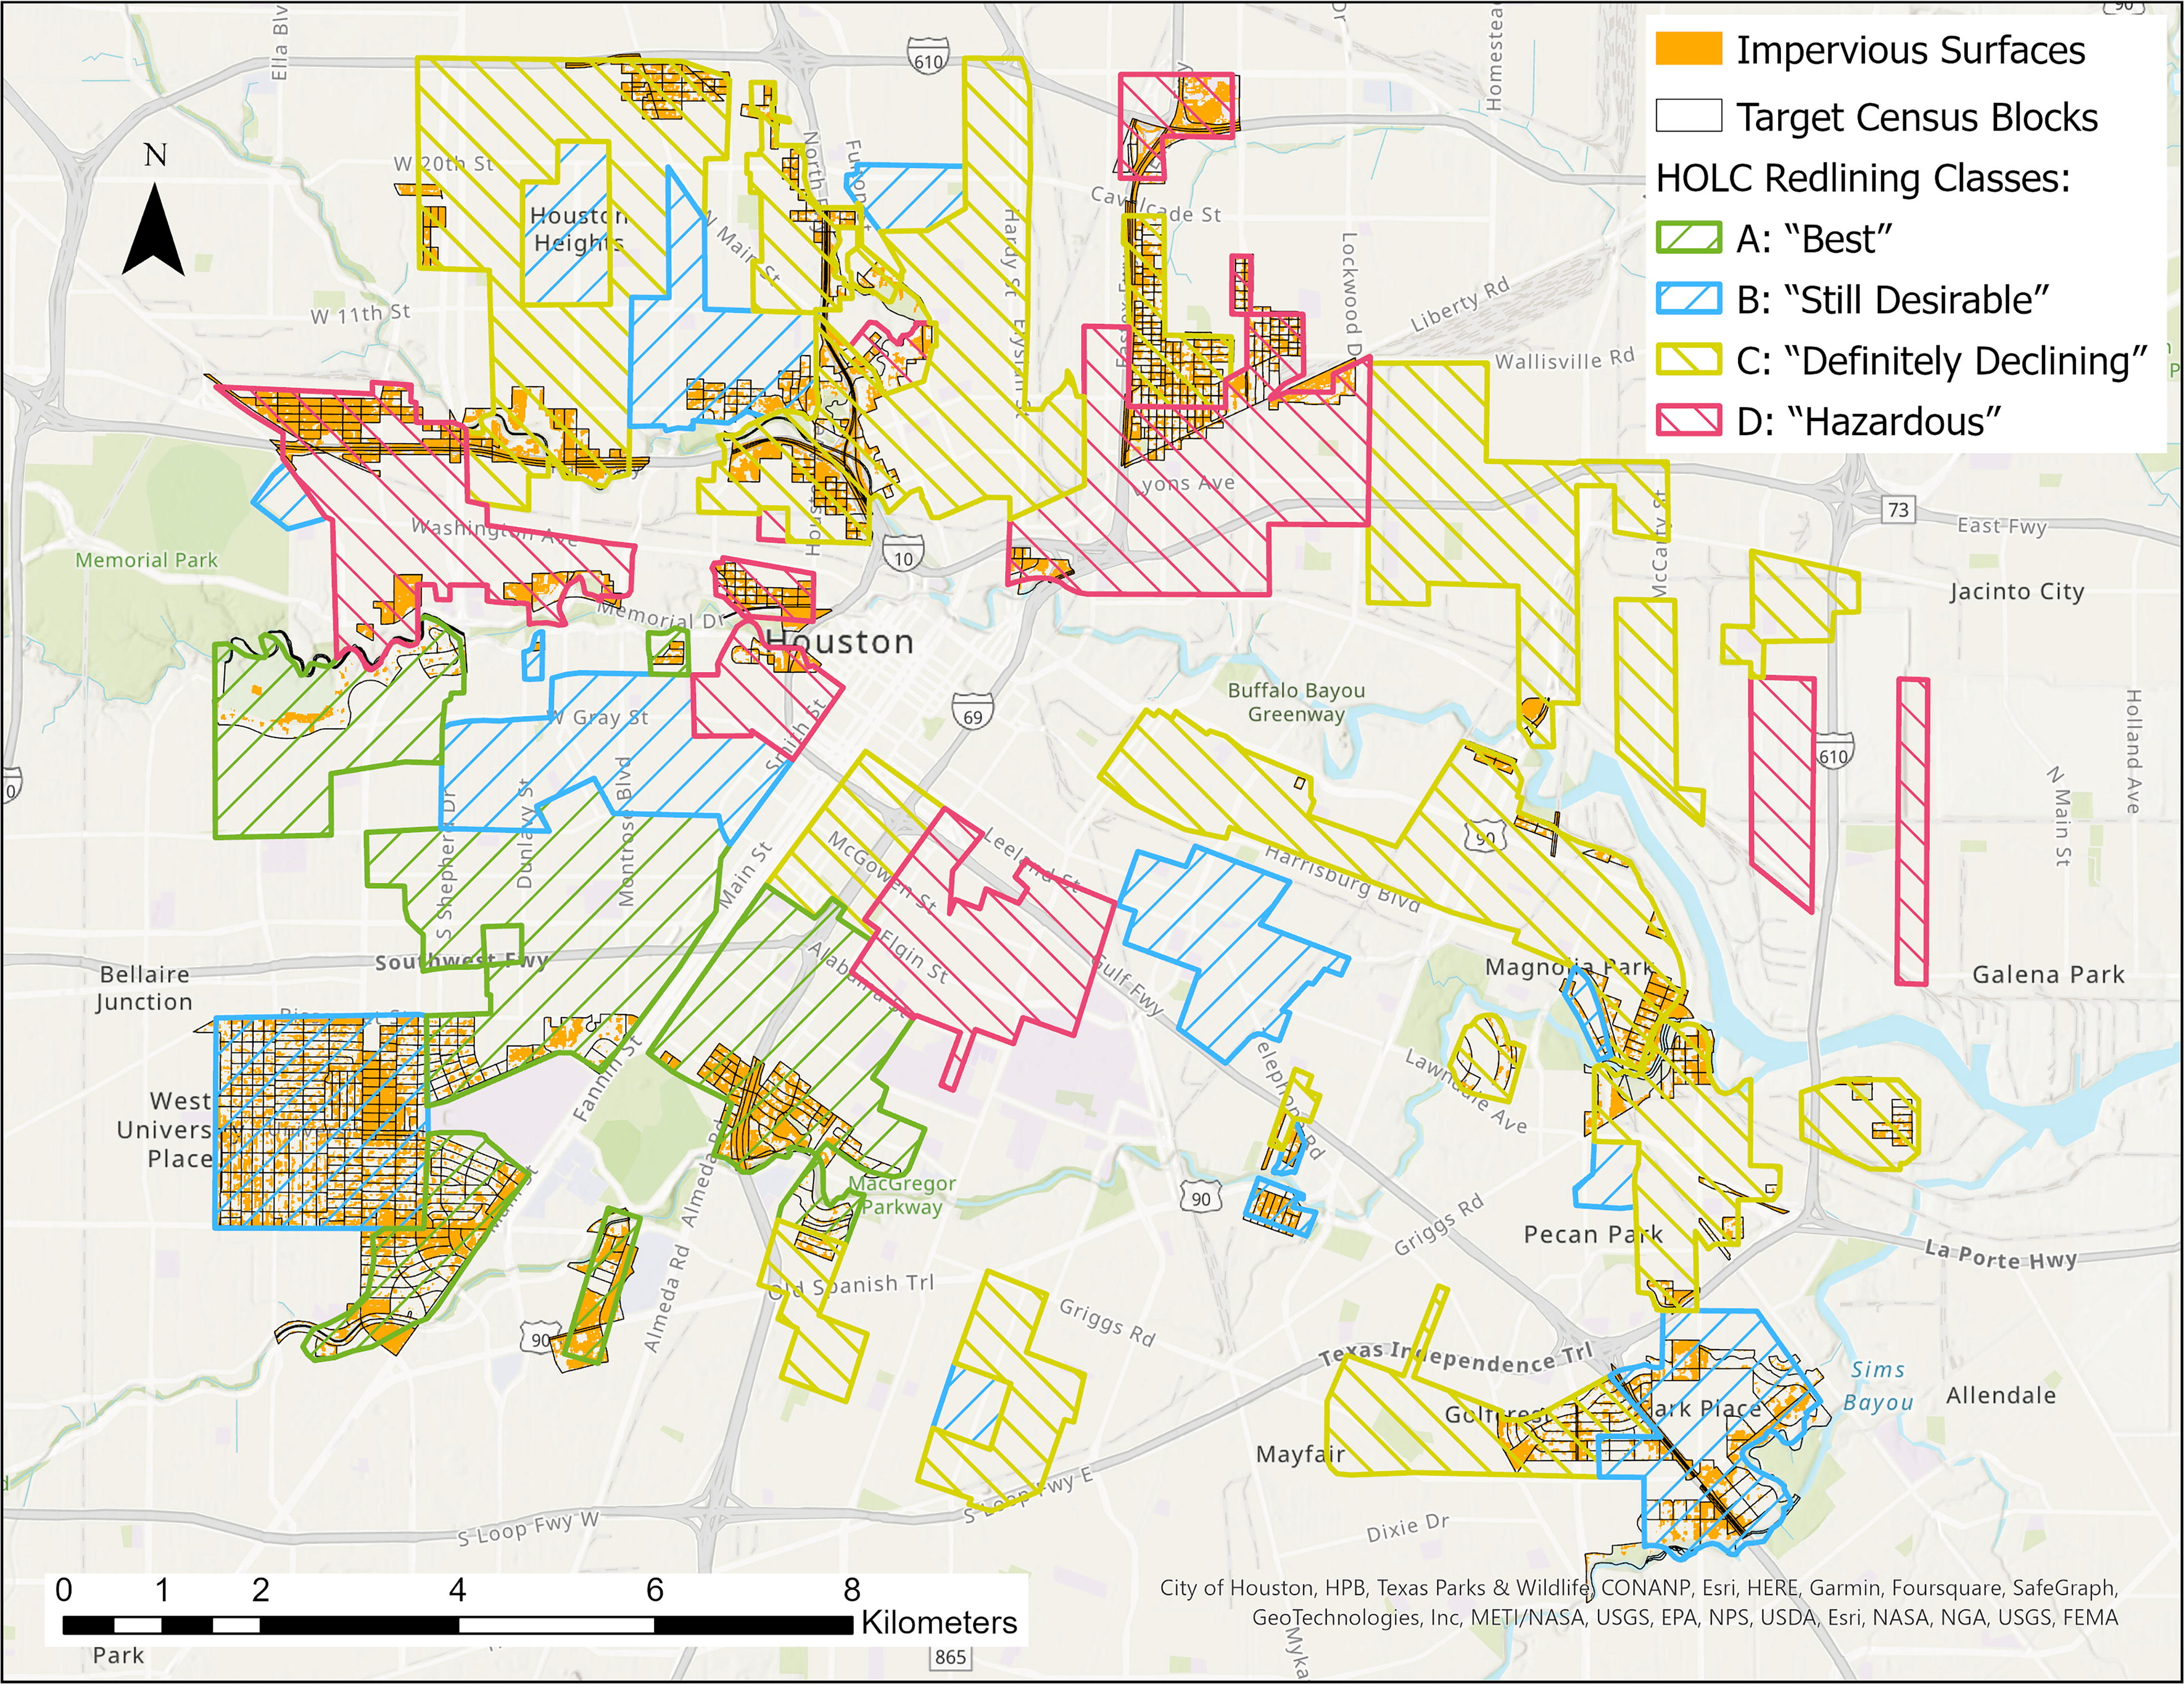
Impervious surfaces mapped in the target blocks and the Home Owners’ Loan Corporation (HOLC) redlining areas.
Median Impervious Surface Percentage in Target Blocks of Each HOLC Class
HOLC, Home Owners’ Loan Corporation.
In addition, Figure 3 displays the imperviousness percentages by the redlining grade. The Kruskal–Wallis test indicated a significant variation in the median imperviousness ratio among the HOLC groups (p-value < 2.2e-16). The post hoc pairwise analysis provided strong evidence that the median percentages of impervious surfaces in the blocks predominantly situated in areas classified as “D” (Hazardous) or “C” (Definitely Declining) were significantly higher compared with those in the blocks categorized as “A” (Best) or “B” (Still Desirable) (p-value = 0). The analysis did not show any significant difference in the median ratio between the classes of “A” and “B” (p-value = 1) nor between the “C” and “D” grades (p-value = 0.8695).
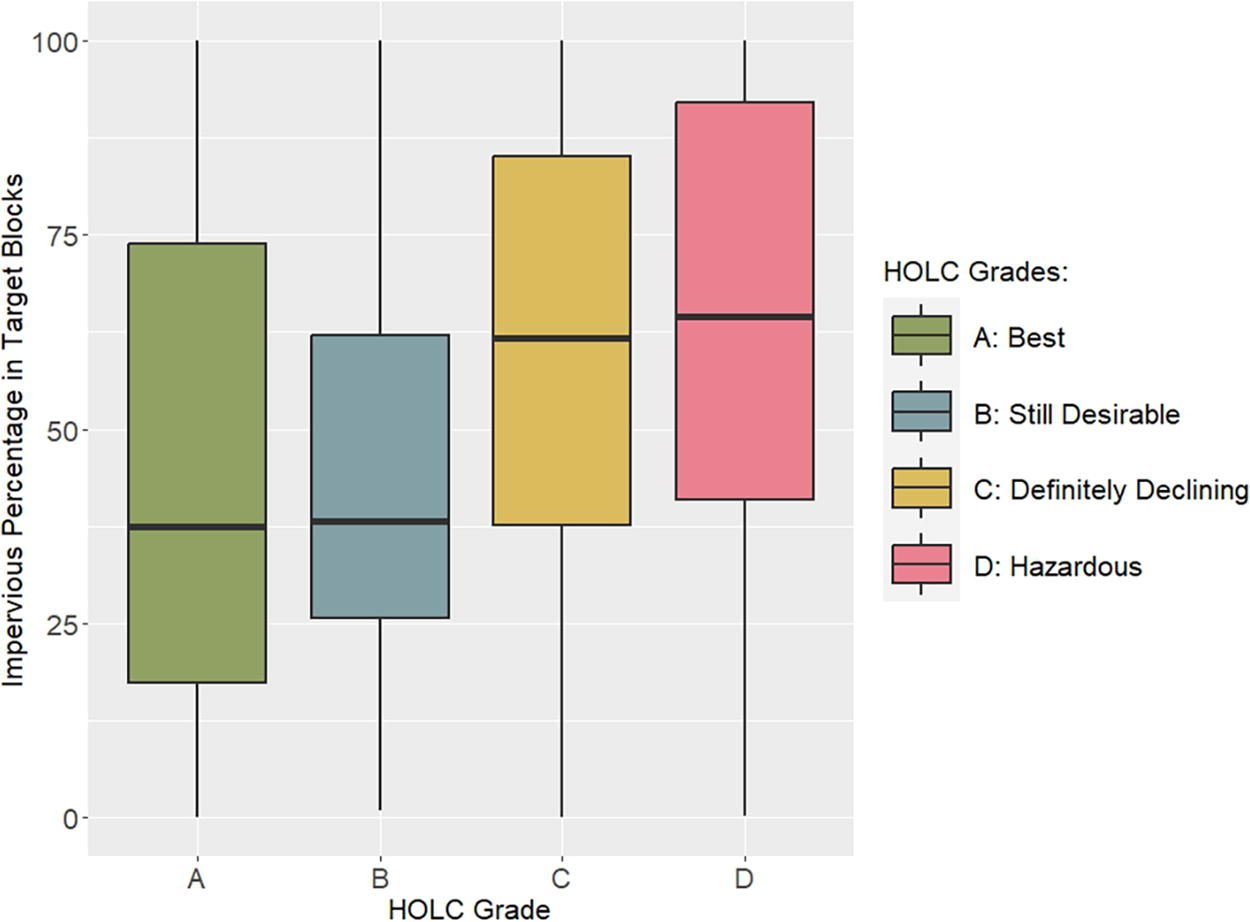
Box plot of impervious surface percentage in target blocks by the Home Owners’ Loan Corporation (HOLC) redlining grade.
With a confidence level of at least 95%, we could map impervious surface hot spots spanning a total area of 747 hectares within the target blocks. These hot spots appeared in the northwestern part of the study area where the blocks exhibited high ratios of imperviousness in close proximity to each other (Fig. 4). The largest proportion (over 45%) of these hot spot areas were situated within the HOLC grade of “C” (Definitely Declining) followed by the “D” (Hazardous) class (30%). Comparatively, the “A” and “B” zones had much smaller shares of 18% and 6%, respectively.
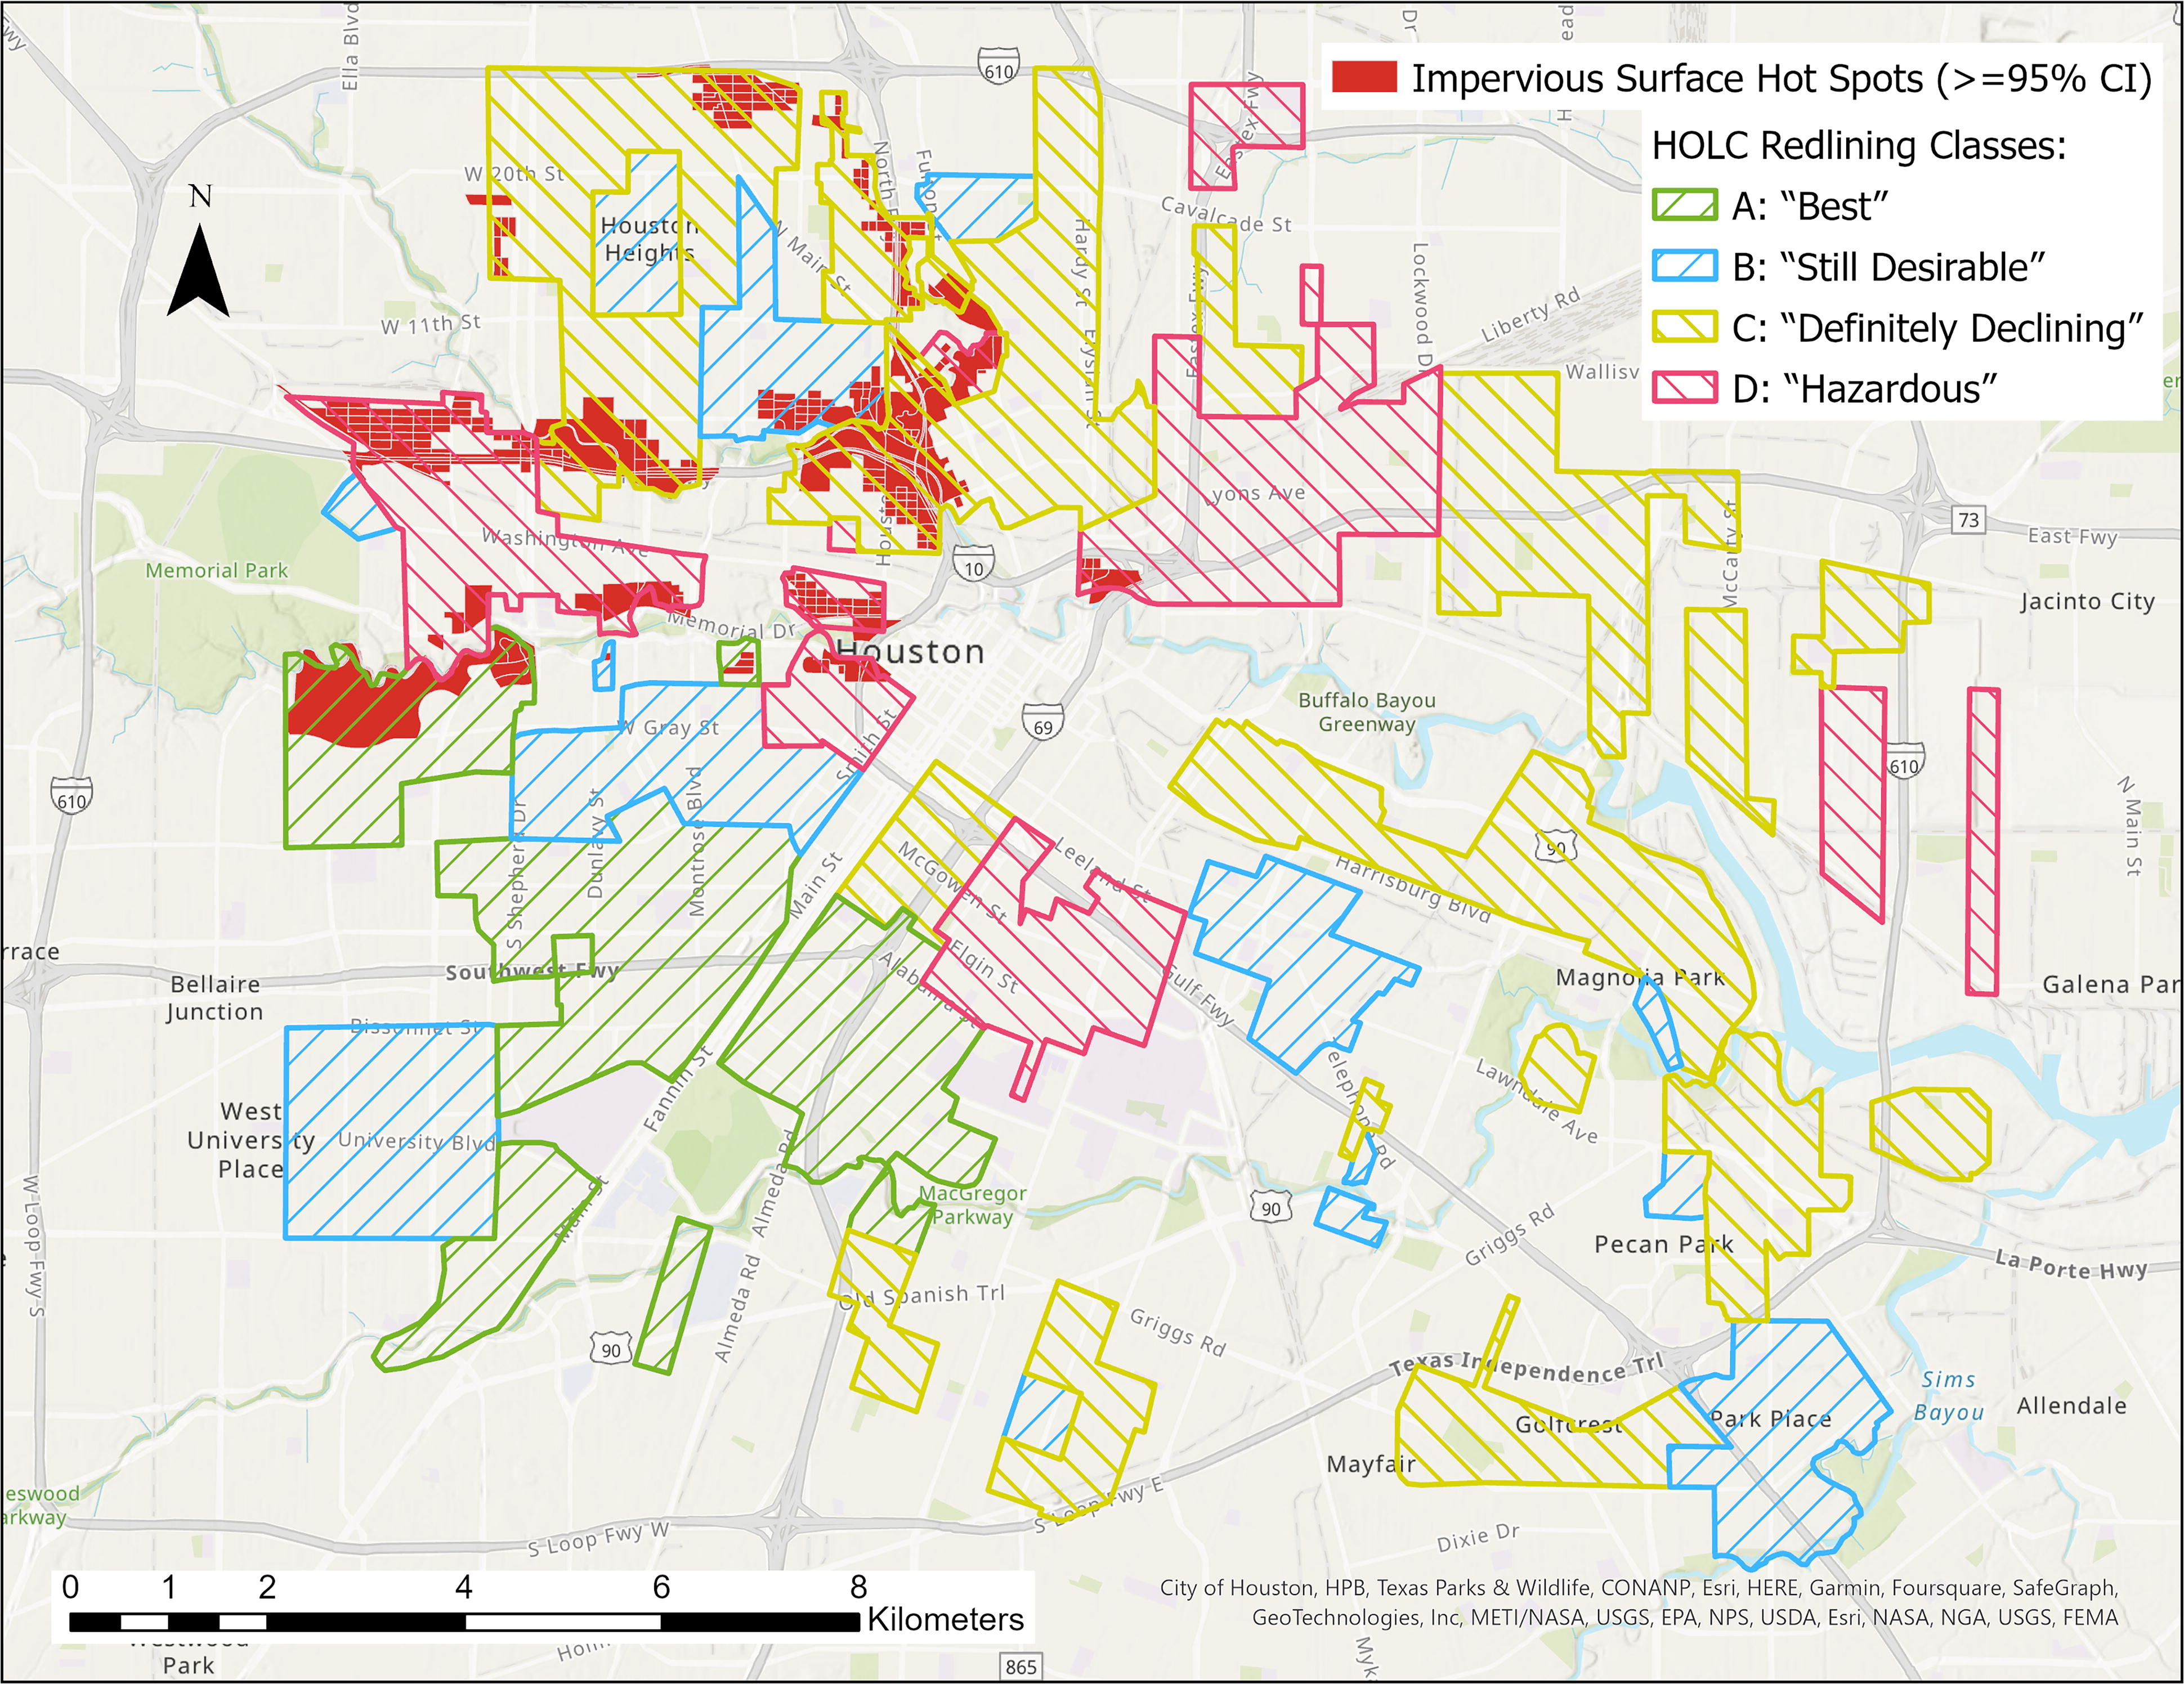
Impervious surface hot spots with at least a 95% confidence interval (CI) and the Home Owners’ Loan Corporation (HOLC) redlining grades.
Green infrastructure and redlining
Figure 5 displays the GI obtained from the WorldCover dataset within the target blocks. The analysis indicated a median ratio of 46.9% for GI areas across all target blocks. Table 2 shows the median percentages in the census blocks categorized by each HOLC class.
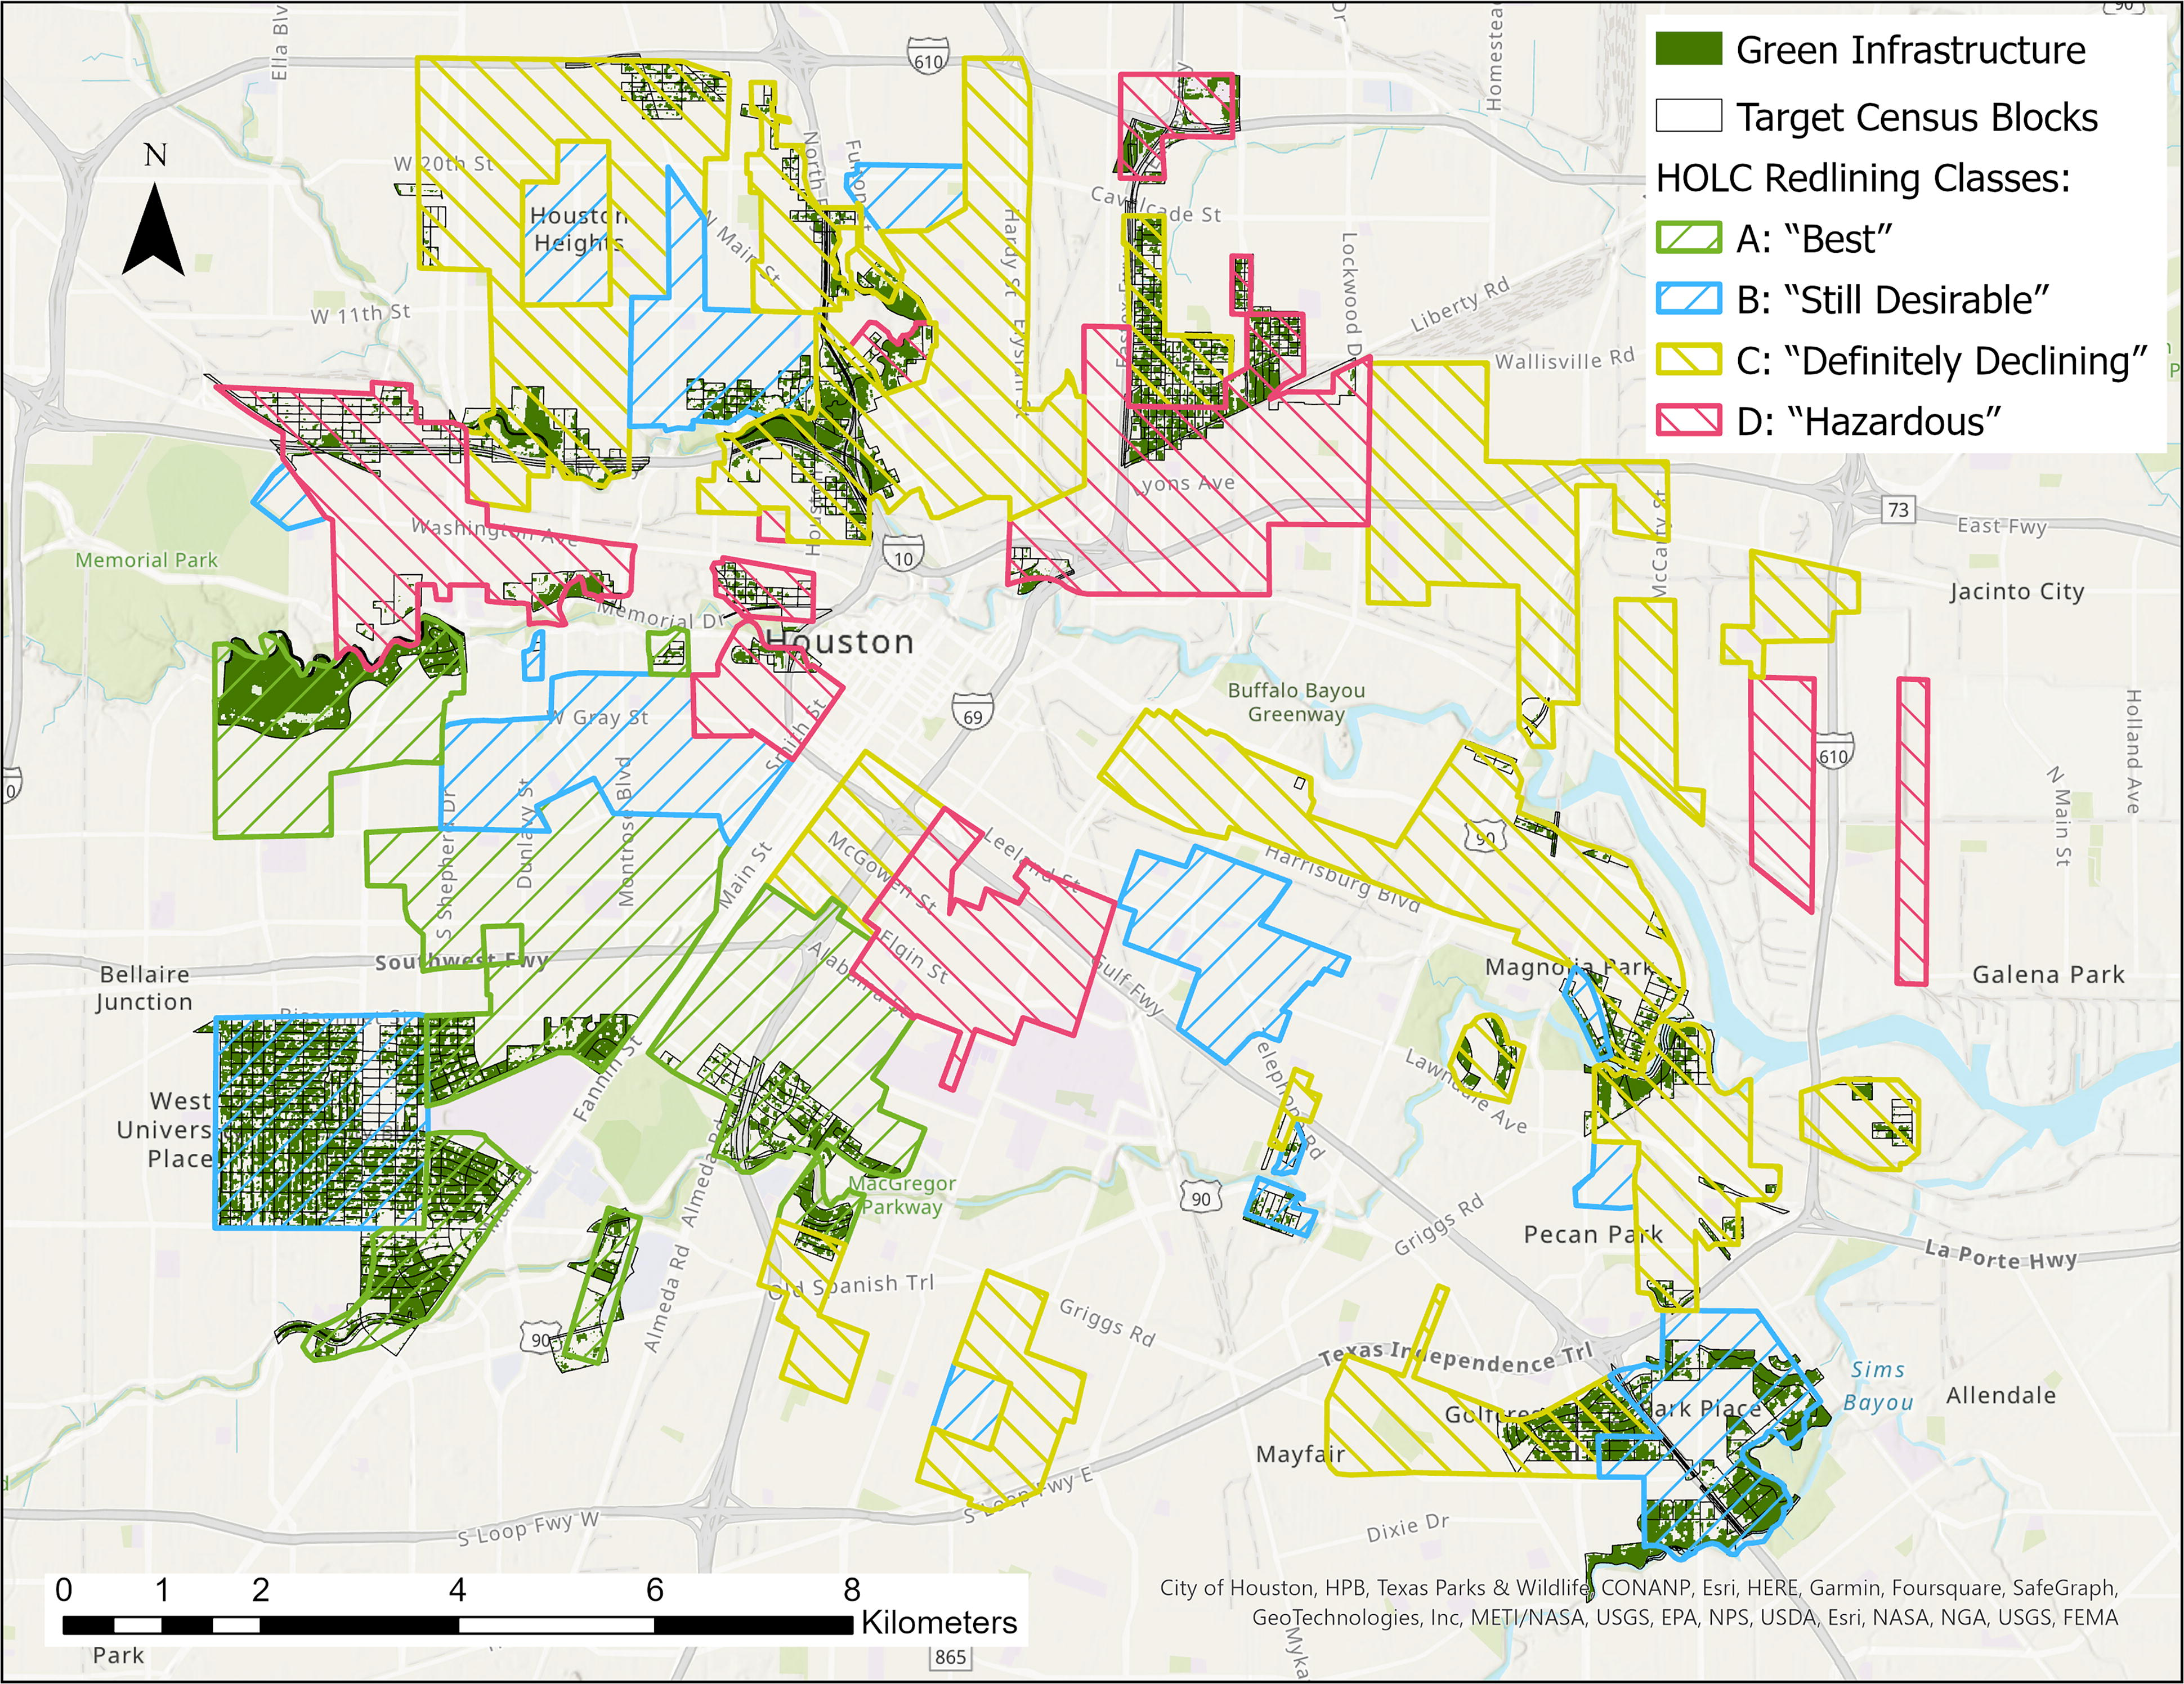
Green infrastructure mapped in the target blocks and the Home Owners’ Loan Corporation (HOLC) areas.
Median Green Infrastructure Percentage in Target Blocks of Each HOLC Class
HOLC, Home Owners’ Loan Corporation.
Figure 6 illustrates the percentages of GI by the HOLC categories. According to the Kruskal–Wallis test results, there was a significant variation in the median ratios of GI areas among the redlining groups (p-value < 2.2e-16). The post hoc pairwise analysis yielded compelling evidence that the median percentages of GI areas in the blocks mostly located in the HOLC categories of “D” (Hazardous) or “C” (Definitely Declining) were significantly lower than those in the zones categorized as “A” (Best) or “B” (Still Desirable) (p-value = 0). The result did not detect any significant difference in the median ratio between the classes of “A” and “B” (p-value = 1) nor between the “C” and “D” grades (p-value = 1).
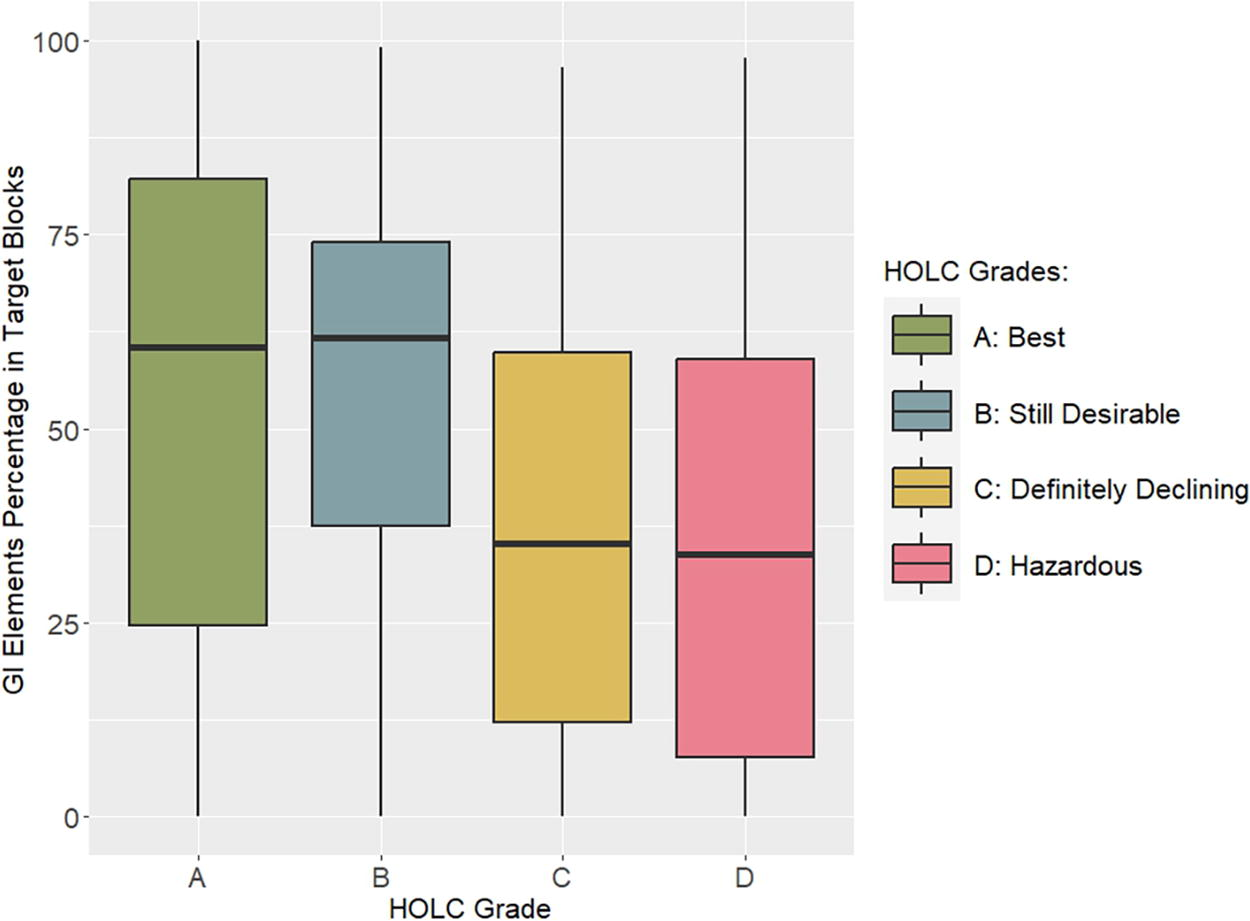
Box plot of green infrastructure (GI) element percentage in target blocks by the Home Owners’ Loan Corporation (HOLC) redlining grade.
With a confidence level of at least 95%, we successfully mapped GI cold spots, where the blocks exhibited low areas of GI close to each other, covering a region of 225 hectares in the northern part of the study area (Fig. 7). These cold spot areas were exclusively distributed between the redlining categories of “D” (Hazardous) and “C” (Definitely Declining) with shares of 51% and 49%, respectively. Figure 7 displays that no cold spot areas were observed within the “A” and “B” zones.
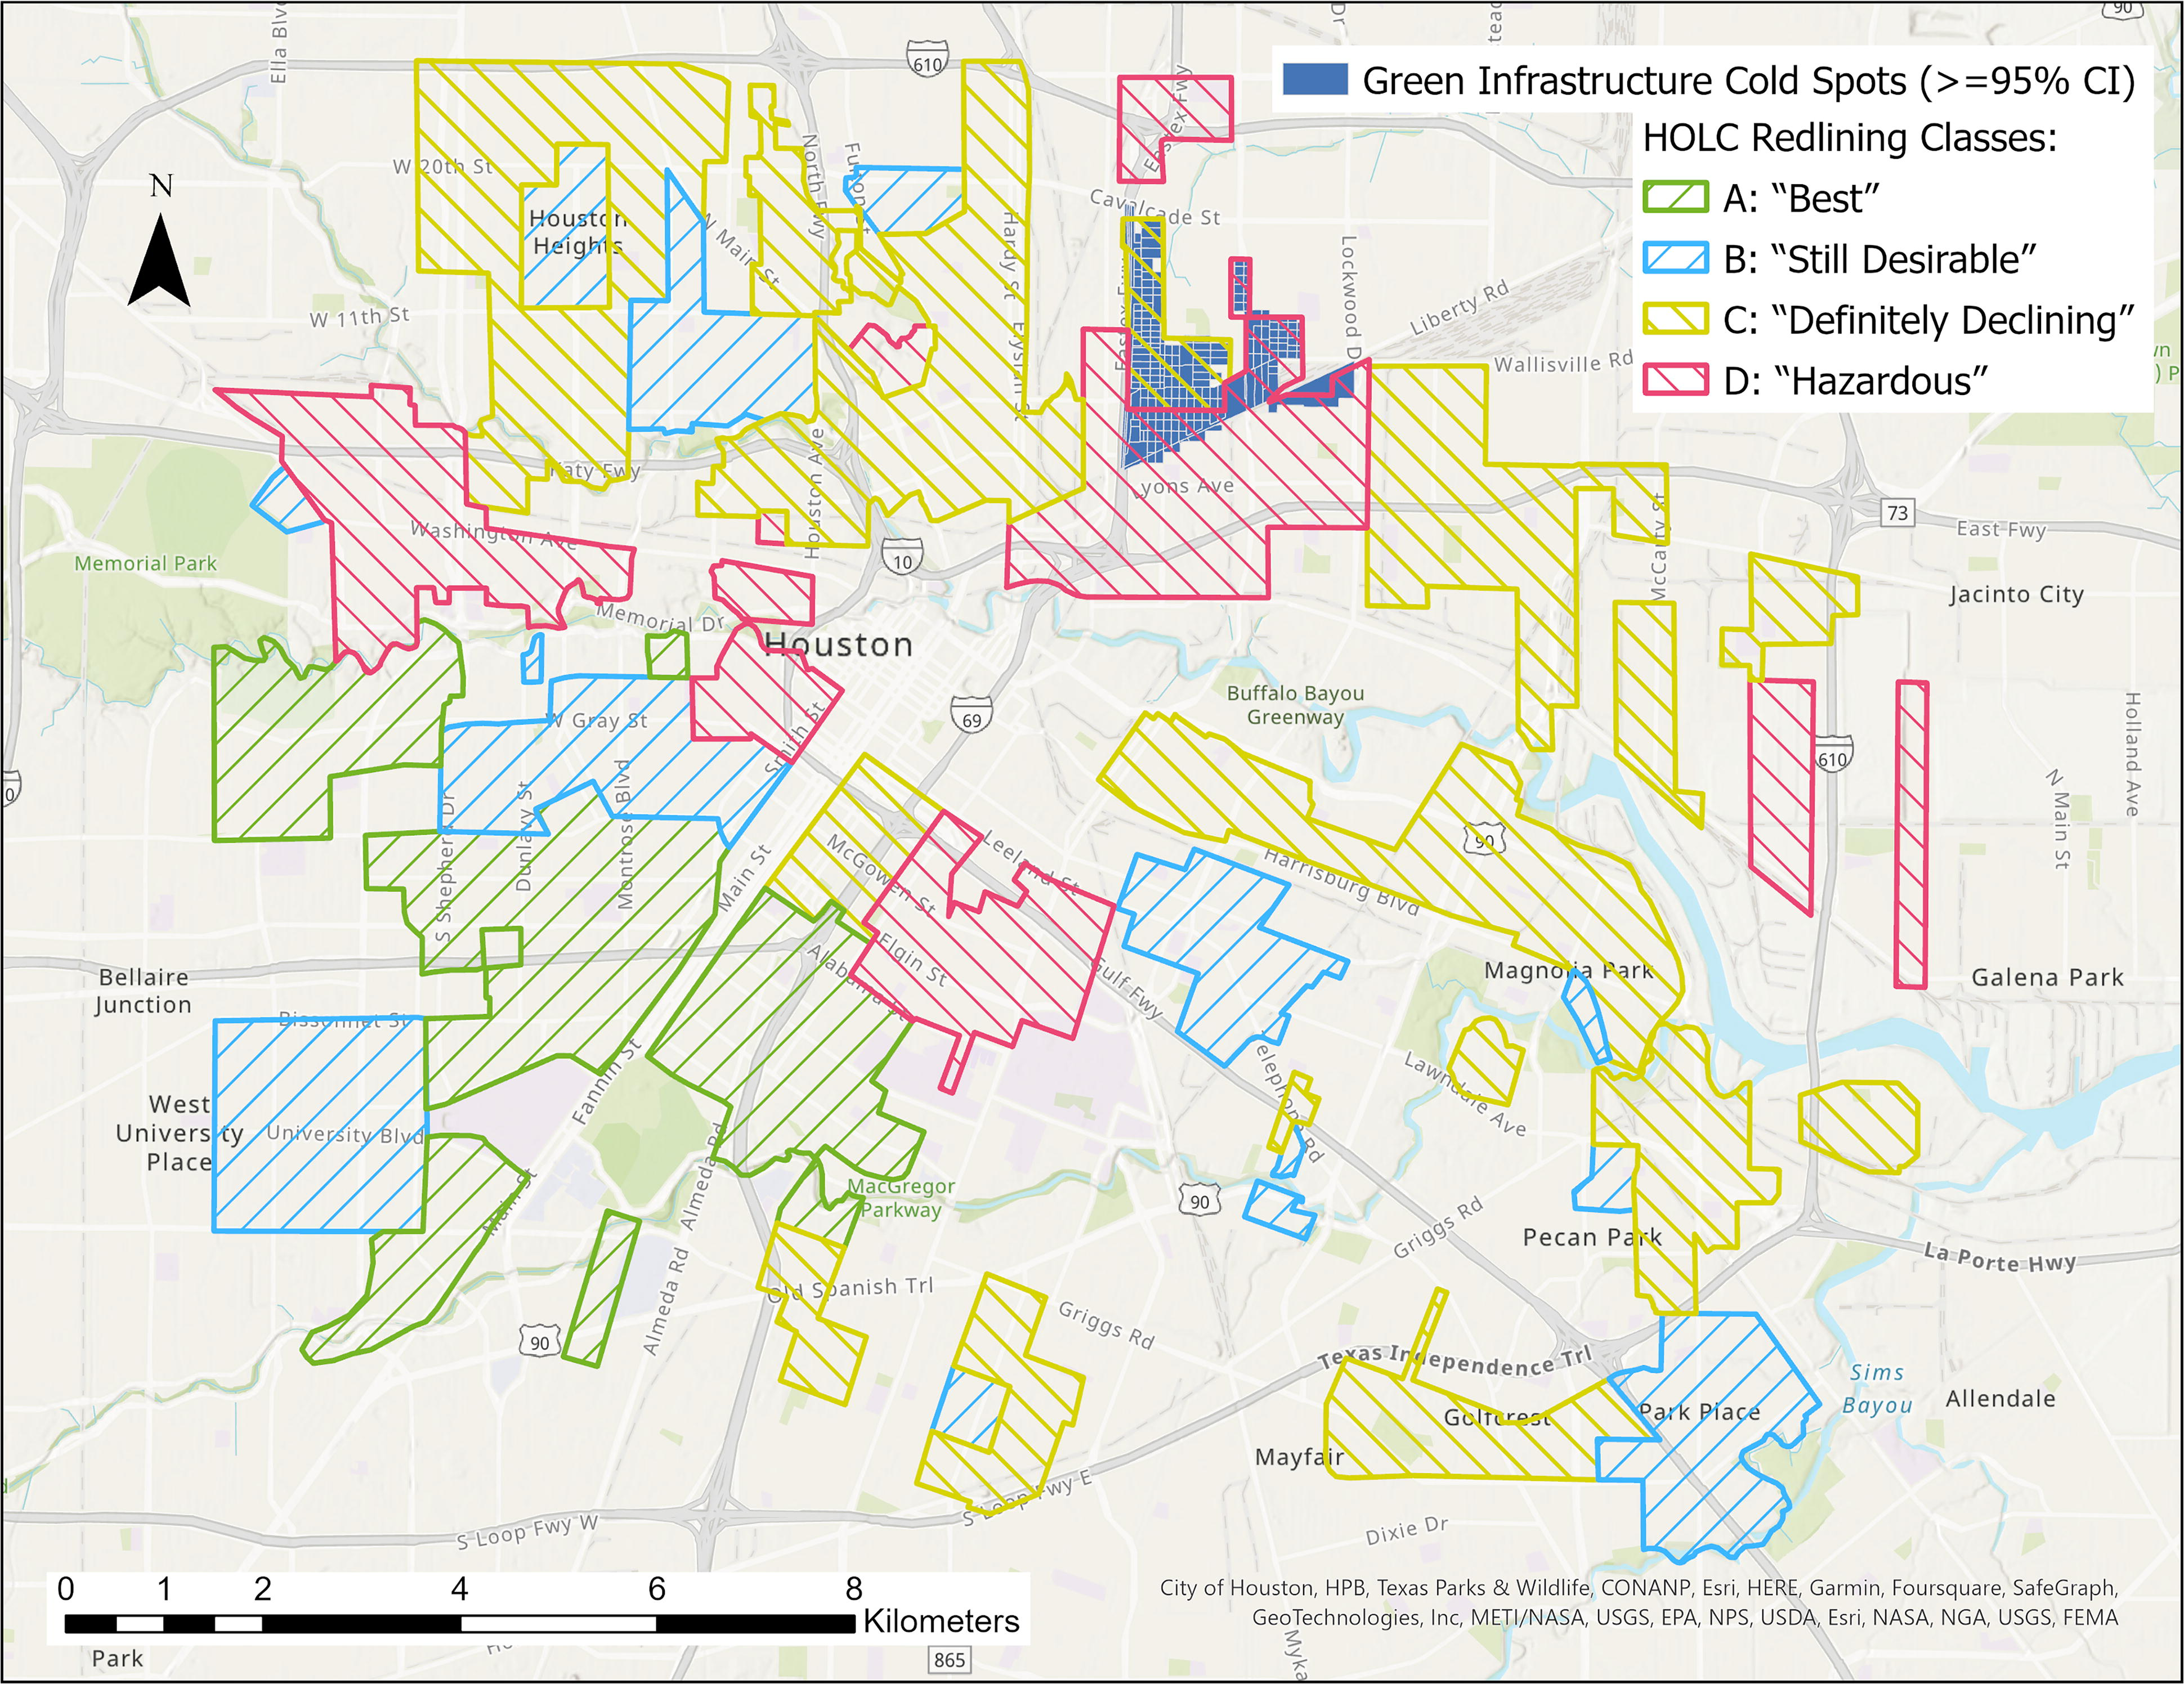
Green infrastructure cold spots with at least a 95% confidence interval (CI) and the Home Owners’ Loan Corporation (HOLC) redlining grades.
DISCUSSION
The study findings highlighted a higher median percentage of impervious surfaces and a lower median area of GI elements in the flood-prone census blocks mostly located in the redlined zones classified as “Hazardous” and “Definitely Declining” by HOLC in the 1930s. Furthermore, the methodology enabled us to identify a region characterized by a concentration of impervious surfaces, referred to as the imperviousness hot spot, as well as an area with a scarcity of GI or the GI cold spot. These areas were primarily located within the aforementioned zones that were historically redlined.
It is important to interpret and generalize the above results with caution. The geospatial correlations discovered in this study do not necessarily indicate causation. Although the historical background of redlining has played a significant role, it is essential to acknowledge that several other factors may have influenced the current state of imperviousness and green space distribution in Houston’s urban development. The findings should be understood within the specific context of this study area and should not be extrapolated to other cities without conducting appropriate analyses.
To identify the study area, our approach included census blocks that intersected with either the 100- or 500-year floodplains and had a minimum of 50% overlap with the polygons of the HOLC map. The rationale behind this decision was to exclude blocks with only marginal presence within the redlining polygons. We adopted a methodology based on the predominant class associated with each block’s largest overlap to assign the HOLC grades to these target blocks. It should be noted that our assumption of uniform grading throughout each block could be considered a limitation. However, we believe this approach was justified taking into account that the census blocks represented the smallest units available for our analysis.
Moreover, we used only the flood zones related to fluvial or riverine flooding published by FEMA to define the at-risk blocks while flood risk extends beyond these areas. By accessing more comprehensive data, it would be possible to incorporate other types of floods, such as pluvial or overland flooding, as well as future climate change scenarios. In addition, forthcoming analyses can include the mapped extent of recent flooding events. This would contribute to a more accurate definition of flood risk in the study area.
The spatial resolution can pose a limitation in geospatial analyses like ours. In our research, we encountered this issue and explored various available datasets. Among them, the WorldCover data provided by the ESA stood out, as it offered a higher resolution of 10 m and was more recently updated in 2021, making it a more accurate resource for our analysis. However, it is essential to note that the cell size of the dataset had an impact on the estimations and outcomes of our study. Access to land cover data in a higher resolution can potentially lead to more accurate results. As an alternative approach for future studies, remote sensing techniques can effectively extract impervious surfaces and GI elements from high-resolution imagery sources such as the 60-cm National Agriculture Imagery Program (NAIP) leaf-off images provided by the U.S. Department of Agriculture.
In addition, the temporal resolution of our methodology was another limitation of this study. Our approach focused solely on investigating the distribution of impervious surfaces and GI among the HOLC categories in a cross-section of time (the year 2021). Access to land cover datasets from different decades, all with the exact spatial resolution, can allow exploring the correlations of imperviousness and GI with the HOLC zones over time. Furthermore, it can assist in assessing whether recent green space development plans have mitigated the impacts of historical discrimination efforts, such as redlining.
The Modifiable Areal Unit Problem (MAUP) is a common issue in spatial statistics. It refers to the sensitivity of analysis results to the scale and aggregation of data units influencing the outcomes. The findings and conclusions derived from analyzing the distribution of a variable are reliant on the spatial scale chosen, which determines both the size and combination of the analysis units. 28 Therefore, replicating this study at different scales than the census blocks may yield different outcomes. It is essential to acknowledge and consider the MAUP when extrapolating findings to other scales of analysis. Although it is impossible to eliminate the MAUP effect, conducting similar experiments at various scales within the same study area can help identify correlations and quantify the bias.
CONCLUSIONS
This study examined the spatial relationships between past redlining initiatives and the current distribution of GI components and impervious surfaces as influential factors in flood risk mitigation and exacerbation, respectively. It linked the previous experiments related to the disparities in flood risk distribution 29 and impact analyses on historical discriminatory practices 30 to deepen our understanding of the complex relationships between flood risk and the legacies of such efforts. To the best of our knowledge, this is the first study that investigated the connection between the redlining practices and flood risk in U.S. urban areas. It contributes to the emerging field of research on the environmental impacts of such activities while trying to shed light on the roots of current environmental inequities in urban settings.
The findings supported the defined hypothesis in the study area. The research revealed significant spatial correlations between the distribution of GI and impervious surfaces in or adjacent to flood-prone areas and Houston’s redlining maps of the 1930s. It indicated higher ratios of imperviousness and a lower share of GI in the redlined “Hazardous” and “Definitely Declining” zones where housing loans were declined or extremely limited. In addition, the majority of areas of the impervious hot spots and GI cold spots could be mapped within the above classes of the redlining maps. These findings can highlight the enduring environmental impacts of segregation and divestment for decades contributing to increased flood risk in the redlined urban areas.
Research projects of this nature can assist planners and decision-makers in recognizing the urban areas with declined or limited resources in the past to track the present effects and address the issues in future plans. To alleviate the challenges such disadvantaged areas face, it is suggested to prioritize resources, promote GI development in flood-prone zones, enhance community engagement and participation, and foster sustainable and resilient urban development for historically redlined areas. These measures aim to compensate for past disparities, mitigate flood risks, involve local communities in decision-making processes, and create more equitable and resilient urban environments.
In addition, the study results related to the spatial patterns of impervious surfaces and GI can help local authorities, urban planners, and floodplain managers have a better understanding of the urban areas that are the hot spots of imperviousness and the communities suffering from the lack of green spaces. Such knowledge will assist them in planning for future development in the urban area in a more sustainable and resilient way. For instance, the effectiveness of ongoing or prospective GI development plans in Houston, such as the “Bayou Greenways” project aimed at creating 3,000 acres (1,214 hectares) of greenspaces and 150 miles (241 km) of trails along the major streams, 31 can be evaluated by the findings of this study. This comparison will allow for an assessment of how these GI initiatives contribute to mitigating flood risk and addressing environmental inequities in the region.
The social vulnerability caused by the socioeconomic characteristics of communities is a determining parameter of people’s capacity to anticipate, respond to, and recover from natural disasters such as floods. 32 Since the redlining activities marginalized specific urban neighborhoods with minority racial, ethnic, or immigrant compositions, it is plausible that they have influenced those people’s social vulnerability to flooding even up to the present day. A need for future research is to integrate social vulnerability indicators into the analysis to explore the correlations more comprehensively.
Moreover, future work can adapt and develop the methodology for different study areas varying in size or facing other types of disasters. Enhanced access to data with higher spatial and temporal resolutions can help overcome the limitations mentioned earlier. Incorporating multiple datasets of different periods in future studies would provide a clearer picture of long-term trends and the effectiveness of interventions addressing historical injustices.
Footnotes
AUTHORS’ CONTRIBUTIONS
B.B.: Conceptualization (lead); Methodology (lead); Validation (equal); Formal analysis (lead); Investigation (lead); Resources (equal); Data Curation (lead); Writing-Original Draft (lead); Visualization (lead); Project administration (lead). M.P.S.: Conceptualization (supporting); Methodology (supporting); Validation (equal); Resources (equal); Writing-Review & Editing (lead); Visualization (supporting); Supervision (lead); Project administration (supporting). P.B.: Conceptualization (supporting); Writing-Review and Editing (supporting). H.G.: Conceptualization (supporting); Writing-Review and Editing (supporting).
AUTHOR DISCLOSURE STATEMENT
No competing financial interests exist.
FUNDING INFORMATION
This work was based upon work that is partially supported by the National Institute of Food and Agriculture, U.S. Department of Agriculture, Hatch project WVA00773 under ascension number 11400036.