
Abstract
Historically, academic and government environmental justice (EJ) research and communication efforts have centered on quantifying, mapping, and visualizing the environmental harms faced by EJ communities (communities facing disproportionate levels of environmental harm). Unangax Education scholar Eve Tuck critiques such frameworks as “damage-centered” because they cast entire communities—predominantly low-income, BIPOC communities—as lacking or lesser. In this case study, we identify three core pitfalls of damage-centered research in government agency EJ projects—reification, obfuscation, and discretization—through our analysis of two important U.S. federal EJ data tools and related policies: the Environmental Protection Agency (EPA)'s EJSCREEN, and the recently unveiled Climate and Economic Justice Screening Tool (CEJST). We center our study on the depiction of the Chelsea Creek Region in Massachusetts. In response, we describe preliminary research on an alternative approach to communicating EJ issues based on a relational rather than damage-centered EJ framework that advances relationships as the fundamental unit of both analysis and redress—in this case the Greater Boston region's relationship to and responsibility for ongoing environmental harms in the Chelsea Creek region.
INTRODUCTION
Historically, dominant environmental justice (EJ) research and communication efforts have centered on quantifying, mapping, and visualizing the environmental harms faced by EJ communities (communities facing elevated levels of environmental harm). Unangax Education and Indigenous Studies scholar Eve Tuck critiques such frameworks as “damage-centered” because they cast entire communities—predominantly low-income, BIPOC communities—as lacking or lesser. 1
Tuck identifies the long-term repercussions of damage-centered research, namely how this theory of change “reinforces and reinscribes a one-dimensional notion of these [communities] as depleted, ruined, and hopeless.” 2 Damage-centered research also delimits what questions can be asked and by whom, as well as what counts as data, evidence, or possibility. While documenting disparities can support communities' strategies for restitution, marking EJ communities as damaged often perpetuates historical harms, and does not, on its own, disrupt the systems that produce inequity.
A key reason that damage-driven frameworks are inadequate—particularly those frameworks that quantify and map harm in static time and discrete borders—is that they elide the actual relationships and processes that produce environmental harm. By definition, inequity exists when some have less than others; standard EJ approaches focus attention on one side of this relationship (the disadvantaged side). Less attention has been paid to the mechanisms, policies, and processes that maintain inequitable outcomes, through which affluent and predominantly white suburbs are shielded from environmental harm (e.g., through residential and non-commercial zoning). 3
Meanwhile, affluent communities also disproportionately benefit from harm-generating industries and infrastructures through a variety of channels and habits, including access to home ownership, white-collar employment opportunities, commuter infrastructures, regular air travel, and stock market investments. 4
When environmental harm is instead analyzed through a relational framework, it becomes evident how affluent, low environmental risk (LER) communities are indebted to and interdependent with EJ communities. Another consequence of damage-driven frameworks is that they often direct resources toward localized solutions within EJ communities rather than structural changes or root causes. For instance, identifying high asthma rates in an EJ community might lead to personalized health interventions that ensure access to care rather than improving air quality overall by reducing pollution-generating activities. 5
Meanwhile, most pollution (including, notably, carbon pollution) cannot be confined to a particular geographic area. By researching and communicating information on the relationships that produce unequal exposures, we are better positioned to generate meaningful responses to inequity.
The framework we advance understands environmental injustice as the “product of relationships between distinct places, including industrial zones, affluent suburbs, working-class suburbs, and downtown areas, all of which are racialized” 6 rather than an inherent characteristic of specific places. Building on the insights of Eve Tuck as well as important related discussions on relationality, care, and reciprocity, we propose a relational framework for EJ research and communication that promotes relationships as the fundamental unit of both analysis and redress. 7
By relationality, we refer to a responsive, ongoing process and practice of responsibility that stresses the “(re-)production of relational ties and their mutually effecting and reinforcing impacts.” 8 Here we ask: What would feeling more collectively responsible for these harms do? In promoting a relational framework, we hope to help people in disparate communities understand their relationship to each other in more accurate and accountable ways—particularly for those who do not have to regularly wrestle with the everyday realities of environmental pollution—and ultimately inaugurate or expand a desire for reciprocity, defined as mutually beneficial interdependency. Responses rooted in desire rather than damage, Tuck identifies, are able to encompass the “complexity, contradiction, and the self-determination of lived lives” and counteract the flattening emphasis on damage. 9
To illustrate the advantages of a relational EJ framework as compared with the dominant, damage-centered strategies found in governmental and social science research, we focus our study on the Chelsea Creek region—comprising Chelsea, East Boston, and Revere, which are located on unceded, ancestral, and current Massachusett and Pawtucket homelands 10 —and the Chelsea Creek region's relationship to the rest of New England.
Damage-centered EJ frameworks characterize the communities surrounding Chelsea Creek as an environmentally damaged region that, although highly residential, is zoned for industrial use and thus essentially permitted for environmental pollution.
In this article, we first provide background on the Chelsea Creek region—highlighting the region's community-based EJ projects and the essential services the region provides to the rest of New England. To illustrate the pitfalls of damage-centered research, we analyze how the Chelsea Creek region is portrayed through two important U.S. federal EJ data tools and related policies: the Environmental Protection Agency (EPA)'s EJSCREEN, and the recently unveiled Climate and Economic Justice Screening Tool (CEJST). Both of these online mapping tools aim at identifying environmentally “disadvantaged communities through publicly-available, nationally-consistent datasets” with important policy and financial implications. 11
We close with preliminary research on an alternative EJ communication tool that we developed to better illuminate the greater Boston region's relationship to and responsibility for ongoing environmental harms in the Chelsea Creek region. This tool, which we call a socio-economic relationship quiz, 12 was first conceived as part of a class project by three environmental studies students, the second, third, and fourth authors, and co-developed with Chelsea-based community organization, GreenRoots, as well as collaborators at the Colorado School of Public Health and Green Latinos Colorado. 13
The tool is an intervention into how EJ issues are predominantly communicated (of which the CEJST and EJSCREEN tools are exemplary). These two sets of tools—the socio-economic relationship quiz and the government agency tools—are both ways of communicating EJ issues to publics. Here, we are seeking to determine how these different approaches to communicating EJ issues affect understandings of relationality and responsibility. 14 We conclude this article by outlining our next steps for the tool and potential implications for future EJ research, policy, and communication efforts.
GREENROOTS AND THE CHELSEA CREEK REGION
GreenRoots is a community-based organization with a mission to achieve EJ and greater quality of life through collective action, unity, education, and youth leadership across neighborhoods and communities of Chelsea and East Boston (Fig. 1). 15 Over the past 20 years, GreenRoots has led and won progressive campaigns that restored urban salt marsh along the Chelsea Creek; created the area's first Community Land Trust, Communidades Enraizadas; spurred the region's first community-led microgrid project by fundraising over $1M for the project in partnership with Resilient Urban Neighborhoods and Green Justice Coalition; stimulated food justice programming, including a local teaching kitchen; and generated a community-led heat island mitigation strategy in partnership with the City of Chelsea, Boston University School of Public Health, and the Boys and Girls Club.

GreenRoots advocating for equitable public transit in partnership with Public Transit Public Good, July 2022 (image credit: GreenRoots).
GreenRoots recently co-authored a Massachusetts climate roadmap for the state to “meet its electricity needs completely and equitably with renewable energy by 2035.” 16 The organization also researches community concerns and it produced a COVID-19 report that has been leveraged to secure more resources for the region. 17
GreenRoots is located on the shores of Chelsea Creek alongside oil storage facilities and beneath Logan International Airport's flight path. The creek is zoned by the state for industrial-port use and provides many essential services to all of New England. 18 For example, at least 11.4 acres of the Chelsea Creek waterfront are dedicated to storing hundreds of tons of road salt for de-icing regional roads, reducing weather-related traffic accidents. 19
In addition, the oil stored in tanks along Chelsea Creek contains both jet fuel for all of Logan Airport's needs and 70%–80% of the region's heating fuels. 20 Logan International Airport served over 38 million passengers in 2017, with a broader economic impact of $16.3 billion. 21 Chelsea is also home to the New England Produce Center, which serves 8 million Northeastern-seaboard residents, including some provinces in Canada, and is the “the third-largest food distribution center in the country.” 22
GOVERNMENT AGENCY EJ TOOLS: A CASE STUDY
Due to the earlier stated state zoning choices, the Chelsea Creek region is highlighted in both EPA's EJSCREEN tool and the White House's CEJST tool as “disadvantaged.” These tools' damage-centered approach compresses the lived complexities of EJ communities such as Chelsea Creek region into a singular image of deficit, even as they are designed to address environmental injustice.
To showcase the potential of a relational EJ framework, we first identify three core pitfalls of damage-centered strategies when employed for EJ: (1) reification; (2) obfuscation; and (3) discretization. In analyzing these tools as well as a recent EPA permitting decision, we illustrate how a damage-centered approach harms EJ communities and impedes justice.
EJSCREEN and CEJST
The EPA's EJSCREEN is an “environmental justice mapping and screening tool that provides EPA with a nationally consistent dataset and approach for combining environmental and demographic indicators.” 23 The tool displays EJ indices for census block groups that combine demographic indicators (e.g., percent of people of color), population count, and environmental indicators (e.g., levels of toxic wastewater).
The tool uses these indices to rank each census block group against all others in the state and nation. EJSCREEN users can map environmental and demographic indicators to explore relative distributions of environmental risks. Communities with high EJ indices are portrayed in orange and red, whereas LER communities that benefit from polluting infrastructures are grayed out entirely, or left blank (Fig. 2, left). 24
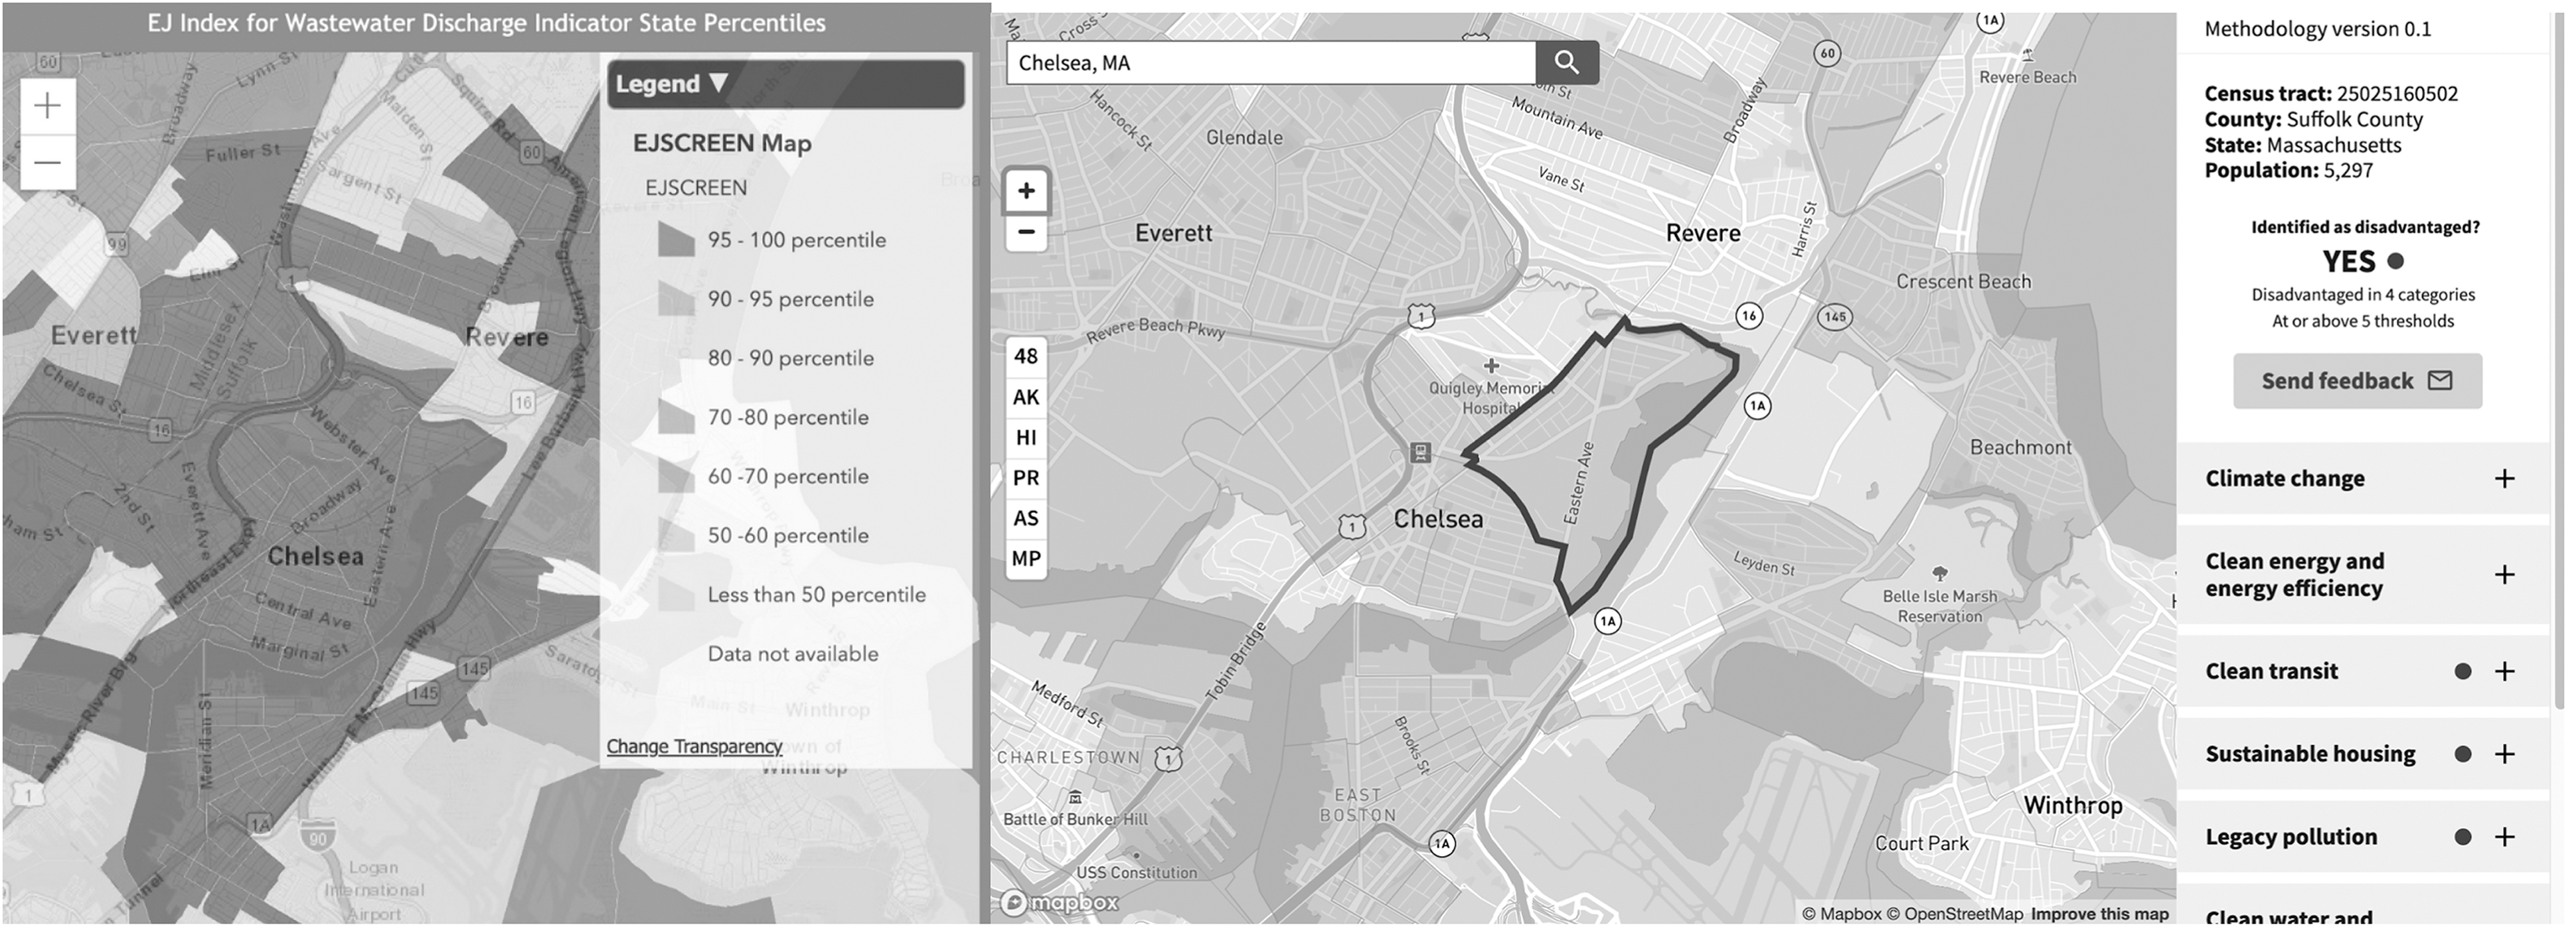
(Left) EJSCREEN map of Chelsea Creek region showing EJ Index for waste-water discharges (95–100th percentile in the state); (Right) CEJST tool highlighting a census tract in Chelsea Creek region as disadvantaged. CEJST, Climate and Economic Justice Screening Tool; EJ, environmental justice.
The recently unveiled CEJST tool, still undergoing public comment, was developed in the Biden-Harris administration to aid their Justice40 initiative, which aims at directing 40% of federal investments toward historically disadvantaged communities. 25 The tool draws on a comparable methodology applied in the EJSCREEN platform; it similarly plots environmental damage through both environmental and demographic indicators, though notably it excludes demographic data on race (see Fig. 2, right). 26 Areas with high levels of environmental and socioeconomic harm are shaded and encircled with a dark blue line.
These government EJ screening tools are only two of the most prominent federal tools. State-specific EJ data tools also exist, such as CalEnviroScreen. We recognize that each of these tools are products of different relationships unto themselves within government agencies and initiatives, and between governments and the public. 27
Chelsea Creek region
Chelsea, one of Massachusetts' most densely populated cities, meets state and federal definitions for EJ community in that 24% of residents live below the federal poverty line, 50% are non-white and 67% are Latinx, and 65% speak a language other than English at home. East Boston is 62% non-white and 58% Latinx. The average per capita income for the region is $28,822 (compared with $39,913 statewide). 28 According to the EPA's EJSCREEN tool, Chelsea is in the 90th percentile relative to the state for the National Air Toxic Assessment's Respiratory Hazard Index, traffic proximity, and hazardous waste proximity. Due to effluent discharged from the seven oil storage facilities that line Chelsea Creek (Fig. 3), the Chelsea Creek Region is in the 95th percentile for the state for wastewater discharges and is rendered as a bright red blotch on the EJSCREEN Map (Fig. 2, left).
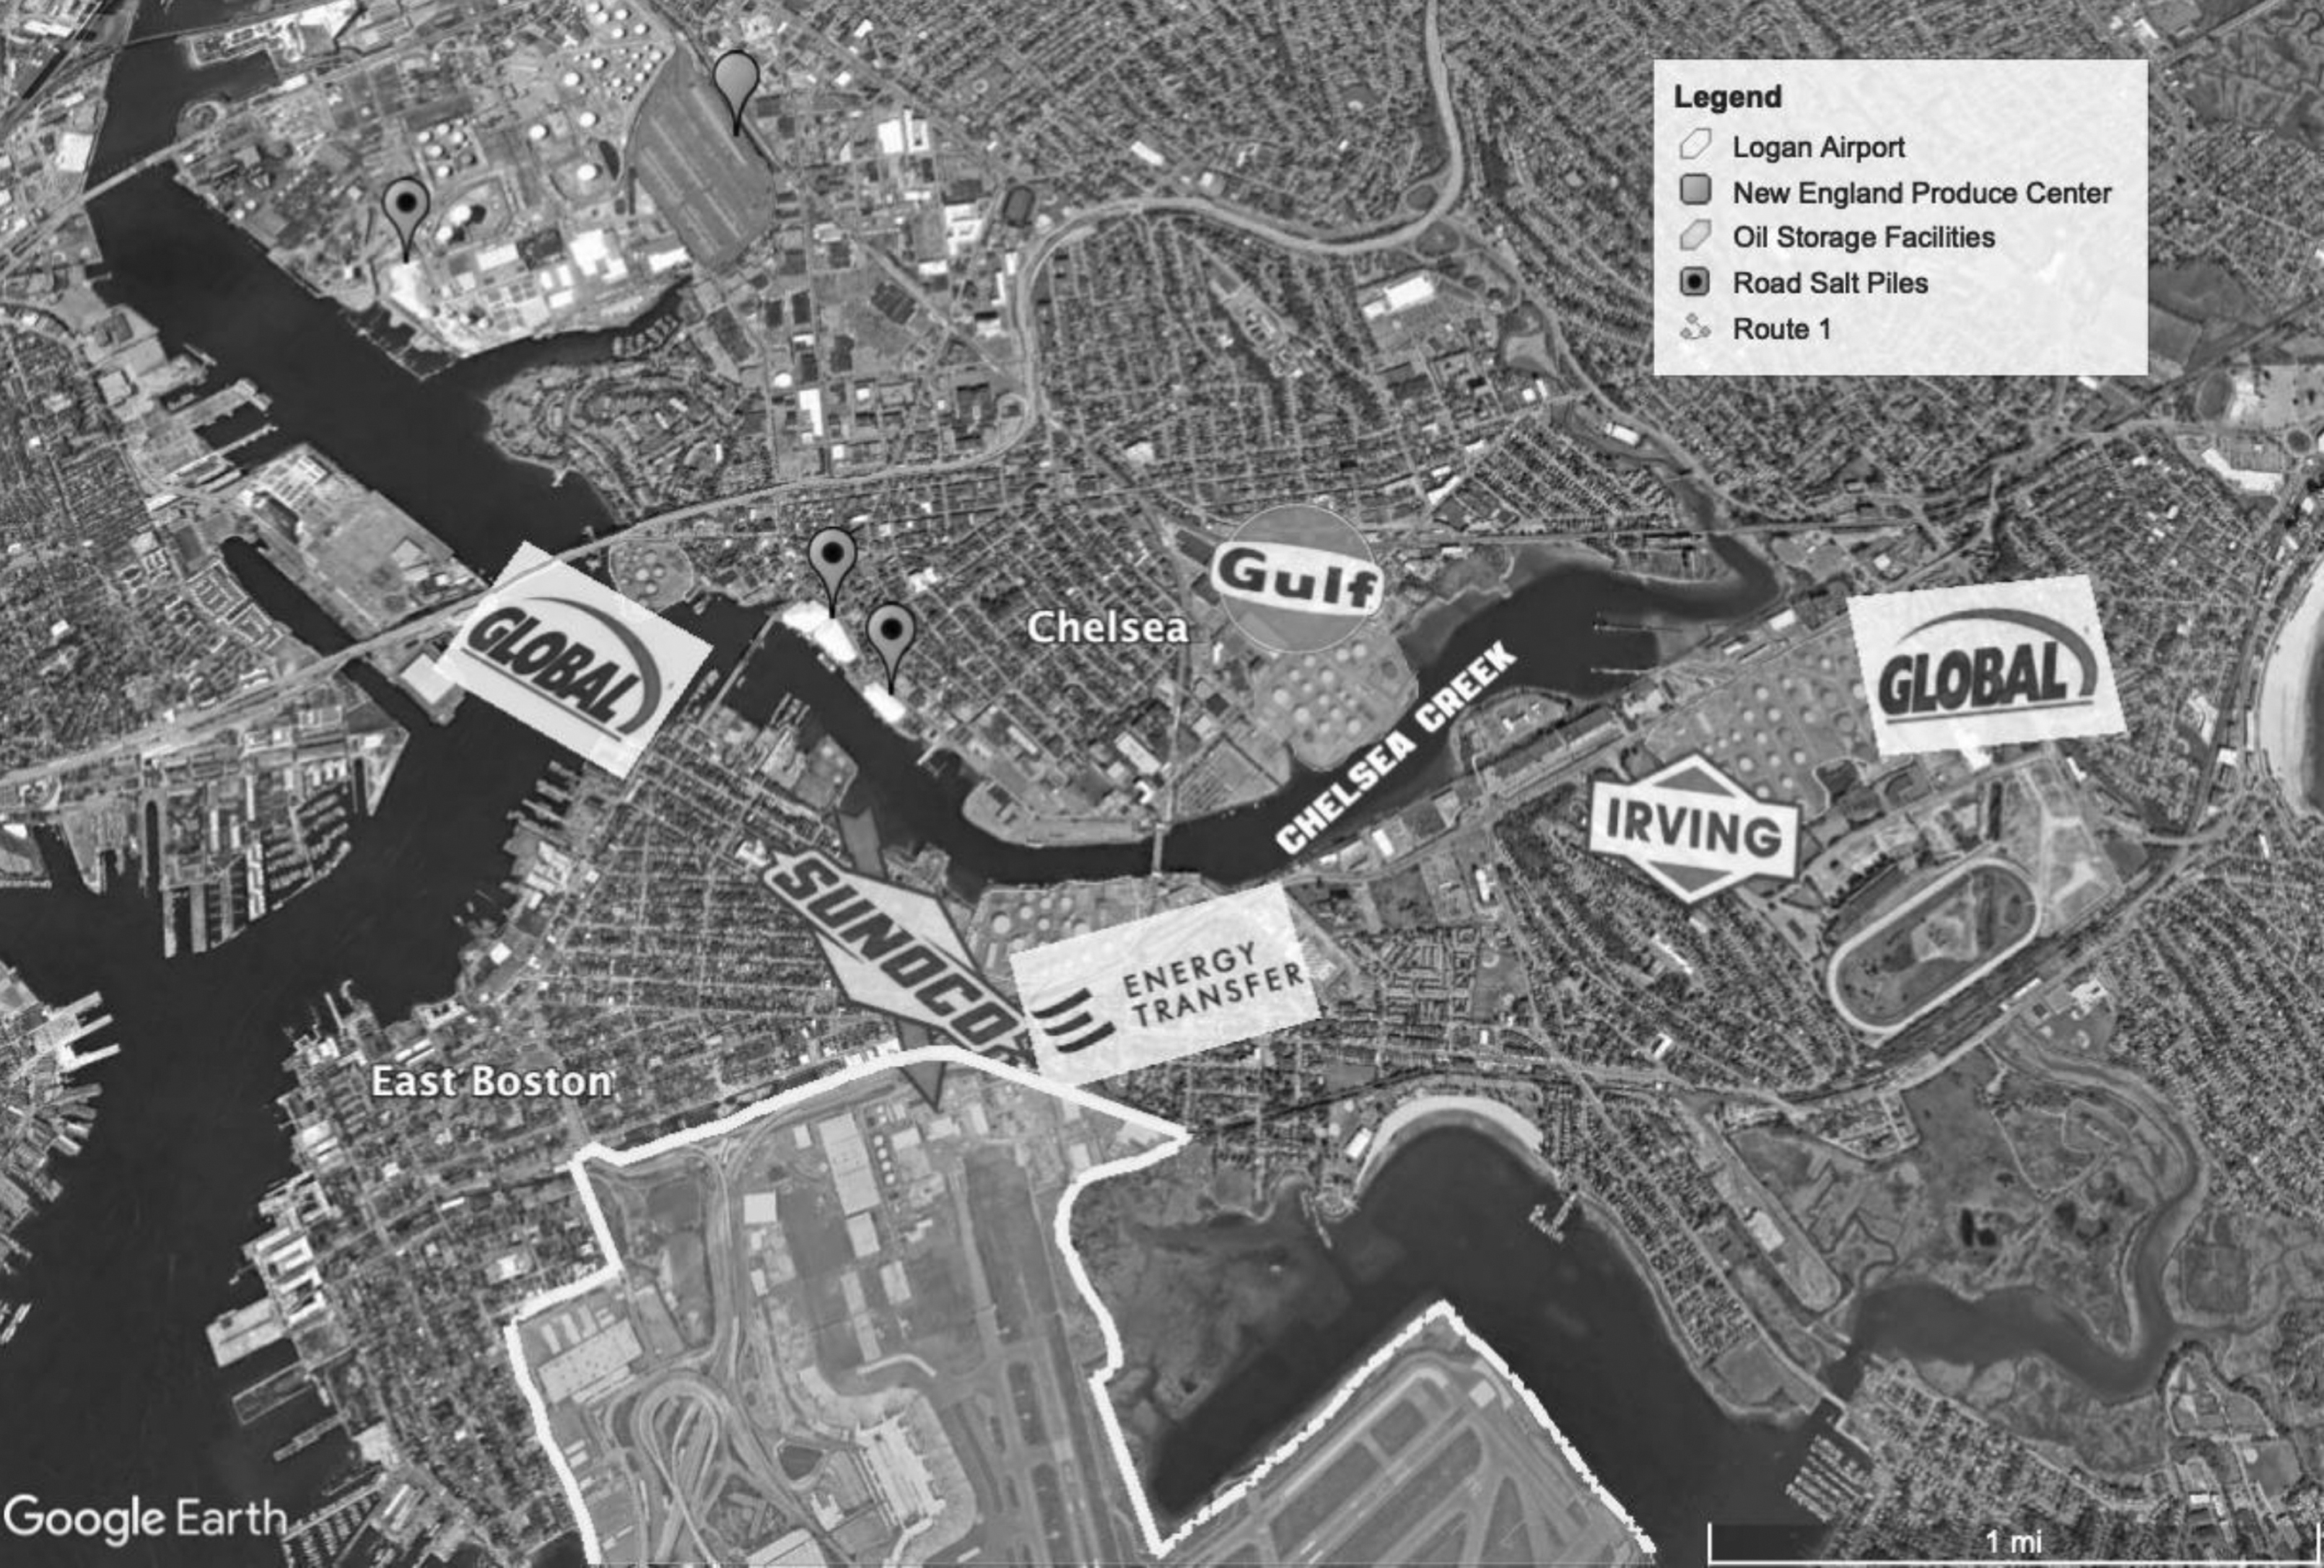
Chelsea Creek region's oil storage facilities, road salt storage, the New England Produce Center (the nation's largest privately owned produce market), Logan Airport, and heavily trafficked Route 1.
Predictably, these environmental conditions generate a number of health hazards to the community, risks that were further exacerbated by one of the worst COVID-19 outbreaks nationally. 29 Next, we discuss the pitfalls with damage-centered tools such as EJSCREEN and CEJST in three interrelated categories: reification, obfuscation, and discretization.
Reification
Although tools such as EJSCREEN and CEJST are aimed at addressing environmental injustice, these tools reify or concretize disparities such as those created through historical redlining practices. 30 Reification is about naturalizing socially produced relations. Redlining has been integral to zoning EJ communities for industrial use. In the 1930s, the Federal Housing Authority classified Chelsea as 55% yellow, with a grade of C (“Definitely Declining”) and 45% red, with a grade of D (“Hazardous”). 31
This enabled a cycle of both political and economic disinvestment and industrial land use in the community, thus limiting residents' economic prospects while increasing industrial emissions. 32 These historical processes are taken for granted in EJ tools; these data-driven tools only highlight the resulting damage or current-day conditions of communities. 33
EJSCREEN even replicates redlining's color scheme. Marking some communities in red, without explaining the processes/relations by which they came to be, reifies existing stigmatization of these communities and may even perpetuate cycles of declining property value and disinvestment. It is not so hard to imagine a world where real estate apps such as Zillow imports EJSCREEN data, discouraging businesses and residents from investing in communities that are zoned for disadvantage. While the newer CEJST tool moves away from the red color scheme, EJ communities are still stamped with a “yes” for “disadvantaged” via a blue border encompassing the tract (Fig. 2, right).
This denies the autonomy of communities designated as disadvantaged, as these distinctions are developed by outsider “experts” rather than on the community's own terms. 34 Although these tools are designed to aid in the distribution of much needed resources, reifying damage and federalizing community investment in this way pits “disadvantaged” communities against each other for limited state funding, rather than building solidarity between them.
In sum, damage-centered strategies reify disparities because they do not account for how these disparities came to be, nor do they give communities a chance to accept, reject, nuance, or otherwise meaningfully comment on designations of disadvantage.
Obfuscation
By obfuscation, we refer to how damage-driven research conceals or makes unclear the important historical or socio-economic relationships that produce predictable levels of environmental harm—what critical scholars call colonial unknowing. 35 Reification refers to how important relationships are treated as given, whereas obfuscation is about how damage-centered research conceals or submerges key relationships that produce predictable levels of environmental harm.
Tuck notes how important contextual conditions, such as racism and colonization, are downplayed in damage-driven research, stating that although “damage-centered research involves social and historical contexts at the outset, the significance of these contexts is regularly submerged [emphasis added]”… [and] without this context … “all we're left with is the damage.” 36
Obfuscation or submerging is perhaps most explicit in the CEJST tool: As many community organizers and media outlets have critiqued, the tool's methodology no longer includes data on race, as EJSCREEN does, even though race—or, rather, racist policies—is a primary factor in how environmental harms are distributed. 37
The EJSCREEN and CEJST tools mark highly polluted EJ communities in color, whereas LER communities appear as a blank canvas. In Chelsea, the tools thus account for the polluting effects of heating oil and jet fuel storage, but obscure where or by whom these fuels are burned. If consumption were mapped, these maps would look radically different, perhaps more like the Massachusetts Clean Energy Map (Fig. 4) where affluent communities such as Dover, MA are marked in red due to high home heating costs.
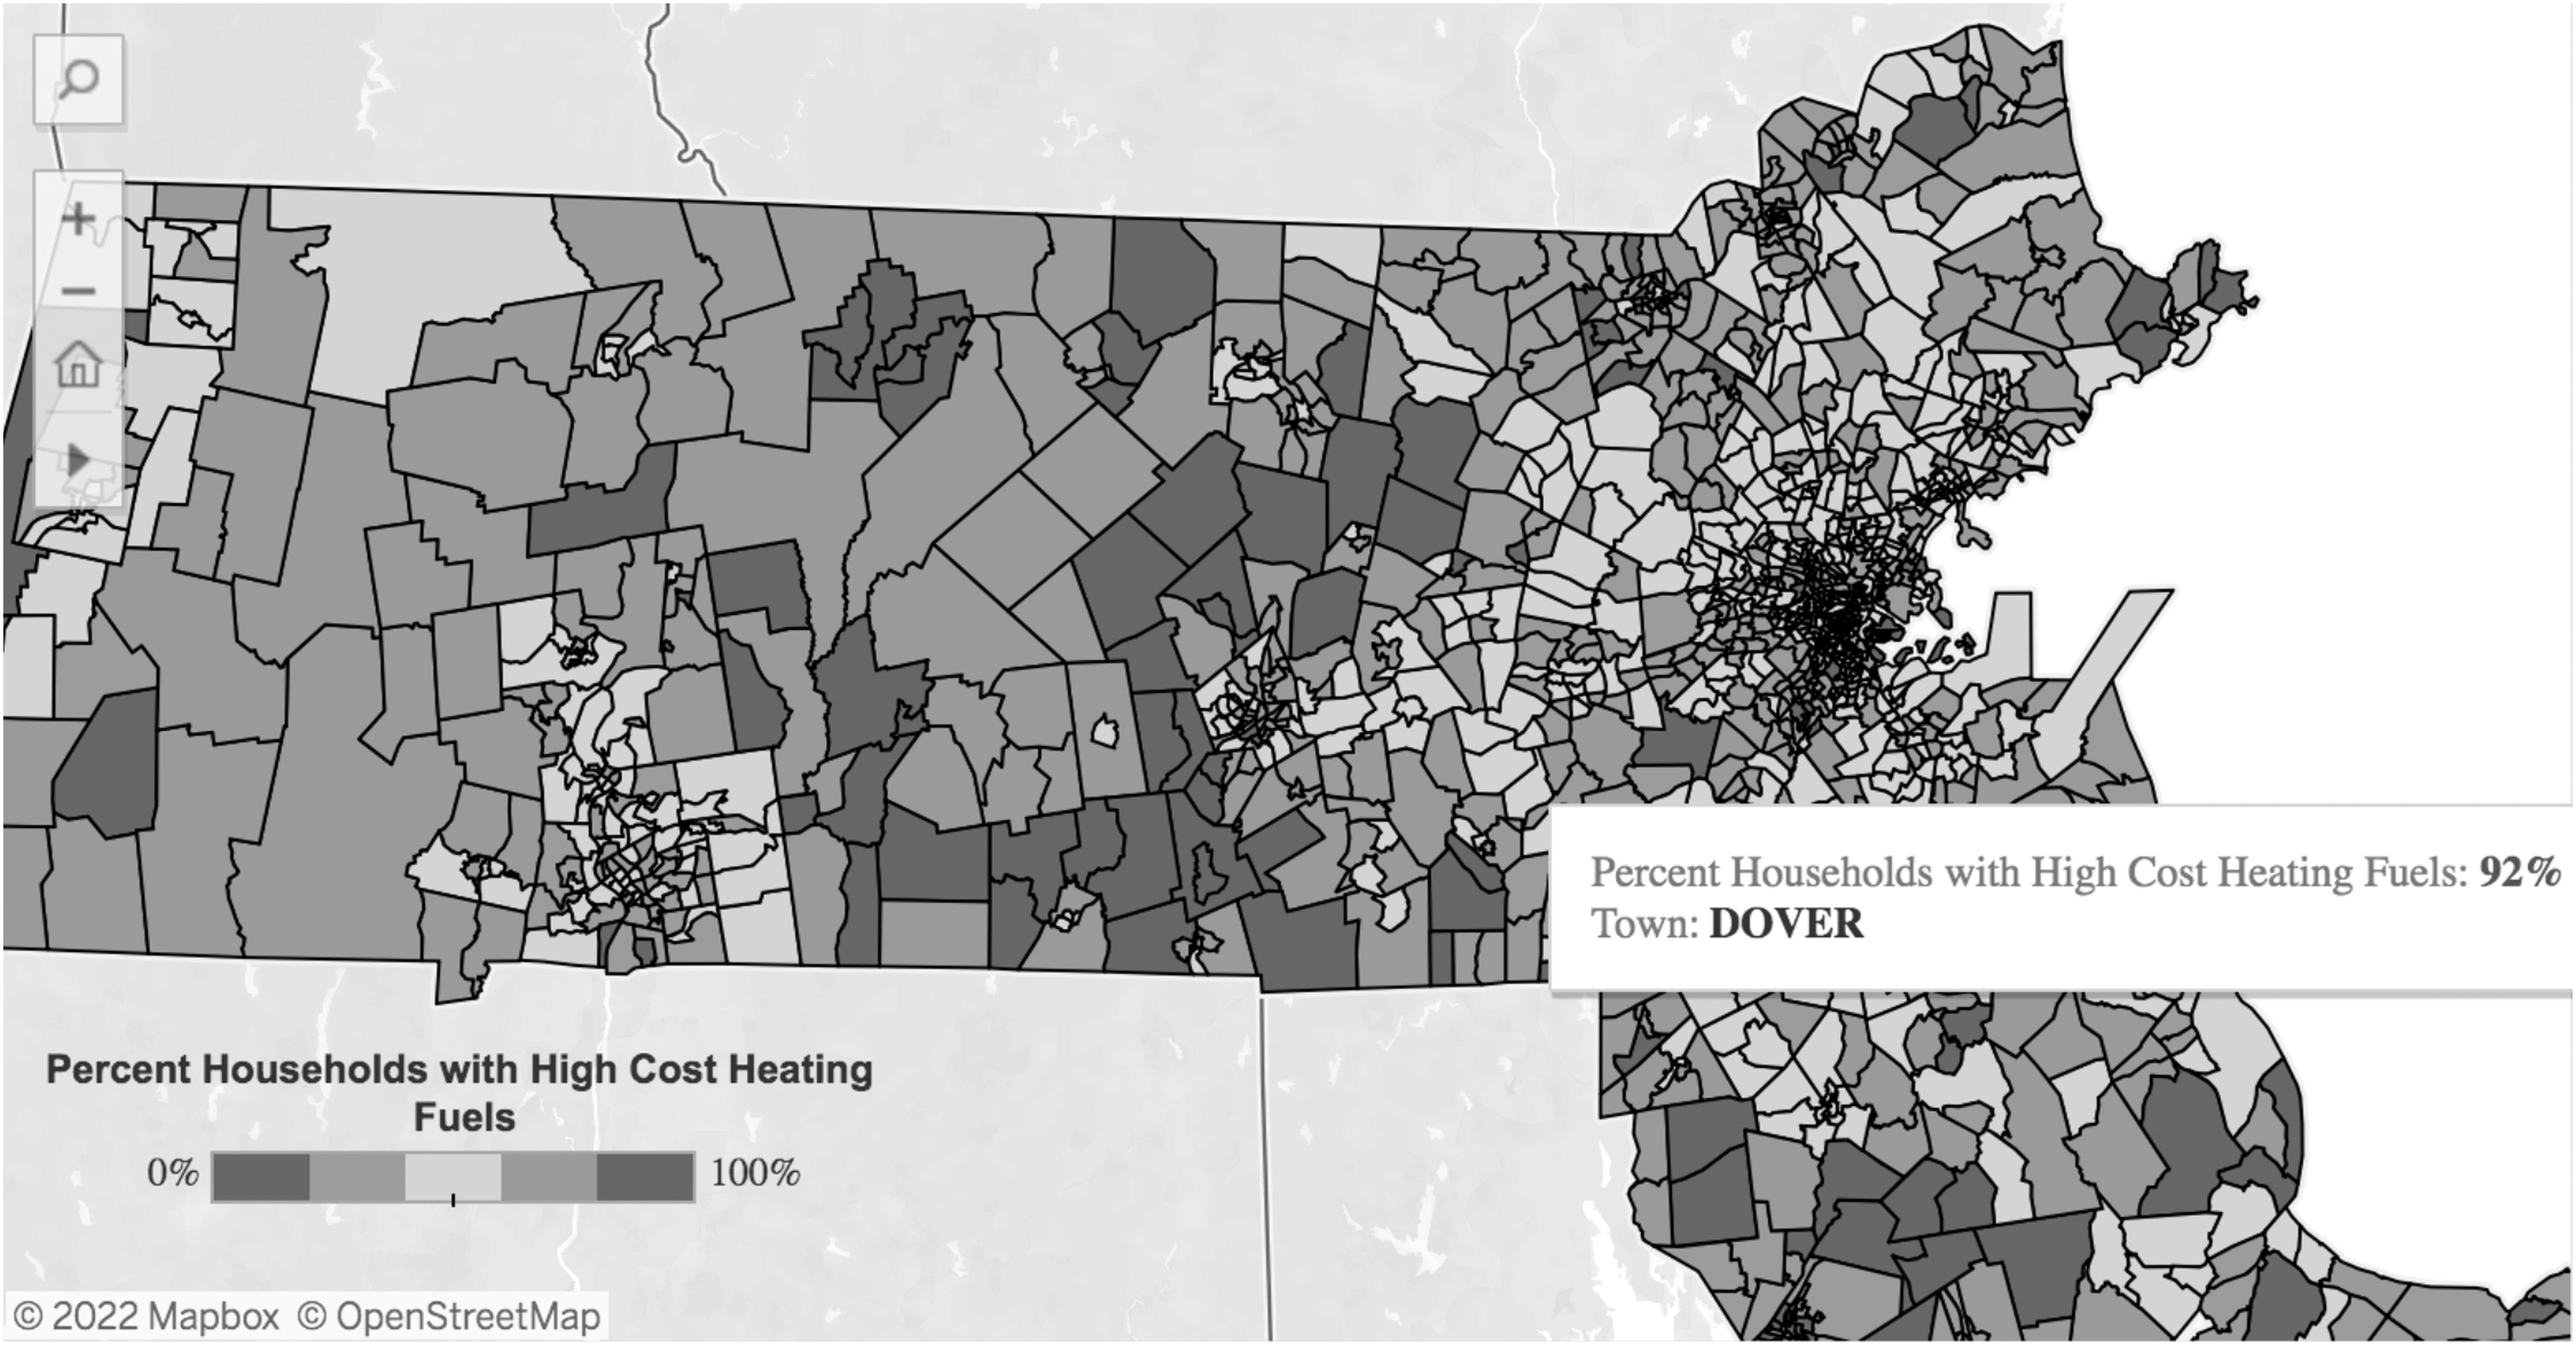
Map by the Massachusetts Clean Energy Center showing the town of Dover, MA, where 92% of households use high-cost heating fuels.
By comparison, in EJSCREEN, Dover is completely grayed out and appears to have no EJ issues or responsibilities. 38 By visualizing current, census-tract specific damage, damage-centered EJ tools demarcate blunt borders between communities that benefit from polluting infrastructure and those that bear environmental risks, rather than showing their interrelationship.
Finally, focusing on damage and disadvantage obscures the advantages derived from polluting industries and infrastructures. In the Greater Boston region, an analysis of who benefits from environmental injustice would require mapping owners and shareholders of the polluting industries situated along Chelsea Creek. However, these data are not readily available whereas data on damage abound. Privileging corporate interests, affluence, and whiteness is, in part, achieved by submerging—by not socially marking it for research or accountability. 39 The communities who shoulder the greatest environmental harms are also often excluded from their material benefits (e.g., racialized economic structures such as the stock market). 40
Discretization
Discretization refers to how factors leading to environmental injustice are made artificially discrete or separate, impeding the ability to fully assess or redress injustice. Discretization in damage-centered research occurs through bounding EJ analysis within hard and fast geographic boundaries, isolating impact categories, focusing on individual environmental contaminants, de-linking related assessments, ignoring cumulative impacts, and assessing polluting facilities as independent units rather than as interdependent corporate subsidiaries within supply chains. Thus, discretization reduces relations to singular components or entities.
Spatial discretization, for example, occurs in EJSCREEN and CEJST methodologies where both tools render census units (and impact category therein) as discrete entities. This creates false divisions with regard to where environmental harm starts and stops and forestalls systemic analysis of environmental injustice across communities.
For example, fossil fuel-related industries operate in almost four out of every five census tracts (78.9%) with EPA-designated major facilities that CEJST identifies as “disadvantaged.” 41 That these communities are actually linked by the fossil fuel supply chain is not readily perceptible in CEJST's map.
EPA EJ assessment
Discretization supports a process of managing environmental injustice locally rather than systemically or relationally, as a recent EPA process to re-permit oil storage facilities along Chelsea Creek further illustrates. In 2021, the EPA conducted a permit review and concurrent EJ assessment for five federal National Pollution Discharge Elimination System (NPDES) permits for seven Chelsea Creek oil storage facilities, managed by four oil companies (Gulf, Sunoco, Global Petroleum, and Irving), that set limits on their effluent emission into the creek. 42 Discretization shaped this process in three distinct ways.
First, the EJ assessment was a separate process from the permitting decision process that could not change the permitting decision because the EPA says it has no statutory authority to deny permits based on environmental injustice. 43 In response to concerned public comments in the previous 2014 permitting process, the EPA noted “Neither a lack of a Total Maximum Daily Load [amount of pollutant discharge] nor failure to consider climate change/disruption/warming conditions are cited as reasons for prohibiting the issuance of NPDES permits.” 44
Thus, despite identifying EJ issues, the EPA EJ assessment was largely performative. 45 Further, the EPA also does not typically consider past non-compliance in re-permitting, separating past from present and future, even though the facilities violated their permits at least 100 times between 2014 and 2020 and failed or were late to report data 40 times between 2013 and 2020. 46
In a 2021 public meeting on the permits, an EPA representative stated: “We don't generally, I would say, develop permits limits based on past compliance. That is, again, an area not for the permitting program but for our enforcement and compliance division.” Hannah Appel describes how the process of modularity—the standardization of self-contained labor, legal, expertise, and technology structures—helps to lubricate globalized oil extraction and limit corporate liability at the same time. 47 Similarly, the permitting process is self-contained and separated from enforcement and compliance procedures, allowing operations to continue smoothly even in the face of histories of noncompliance.
Second, the EPA EJ assessment itself is only based on water quality criteria (effluent emission)—criteria that themselves were not met. The assessment fails to account for related consequences of the oil industry, such as combustion by-products resulting from Logan International Airport activity. 48 Discretizing impact categories (e.g., water vs. air) precludes a complete picture of cumulative health effects resulting from oil industry permitting.
Finally, the methodology of the EPA's EJ assessment is fundamentally flawed as it is limited to a one-mile radius around polluting facilities. This boundary disconnects the broader effects of permitting mass oil storage along Chelsea Creek, which ultimately licenses a market for upstream oil refineries that affect communities far outside of the one-mile radius assessed by the EPA.
For example, a large portion of the petroleum in Boston (about 43%) is derived from oil refineries that ship through New York Harbor (Fig. 5). The census blocks around Monroe Energy Trainer Refinery in Pennsylvania rank in the 80th to 95–100th percentile nationally for the EPA's demographic index. 49 Like Chelsea, these upstream areas are in the 95–100th percentile nationally for wastewater discharge because of waste from refining operations. Where supply chains and their connected geographies are made deliberately discrete, systemic environmental injustice cannot be meaningfully challenged.
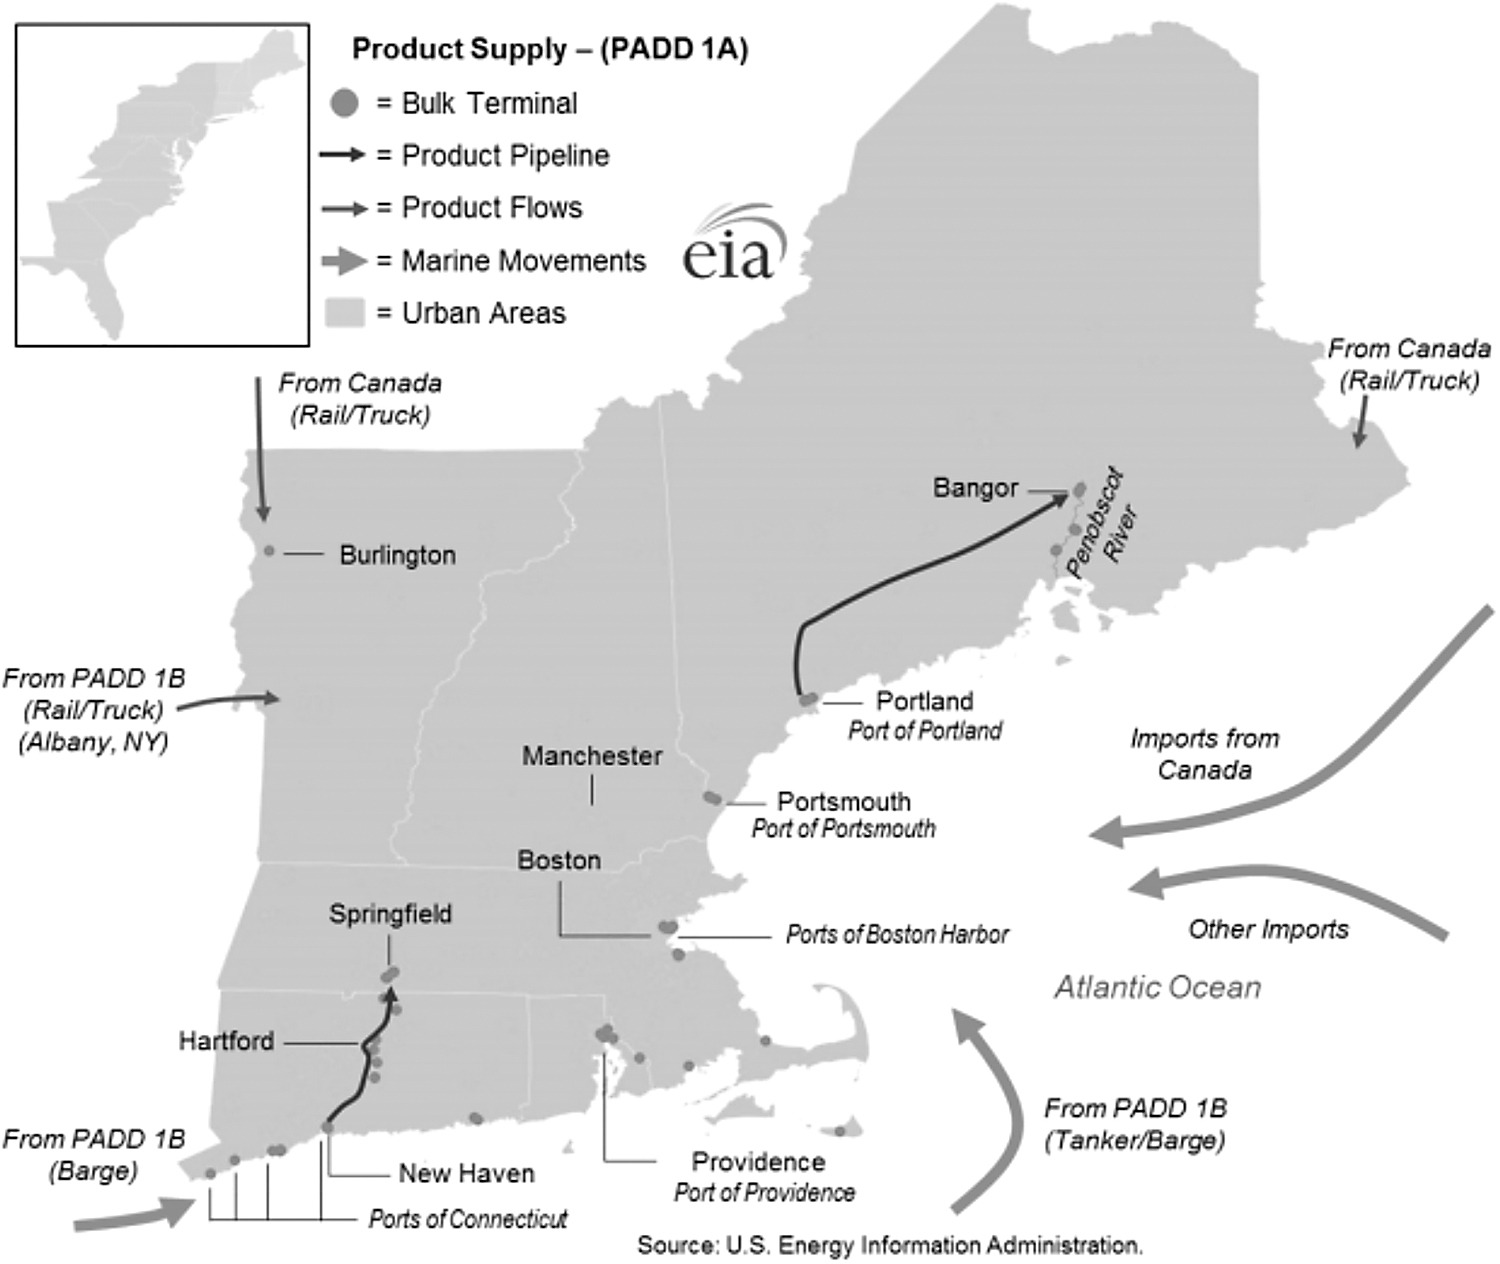
New England Refined Petroleum Infrastructure per U.S. Energy Information Administration.
In sum, damage-driven EJ analyses, such as those that characterize EJSCREEN, CEJST, and the EPA assessments, proffer what scholar Tania Murray Li calls an “incomplete diagnosis” by naturalizing, omitting, or severing critical relationships and processes. 50 A relational redesign of these EJ tools and assessments would highlight EJ communities on their own terms and make clear the role of culpable, intersecting industries; boundary-crossing supply chains; and inter-community habits of resource consumption. Responses would identify systemic intervention points to ameliorate and prevent predictable environmental harms.
DESIRING BETTER RELATIONSHIPS: THE SOCIO-ECONOMIC RELATIONSHIP QUIZ
Many LER communities remain unaware and unaccountable to the communities that make life's daily conveniences possible. As identified earlier, dominant EJ communication strategies perpetuate this structured ignorance. 51 In this intervention, we seek to engender a desire for richer networks of obligation between disparate communities; we also want to surface (rather than submerge) the ways in which affluent communities materially benefit from polluting structures such as the oil industry and financialization thereof. 52
With GreenRoots, we co-created an EJ communication tool, a relationship quiz titled: “What does Chelsea Creek do for you?” to contextualize the relational nature of environmental harm (Fig. 6). 35 The quiz format helps users recognize how often they utilize the essential services provided via the Chelsea Creek region, and also to learn about community-based EJ efforts (as opposed to government agency efforts) to redress environmental harm. Users are presented with facts about some of the services that Chelsea Creek provides followed by a question regarding participants' utilization of the services (e.g., “how often have you driven within the city of Boston or Greater Boston?”).
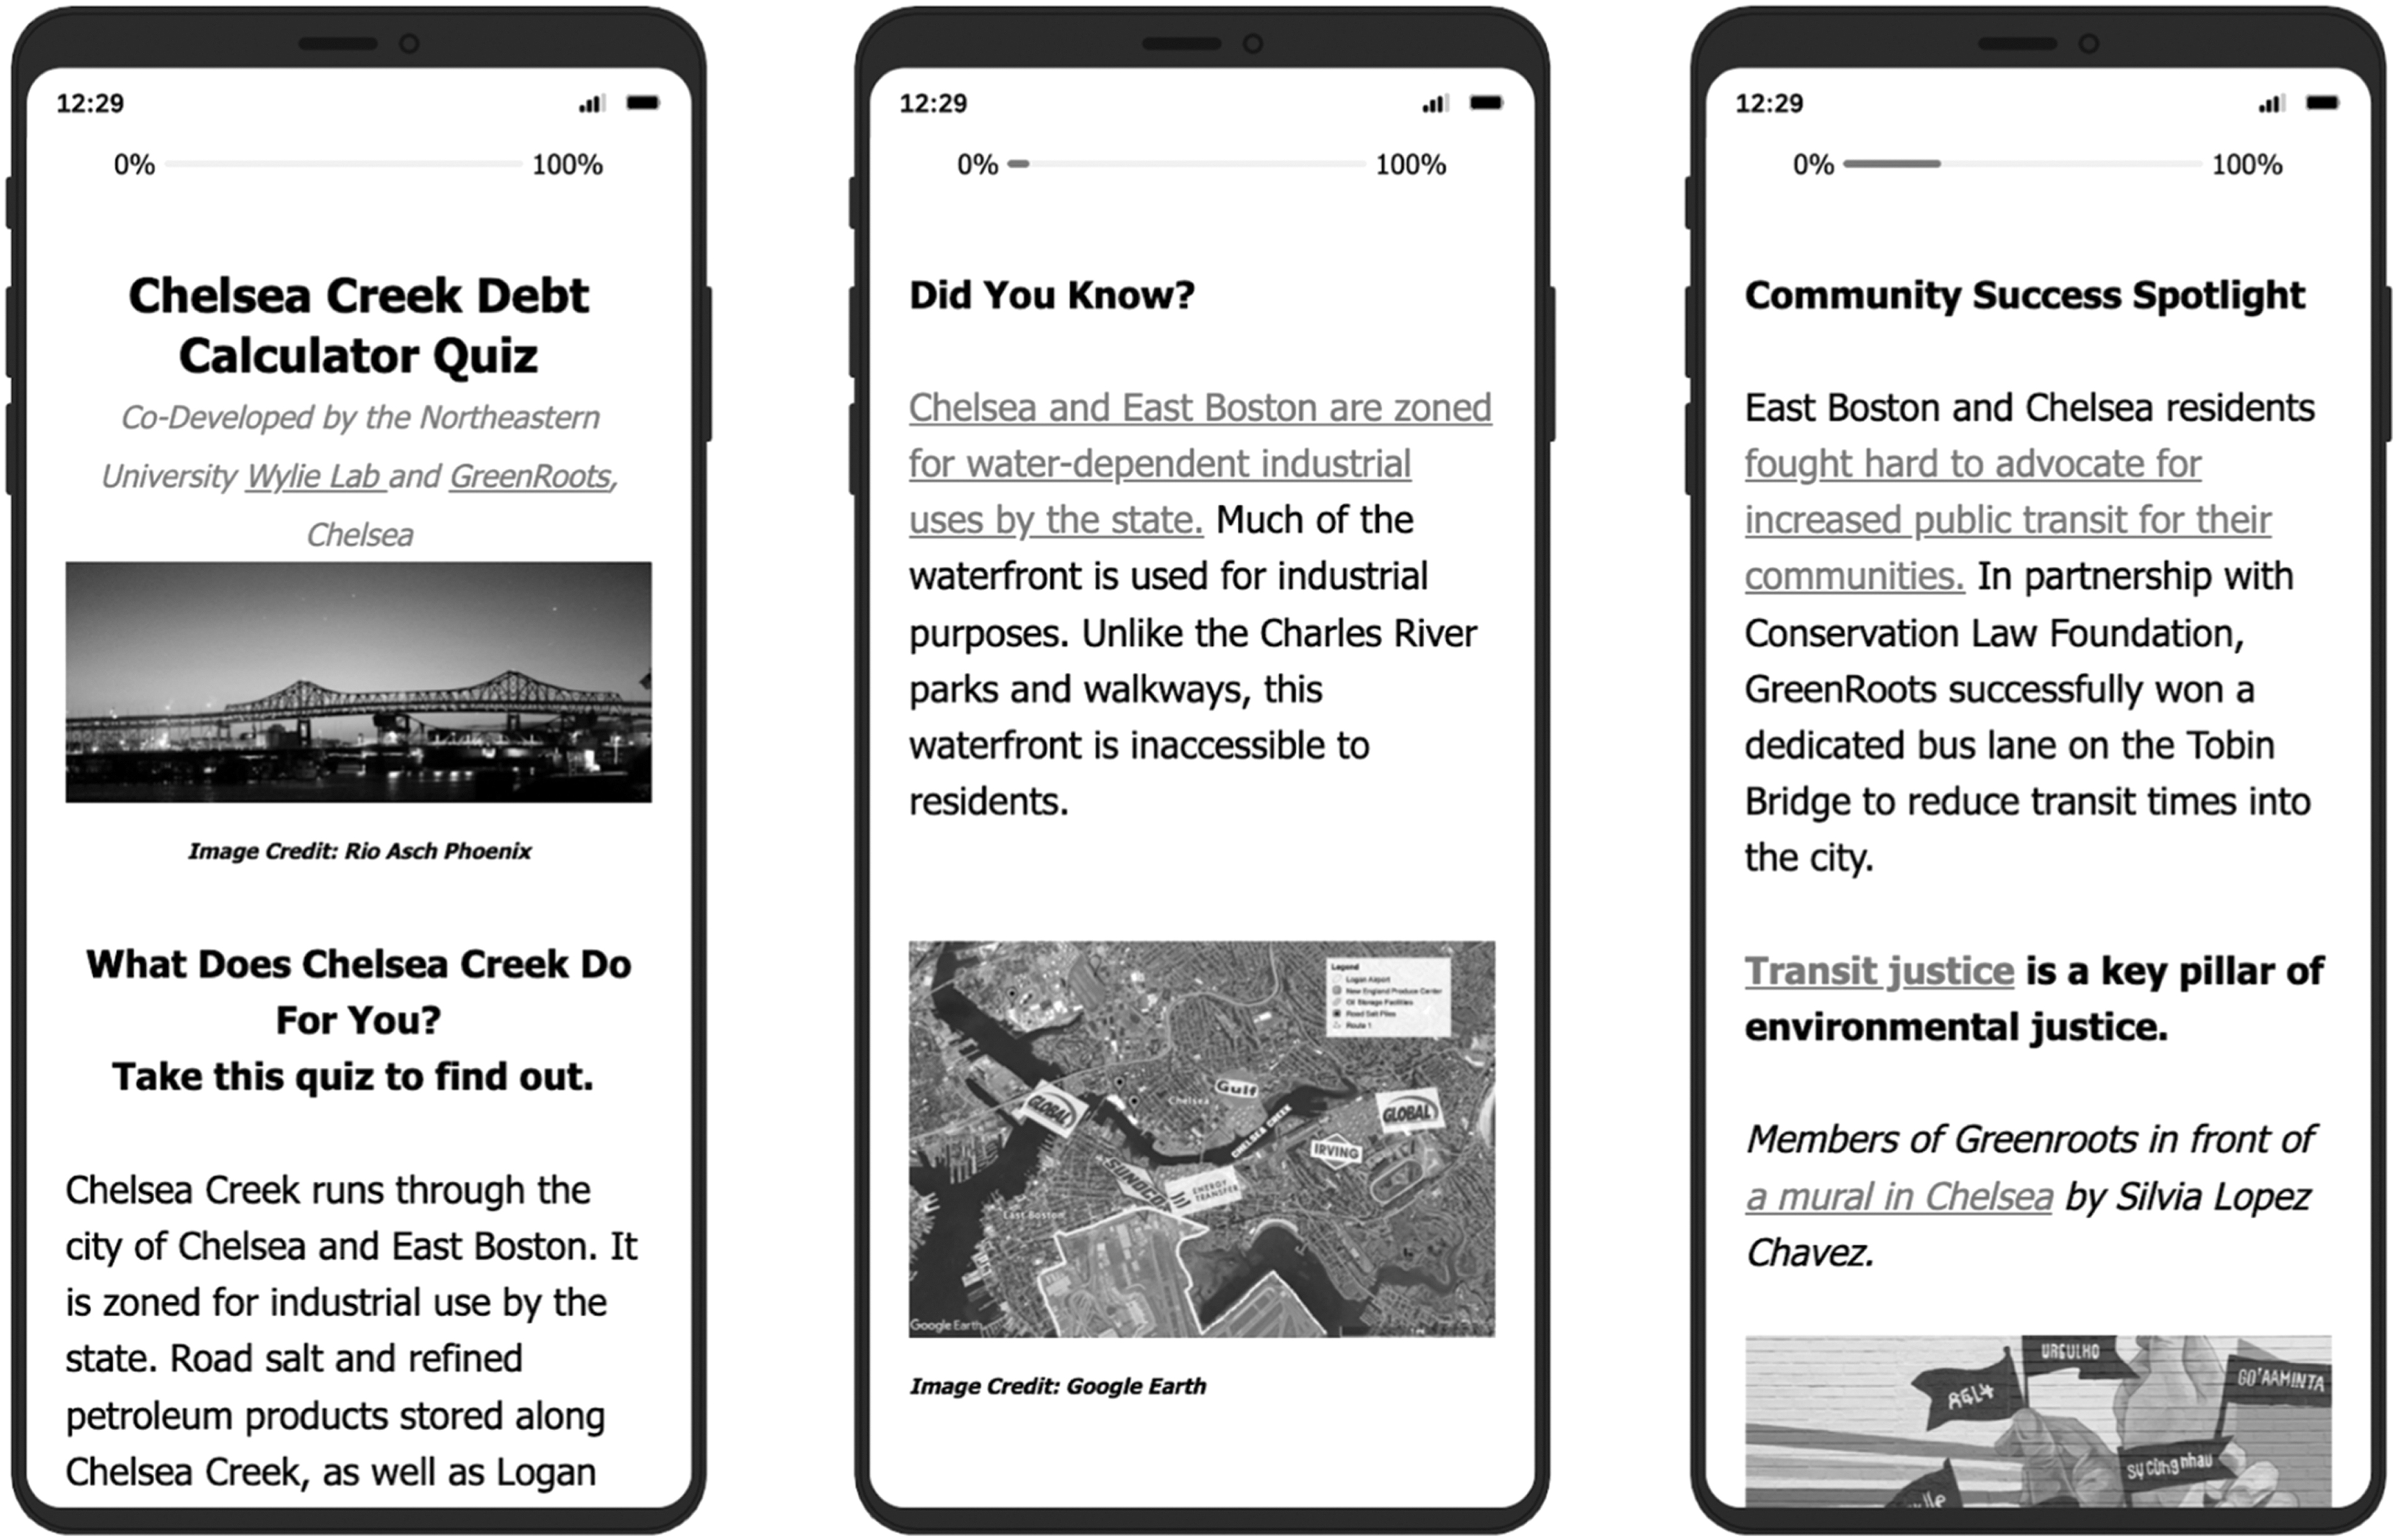
Screenshots of the relationship quiz.
Based on their responses, users are assigned a “dependency score” that correlates with their level of reliance on the Chelsea Creek region. At the end of the quiz, users are given information about connecting with Chelsea organizations such as GreenRoots, for example, by following them on social media or by donating to regional COVID-19 relief funds. 53
Based on a successful deployment of the quiz to support fundraising for Chelsea Creek area during the COVID-19 pandemic, we received pilot funding to study how the quiz affects participants' perceived relationship to the Chelsea Creek region compared with damage-centered maps such as EJSCREEN, and their understanding of regional environmental injustice.
Founded on GreenRoots' research and focus group feedback that encouraged the addition of community success stories, we are currently testing this tool in LER communities in the Greater Boston area. Our research explores whether a personally oriented, eco-social education and assessment tool will foster a more nuanced understanding of environmental harm and responsibility.
Ultimately, we hope it will promote a desire for better, more reciprocal relationships across disparate communities. Working in partnership with EJ communities, future work will use the relationship quiz to support the advocacy of community organizations such as GreenRoots to educate and affect LER community members' attitudes and actions, prioritizing direct benefits to EJ communities.
We will also work—through a workshop series—toward co-developing alternative mapping tools. Here we ask: what might relational EJ Screening tools look like? For GreenRoots, the quiz serves as a hands-on learning tool to complement their existing research, community outreach efforts, and invited speaking engagements.
CONCLUSION
When EJ research and communication methods are damage-driven rather than relational, communities such as the Chelsea Creek Region become exponentially burdened: The unequal, non-reciprocal relationships and processes that perpetuate inequitable systems are reified, obscured, and discretized, and thus sanctioned to persist. A relational approach to EJ shows how “advantaged” and “disadvantaged” communities are co-created. 54
Environmental harms are not abstract: They are lived realities resulting from racist policies and extractive industry practices. Potawatomi climate justice scholar Kyle Powys Whyte argues that the climate crisis results from the same broken socio-environmental relationships that characterize settler colonialism and capitalism writ large: a lack of consent, trust, reciprocity, and accountability in inter-human and human-nonhuman relationships. 55
A system that allows privileged communities to believe that they can reap the benefits of polluting activities while pushing burdens onto others ultimately results in a world with more overall pollution. 56
Rather than federalize community investment by centering attention and resources on measurable and often predictable environmental damage or calling on the state to arbitrate systems that are largely working as designed, our relational framework instead directs participants' attention to the broken socio-environmental relationships that drive inequities.
We hope to inaugurate a desire for more responsible relations and richer networks of obligation, especially between communities that are most indebted to those who bear the burden of broken socio-environmental relationships. We take seriously Leeuw and Hunt's caution that relationality is not a metaphor merely to be reaped for academic gain. 57
Instead, we hope the relationship quiz will serve as a modest intervention to tell a different story about EJ, one that effectively communicates how environmental harm is actually produced—systemically, relationally, and in aggregation—so that meaningful action is possible. Relationality in EJ communication and research is critical for honoring the inherently interdependent nature of EJ issues.
Footnotes
ACKNOWLEDGMENTS
The authors thank all their project collaborators in GreenRoots, Chelsea and in the Dickinson Lab at University of Colorado, Anschutz who provided insight, time, and expertise that greatly shaped this study. They are indebted to Philip Webb II, Francis Volz, Annie Ma, Michael Cullen Bober, and Hyun Lee for their foundational research on the repermitting of Chelsea Creek's oil storage facilities, and Natalie Banacos for their efforts developing the relationship quiz and research grant. They thank Kourtney Bichotte-Dunner and Vasiliki Vana Pistoftzian for their comments that have improved their thinking on damage-centered research, and Cole Mason for his assistance with citations and data analysis. Finally, they would also like to show their gratitude to the journal editor and paper reviewers for their insights.
AUTHORs' CONTRIBUTIONS
L.H.: Writing—Original Draft; Conceptualization, Methodology, Investigation, Writing—Review and Editing, and Project administration; K.M.: Writing—Original Draft, Methodology, Investigation, and Writing—Review and Editing; E.B.: Writing—Original Draft, Methodology, Investigation, and Writing—Review and Editing; S.K.: Writing—Original Draft, Methodology, Investigation, and Writing—Review and Editing; K.D.: Methodology, Writing—Review and Editing; E.N.: Resources, Formal analysis, and Writing—Review and Editing; R.B.: Resources, Methodology, and Writing—Review and Editing; S.W.: Writing—Original Draft; Methodology, Funding acquisition, Supervision, and Writing—Review and Editing
AUTHOR DISCLOSURE STATEMENT
No competing financial interests exist.
FUNDING INFORMATION
This work was supported by JPB Environmental Health Fellowship award granted by The JPB Foundation and managed by the Harvard School of Public Health and additionally supported by the National Science Foundation under Grant # 2127309 to the Computing Research Association for the CIFellows 2022 Project.