
Abstract
The environmental justice movement and community has its earliest roots in the protests surrounding the Warren County Landfill. As a student at a North Carolina university at the time, I was moved by the protests but unclear how to engage. Eventually, I found a way to marry my love of mathematics, particularly spatial analysis of data, to serving communities that are disproportionately burdened by environmental exposures.
Different types of talents and approaches can be brought together to advance the goals of the environmental justice (EJ) movement. For example, geospatial approaches, which were initially developed to address ecological questions, can be powerful tools for understanding exposures and impacts, as well as for tailoring intervention strategies. They also serve as great platforms for engaging directly with communities. Collaboratively developing maps and using them for outreach and engagement has been both meaningful work and a wonderful source of fellowship and laughter.
The umbrella that covers the EJ movement is broad, and the community is welcoming, perhaps because the maddening persistence of EJ problems calls for many different approaches. I am daily inspired by the work of my EJ colleagues, and grateful for the opportunity to be a small part of the good fight in which the community is engaged.
It is likely that anyone reading this special issue is familiar with the Warren County landfill protests, but just in case not: in the late 1970s, the Ward Transfer Company dumped an estimated 60,000 gallons of polychlorinated biphenyls-laced oil along 210 miles of North Carolina (NC) roads located across 14 NC counties, creating 32,000 cubic yards of contaminated soil. The state made the decision to dispose of the contaminated soil in a newly sited landfill to be located in Warren County, a county with one of the highest percentages of African Americans in the state at the time (and still today). 1 Protesters argued with authorities over the geological suitability of the site, but, perhaps more importantly, the protests focused on the opportunity to live in a healthy environment as a basic civil right, just as communities had previously fought for (and continue to fight for) the right to a good education, good jobs, and good housing. In the end, the landfill was sited in Warren County despite the protests, but the concept of EJ came into being.
When protests surrounding the Warren County Landfill first erupted in NC, I was an undergraduate student studying mathematics at Duke University. I followed the story closely in the newspaper, drawn to the compelling photographs (see Fig. 1)—some taken by fellow Duke students. 2
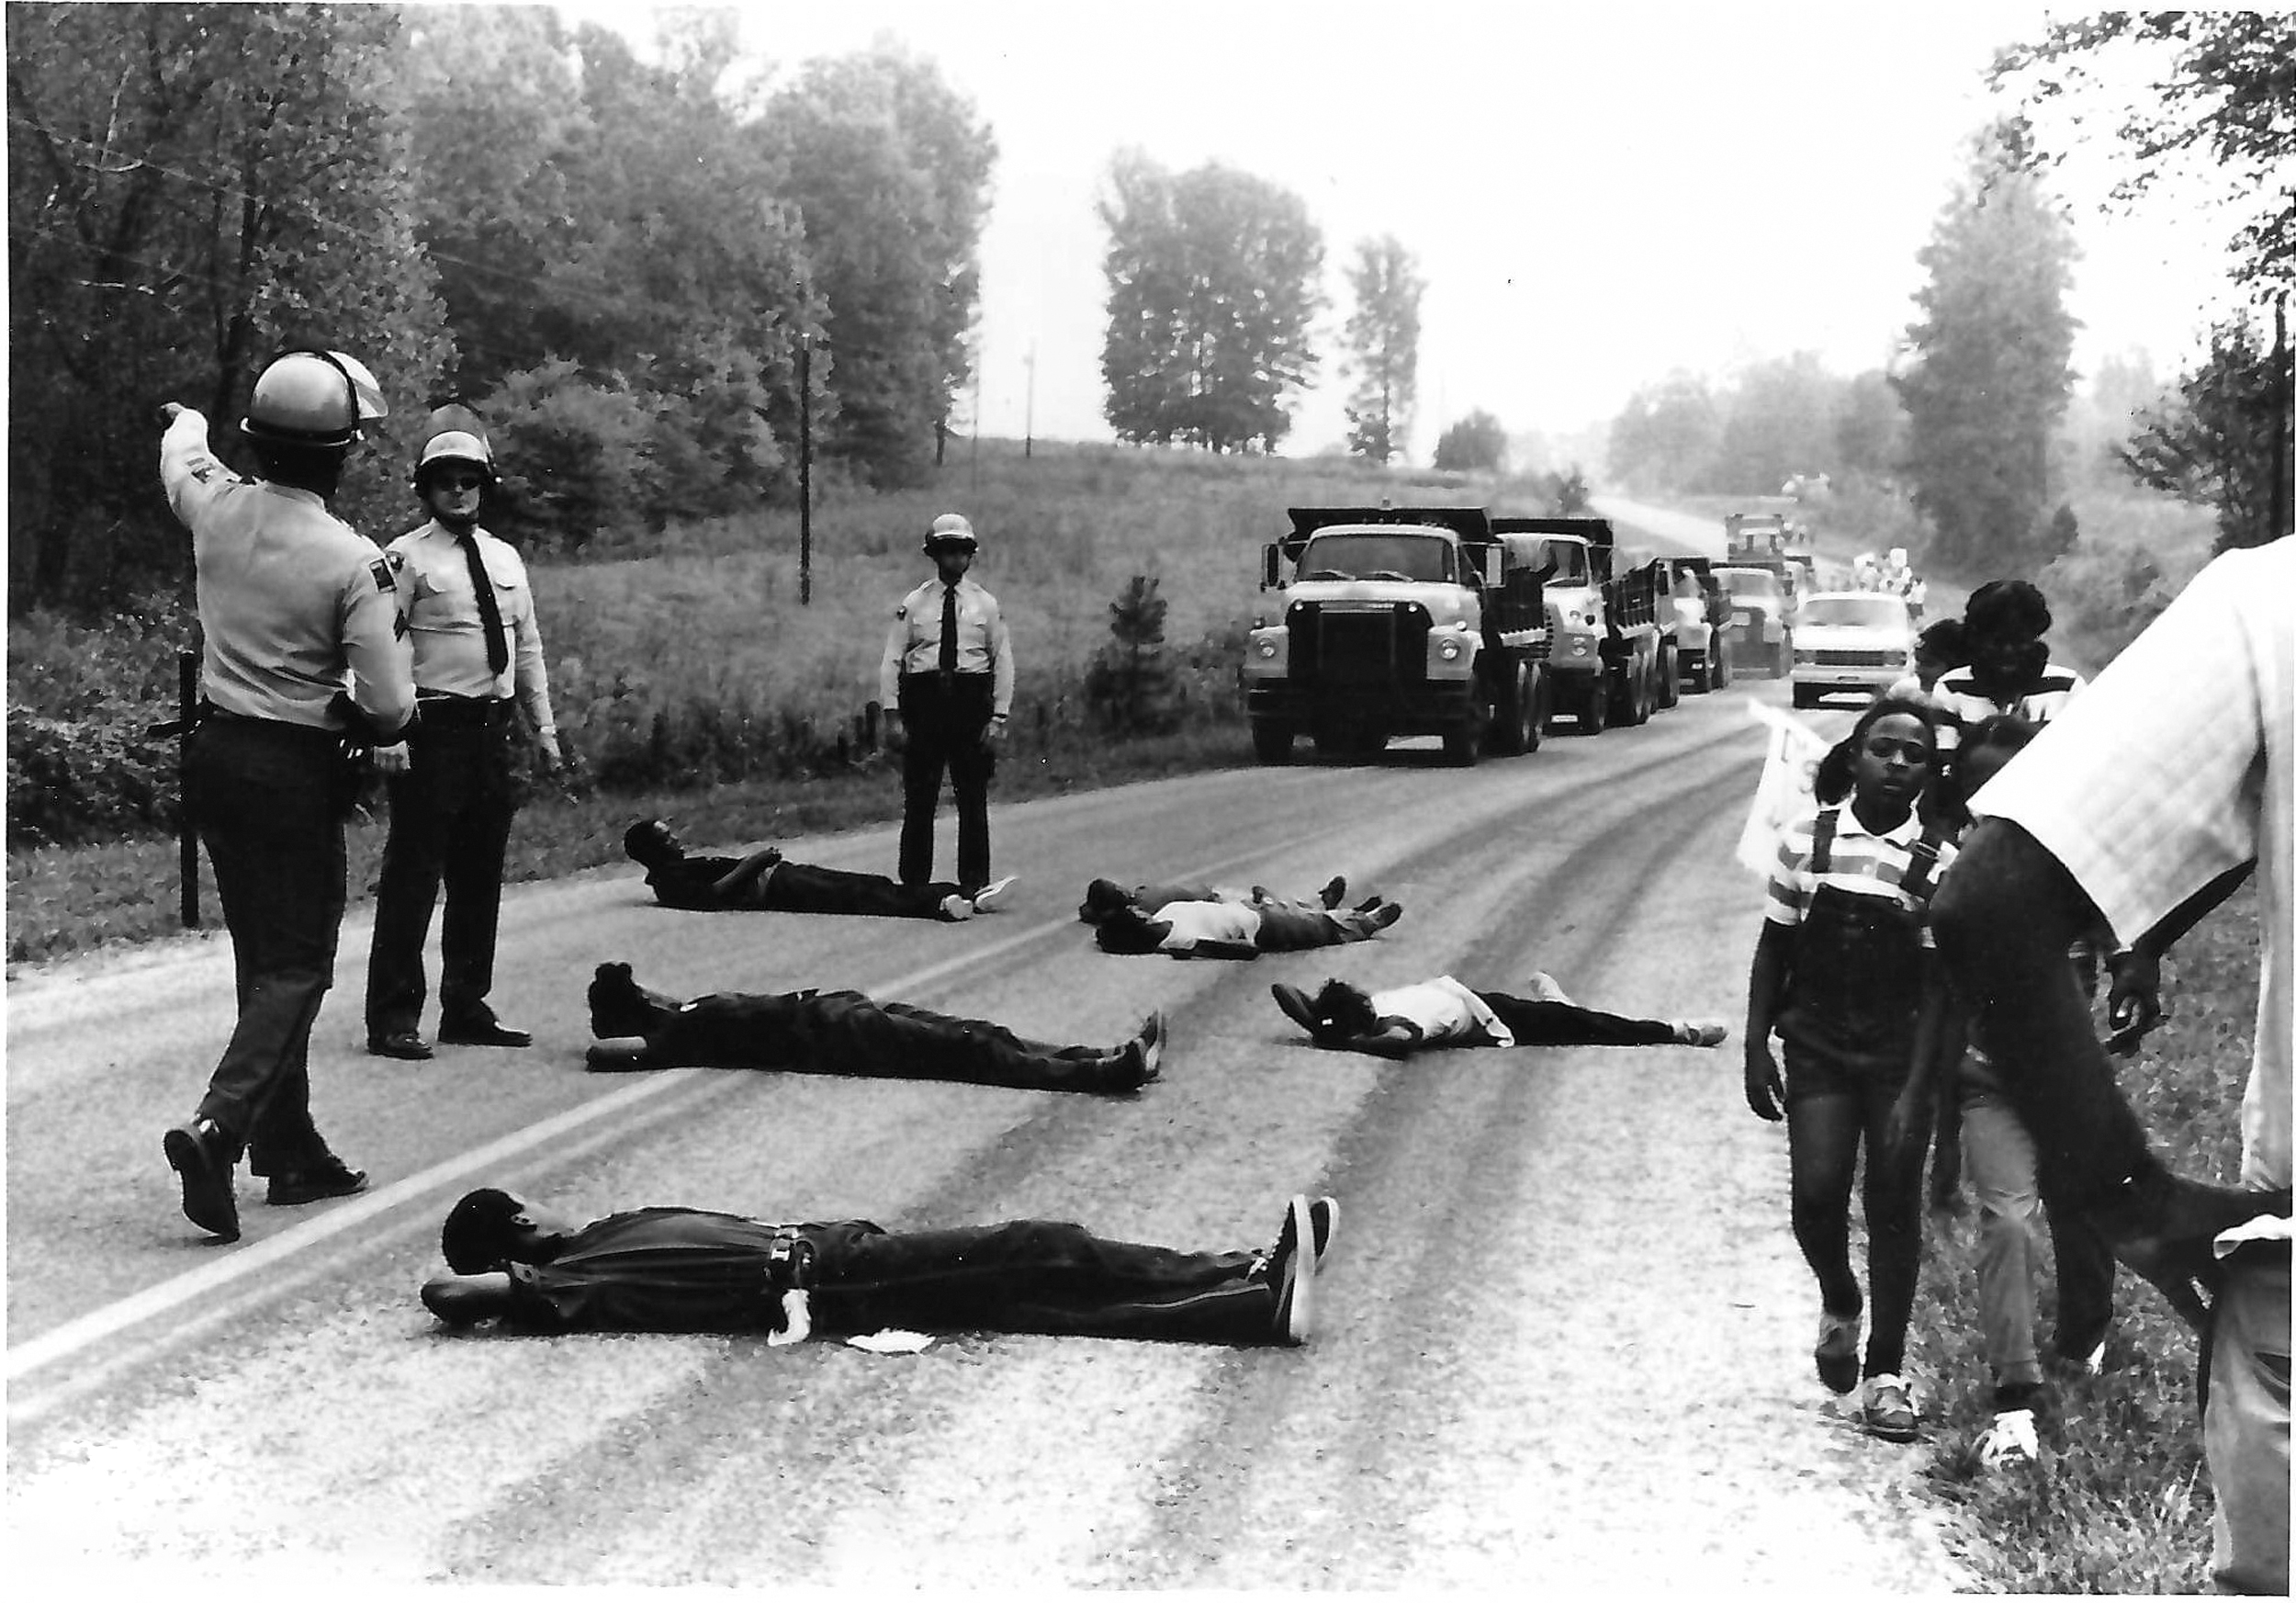
Protesters blocking trucks headed to the Warren County landfill. Copyright © Jenny Labalme. Permission granted in 2022 to Dr. Marie Lynn Miranda and Environmental Justice.
I remember being struck by the idea that this was part of the long arc of the civil rights movement, a movement that felt very real to me having experienced the race riots in my hometown of Detroit and having met the powerful Rosa Parks and received a scholarship named after her from the local Detroit newspaper. Nevertheless, despite the fact that Warren County was a short 1 hour trip up I-85 from Duke, I never took part in any of the protests or went and spent time in community with the people who were most affected.
I knew I wanted to do environmental work. I knew that, especially coming from an immigrant family, I wanted to be part of helping the United States achieve its greatest potential. And I knew I loved math. What I did not know was that this concept of EJ, which was being forged a short distance away, would come to form the basis of my life's work. How I wish my young self had understood that and found my way to Warren County.
Fast forward a few years, and I was a faculty member back at Duke. I had gotten a PhD in economics, because I was most interested in the human dimensions of environmental problems—and hence a social science PhD seemed sensible (yes, I actually used the word “sensible” to describe the decision to go to graduate school!), and economics was then and is now the most mathematical of the social sciences. Every time I think about how I made that decision, shaking my head, I recommit to engaging deeply in advising young students. I became self-taught in toxicology to satisfy my interest in the scientific side of environmental work, and I deepened my knowledge of statistics, but I still had not found my way to EJ work. I read about and resonated with the principles that came out of the First National People of Color Environmental Leadership Summit, but I still did not make the connection to my own work. Clearly, I was a slow learner.
Five years into being a faculty member, I became the director of undergraduate programs for the Nicholas School of the Environment at Duke. In reviewing the curriculum, I realized that students could graduate with a degree in environmental sciences and policy without knowing anything about the justice dimensions of environmental issues. And that did not seem right. We made the collective decision that, rather than having a specific course on EJ, we would infuse concepts of EJ across the curriculum. That in turn meant that I needed to walk the walk and include EJ concepts into my own course, which used case studies to teach environmental science and policy.
Of all the many EJ issues that I could have centered a case around, I felt very drawn to the issue of childhood lead exposure. I worked closely with Ed Norman, the director of the North Carolina Childhood Lead Poisoning Prevention Program (NCCLPPP) in preparing materials for my course. As an aside, we eventually printed copies of the case study book, which he sent to all of the local health departments throughout the state and to others involved in NC's lead poisoning prevention work. Ed also came to campus and gave a guest lecture in my class. I remember so distinctly as I was walking him out to his car, Ed saying to me, “It seems like that case study that you are using for teaching could be part of your research too. You sure do get excited about lead.”
Probably unbeknownst to Ed, his statement was a turning point for me. At the time, I was using my expertise in spatial analysis of data to conduct research on land management. It was very interesting, but did not feel like my life's work. At the same time, my husband and I had started having children (see Fig. 2), and the notion of focusing on children's environmental health was very appealing to me—it would create this wonderful consonance that at both work and at home, I would be trying to foster environments where all children can prosper. This work could leverage my love of mathematics, spatial analysis, and the power and beauty of explaining analytical results using maps. And thus began my long-term work on lead and other environmental threats to children's health, work that would eventually be conducted through an organization called the Children's Environmental Health Initiative or CEHI that started in 1998 and continues its work today.
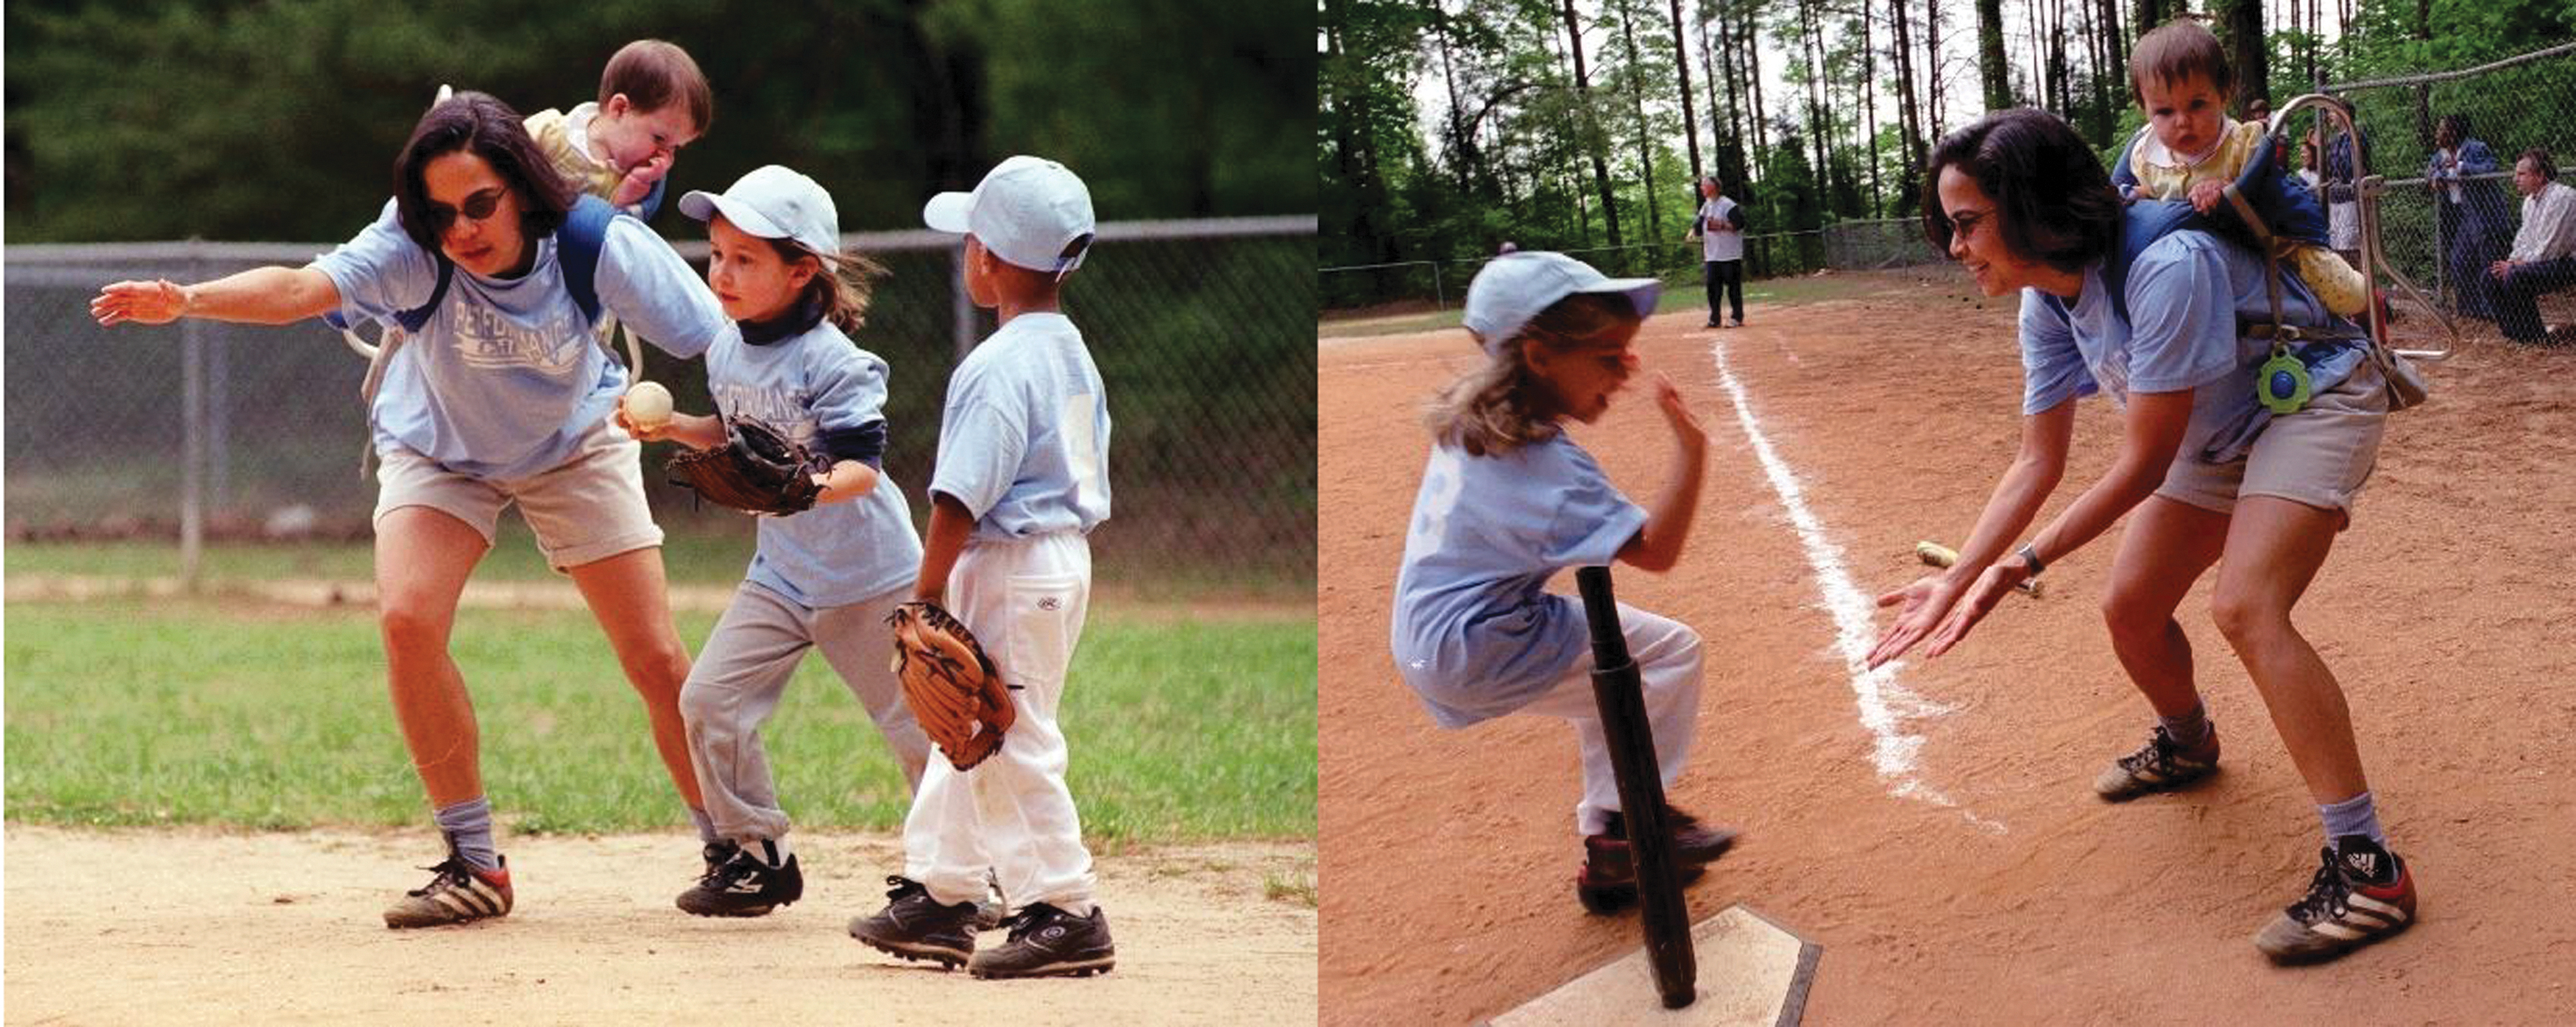
This is me in 2002, trying to raise kids, coach a community T-ball team, and prevent childhood lead exposure. That is my youngest in the backpack, and my middle child scoring at home base. My daughters often accompanied me to community events—willingly and with enthusiasm!—and both are deeply committed to social justice work today. Photo provided by the author.
CEHI's first EJ research project was focused on developing a childhood lead exposure risk model. At the time, some stakeholder groups were arguing for universal testing of children for lead exposure. Although local health departments were certainly committed to protecting children, they did not feel that they had the resources to test all children without cutting back in other critical areas—and they questioned the sensibility of testing children who lived in and went to day care/school in recently constructed buildings. Our thought was to provide health departments and community groups with a map-based tool to determine, house by house, which children were at highest risk for lead exposure and make sure they got tested.
We began with seed funding from Duke, as well as from the Office of the Director (Dr. Ken Olden—thank goodness for his early encouragement) at the National Institute of Environmental Health Sciences (NIEHS). We eventually partnered with NCCLPPP for a grant from the Centers for Disease Control and Prevention (CDC).
This work used geographic information system (GIS) technology to combine county tax assessor, NC blood lead testing, and U.S. Census data to create household-level priority models for childhood lead exposure. 3 Figure 3 is a sample mapping drawn from the Durham County, NC project. The map uses spatial analysis to categorize lead risk levels at the individual tax parcel unit level. Dark blue areas represent Priority 1 (highest risk—top 10%) parcels, predicted most likely to contain lead paint hazards. Priority 2 (next 10%) and 3 (next 40%) parcels are colored medium and light green, respectively, and are less likely to contain lead paint hazards.
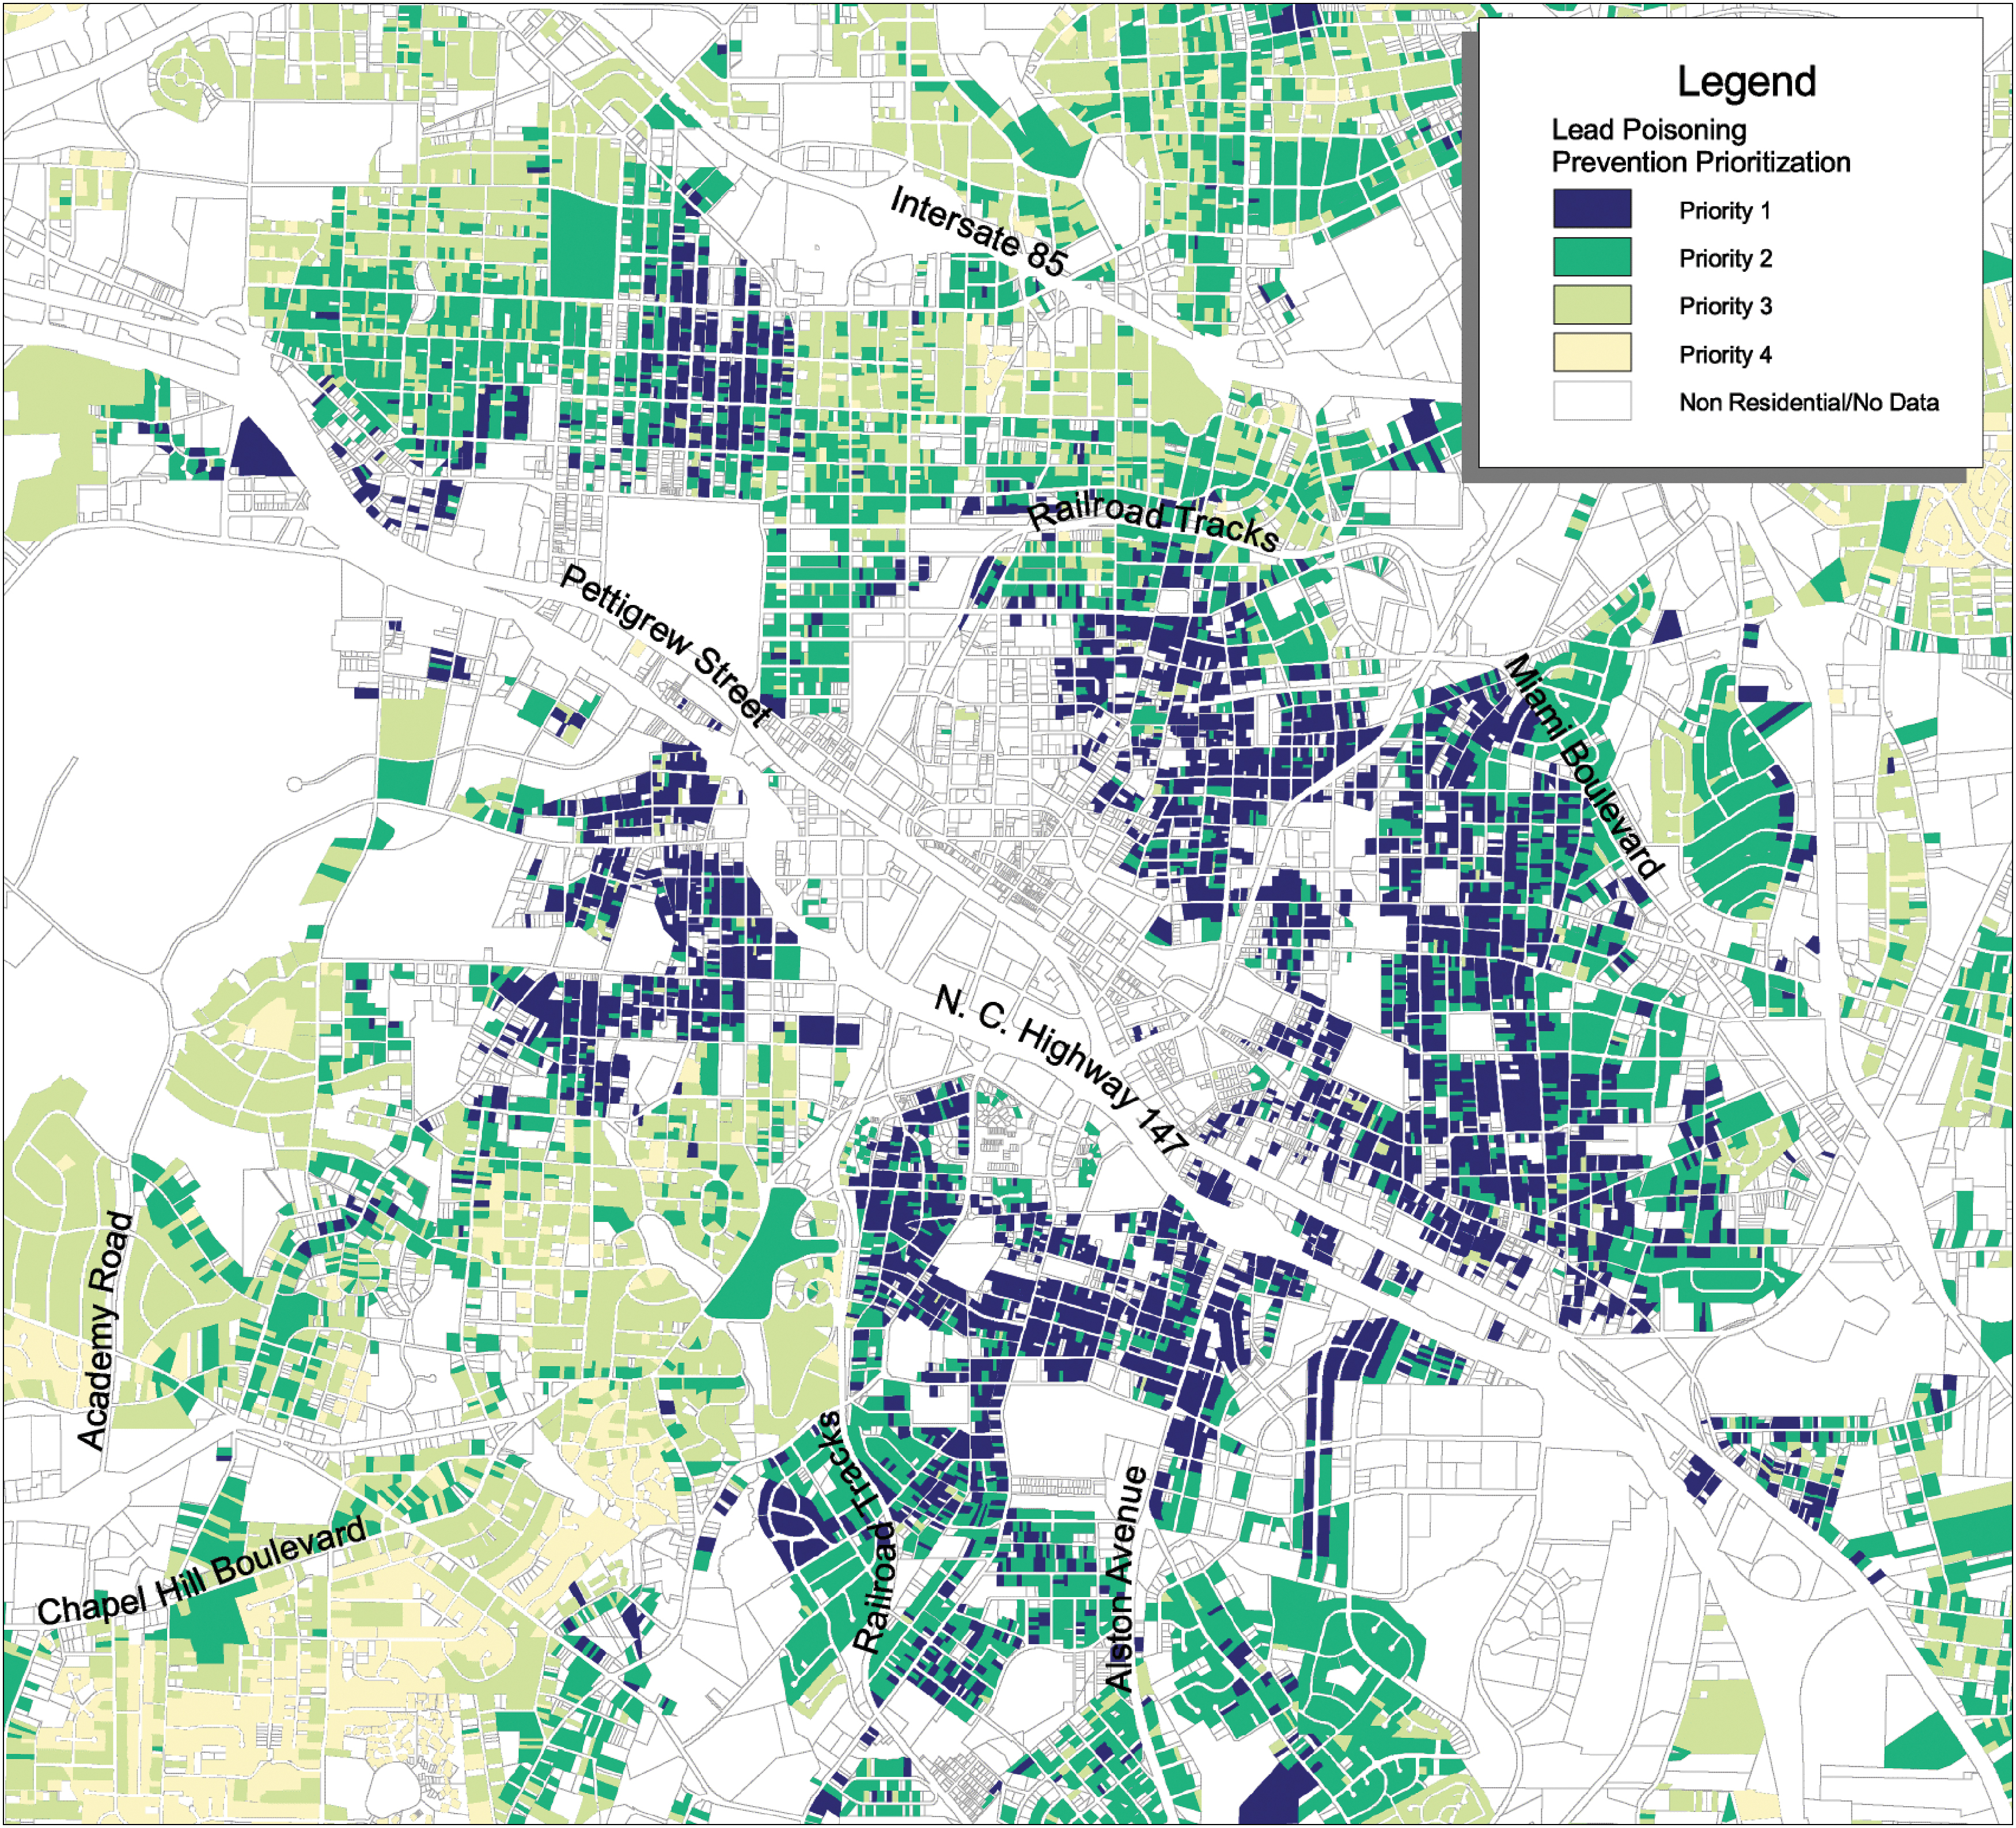
Childhood lead exposure risk model for Central Durham in Durham County, NC. NC, North Carolina.
Priority 4 (lowest risk—last 40%) parcels are yellow and least likely to contain lead paint hazards. White areas represent commercial or industrial properties. The map was the product of spatial statistical analysis that was then validated by collection of environmental samples. CEHI eventually built this childhood lead exposure risk model for 50 counties in NC, as well as in national replication sites across the country. 4 Instructions for building such a model in any other location are available from CEHI, and we provide pro bono consulting to any entity undertaking such work.
When used in the field, the model proved especially useful. The decision to produce 10/10/40/40 maps, as we call them, came from local health and housing departments, as well as community groups, who stated that such divisions would be most useful to them. Health departments used the maps to tailor their lead testing programs, including identifying neighborhoods where testing would be brought directly to the community (through churches, community centers, and mobile clinics), rather than hoping that families residing in high-risk areas would bring their children to the health department. For example, the Durham County Health Department's decision in 2003 to base its testing strategy on this model resulted in a 600% increase in its capture rate of children with elevated blood lead levels. 5
The maps were also linked to birth records so education on lead safe cleaning practices could reach the families at highest risk as quickly as possible. In addition, housing departments used the model to apply for federal grants from the Department of Housing and Urban Development and to prioritize the disposition of housing rehabilitation dollars. Community groups such as the Durham Affordable Housing Coalition and outreach efforts from North Carolina Central University (an HBCU in Durham) organized home testing days based on these models/maps to test for lead in homes and to help residents work with landlords on addressing lead safety issues. Geospatial analysis and GIS-based displays of results proved powerful in conveying research insights to a broad range of constituencies. Our most important insight from all of this work was that geospatial approaches could be used to link previously unrelated data sets to create spatial data architectures that enable powerful analysis.
Having built relationships with NCCLPPP, as well as with staff from health departments across the state, CEHI was well positioned when tests of residential tap water showed high levels of lead after the introduction of chloramines for disinfection purposes in water treatment systems in the Washington, DC and Greenville, NC areas. 6 We tested the potential effect on childhood blood lead levels of switching to chloramines using data from Wayne County, located in the central coastal plain of NC. Our analysis showed that the use of chloramines was associated with an increase in blood lead levels, the impact of which was progressively mitigated in newer housing. This work also provided guidance on adjustments in the local childhood lead poisoning prevention program that should accompany changes in water treatment—guidance that was again disseminated throughout the state in partnership with the NCCLPPP. 7
As we were trying to assess childhood lead exposure risk on a house-by-house basis, our time in neighborhoods brought us into contact with many community groups. One group, Durham Congregations, Associations, and Neighborhoods (Durham CAN), was especially interested in formally assessing the built environment. Working in partnership with Durham CAN, we identified the key variables of interest and developed a Global Positioning System (GPS)-enabled system for systematically capturing built environment data.
During the summer of 2008, a field team conducted an on-foot, curb-side assessment of ∼17,000 tax parcels in central Durham, evaluating each tax parcel on 57 variables using handheld GPS devices. This Community Assessment Project (CAP) was repeated in the summer of 2011, this time on roughly 30,700 tax parcels, again in Central Durham. CAP data were combined with Durham crime and tax assessor data and then summarized into seven neighborhood health indices (see Fig. 4).
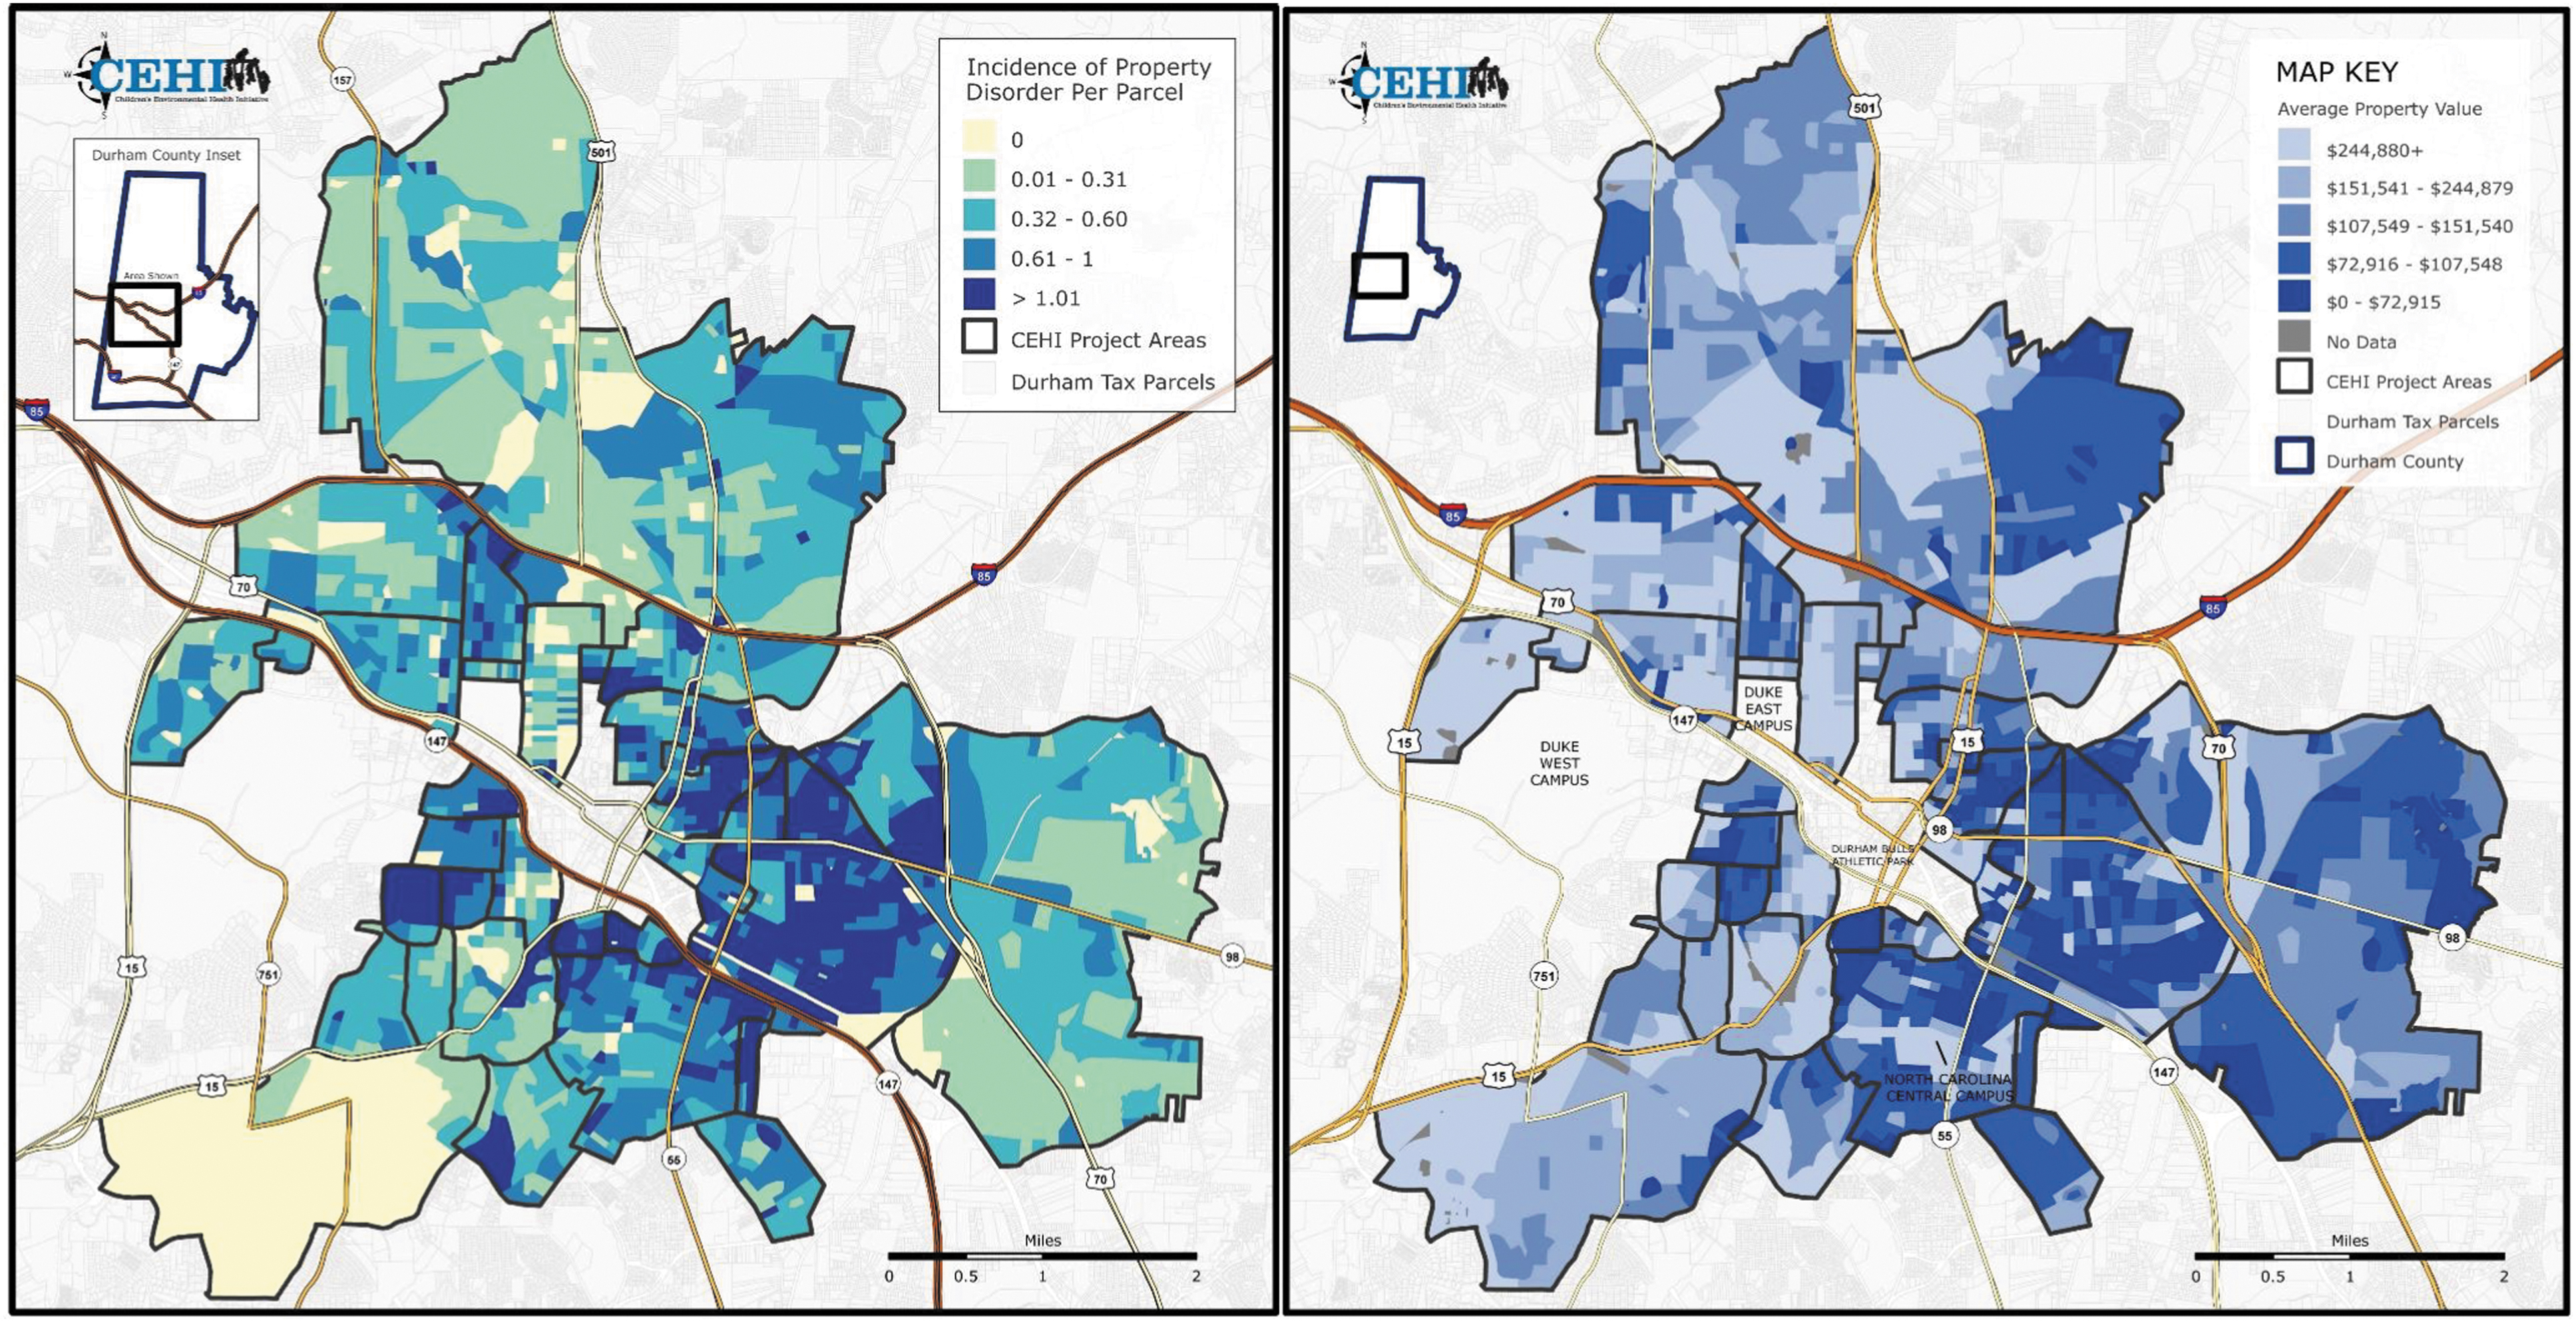
Property damage and property values from CAP. Darker colors represent greater property damage or lower property values. CAP, Community Assessment Project.
Investigating the built environment using the CAP data, we found that higher levels of housing damage, property disorder, tenure, and vacancy were associated with increased likelihood of preterm birth and low birth weight. 8 Community groups used these data to advocate for neighborhood investments and to strengthen neighborhood associations. Although this work did not relate directly to lead exposure, it extended the impact of all of our work by strengthening the community's sense of how spatially referenced data and analysis could be leveraged in advocating for community improvements and investments.
Our work on the lead risk exposure model taught us an enormous amount about how to successfully combine previously unrelated data sets through shared geography. This capability related to another ongoing debate dealing with the CDC's threshold for lead exposure, which had been lowered to 10 μg/dL in 1991. Many researchers were deeply engaged in demonstrating the adverse effects of lead exposures at levels well below 10 μg/dL. 9 In collaboration with the North Carolina Educational Data Resource Center, we were able to connect blood lead testing data from across NC to end of grade (EOG) testing data for students enrolled in public schools.
Through this work, we were able to show that lead exposure had discernible and meaningful associations with EOG scores even at early childhood blood lead levels as low as 2 μg/dL, providing evidence that there is no safe level of lead exposure. 10 We were also able to show an association between lead exposure and learning and behavioral disorders. 11 CEHI's work on early childhood lead exposure and educational outcomes provided important evidence regarding how lead exposure contributes to the achievement gap.
Non-Hispanic Black children and children of low socioeconomic status are disproportionately exposed to lead. Eminent researchers such as David Bellinger, Richard Canfield, Deborah Cory-Schlecta, Kim Dietrich, Tomas Guilarte, Bruce Lanphear, Joel Schwartz, and Robert Wright were also assessing the cognitive impact of lead exposure. 12 These findings collectively helped inform the CDC's decision to move the blood lead action level from 10 μg/dL to a reference value of 5 μg/dL in 2012.
We subsequently were made aware of the continued use of lead in aviation gasoline for general aviation aircraft. Once again, we found a way to use geospatial approaches to combine data from different sources to address an important question. More specifically, we were able to map the location of general aviation airports and spatially connect them to children who had been tested for lead exposure, as well as to the age of housing in which the child resided. We found that children who lived in proximity to general aviation airports (within ∼305 meters) had higher blood lead levels, even after controlling for the age of the house in which they lived. 13
In many ways, CEHI's work on children's environmental health is about finding one opportunity after another to creatively link previously unrelated data sets through shared geography and then apply spatial statistics to the resulting data sets—or at least that may be how it appears on the surface. In reality, CEHI's work has been about being inspired by great leaders in the environmental and social justice fields time and time again.
While I was still at Duke, Robert Bullard visited the university and gave a tremendous talk on Toxic Waste and Race at Twenty, 1987-2007, a piece that followed the seminal Toxic Wastes and Race Report of 1987. 14 His words then, both in his public talk and his generous time spent with my colleague Jay Hamilton and me, reminded us of the continued importance and persistence of the justice issues faced by low-income and minority communities.
When CEHI moved to the University of Michigan, we had the privilege of participating in a celebration in honor of the truly amazing Bunyan Bryant, with contributing talks from giants in the field such as Jose Bravo, Michael Dorsey, Deeohn Ferris, Lisa Garcia, Michel Gelobter, Charles Lee, Grace Lee Boggs, Vernice Miller-Travis, Paul Mohai, David Pellow, Michele Roberts, Peggy Shepherd, Dorceta Taylor, Donele Wilkins, Beverly Wright, and, of course, Bunyan himself. The conference participants were striking in their relentless focus on the future. Not to be contented with all they had accomplished, these luminaries were determined that the best way to honor Bunyan Bryant was to forge a compelling path forward—and Bunyan was right there with all of us planning for the future (Fig. 5).
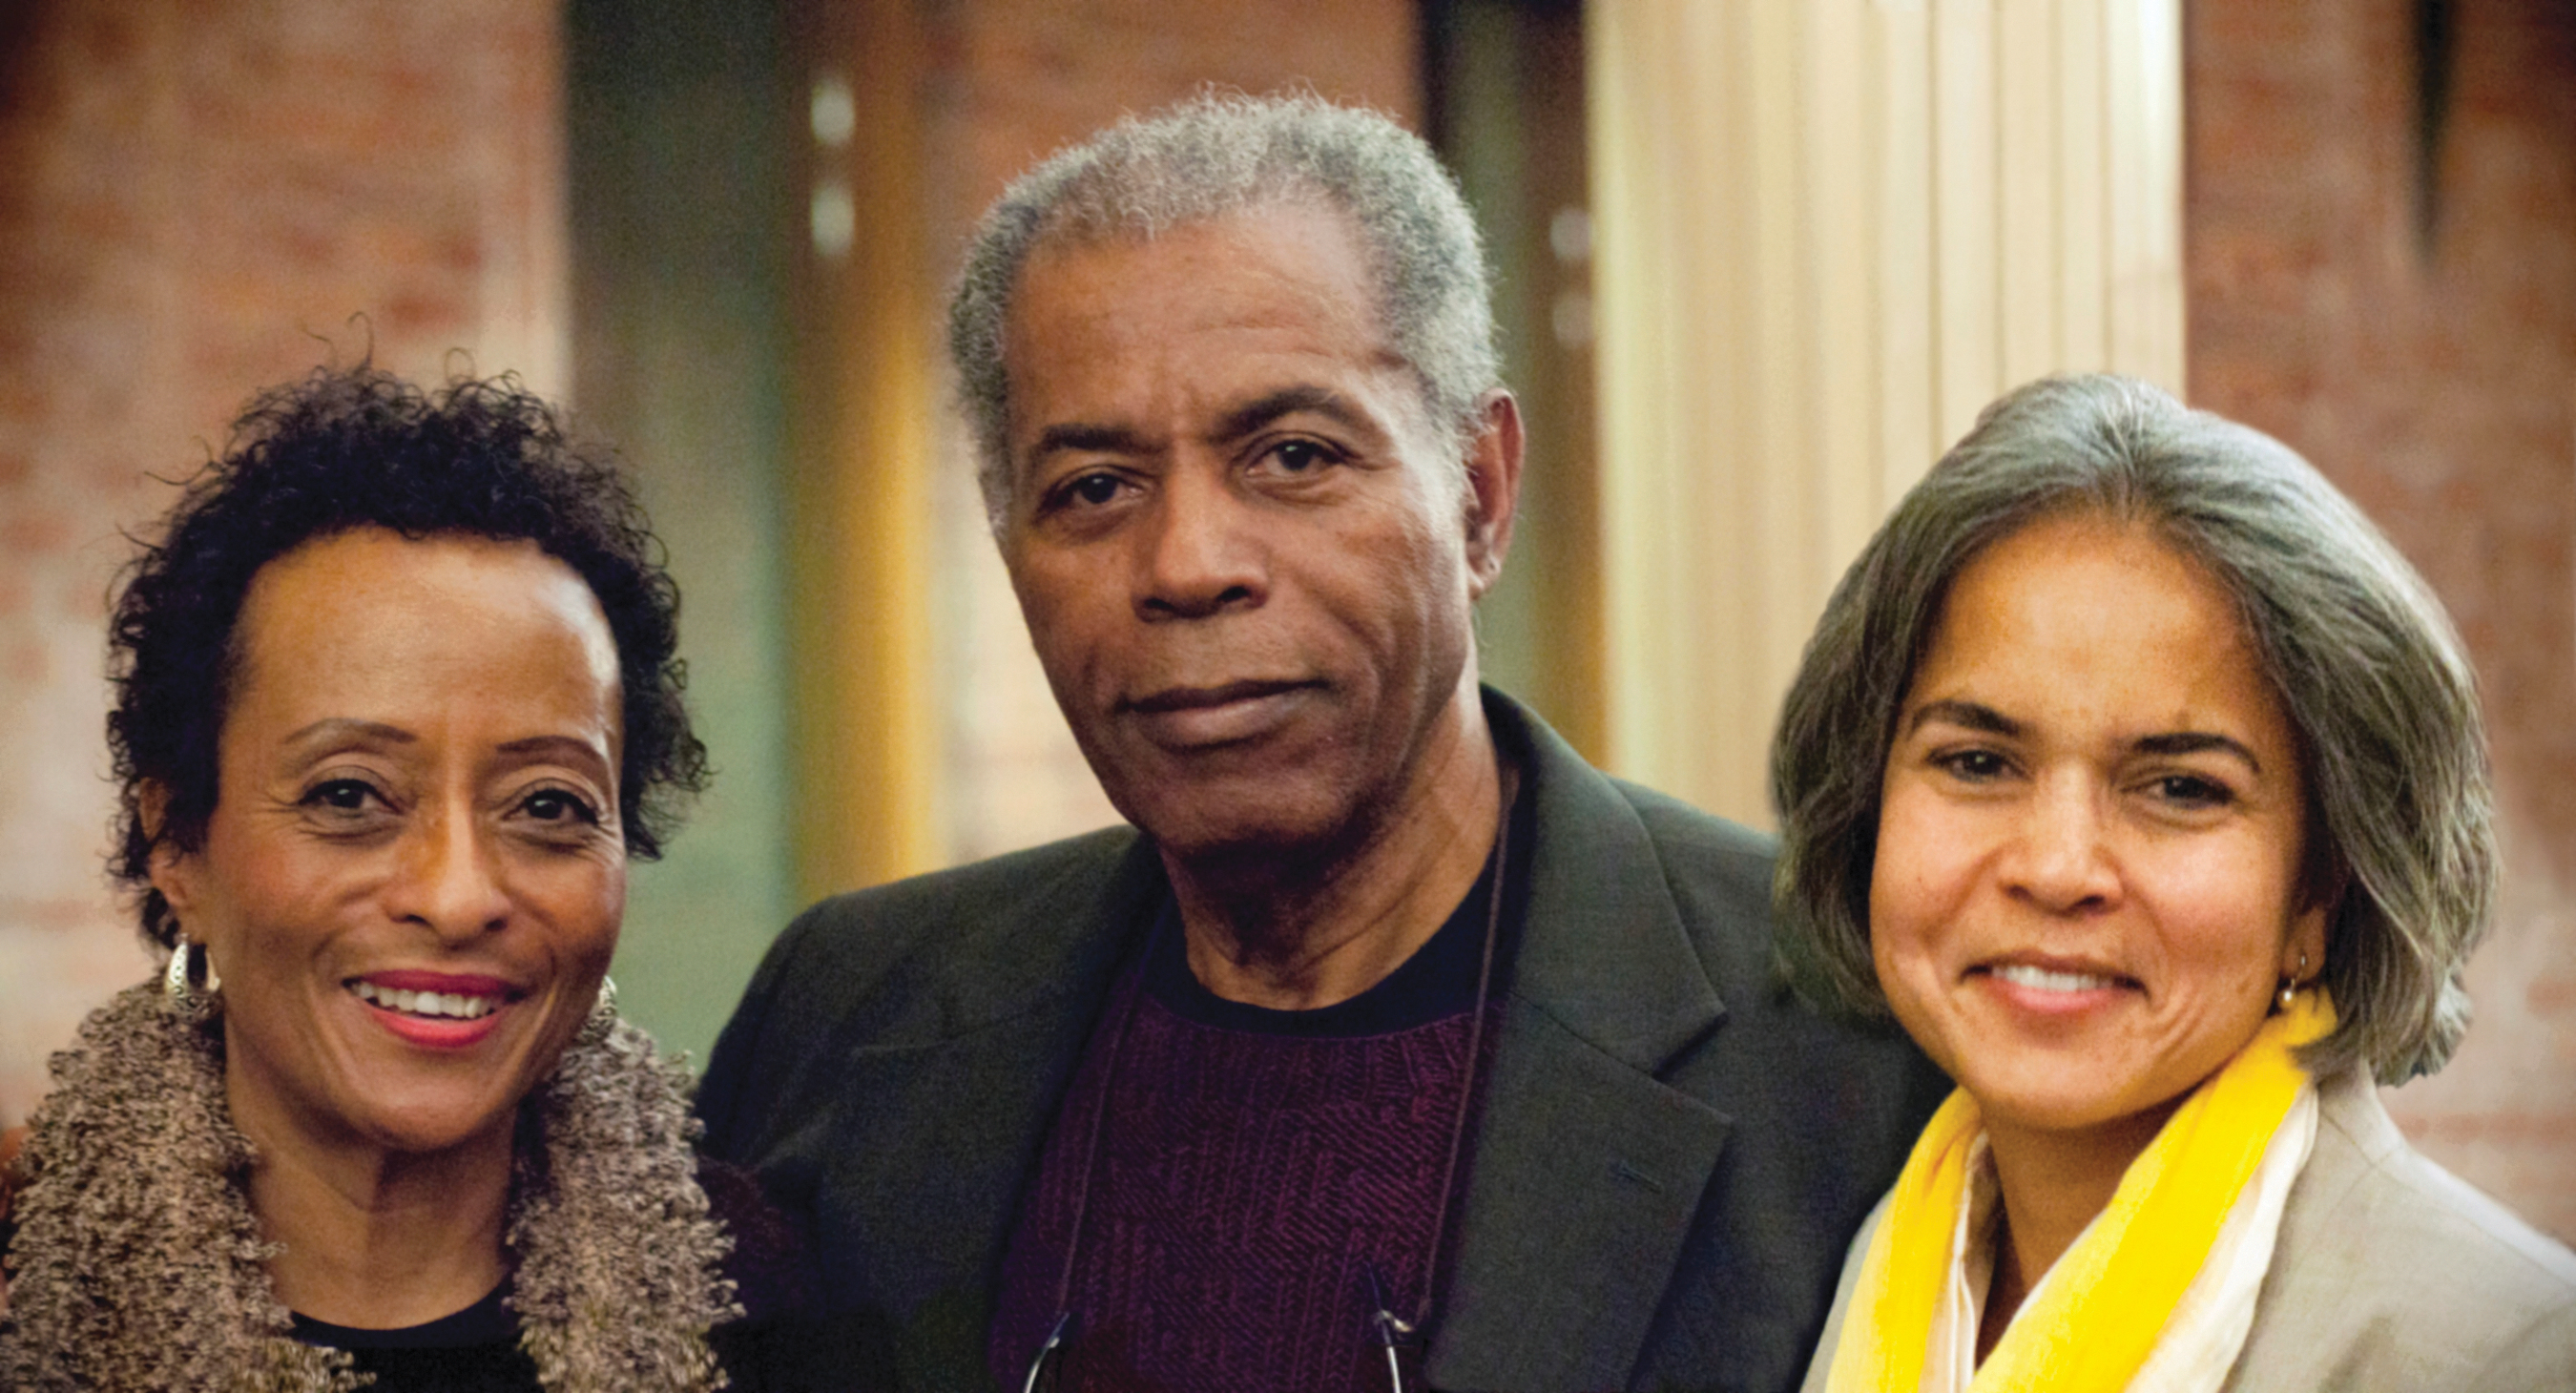
This photo, taken at the conference celebrating the work of Bunyan Bryant in 2012, hangs in my office and reminds me that good colleagues make all the difference. Photo credit: David Brenner.
CEHI was also pushed to think differently by powerful books written by Robert Putnam (Our Kids), Matthew Desmond (Evicted), and, very importantly, Richard Rothstein (The Color of Law). 15 Rothstein's book, in combination with all we had learned and continue to learn from the EJ community, put us on a path to characterize racial residential segregation at a highly resolved spatial scale. In ongoing work, again leveraging geospatial approaches, we are examining how segregation affects health and educational outcomes and how segregation has changed over time and geography in the United States for the past 25 years (see Fig. 6)—and how segregation in the past and continuing today relates to lead exposure in NC. We are also using geospatial approaches to show that the impact of environmental exposures may vary across geography as does the extent to which social and environmental stressors accumulate in the same places.
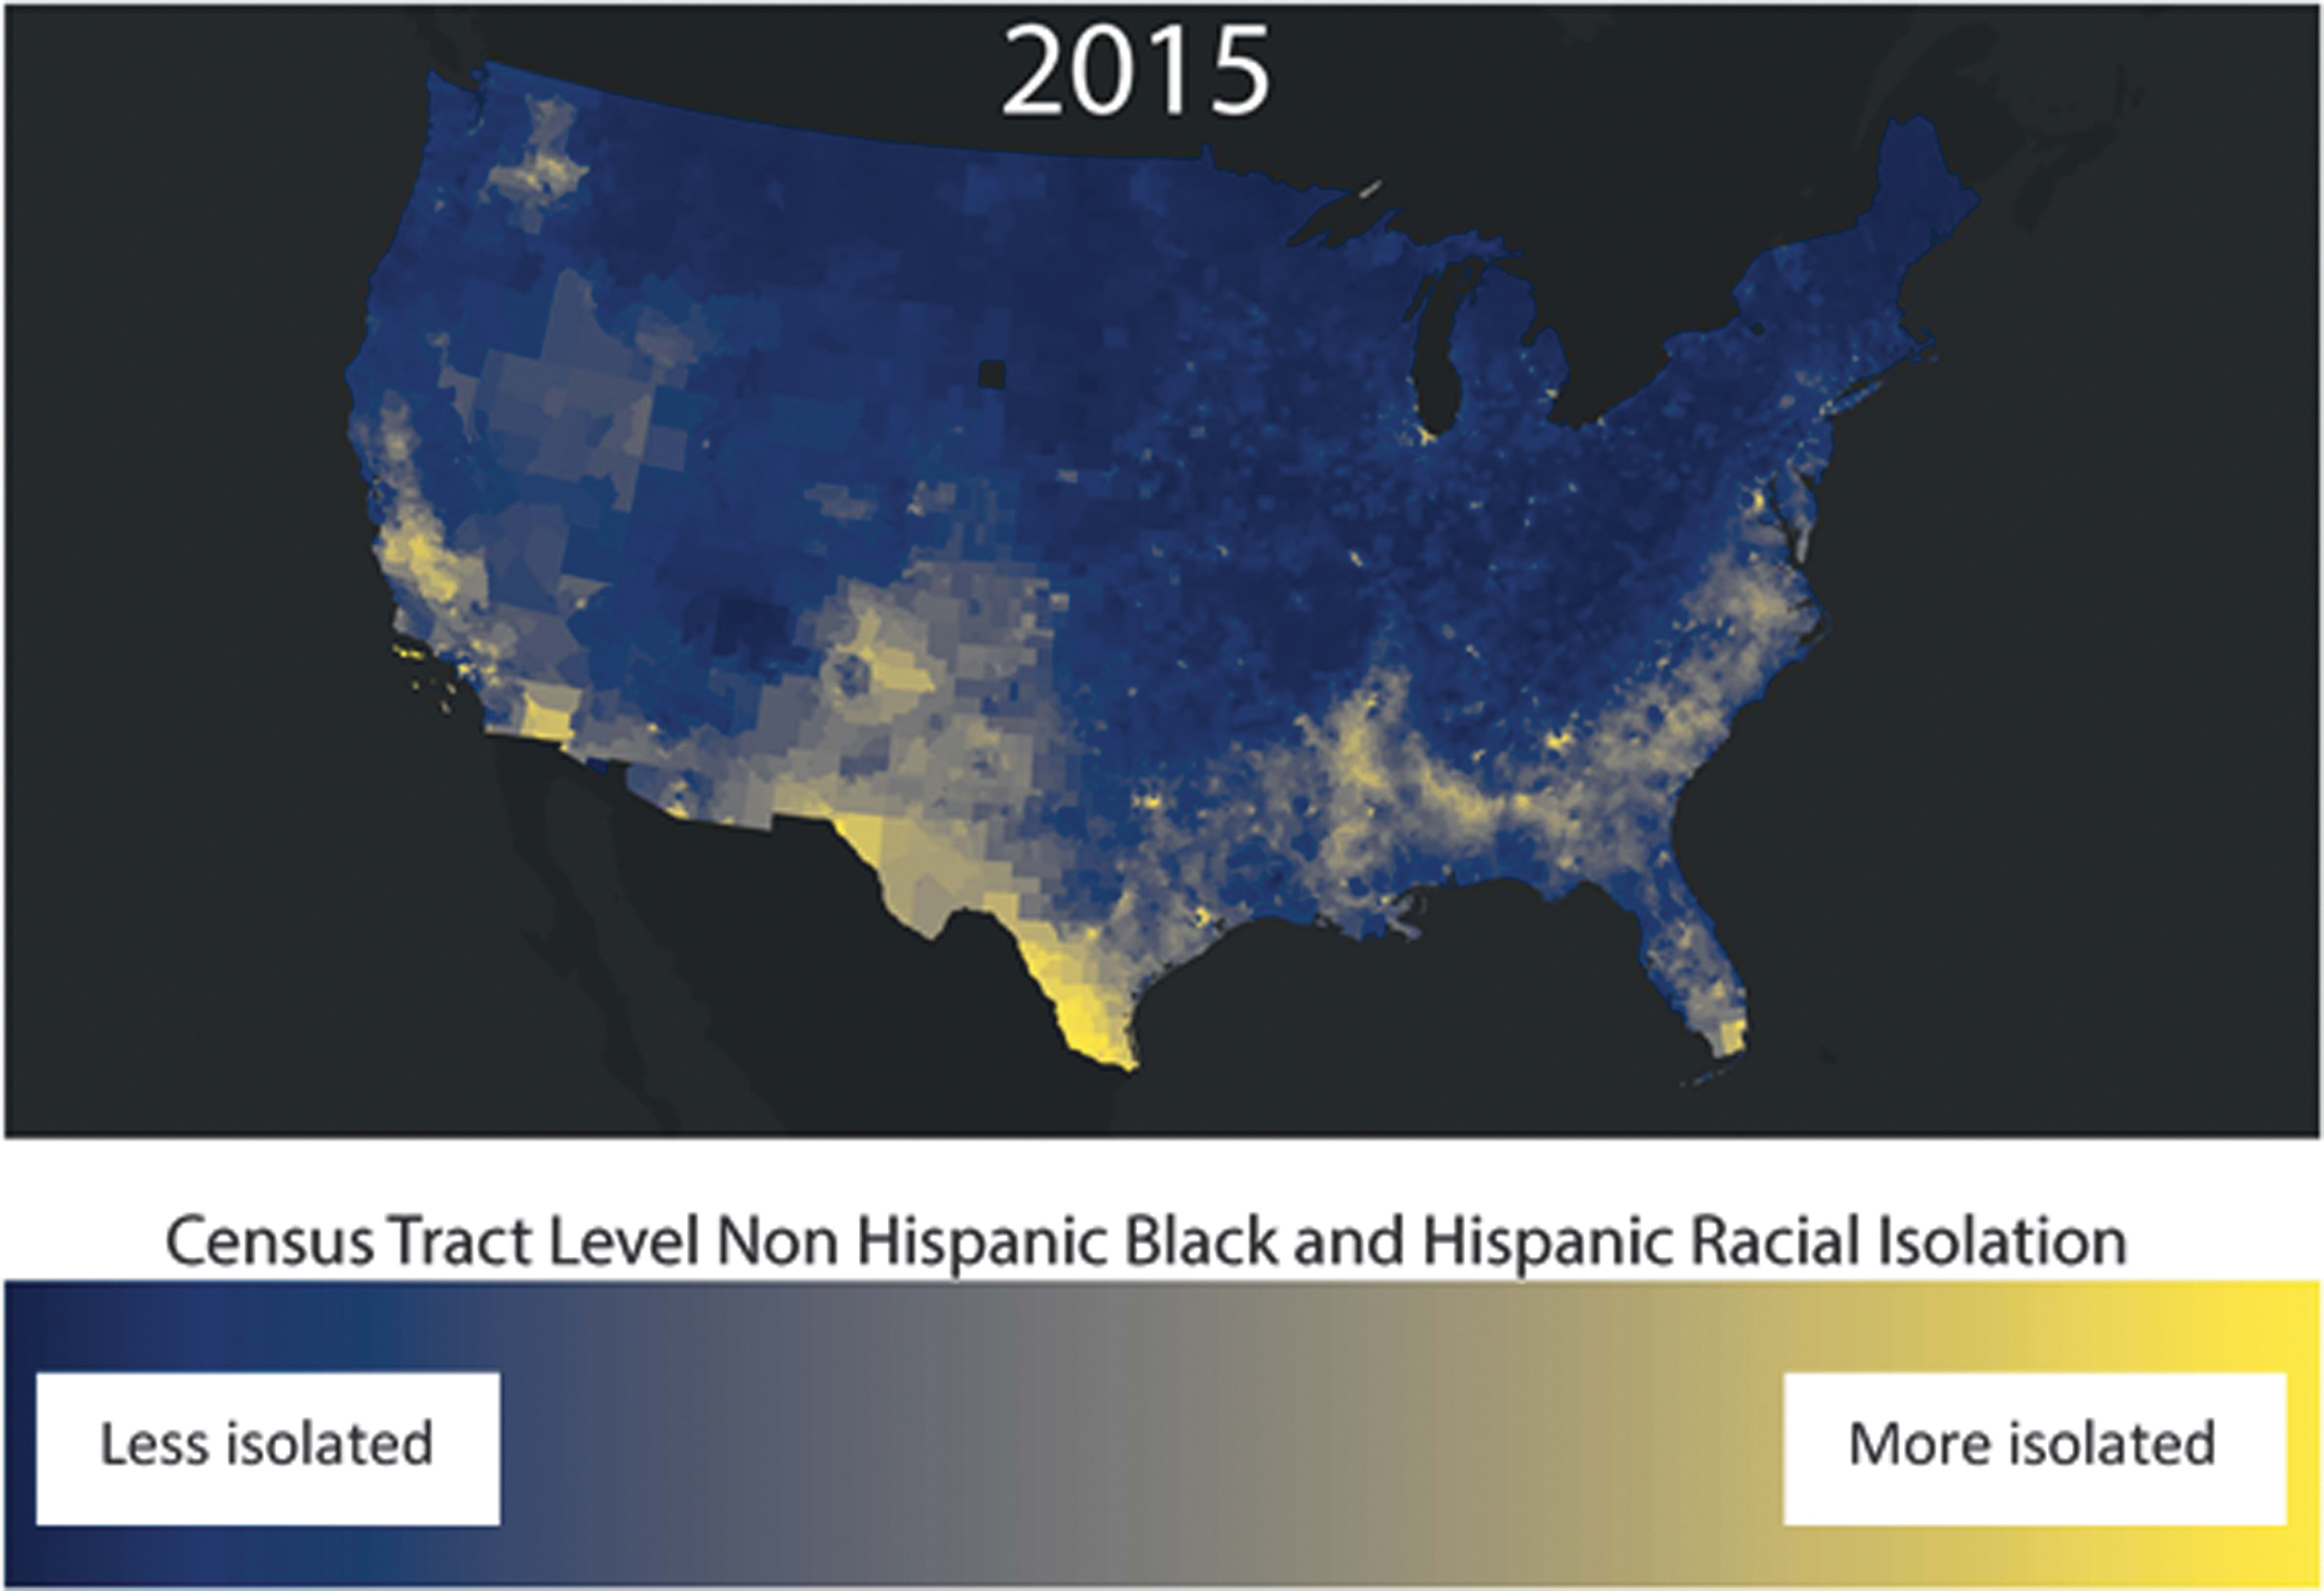
Map of RI, one dimension of racial residential segregation, across the United States in 2015. This map shows the extent to which Blacks and Hispanics live in neighborhoods separate from other race groups. Blue indicates low RI, and yellow indicates high RI. In forthcoming work, we show how RI relates to the accumulation of disamenities that are inimical to health. RI, racial isolation.
As a society, we face [at least] three existential problems: inequality, climate change, and erosion of democratic principles. In many ways, the EJ community's collective work tackles all three head on—a marker of both the importance and the courage of the community. I have spent my career learning from my sisters and brothers in the EJ community and trying to teach my students about their work. I have been discouraged by the magnitude and persistence of the problems, yet uplifted by the deep commitment of other scholars and community groups, and welcomed for (not despite) my love of mathematics. I am grateful on a daily basis that I found my way to EJ work.
Footnotes
AUTHOR'S CONTRIBUTIONS
Conceptualization and writing by M.L.M.
AUTHOR DISCLOSURE STATEMENT
No competing financial interests exist.
FUNDING INFORMATION
No funding was received for this article.